~ OAK RIDGE NATIONAL j LABORATORY LOEKWRRD I 1 1 3 5 7 MANAGED BY LOCKHEED MARTIN ENERGY SYSTEMS, INC. FOR THE UNITED STATES DEPARTMENT OF ENERGY ELECTRICAL DISTRIBUTION SYSTEMS ! March 199.6 UCN-13673 (33 SSS) ORNL-6887 HARMON IC ANALYSIS of
Transcript
~ OAK RIDGE NATIONAL
j LABORATORY
L O E K W R R D
I
1
1 3 5 7
MANAGED BY LOCKHEED MARTIN ENERGY SYSTEMS, INC. FOR THE UNITED STATES DEPARTMENT OF ENERGY
ELECTRICAL DISTRIBUTION SYSTEMS
!
March 199.6
UCN-13673 (33 SSS)
ORNL-6887
HARMON IC ANALYSIS
of
This report has been reproduced directly from the' best available copy.
Available to DOE and DOE contractors from the Office of Scientific and Techni- cal Information, P.O. Box 62, Oak Ridge, TN 37831; prices available from (615) 576-8401, FTS 626-8401.
Available to the public from the National Technical Information Service, U.S. Department of Commerce, 5285 Port Royal Rd., Springfield, VA 22161.
This report was prepared as an account of work sponsored by an agency of the United States Gokmment. Neither the United States Government nor any agency thereof, nor any of their employees, makes any warranty, express or implied, or assumes any legal liability or responsibility for the accuracy, corn pleteness, or usefulness of any information, apparatus, product, or process dis- closed, or represents that its use would not infringe privately owned rights. Reference herein to any specific commercial product, process, or service by trade name, trademark, manufacturer, or otherwise, does not necessarily consti- tute or imply its endorsement, recommendation, or favoring by the United States Government or any agency thereof. The views and opinions of authors expressed herein do not necessarily state or reflect those of the United States Government or any agency thereof.
ORNL-6887
COMPLETION REPORT
HARMONIC ANALYSIS OF ELECTRICAL DISTRIBUTION SYSTEMS
Leon M. Tolbert
Instrument and Electrical Engineering ORNL Science & Technology Support Department
March 1996
Prepared for United States Army Center for Public Works
Prepared by Central Engineering Services Oak Ridge National Laboratory Oak Ridge, Tennessee 378314334
Operated by Lockheed Martin Energy Systems, Inc.
for the U.S. Department of Energy
DISCLAIMER
Portions of this document may be illegible in electronic image products. Images are produced from the best available original document.
e
TABLE OF CONTENTS
... LIST OF FIGURES ................................................................................................................................. 111
LIST OF ABBREVIATIONS AND ACRONYMS ................................................................................... .iv
EXECUTIVE SUMMARY ........................................................................................................................ v
A AB AIM APLC AC BMI C CMPTRS DOE DSRD ELECTR G GND Hz E E E IS0 KHZ KVA L LD LN LMES MAG MCC MHZ NEC NEm ORNL. PC PRI PWh4 R RCPT RMS SEC THD TR TVSS USACPW V VFD VSD wo XFMR Z
Ampere (Amp) Allen Bradley Active Injection Mode Active Power Line Conditioner Alternating Current Basic Measurement Instruments Capacitor Computers Department of Energy Data Systems and Research Division Electronic Ground Ground Hertz Institute of Electrical and Electronics Engineers Isolation Kilo-Hertz Kilo-Volt-Ampere Inductor Load Line Lockheed Martin Energy Systems Magnetic Motor Control Center Mega-Hertz National Electrical Code Neutral Oak Ridge National Laboratory Personal Computer Primary (Transformer) Pulse Width Modulation Resistance Receptacle Root Mean Square Secondary flransformer) Total Harmonic Distortion Transformer Transient Voltage Surge Suppressor United States Army Center for Public Works Volt Variable Frequency Drive Variable Speed Drive Without Series Inductance Transformer Impedance
1
iv
EXECUTIVE SUMMARY
Harmonics is an issue that has only come to the forefront in general electrical distribution design in the last few years. The U.S. Army Center for Public Works has proposed a study to determine what devices are best for reducing or eliminating the effects of harmonics on power systems typical of those existing in their Command, Control, Communication and Intelligence (C3I) sites. Because electrical systems have been designed for linear voltage and current waveforms (i.e. nearly sinusoidal), non-linear loads can cause serious problems such as overheating conductors or transformers, capacitor failures, inadvertent circuit breaker tripping, or malfunction of electronic equipment.
This report discusses some of the background terminology and difference between rms and non-nns measurements as the groundwork for looking at harmonics in electrical distribution systems. Several different types of non-linear loads were encountered in the Oak Ridge Department of Energy facilities, and current and voltage waveforms typical of these loads have been compiled in the Appendices. Among the nonlinear loads studied are fluorescent lighting, variable frequency drives, switch mode power supplies, and unintermptible power supplies.
Five different commercially available devices were tested for their ability to provide clean voltage to nonlinear loads and to eliminate harmonic currents demanded by nonlinear loads. The tested devices were a GeoSine harmonic line conditioner by Georator Corporation, a shielded delta-wye isolation transformer, a SureSine active power line conditioner by Westinghouse, a Datawave magnetic synthesizer by Liebert, and an active injection mode filter by Helionetics. These devices were installed in existing DOE facilities that had substantial non-linear loads. These five devices were then compared in the following categories: cancellation of harmonic currents, supply of nondistorted voltage, supply of regulated voltage, elimination of transients and impulses, efficiency, reliability, and cost.
Several recommendations are made regarding the design of electrical distribution systems in the presence of nonlinear loads or supplying sensitive electronic devices. Most electrical systems were not designed to support the nonlinear devices that now make up a large percentage of the loads on today’s distribution systems. Future designs should follow the guidance given in IEEE 519, Recommended Practices and Requirements for Harmonic Control in Electrical Power Systems; IEEE 1100, Recommended Practice for Powering and Grounding Sensitive Electronic Equipment and FIPS 94, Requirements for Data Processing Centers. A list of the ten most important steps in designing, installing, or retrofitting an electrical system that will serve a large number of nonlinear or sensitive electronic equipment is also given.
V
COMPLETION REPORT HARMONIC ANALYSIS OF ELECTRICAL DISTRIBUTION SYSTEMS
U.S. ARMY CENTER FOR PUBLIC WORKS
INTRODUCTION
Harmonic currents have increased dramatically in electrical distribution systems in the last few y& due to the grkwth in non-linear loads found in most electronic devices. Because electrical systems have been designed for linear voltage and current waveforms (Le. nearly sinusoidal), non-linear loads can cause serious problems such as overheating conductors or transformers, capacitor failures, inadvertent circuit breaker tripping, or &nction of electronic equipment.
The US. Army Center for Public Works has proposed a study to determine what devices are best for reducing or eliminating the effects of harmonics on power systems typical of those existing in their Command, Control, Communication and Intelligence (C3I) sites.
BACKGROUND
Most electrical distribution systems have been designed for the purpose of supplying a linear (sinusoidal) load such as motors or resistive heating with a linear voltage supply. Sonlinear currents can originate from any of three causes: 1. nonsinusoidal generation of voltage 2. nonlinear devices used in the transportation of electrical energy 3. nonlinear load devices. The voltage waveforms generated by utilities and then stepped up to a transmission voltage level generally are very close to sinusoidal and have little distortion. Transmission lines, cables, and transformers are transportation devices which are quite linear in nature and cause little distortion to voltage or current waveforms. However, variable frequency drives which use electronic devices to rectify ac to dc and then invert back to ac are a nonlinear transport device. Several loads are nonlinear such as switch mode power supplies and fluorescent lighting ballasts.
Power Qualify Terminology
Through Fourier analysis, any nonsinusoidal periodic waveform can be represented as the sum of a dc component and sine waves of various amplitudes and phase displacement from some relative angle. The sine waves all have frequencies which are a multiple of some fundamental frequency, which in the United States is 60 Hz. The equation below represents how a voltage waveform V(t) could be represented as the sum of a dc component Voand sine waves with a hdamental frequency 01 (60 Hz).
N V(t) '= v, + Vk- sm(k.w t + Ok)
k = 1
A similar equation could be written for a current waveform I(t). Because these sine waves are all multiples of a fundamental frequency, they are called harmonics. The harmonic order is defined as the multiple of the fundamental. For example, a 180 Hz harmonic frequency wave on a 60 Hz source would be called the 3rd harmonic. To find the root-mean square ( R M S ) value of a current waveform where the amplitude of each of the harmonics is known, the equation below would be used.
1 -
1
One measure of the nonlinearity, or distortion, in a waveform is given by the equation below and called total harmonic distortion (TD). THD is the ratio of the RMS value of the total harmonic currents (nonfundamental part of the waveform) and the RMS value of the fundamental portion, 1, of the waveform. This value is usually expressed as a percentage of the fundamental current.
Two other measures of distortion are the crest factor and the form factor. The crest factor is the ratio of the peak of a waveform to its RMS value. For a l i n k sinusoidal waveform, the crest factor would be the square root of 2, or 1.414.
I P d 1,s
Crest-Factor := -
The form factor, or distortion factor, is the ratio of the RMS value of a waveform to the RMS of the waveform's fundamental value. For a linear sinusoidal waveform, the form factor would be 1.
IRMS
11 Form-Factor := -
Symmetrical components is a mathematical tool used to analyze power systems. Harmonic orders can be divided into positive, negative, and zero sequence components. Positive sequence components are the given phase order and include the following harmonic orders: 1st (fundamental), 4th, 7th, loth, etc. Negative sequence components are reverse phase order and include the following harmonic orders: 2nd, 5th, Sth, 1 lth, etc. Zero sequence components have all three components in phase and include the following harmonic orders: 3rd, 6th, 9th, 12th, etc. Positive and negative sequence components sum to zero in the neutraUground. Zero sequence components, however, sum in the neutral/ground. Because the zero sequence harmonics are divisible by 3, they are referred to as triplens.
RMS vs. Non-RMS Measurements
To determine where significant amounts of harmonic current existed in the electrical distribution systems at the three Department of Energy (DOE) Oak Ridge plants, a preliminary survey was done for several buildings at the Y-12 plant, K-25 plant, and Oak Ridge National Laboratory ( O W ) with true root-mean square (RMS) measurement meters and averaging meters (non-true W S measurement meters). Three measurements of voltage and current were taken at several panelboards in the DOE facilities: true RMS, average, and peak with a true-RMS meter. The averaging meters used consider& the fundamental portion of the waveform only and ignored harmonics. If the current or voltage had significant harmonic distortion present, the difference in the measurements between the two types of meters would be notable, and the crest factor would be on the order of 2 or 3 instead of close to 1.4 as would be the case for a perfectly sinusoidal wave. Figure 1 is a chart comparing the measured values for various waveforms using peak, averaging, and true-nns meters.
The preliminary measurements made at the Oak Ridge facilities along with calculated crest and distortion factors have been compiled in Appendix A.
2
Waveform Description
Sinewave
Triangle Wave
Sinewave with exponcn ti ally
damped impulsc
Pulsed Power
3-phase neutral harmonic
current
pulsed power with linear loa
Average - R M S Cal. - 100 A
- 100 A
100 A
100 A
- 100 A
100 A
- I00 A
Peak - RMS Cd.
100 A
64A
126 A
129 A
400A
156 A
201 A
True RMS - 100 A
- 90 A
103 A
100 A
199 A
. 115 A
120 A
Figure I . Comparison of conversion techniques for AC current measurements. All readings are normalized to read IO0 Amps on an average, converting, RMS calibrated meter - the most common type of meter,
3
IDENTIFICATION OF HARMONIC LOADS
Based upon the calculations taken'from the true-RMS, peak and averaging measurements, a few facilities that had high crest or distortion factors were chosen to have measurements made with a Basic Measuring Instruments @MI) PowerScope 8800. The PowerScope 8800 is an 8 channel power analyzer that can take simultaneous snapshots of the voltage and current waves to determine the spectrum and magnitude of harmonics in electrical distribution systems. Several different types of non-linear loads were encountered in the Oak Ridge Department of Energy facilities, and current and voltage waveforms typical of these loads have been compiled in Appendices B through E.
Fluorescent Lighting
Measurements were taken in Building 3 147, an ofice building at O N , at Lighting Panels B and D to get representative data samples for traditional magnetic fluorescent ballasts and T-12 lamps. These ballasts were then removed and replaced with new electronic ballasts and T-8 lamps. Waveforms, harmonic spectrum data, and two spreadsheets comparing these two types of ballasts appear in Appendix B.
Mametic Ballasts
Figure 2 depicts the phase voltage and current and the neutral current for Lighting Panel B in Building 3 147 which had a load of fluorescent lights with magnetic ballasts. The average total harmonic distortion (THD) for the phase currents in panels B and D for the magnetic ballasts was 13.9%, and the neutral currents averaged 141.3% THD. The harmonic spectrum consisted only of odd harmonics and ranged from the 3rd to 17th. However, individual harmonics for the 1 lth through the 17th were all less than 1% of the fundamental (60 Hz). The RMS - phase current averaged 37.2 amperes, and the neutral curre
- . . . . . . . . S 3 3 U [ . i ism
. . . . . . . . .
. . . . . . . . .
m
. . . . . . . .
. . . . . . . * * * * ' * ' -ism
PHC-NLITUOLTAGE - P W S C URREHT
3147 P R E L B 1(F Fu6 2 5 s 1994 9:34X17 5.8 n ~ u ~ s ~ c a ~ s m u ~ s ~ o ~ HORIZDNTR
Figure 3 depicts the phase voltage and current and the neutral current for Lighting Panel B in Building 3 147 after all of the fluorescent lights were converted to electronic ballasts with T-8 lamps. The electronic ballasts had an average phase current THD of 17.2%, and 85.3% THD for the neutral current. Unlike the magnetic ballasts, the electronic ballasts had individual harmonics at frequencies up to the 33rd harmonic (1980 Hz) which had magnitudes of between 2 and 3 percent of the fundamental. However, the electronic ballasts equipped with the T-8 lamps used much less power than their magnetic counterparts with T-12 lamps. The RMS phase current for the electronic ballasts averaged 13.8 amperes, a decrease of 62.9% from the magnetic ballasts. The RMS neutral current averaged 8.0 amperes, a 45.2% decrease.
Figure 3. Electronic ballast voltage and current waveforms. (a) Phase voltage and current. (b) Neutral current for a 3 phase, 4 wire system.
In summary, the electronic ballasts have the following attributes: 1. Total harmonic distortion comparable to magnetic ballasts 2. Wide frequency range of individual harmonic currents 3. Much lower power requirements than magnetic ballasts
5
Variable Frequency Drives
Snapshots of waveforms for variable frequency drives (VFDs) in Buildings 9113 and 9737 of the Y-12 plant appear in Appendix C. Sample waveforms for the voltage and current on the line and load side of the variable speed drive (VSD) in Building 9113 appear below in Figure 4.
Note that in Figure 4% that the variable speed drive draws two current pulses for each half cycle of the voltage waveform. This is typical of most variable speed drives which employ six pulse conversion to commutate the three phase line voltage to a DC voltage. Six pulse converters have two switches per phase, this accounts for the two current pulses during each half cycle of the voltage waveform as shown in Figure 4a
Also, this particular Allen-Bradley VSD uses a pulse width modulation (PWM) switching scheme in order to invert the voltage from its dc bus into a sinusoidal output. This variable speed drive supplied a voltage waveform that had 20 Vpeak-d of high frequency noise. The power analyzer snapshot in Figure 4b has captured this phenomenon for the voltage waveform only because the VSD surveyed had a sufficiently low switching frequency (only about 500 Hz). Most modem VSDs will have a switching frequency between 10 and 20 kHz, and most power analyzers would only capture the fimdamental of the voltage waveform because they sample only up to between 2
PWSER-BUOLTREE - PWSE a CUFSHT 5.0 MILLISECOHDS/DIUISIOH HORIZOHTFL
9113 RB US DR LORD J W 1 3 r 1994 10: 19148
Figure 4. Vuriablefrequency drive voltage and current waveforms. (a) Line voltuge and current. (b) Load voltage and current.
In Figure 5b on the next page, the voltage waveform for a Yaskawa Electric variable speed drive in 9737 is smooth on the output because the switching frequency is higher than the sampling frequency of the power analyzer as discussed earlier. However, this particular VSD did have a problem in its inverter which resulted in the distorted current waveform for Phase B. Another peculiarity of this particular VSD, was that the current pulses drawn on the line side of the device were in no means symmetrical or periodic as shown in Figure 5a; this is atypical of most VSDs.
6
~
ieeeu S00A . . . . . . . . .
. . . . . . . leaeu-' I ' " ' ' -38m
P t S E b l - B U O L T R 6 E - M S E R CURRENT 5.8 MILLISECWOS/DIUISION HORIZONTRL
9737 U S OR LINE JUN 14s 1994 10:?2:89 Rn
. . . . . . . .
. . . . . . . leeat' * * * -38ER
P H R S E B - C V a T A G E - PWSE B CURRENT 5.9 M I L L I S E ~ D S ~ I U I S I O N HORIMNTRL
9737 US OR LINE JUH 14s 1994 19:22:09 flH
l0wJ 380R . . . . . . . . .
eu 0R
. . . . . . . ieeeu-' * . 1 * -380R
9737 U S OR LINE JUN 14s 1994 ier22rw RPI
*
PHRSEC-RVaTFlCE - M S E c CURRENT 5.8 MILLISEEINOS/DIUISION HORIZONTRL
lW 28861 . . . . . . . . .
W
t " . . . . . . - 1
m
. . . . . . .
PWLSER-BWLTAGE - '--* ' ' ' ' *
5.8 MILLISECOWS~OIUISION HORIZOHTRL ie:is:% w 97S7 US OR LORD JUN 14s 1994
PWLSEB-CUOLTRX - P W L S E B a R R E M 5. 8 MILLISECONDS~OIUISION HORIZONTRL
9737 US OR LOAD JUN 14s 1994 19:15:54 w
1- 20m . . . . . . . . .
W Bc(
. . . . . . . -m
P H F E C d U o L T R g - P H F E C a R R E M , - ! ' ' * ' ' '
s.e MILLISECONDS/DIUISION HORIZONTRL 9737 US OR LOFY) JUN 140 1994 ierism w
Figure 5. Variable frequency drive voltage and current waveforms for each of the three phases. (a) Line voltage and current, (b) Load voltage and current.
7
Switch Mode Power Supplies
Snapshots of waveforms for switch mode power supplies appear in Appendix D. In Figure 6a below, the current waveform for a typical switch mode power supply found in personal computers, video displays, and printers is depicted. A switch mode power supply has a large capacitor in it (Figure 7) which maintains a near-constant voltage for the DC bus in the power supply, and the capacitor is charged (and draws current) only during the peak of the voltage waveform. When an electrical distribution panel has a large number of receptacle circuits that consist mostly of computer work stations, this same waveform can be seen on the panel's main phase conductors.
I
The neutral conductor will carry a large percentage of the phase current even under balanced load conditions. This is because switch mode power supplies draw a current which has a large percentage of triplen harmonics (3rd, 9th, 15th, etc.). Triplen harmonics are zero sequence harmonics which add in the neutral instead of canceling like positive sequence (1% 7th, 13th, etc.) and negative sequence harmonics (5th, llth, Hth, etc.). The sample waveform shown in Figure 6b indicates that the neutral current is mostly 180 Hz (3rd harmonic).
NM-CND uaincE - HEUT CURRENT 5.8 MIUISECaSS/DIUISIOH HORIZONTAL
1585 DRTFWRUE LORD OCT 3 9 1994 7:saie RM
Figure 6. Switch mode power supply voltage and current waveforms (a) Voltage and current for one phase of a three phase 120/208Vsystem. (b) Neutral current for a three phase 120/208Vsystem.
,
Figure 7. Ordinary switch mode power supply for personal computer circuit schematic.
8
Uninterruptible Power Supplies
Snapshots of waveforms for unintermptible power supplies (UPS’S) appear in Appendix E. Sample waveforms for the voltage and current on the line and load side of a UPS in Building 9710-3 appear below in Figure 8. Although an unintermptible power supply provides protection from loss of a voltage source, many on- line UPS’S demand current that has considerable harmonic content and/or supply a voltage to the load that has distortion.
The UPS for which the waveforms are shown in Figure 8 is rated for 37.5 kVA with a 480 V input and 120/208 V ouput. This particular UPS drew a line current that averaged 19.0% THD for the three phases and had an absence of triplen harmonics. The load current had a high crest factor (above 2.0) which cawed the flat-topping of the voltage output as shown in Figure 8(b). The voltage waveform for each of the three phases had distortion ranging from 8.0 to 16.8% THD. IEEE 5 19, Recommended Practices and Requirements for Harmonic Control in Electrical Power Systems7 states that voltage distortion should not exceed 5% at the end use load. Obviously, this UPS did not meet these requirements.
IeeBv 75a . . . . . . . . .
0R
-75a
. . . . . . .
p H F s E C - R ~ T t x € - PeFSECuRRaTT 5.0 MILLISECOWS/OIUISION HORIZOIITRL
’ - ! ’ ’ ’ ’ ‘ .
9710.3 UPS LINE JUH 3s 19% 8:47:n m
-100a
m
(b)
Figure 8. Uninterruptible power suppiy voltage and current waveforms. (a) Line voltage and current for one’ phase of a three phase system. (b) Load voltage and current for one phase of a three phase system.
9
EVALUATION OF HARMONIC MITIGATION DEVICES
Five different commercially available devices were tested to see what effect each one had on reducing the propagation of harmonic current drawn by a load to the rest of the electrical distribution system. The tested devices were a GeoSine harmonic line conditioner by Georator Corporation, a shielded delta-wye isolation transformer, a SureSine active power line conditioner by Westinghouse, a Datawave magnetic synthesizer by Liebert, and an active injection mode filter by Helionetics. These devices were installed in existing DOE facilities that had substantial non-linear loads.
Geosine by Georator Corporation
A three-phase, 208 V, 80 A GeoSine harmonic line conditioner built by Georator Corporation was temporarily installed in Building 1505 to supply power to two panels which provided power to receptacles in several offices as shown in Figure 9. Most of the receptacles fed power supplies in computers, video displays, and laser printers which drew a phase current which had a total harmonic distortion of between 75 and 100 percent. Waveforms, harmonic spectrum graphs, and data spreadsheets appear in Appendix F.
Geosine with Series Inductance
The installation of the GeoSine did not reduce the harmonic current on the line side of the device, and it actually reduced the RMS voltage on the load side (from 120 V to about 100 V) to the point that computers in several of the offices rebooted intermittently due to insufficient voltage. The series inductance in the Geosine . caused a voltage drop of approximately 15 percent in the unit. Figure 10 on the next page is the electric circuit schematic for the Geosine as well as nameplate information on the unit. The schematic reveals that the Geosine is not so much a "line conditioner" as it is a filter. Representatives of the company also said that Georator had corrected the voltage drop problems associated with the original unit and had called the new unit, Geosine 11. No attempts were made to procure a Geosine I1 and test it.
-
The Geosine did effectively filter out higher order harmonics. Those above the 15th (900 Hz) were completed shunted by the parallel filter, and those between the 7th and 15th were reduced considerably. The Geosine did not effectively filter the load current's third harmonic and acted as a partial "sink" to line side third harmonic currents. The following snapshots (Figure 11) illustrate the effect that the Geosine had on the electrical system and clearly show the reduced voltage (shown by the flat-topped voltage waveforms) caused by the series inductance in the unit.
-*
Geosine without Series Inductance
Because of the excessive voltage drop across the series inductance, this element was removed from the Geosine to see how well it performed as a parallel filter only. Without the line inductance in series with the parallel filter, no voltage drop problems were encountered. However, the parallel filter acted as a sink to higher order harmonic currents from the load and the line side of the filter as seen in Figure 14.
Figure 12 shows the impedance of the Geosine parallel filter (without the series inductance) to currents of various frequencies. It shows how the parallel filter has a high impedance to the fundamental (60 Hz) current and low impedance to the higher order harmonic currents. Figure 13 shows the impedance of the series inductance at various frequencies. This shows that the series element has a low impedance at the fundamental fiequency to let the 60 HZ current pass through but a relatively high impedance to the higher order harmonics.
10
PPD-2 LPD-1 600 A
.D 225 kVA 48OV-l20/208V
PPD-3 600 A
PPD-1 800 A
-
1 GEOSINE 1 80 A
4 BMI 8800 I
PP-5 100 A
Figure 9. One line diagram f o r measurement po in ts during t e s t o f GeoSine.
11
LINE
LINE
LINE
LINE
A 1.7 mH
r\ -
GEOSINE BY G E O R A T O R Series 102 GeoSine Harmonic Line Conditioner
208V/120 Three Phase Y 60 Hz Only
Model No. 102-6020-Y Serial No. 44862
Rated Current: 80 Amps Weight, LBS: 570
Horsepower: 20 HP Max. Amb. C: 50
Input Voltage: 208V/120 +/- 10% Volts Output Voltage: +/- 5% o f input with non-linear load
Patent Pending
Georator Corporation 9617 Center S t r e e t Manassas, Virginia 22110
(800) 523-9936
Figure 10. Circuit schema tic and nameplate informa tion f o r GeoSine.
12
L O A D
L O A D
L O A D
L O A D
359) 1Z.M . . . . . . . . . . . . . . . . . .
W ea
t . " . . . . .
SDJ isaa . . . . . . . . . . . . . . . . . .
. . . . . . . :miJ . . . . . = ! ! . P H B - H M U X T a - A(SE e CU(REIR-lJBa s.e MILLISE~OC~SIDIUISICN ~ I Z C H T R 15E¶ CEQSIHE L I E f U 2 21 1994 10: a: sq
SDJ ism . . . . . . . . .
W 8R
. . . . . . . - 1 S R
PHc+EvTUXTa - pHRSECcuIRD(T 5.0 MfLLfSEtOCrSIDIuIsICN m I m R
=!-I ' ' ' ' ' '
1585 CEQSIHE L I E MX3 2, 1994 10148159
- 1SW 359)
. . . . . . . . .
. . . . . . . . .
en W
359)
W ea
. . . . . . . . . i
359) isaa . . . . . . . . . . . . . . . . . . . .
W ea
t . . . . . . . .
IN isaa . . . . . . . . . . . . . . . . . .
Figure I I . Geosine load and line voltage and current waveforms. (a) Load side voltage and current for each phase and neutral, (6) Line side voltage and current for each phase and neutral.
13
350.00 T
300.00
250.00
200.00
150.00
100.00
50.00
0.00 c
9 0
c c
0 in b) b - c7
c c (u
* Harmonic Order (Multiple of 60 Ht)
Figure 12. The impedance of the parallelJlter portion of the Geosine with respect tojFequency.
25.00 - A
v)
E E 20.00 --
15.00 -- Q) 0
-0 a s 10.00 --
'9 0
(0 0 (0
Harmonic Order (Multiple of 60) Hertz
Figure 13. The impedance of the series inductance of the Geobine with respect tofiequency.
14
1°C - " . . . . . . . . . " - " 1 s87
W m
!Em . . . . . . . . .
W m
. . . . . . . . . 2JBv
W m
2 . . . . . . . .
l w Sl/ . . . . . . . . . . . . . . . . . .
. . . . . . . .
. . . . . . . . . * 1 I m W
I
~~
3391 1- . . . . . . . . . . . . . . . . . . . .
w a
. . . . . . . . .
w m
t . . . . . . . .
Figure 14. Geosine without series inductance load and line voltage and current waveforms. (a) Line side voltage and current for each phase and neutral. (b) Load side voltage and current.
15
Delfa- Wye Transformers
All two winding transformers may be called isolation transformers because the primary and secondary of the transformer are coupled magnetically instead of by a directly wired connection such as in an autotransformer. Delta-wye transformers (primary delta, secondary wye) are an effective means of reducing zero sequence harmonic currents from the secondary to the primary side of the transformer because the triplen harmonics circulate in the delta (primary side) of the transformer and do not show up on the line side of the transformer. Eliminating these triplen harmonics can many times reduce the current THD by as much as 50 %.
Placing a copper shield between the primary and secondary of a two winding transformer can also help to prevent common mode noise from being transferred from the secondary to the primary and vice versa. Common mode noise is noise that appears equally and in phase from each current-canying conductor to ground. Two different transformers were tested for their ability to reduce harmonic current from the secondary of the transformer to the primary.
Twical building distribution transformer
One transformer tested was a dry type distribution transformer located in Building 1505 at ORNL. This 225 kVA, 480 - 120/208 transformer had a nameplate impedance of 4.21% and fed an 800 A distribution panel which fed a dozen other panels responsible for the primary electrical distribution to the offices in the building. Measurements were made at the primary and secondary of the transformer as depicted in Figure 15. A complete set of the waveforms and harmonic spectrum graphs are found in Appendix G along with a spreadsheet comparing the harmonics on the primary and secondary side of the transformer. In Figure 16, waveforms and harmonic spectrum data from one phase of the primary and secondary of the trhsformer are shown. Note that in Figure 16% the line- neutral voltage and line current are shown; and in Figure 16b the line-line voltage and line current are shown.
For the transformer depicted in Figure 15, the current THD was reduced by approximately 50% from the secondary side of the transformer to primary side because of the near-elimination of the triplen harmonics. The 3rd harmonic on the secondary side of the transformer had a magnitude of 5 1.8% of the fundamental. The 3rd harmonic on the primary side of the transformer had a magnitude of only 4.8% of the fundamental. All other triplen harmonics (9th, 15th, 21st, etc.) on the primary side of the transformer had magnitudes less than 1% of the fundamental.
Shielded. Delta-Wve Isolation Transformer
A new Square D 30 kVA, 208 V - 120/208 V, shielded, delta-wye transformer was also procured and tested for its ability to reduce current harmonics. The transformer was connected to the existing distribution system as shown in Figure 17. The transformer was tested with its secondary neutral bonded to ground and with it not bonded (floating). Waveforms and harmonic spectrum data for the above two situations are shown in Appendix G along with spreadsheets tabulating harmonic data.
Results of this shielded transformer did not differ much from the larger non-shielded building transformer. The current third harmonic was reduced by approximately 90 percent from the secondary (load) side of the transformer to the primary (line) side of the transformer due to the delta-wye transformation. The ninth harmonic was also considerably reduced from the secondary of the transformer to the primary. The other harmonics did not differ greatly from the secondary side of the transformer to the primary side. The current's total harmonic distortion was reduced by approximately 50 percent because of the nearelimination of triplen harmonics.
With the secondary neutral and ground bonded, the transformer was slightly more effective at reducing harmonics than without the bond. Without this bond, the neutral developed about a 20 V rms difference between it and the ground. The National Electrical Code requires that the two be bonded because the secondary of the transformer is a separately derived system. Neutral current and voltage waveforms for the bonded and not bonded case are shown in Figure 18.
16
LPD-1 600 A
225 kVA 480 V - 120/208V
D A
PPD-1 800 A
PPD-3 600 A
Figure 15. d i s t r i b u t i o n d e l t a -wye t r a n s f o r m e r .
Une line diagram indicating measurement p o i n t s o f building
17
. . . . . . . . . . .
. . . . . . . . . . .
. . . . . . . . . . . . . -SEW
p H l w € U T u Q T R g - M R c U m E H l - - -* ' . * " ' 5.0 MIUISECONDS/DIUISION HORIZONTRL
158s PPDl W I N w 4 r 1993 1:25:39 PM
1S85 PPDl MRIN N w 4, 1995 PHRSE a CURRENT SPECTRUM 1825859.92 PM Fundamental frewencv: 60.0 Hz
gine Sine Harmonic Parcent has. Harmonic Percent Phase
1SBS WI(R 16 PRI Hou 4r 1993 - PHRSE R aJRREHT SPECTRW 1:43:26.82 PN Fundamental fraiuancv8 60.0 Hs
S i ne Sine Harmnlc Percent Phum Harmonic Percent ma=
Thdl 30.1%
Figure 16. Delta-wye transformer primary and secondary voltage and current waveforms and harmonic spectrum for the current. (a) Secondary side line-neutral voltage and line current for one phase. (b) Primary side line-line voltage and line current for one phase.
Another device tested was the SureSine active power line conditioner (APLC) manufactured by Westinghouse. The SureSine attempts to compensate for harmonic currents by drawing current equal in magnitude but opposite in phase for harmonic currents. Two different test cases were studied with SureSines. One was a single phase load; the other was a three phase load where three single phase Suresines were connected in a wye- wye arrangement to supply the load.
Sinale Phase Test Case
A 120 V, single phase, 5 kVA SureSine active power line conditioner was tested at Building K-73 1 at the K-25 plant in Oak Ridge, Tennessee, for its ability to reduce the harmonic content of current and supply a nondistorted 120 V source to the load.
The SureSine was plugged into a 120V single-phase receptacle which was connected to the normal building power supply for Building K-73 1. Plugged into the output of the Sure-Sine were two personal computers, two video displays, and two laser printers. A BMI 8800 Powerscope with a harmonics measurement option installed was used to measure the voltage and current and to calculate the harmonic spectrum of these waves at both the output and input of the Suresine. The harmonic contents of these two waves were also measured with the Sure-Sine bypassed (i.e. no power line conditioning).
With no power line conditioning, the voltage and current waves captured on the Powerscope are as shown in Appendix H. The harmonic spectrum and a table of the harmonic content for the voltage and current are shown in Appendix H also. The measured voltage was 124.4 Vrms, and the measured current was 3.68 Arms.
The total harmonic distortion of the voltage wave was 2.7 percent, with the major component of the distortion the fifth harmonic with a magnitude that was 2.4 percent of the fundamental. All of the distortion of the voltage wave was from odd multiples of 60 Hz as expected. The total harmonic distortion of the current wave was 112.3 percent. The third harmonic was 83.5 percent of the magnitude of the fundamental, the fifth 61.4 percent, the seventh 38.3 percent, and the ninth 17.7 percent. All of the remaining higher order harmonics were less than 6 percent of the magnitude of the fundamental. Again, the wave was composed predominantly of odd multiples of 60 Hz, with the even harmonic component only 0.6 percent of the fundamental.
Figure 19. The voltage and current waveforms on the input and output of a single phase 5 kVA SureSine APLC. (a) Input (line) side of SureSine. e) Output (load) side of SureSine
21
With the SureSine in series with the test load, the output (or load side) voltage and current waves of the APLC (depicted in Figure 19 (b) ) looked much the same as when it was in the bypass mode. For the SureSine output, the total harmonic distortion of the voltage wave was 0 percent; the SureSine was providing a perfect 60 Hz sine wave of voltage to the load. The total harmonic distortion of the current was 118.4 percent. The third harmonic was 86.0 percent of the magnitude of the fundamental, the fifth was 65.0 percent the seventh 41.8 percent, the ninth 21.5 percent, and the eleventh 9.4 percent.
The current wave on the input (or line side) of the Sure-Sine was much closer to that of a sine wave at 60 Hz as shown in Figure 19 (a). The current wave had a total harmonic distortion of only 6.3 percent. The magnitude of the third harmonic was 3.8 percent of the fundamental, the fifth harmonic 3.7 percent, and the seventh 3.1 percent. All of the remaining higher order harmonics were less than 0.5 percent of the magnitude of the fundamental. The contribution by even multiple harmonics was slightly higher with the SureSine in the circuit at 1.2 percent.
The measured voltage was 119.8 Vrms, and the measured current was 6.42 Arms. The voltage was about 5 volts lower (4 percent less) than without the APLC. This is because the SureSine provides a regulated voltage of 120 V f 1 V. From the waveforms above, one can see that Westinghouse uses a method of "filling in" a 60 Hz sine wave by having the SureSine module draw current during the intends when the load is not drawing current. This reduces the crest factor of the load considerably.
Three Suresines in a Wve-Wve Confimration I
Also tested were three 5 kVA single phase Suresines wired in a wye-wye confguration as shown in Figure 20. These were tested for their ability to provide a regulated 120 V output with a reduced supply voltage. In addition, they were also connected to a load that had substantial harmonic currents to test their ability to reduce harmonic currents:
The wye-wye configuration of Suresines was connected to a variable voltage supply in Building 2018 at O m . The SureSines supplied single phase resistive loads. The units were able to produce a regulated, distortion- free voltage output for an input voltage reduced to less than half of a nominal 120 V. This meets the manufacturer's specifications that the unit produce a 120 V output for an incoming line voltage reduced to 60 V.
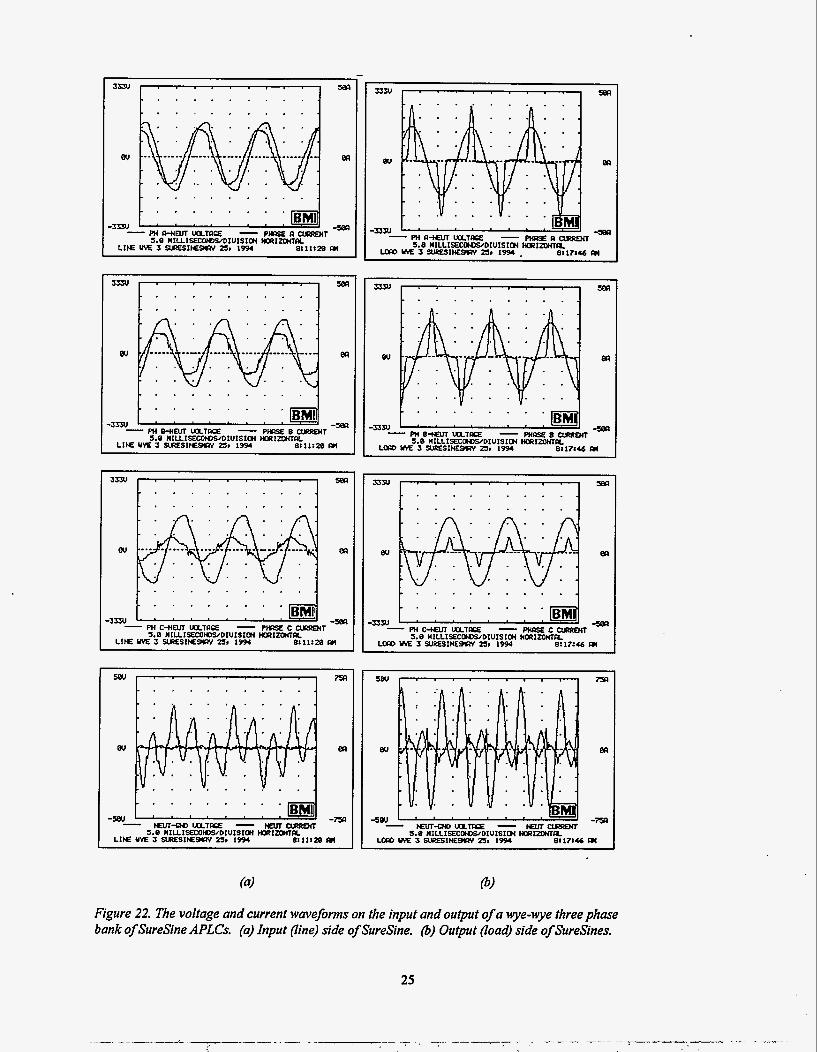
The wye-wye configuration was connected to supply the Same harmonic load bank in Building 1505 to which the Geosine and isolation transformer were connected as shown in Figure 21. Waveforms for the line and load side voltage and current are shown in Figure 22.
The units were able to reduce the current THD in-the three phase currents from 100 percent THD to less than 10 percent THD. In addition, RMS neutral current was reduced by approximately 25 percent from the load side of the SureSine bank to the line side. A three phase SureSine unit would probably further reduce neutral current on the line side of the unit. The units provided a distortion-free voltage (THD 0.0%) that varies by less than *i Volt around a nominal voltage value of 120 V during the two months of continuous testing.
Failure of One SureSine Unit
One of the three single phase Westinghouse SureSine active power line conditioners had a component failure that resulted in its inability to regulate voltage or to compensate for a harmonic current load. The three units had been in continuous operation in a wye-wye configuration for about two months prior to this failure. This failure was documented with a power quality analyzer that was monitoring the Suresines at the time. Waveforms from the Suresines at the time of the failure appear in Appendix H. Westinghouse design engineers believe that from the waveforms transmitted to them that failure of one of the series elements occurred. The problem was not field repairable, &d the unit was shipped to Westinghouse for repair under warranty.
22
INPUT 120/208V 3@ 4 W
CO N GR A 0 B@
4)
L N G L N G l@ l@
APLC APLC
A 0 B 0 CO N GR OUTPUT
12.3/298V 30 4 W
Figure 20. Electrical connection diagram for we-wye conjguration of three single phase Suresinex
23
PPD-2 LPD-1 600 A
225 kVA 480V-l20/208V
D
T 4n21'
PPD-3 600 A
Three 5 kVA SURESINES in wye-wye
100 A I 6.; PP-5 .
Figure 21. of wye-wye bank of SureSines.
Une line diagram indicating measurement po in ts fo r t es t i ng
24
-- 1-7 i . . . ,,, .. .,L. ..- ,, , , I. ,
. . . . . . . . . . .
. . . . . . . . . . .
W ea
. . . . . . . . . .
. . . . . . . .
. . . . . . . . . . .
. . . . . . . .
3341 JBcl . . . . . . . . . . . . . . . . . .
ea
. . . . . . .
. . . . . . . PH B - H M UXTPCE - PlQsE B aXl l lMT S.0 MIUIsEtoNDS/DIUISID WRlZCMllc
LIE Y K 3 siR€SIMO(*/ 2 3 s 1994 8t11128 la
3341 Ya . . . . . . . . . . . . . . . . . .
m
W ea
. . . . . . . -M
tar l -oL)UQlFIsE - N L n w S.O MILLlSE~HK/DIUISIM KUIZCMW
LIE Y K 3 S U Z E S I M ~ zs, 1994 8111128 la
. . . . . . . . 5BR
. . . . . . . . .
. . . . . . . . .
m
W
" W !
Lmc
- 7 s
ffl
Figure 22. The voltage and current waveforms on the input and output of a wye-wye three phase bank of SureSine APLCs. (a) Input (line) side of Suresine. (b) Output (load) side of SureSines.
25
Liebert Datawave
Another device tested was a Liebert Datawave magnetic synthesizer. The block diagram for one is shown in Figure 23 below. The Datawave generates an output voltage waveform by combining pulses from six interconnected saturating pulse transformers much like a step wave inverter but without any switching. The energy oscillates between the main capacitor banks and the pulse transformers’ cores. This ferroresonance ensures that the transformers’ cores saturate and produce the desired voltage pulse. Pulses of digerent magnitudes are combined to produce an output waveform that has approximately 4% THD and is independent of the input voltage distortion.
The input waveform drawn by the Datawave is a function of the way the synthesizing network demands energy from the supply rather than as a function of the load current waveform. This keeps the Datawave’s input current distortion to less than 8% THD regardless of the load current distortion or phase unbalance. The Datawave was originally designed as a regulated power supply for computer centers instead of an active power conditioner because it provides isolation from the input voltage source and can regulate the output voltage to within 5% of a nominal value with up to a 40% deviation in the magnitude of the source voltage.
A Liebert Datawave magnetic synthesizer was connected to an existing electrical distribution system as shown in Figure 24 and tested for its ability to reduce harmonic currents drawn by nonlinear loads. The unit tested was rated at 30 kVA and had a 480 V 3-wire input and 120/208 V output. It was put into continuous operation for six weeks in Building 1505 at ORNL.
Figure 25 depicts snapshots of current and voltage waveforms from the line and load side of the Datawave. Current THD was reduced by over 90% from the load side of the Patawave to the line side. No harmonic currents were found on the line side for frequencies above 720 Hz even though the load had harmonic currents through 1740 Hz. A complete set of waveforms, harmonic spectrum data, and a spreadsheet tabulating harmonic information are found in Appendix I.
Figure 23. Block diagram of the major components in a Liebert Datawave magnetic synthesizer.
:I
Figure
LLul 13.8 k V / 4 8 0 V 1500 k V A T
)1600 A
SWITCHGEAR 'A' 1
B U I L D I N G 1505 T >700 A !)350 A . )250 A
MCC #1 CHILLER 0 CHILLER
CEA B U I L D I N G
MOTOR CONTROL CENTER NO. 2 I
D A T A W A V E 30 k V A 480V - 120/208V
B M I 8 8 0 0
2 4 . One line d iagram of measurement p o i n t s f o r D a t a w a v e t e s t s
27
- 2zau 75n
. . . . . . . . .
eu en
750 . . . . . . . . .
-7%
. . . . . . . ~ B - H U T V O L T ~ - M B W ' - ! ' . . . * . * 5.0 MIUISECUNDSQIUISICN HORIZWTIL
1585 WTFu3x Lono SEP 38. 1994 2:%:56 m
=! 75R . . . . . . . . .
12U 7% . . . . . . . . . . . . . . . . . .
- 1- 585) . . . . . . . . .
m e4
1- s a . . . . . . . . .
W m
leeeV JeR , . . . . . . . . .
Figure 25. The voltage and current waveforms on the input and output of a Liebert Datawave magnetic synthesizer. (a) 120/208 Voutput (load) side of Datawave. (b) 480 Vinput (line) side ofDatawave.
28
Active Injection Mode Filter
The Helionetics Active Injection Mode Filter is connected in parallel with a harmonics load; this differed from all of the other equipment tested in that they were series devices. The AIM Filter switches in varying amounts of current to cancel the harmonic currents demanded by a nonlinear load. It uses clamp-on current transformers on two of the three phases of a nonlinear load to measure the amplitude and phase angle of each harmonic and then fires a pulse of current of equal amplitude and opposite phase angle. AIM Filter specifications state that the filter reduces current THD to less than 5% on the line side of where the filter is connected.
An AIM filter was connected to an existing electrical distribution system in Building 9210 at the Y-12 plant as shown in Figure 27. Measurements were taken with the BMI Powerscope at the locations identified in the one line diagram. The filter was rated to compensate for a 100 A harmonic current load at 480 V. Figure 26 below shows how the AIM filter injected currents at a leading phase angle to compensate for the lagging phase angle of the motor loads. This reactive power pumped into the system. helped to correct the power factor to close to unity. Turning on the AIM filter reduced the current drawn by MCC E5 from approximately 190 amperes to about 165 amperes because of the power factor correction. Power factor correction reduces the RMS amperes that a feeder must cany, and thus allows the feeder to have some additional load placed on it. Because of strategic planning difficulties with facilities, the AIM filter was not tested on a harmonics rich load.
One major drawback of the AIM Filter was that it injected between 10 V and 20 V of high frequency noise (voltages at a frequency greater than 2 kJXZ) onto the phase conductors because of the PWM used in the filter.
The AIM Filter did not act as a "sink" for harmonic currents like the Geosine passive filter because it did not draw harmonic currents from the source. Current and voltage waveforms for the AIM filter are tabulated in Appendix J.
. . . . . . . . . 11- c ' ' ' ' ' ' ' ' ' 1 W m
. . . . . . . -I=
PHRSE R-B UOLTRCE - PHRSE R CURRENT S.O MILLISECONDS~DIUISION HORIZONTRL
POP1 HRIN RIM OFF JU. 241 1995 ieresris #I
1- I= . . . . . . . . .
. . . . . . . -I=
, PHRSE 17 CURRENT I - - ' PHRSE R-B ' WLTRW " " -
5.0 MILLI~CW9DIUISION HORIZONTRL POP1 M I N AIM ON JU. 241 1995 10: 19: 15 Iw
Figure 26. The voltage and current waveformsfor a load without the AIMfilter and with the AIMfilter. :I) Current lags voltage with AIMfilter turned 08 (b) Current in phase with voltage with AIMfdter turned on.
29
LLul 13.8 k V / 4 8 0 V 1000 k V A T
t
ONTROL C E N T E R S
MOTOR CONTROL CENTER "E5"
200 A
PDP-1
B M I 8800
100 A
A I M F I L T E R
Figure 27. One line diagram o f measurement points f o r AIM f i l ter tests.
Five different commercially available devices were tested for their ability to provide clean voltage to nonlinear loads and to eliminate harmonic currents demanded by nonlinear loads: Geosine harmonic conditioner, delta-wye shielded isolation transformer, Westinghouse SureSine APLC, Datawave magnetic synthesizer, and an Active Injection Mode filter by Helionetics. The Geosine by Georator Corporation did not perform well and actually degraded the harmonic conditions for the electrical system to which it was connected. For this reason, it is not considered in the following discussion comparing the power quality improvement units that were tested. A chart appears at the end of the conclusion discussion which summarizes the performance of these power quality improvement units for seven categories: cancellation of harmonic currents, supply of nondistorted voltage, supply of regulated voltage, elimination of transients and impulses, efficiency, reliability, and cost.
Cancellation of Harmonic Currents
The Datawave magnetic synthesizer performed best in near elimination of harmonic currents drawn by a ,
load. The saturating transformers in the unit drew a balanced current that had less than 5% THD while supplying a load that demanded a current with near 100% THD. Because the input to the unit was 480 V three phase without a neutral, the neutral current from the load was also canceled. The three single-phase Suresines connected in a wye- wye fashion came in a close second by canceling the harmonic current to the point that the configuration drew a load current with only 6% THD. However, because the configuration was wye-wye, the neutral current was only reduced by about 33% and not totally eliminated. It is recommended that for three-phase applications, a three- phase SureSine unit be used because it would eliminate the neutral current much like the Datawave.
.
Although the AIM filter was not tested on a harmonic rich load, literature supplied by the vendor indicates that it too would inject canceling currents and reduce harmonic distortion on the line side of the unit to less than 10%. The delta-wye isolation transformer is not an active device, but it inherently reduces the triplen harmonics (3rd, 9th, 15th, etc.). For electrical distribution systems that have a substantial number of single phase harmonic producing loads, a delta-wye transformer may reduce THD by approximately 50%. Because most three phase harmonic loads do not generate triplen harmonics (3rd, 9th, 15th, etc.), a delta-wye transformer would be of little value in these cases.
Supply of a Nondistorted Voltage Waveform
The Westinghouse SureSine supplied a voltage waveform that was essentially distortion free (THD equal to zero). It also did not inject any high frequency noise into the electrical system. The Liebert Datawave supplied a voltage that had approximately 2.5% THD regardless of the distortion of the voltage source. The delta-wye transformer is at the mercy of the incoming voltage distortion because it is reflected to the secondary of the transformer and to the load. The AIM is a parallel connected device and really has no effect on voltage distortion other than through the effect that diminished harmonic currents have on the electrical distribution system. In addition, the AIM injected 10 to 20 V of high frequency noise into the distribution system that could be measured at upstream switchgear equipment.
.
Supply of a Regulated Voltage
The Westinghouse SureSine regulates the output voltage to within 1% of a nominal value for input variations of +15% to -50%. The Liebert Datawave also is capable of producing an output voltage within 5% of a nominal value for input variations of +40% to -40%. The delta-wye transformer is again at the mercy of the voltage source because its output voltage is related to input voltage simply by the turns ratio. The AIM does not regulate the output voltage either because it is connected in parallel across the line.
Softening Agent for Impukes and Transients
The SureSine and Datawave have built-in transient surge suppressors to prevent impulses from reaching connected equipment. The transformer is a softening agent between the source and load, but it cannot completely eliminate transients. The AIM does not have transient surge suppressant capability.
Reliability
While no long term testing was performed on the equipment as part of this study, some insight into reliability was gained during the time that the equipment was in service. Delta-wye & d o r m e r s have been built for decades and have no electronic devices or moving parts associated with them. If transformers are not overloaded such that their insulation integrity is maintained, they will easily last 30 years. The main power devices in the Datawave magnetic synthesizer are transformers and capacitors and should also be fairly rugged. The Datawave does have some control circuits which would add to the number of possible devices that might fail. The Datawave has been in production for over 10 years, so flaws in design and production should have been corrected by now.
The SureSine and AIM Filter both use power electronics and sophisticated control techniques to compensate for harmonic currents. Both of these power quality improvement units and their internal electronics are relatively new devices and have yet to “stand the test of time”. One of the three Suresines had a premature failure during the two months that it was in service.
Efficiency
The AIM filter corrects power factor to unity, and most of the current drawn by the unit is reactive to compensate for motor loads or to cancel unwanted harmonic currents. The AIM filter and load together actually drew 15% less current than the load by itself. Most of the losses in the AIM come from switching losses which is minimal compared to the total power. The SureSine reduced the crest factor of current drawn considerably and the RMS value of current only slightly. The wye-wye SureSine configuration did not draw a current that had a unity power factor, however. Again like the AIM filter, most of the losses in the SureSine come from switching losses which should be minimal.
Delta-wye transformers have an inherent impedance associated with them on the order of 5% which causes resistive heating. Also, harmonic currents cause eddy losses on the order of their frequency squared. This means that higher order harmonics are much more lossy than and cause much more heating than the fundamental current. Finally, triplen harmonics circulate in the delta Gndings of the transformer and cause heat losses. All of these heating effects tend to lessen the life of the insulation of the transformer.
The Datawave drew a balanced current that had a power factor close to unity. However, the saturating transformers in the Datawave seemed to be quite lossy because the unit tested was quite hot when in operation; even hotter than a comparable delta-wye transformer. This heat must be taken into account when using a Datawave; and to Liebert’s credit, the company publishes the expected heat loss in BTU’slhour for each of their units.
cost
For all of the devices, the cost per kVA is less for the larger units as expected. Obviously the delta-wye transformer was &e least expensive of the devices tested. However, to meet UL and NEC requirements, K-factor transformers must be used for supplying nonlinear loads. The K-factor is found by multiplying the frequency squared for each harmonic component by its per unit amplitude and then summing over all frequencies. Manufacturers are charging a premium for their K-factor transformers even though some manufacturers have
32
simply derated a larger transformer and had it tested so that it meets UL requirements. True K-factor transformers have neutrals rated at two times the ampacity of the phase conductors, a low flux density core, and are specially wound to reduce eddy current losses. True K-factor transformers are 5 - 10 % larger than their K-1 (non K-factor) counterparts.
The Liebert Datawave costs about two to three times as much as a transformer with a similar kVA rating. Because the Datawave has been in production for several years, research and development costs have been spread out over several units.
The AIM and SureSine are both new technologies and were the more expensive power quality improvement units tested. They cost approximately $450 per kVA, which was about four to five times what a delta-wye transformer costs.
Comparative Summary of Power Quality Improvement Unit Pt ?I formance for Various Factors Liebert [ Helionetics ~ ~ I
RECOMMENDATIONS
Harmonics is an issue that has only come to the forefront in general electrical distribution design in the last few years. The National Electrical Code (1993) has yet to directly address many of the issues associated with harmonics. Indirectly, the NEC does address things like oversizing neutral conductors because it requires that conductors be sized to carry expected loads. Some publications that do address harmonics and power quality are IEEE 5 19, Recommended Practices and Requirements for Harmonic Control in Electrical Power Systems; IEEE 1100, Recommended Practice for Powering and Grounding Sensitive Electronic Equipment and FIPS 94, Requirements for Data Processing Centers. All three of these publications contain use l l information in the design of electrical systems where nonlinear loads are expected or where sensitive electronic components are located.
One common problem with harmonics is overheating of conductors, bus bars, or transformers. Future designs where harmonics are expected should use K-factor transformers, nonlinear load rated panels, and oversized or dedicated neutrals. K-factor transformers are UL listed to supply nonlinear loads without loss in the insulation life of the transformer. Oversized transformers would also do the job, however, using a transformer in this way is a violation of its UL listing and ultimately the NEC. Nonlinear load rated panels have neutral bars that have twice the ampacity of normal panels. This enables loads that have a large percentage of triplen harmonics, which add instead of cancel in the neutral, to be safely supplied. Simply oversizing a panel or not loading an existing panel up to the maximum allowed by the NEC will also mitigate overheating problems.
Most electrical systems were not designed to support the nonlinear devices that now make up a large percentage of the loads on today’s distribution systems. Future designs should follow the guidance given in the
33
Most electrical systems were not designed to support the nonlinear devices that now make up a large percentage of the loads on today's distribution systems. Future desi\gns should follow the guidance given in the aforementioned publications. The following is a list of the ten most important steps in designing, installing, or retrofitting an electrical system that will serve a large number of nonlinear or sensitive electronic equipment:
1. For a safety ground (per the NEC), use single-point radial grounding techniques to avoid ground loops. (Good for DC through 30 W). Do not sacrifce safety for performance. Ground for safety first, and secondly for performance.
2. For a performance ground (reduction of high-frequency noise), use multi-point grounding grid or plane. (Good for kHz to 30 MHz). At high.frequencies, length NOT cross-section determines impedance in wires, because impedance (Z) is frequency dependent and predominates resistance (R). For this reason, plates make better grounding planes than a grid of wires. IEEE 11 10 has several good illustrations of telecommunication performance grounding techniques.
3. Bring ALL the telecommunication cables intolout of a building in a room physically adjacent to the ac power service equipment room. Both areas should be bonded together by a zero signal reference ground plane.
4. Choose a solid-wall conduit for best shielding properties (the thicker the better). Ferrous me@ is better than non-ferrous. Minimize use of flexible conduit.
5. Don't place the wiring for more than one branch circuit in the same conduit or raceway. (Reduces coupling of "noise"). '
6. Allow for use of a 2X sized neutral conductor when triplen harmonics are involved.
7. Use dedicated neutrals (one neutral for each load). Electrical "noise" from one load can interact with other loads sharing the same neutral.
8. Avoid the use of banked single-phase transformers on three-phase systems where electronic equipment is to be directly connected to the bank. Problems are overheating and voltage instability. Instead, use standard three-phase transformers connected in a delta-wye arrangement.
9. Harmonics should be controlled as near to the source as possible. This prevents them from propagating throughout the system and interacting with more of the electrical system and connected equipment.
10. Cascade coordinate transient voltage surge suppressors (TVSS). This is similar to selective coordination of circuit breakers in an electrical system. Using a single-source (same vendor) for W S S modules on the same circuit for better coordination; mix-and-match from Merent vendors makes coordination difkicult.