8
I. Project Research Project 5

I. Project Research
Project 5

28P5
Project Research on the Advanced Utilization of Multi-Element Mössbauer
Spectroscopy for the Study on Condensed Matter Science
M. Seto
Research Reactor Institute, Kyoto University
OBJECTIVES AND PERFORMED RESEARCH SUBJECTS: The main objectives of this project research are the investigation of the fundamental properties of new materials and the development of the advanced experimental methods by using multi-element Mössbauer spectroscopy. Combination use of the high-magnetic-field superconducting magnet was also essential to study the magnetism of the materials. As the Mössbauer resonance line is extremely narrow, hyperfine interactions are well resolved and give us the information on the surrounding electronic states and magnetism. Thus, the Mössbauer spectroscopy is applied to widely various areas of researches, such as physical, chemical, biological, and earth sciences. Moreover, element-specific or isotope-specific information is one of the most irreplaceable features of the Mössbauer spectroscopy. Therefore, promotion of the variety of Mössbauer isotope provides more useful and valuable methods for modern precise materials science of complex systems, such as biological substances, multi-layer films, and complicated-structured matter. In this term of the year, some of the planned researches have not been performed because of the shutdown of the research reactor. The research subjects performed are as follows:
P5-2 Mössbauer microspectrometer using Si-PIN semi-conductor detector and its application to mineral science (K. Shinoda et al.)
P5-3 57Fe Mössbauer spectra of Sr2VFeAsO3-d (d=0.232, 0.267, and 0.509) (Y. Kamihara et al.)
P5-4 Relationship between Heme Electronic Structure and Oxygen Affinity of Myoglobin (Y. Yamamoto et al.)
P5-8 Development of Mössbauer spectroscopy system on 67Zn (M. Saito et al.)
P5-9 Mössbauer Study of Ba0.6K0.4Fe2As2 under High Magnetic Fields (S. Kitao et al.)
MAIN RESULTS AND CONTENTS OF THIS REPORT:
The following reports were contributed by research groups in this project research.
K. Shinoda et al. (P5-2) have developed Mössbauermicrospectrometer using Si-PIN semiconductor detectorand applied to studies of crystallographically-orientedsingle crystals of thin sections of augite from differentoccurrences. Obtained three sets of quadrupole doubletswere well identified with Fe2+ in M1 and M2 sites, andFe3+ in M1 site in pyroxene structure. From the intensityratio of each doublets, the orientation of the electric fieldgradient vector was discussed. As a result, goodconcentration of orientation in Fe2+ in M2 site was found,although Fe2+ in M1 site did not show concentration.Y. Kamihara et al. (P5-3) studied Sr2VFeAsO3-d, which arerelated compounds of FeAs-based superconductor withblocking layer and some of which show superconductivityand antiferromagnetic ordering of Vanadium. Mössbauerspectroscopy was applied to investigate magnetism of Fe inthese compounds. For the samples with d = 0.232, 0.267,and 0.509, the spin density wave phase was observed, whilemagnetically-ordered Fe was not observed forsuperconducting Sr2VFeAsO3-d. The result indicates that Fehas two different magnetic phase, depending on the oxygendeficiency.Y. Yamamoto et al. (P5-4) investigated the Mössbauerspectroscopy to elucidate the relationship betweenelectronic structure of heme Fe atom and oxygen affinity ofmyoglobin(Mb). Through the studies ofchemically-modified heme cofactors, obtained isomer shiftscould not be simply interpreted as the electronic nature ofthe hemes. On the other hand, quadrupole splitting valuesdecreased with decreasing the electron density of the hemes.These facts are useful to elucidate the electronic structure ofthe oxy form of Mb, to understand the oxygenation andautoxidation processes of Mb.M. Saito et al. (P5-8) attempted to observe the 67ZnMössbauer absorption spectrum, which could be useful forexperiments requiring extremely high energy resolution. Toobtain the 67Cu Mössbauer source, ZnO crystals wereirradiated by KURRI-LINAC through photonuclearreaction. Although measurement of the Mössbauerspectrum was tried, expected absorption was not observed.It is considered to be due to the vibrational noise of thevacuum chamber. Further development of the 67ZnMössbauer spectroscopic system is in progress.S. Kitao et al. (P5-9) measured detailed temperaturedependences of Mössbauer spectra under high magneticfields to reveal the magnetic properties of the Fe-basedsuperconductor Ba0.6K0.4Fe2As2. From the temperaturedependence of Mössbauer spectra, small broadening ofthe line width were observed at the temperature a littleabove the superconducting transition temperature. Themeasurements under high magnetic fields revealed theline broadenings are due to quadrupole splittings, whichis consistent to the fact that the electronic nematic stateshas the small asymmetry in the structure.
PR5
28P5-2
Mössbauer Microspectrometer Using Si-PIN Semi-conductor Detector and its Application to Mineral Sciences
A. Marutani1, K. Shinoda1, Y. Kobayashi2
1Department of Geosciences, Graduate School of Science, Osaka City University 2Research Reactor Institute, Kyoto University
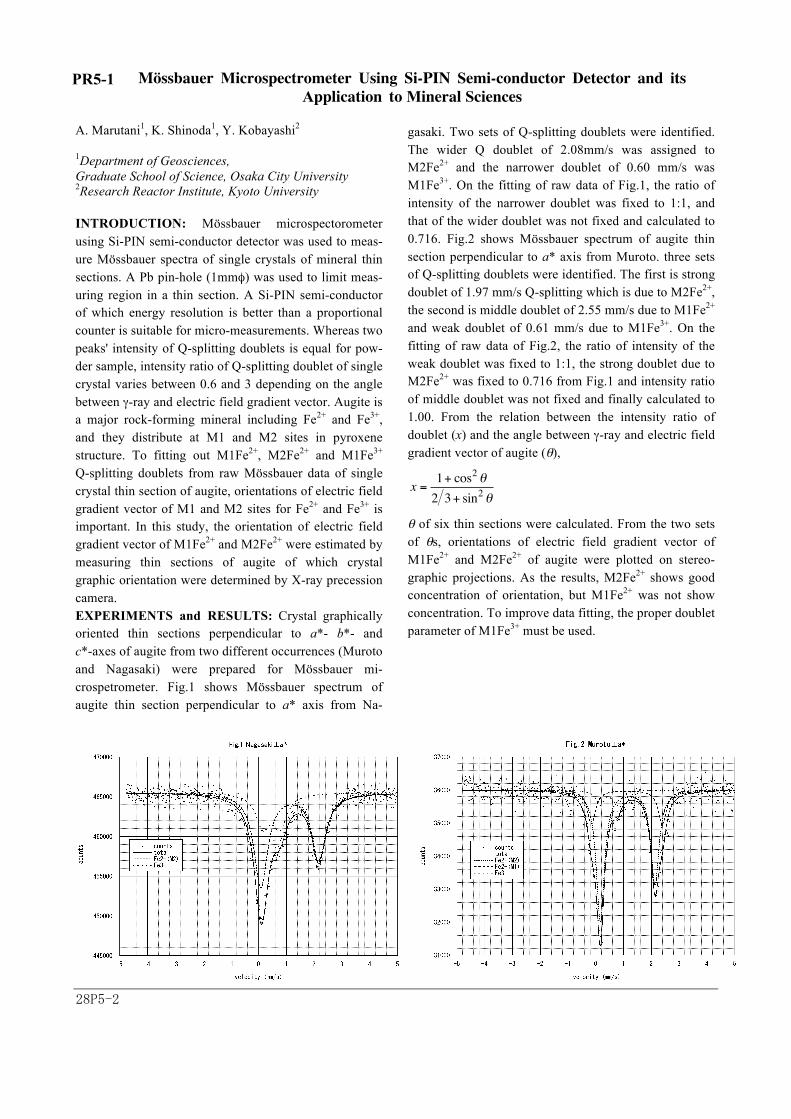
INTRODUCTION: Mössbauer microspectorometer using Si-PIN semi-conductor detector was used to meas-ure Mössbauer spectra of single crystals of mineral thin sections. A Pb pin-hole (1mmφ) was used to limit meas-uring region in a thin section. A Si-PIN semi-conductor of which energy resolution is better than a proportional counter is suitable for micro-measurements. Whereas two peaks' intensity of Q-splitting doublets is equal for pow-der sample, intensity ratio of Q-splitting doublet of single crystal varies between 0.6 and 3 depending on the angle between γ-ray and electric field gradient vector. Augite is a major rock-forming mineral including Fe2+ and Fe3+, and they distribute at M1 and M2 sites in pyroxene structure. To fitting out M1Fe2+, M2Fe2+ and M1Fe3+ Q-splitting doublets from raw Mössbauer data of singlecrystal thin section of augite, orientations of electric fieldgradient vector of M1 and M2 sites for Fe2+ and Fe3+ isimportant. In this study, the orientation of electric fieldgradient vector of M1Fe2+ and M2Fe2+ were estimated bymeasuring thin sections of augite of which crystalgraphic orientation were determined by X-ray precessioncamera.EXPERIMENTS and RESULTS: Crystal graphicallyoriented thin sections perpendicular to a*- b*- andc*-axes of augite from two different occurrences (Murotoand Nagasaki) were prepared for Mössbauer mi-crospetrometer. Fig.1 shows Mössbauer spectrum ofaugite thin section perpendicular to a* axis from Na-
gasaki. Two sets of Q-splitting doublets were identified. The wider Q doublet of 2.08mm/s was assigned to M2Fe2+ and the narrower doublet of 0.60 mm/s was M1Fe3+. On the fitting of raw data of Fig.1, the ratio of intensity of the narrower doublet was fixed to 1:1, and that of the wider doublet was not fixed and calculated to 0.716. Fig.2 shows Mössbauer spectrum of augite thin section perpendicular to a* axis from Muroto. three sets of Q-splitting doublets were identified. The first is strong doublet of 1.97 mm/s Q-splitting which is due to M2Fe2+, the second is middle doublet of 2.55 mm/s due to M1Fe2+ and weak doublet of 0.61 mm/s due to M1Fe3+. On the fitting of raw data of Fig.2, the ratio of intensity of the weak doublet was fixed to 1:1, the strong doublet due to M2Fe2+ was fixed to 0.716 from Fig.1 and intensity ratio of middle doublet was not fixed and finally calculated to 1.00. From the relation between the intensity ratio of doublet (x) and the angle between γ-ray and electric field gradient vector of augite (θ),
x = 1+ cos2θ2 3+ sin2θ
θ of six thin sections were calculated. From the two setsof θs, orientations of electric field gradient vector ofM1Fe2+ and M2Fe2+ of augite were plotted on stereo-graphic projections. As the results, M2Fe2+ shows goodconcentration of orientation, but M1Fe2+ was not showconcentration. To improve data fitting, the proper doubletparameter of M1Fe3+ must be used.
PR5-1
28P5-3
57Fe Mössbauer Spectra of Sr2VFeAsO3-d (d = 0.232, 0.267, and 0.509)
Y. Tojo, H. Fujioka, M. Matoba, S. Kitao1, M. Seto
1 andY. Kamihara
Department of Applied Physics and Physico-Informatics,
Keio University 1Research Reactor Institute, Kyoto University
INTRODUCTION: Layered oxypnictide
Ae2TMFePnO3-d (Ae = Alkaline earth metal, TM = Transi-
tion metal) (21113) consists of carrier conducting FePn
(Pn = P and As) layer and carrier blocking Ae2TMO3 layer.
Several 21113 compounds show superconducting phase
at low temperatures. Hyperfine fields (Bhf) measurements
experienced by nuclei of atoms at crystallographic sites
in magnetic and/or antiferromagnetic metals are of inter-
est in view point of hyperfine interactions and important
for their use in the determinations of nuclear magnetic
dipole moments by a variety of methods including those
based on low-temperature nuclear orientation.
Guang-Han Cao et al reported that Sr2VFeAsO3-d is an
FeAs-based layered oxypnictide superconductor, which
exhibits antiferromagnetic ordering under 150 K origi-
nating in local d-electron moments of vanadium, and the
superconducting transition temperature Tc is 24 K.[1,2] In
this study, we focus on magnetic phase of Sr2VFeAsO3-d
as a complex magnetic compounds. [1-8]
Element-specific magnetism and electronic phase of Fe
sublattice in Sr2VFeAsO3-d are elucidated using 57Fe
Mössbauer spectroscopy. Studies on hyperfine fields Bhf
experienced by nuclei are of interest in view point of
hyperfine interactions and important for their use in the
determinations of nuclear magnetic dipole moments.
EXPERIMENTS: Polycrystalline samples of
Sr2VFeAsO3-d were prepared by the solid-state reactions
in a sealed silica tube using dehydrated SrO, FeAs, Vana-
dium oxides, and V as starting materials. Then, a mixture
of the three powders was pressed into pellet and heated in
doubly sealed silica tubes at 1050-1300 °C for 40 h. All
procedures were carried out in an Ar-filled glove box
(MIWA Mfg; O2, H2O < 1 ppm). The crystal phase of the
obtained product was examined by powder X-ray diffrac-
tion (XRD; RigakuRINT-2500) using CuKα radiation.
Almost all the diffraction peaks are assigned to the
Sr2VFeAsO3-d phase. Electrical resistivity measurements
were performed at 2–300 K by a dc four-probe technique
using silver paste as electrodes. Magnetization measure-
ments were performed for polycrystalline samples using a
Quantum Design magnetic properties measurement sys-
tem (MPMS). The 57Fe Mössbauer (MS) experiment on
the two series of compounds, Sr2VFeAsO3-d (x = 0.232,
0.267, and 0.509) was performed with conventional 57Fe
MS equipment using 14.4 keV γ-rays from a 57Co source
in an Rh matrix.
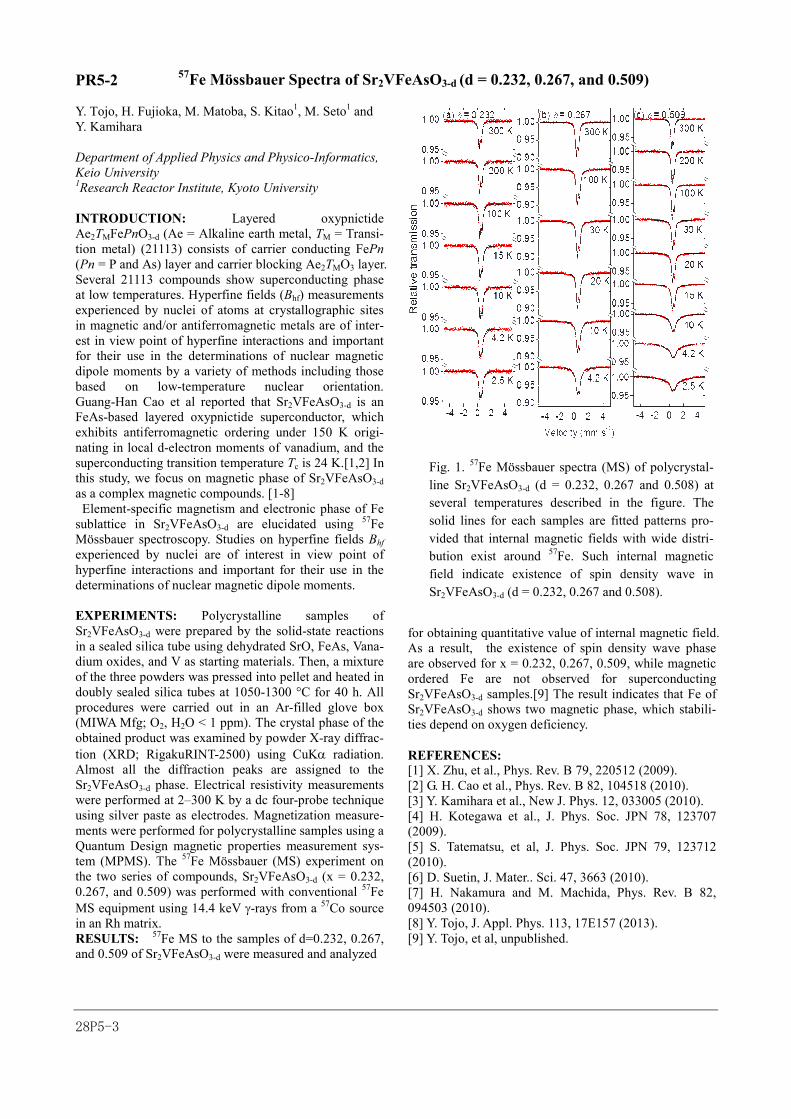
RESULTS: 57Fe MS to the samples of d=0.232, 0.267,
and 0.509 of Sr2VFeAsO3-d were measured and analyzed
for obtaining quantitative value of internal magnetic field.
As a result, the existence of spin density wave phase
are observed for x = 0.232, 0.267, 0.509, while magnetic
ordered Fe are not observed for superconducting
Sr2VFeAsO3-d samples.[9] The result indicates that Fe of
Sr2VFeAsO3-d shows two magnetic phase, which stabili-
ties depend on oxygen deficiency.
REFERENCES: [1] X. Zhu, et al., Phys. Rev. B 79, 220512 (2009).
[2] G. H. Cao et al., Phys. Rev. B 82, 104518 (2010).
[3] Y. Kamihara et al., New J. Phys. 12, 033005 (2010).
[4] H. Kotegawa et al., J. Phys. Soc. JPN 78, 123707
(2009).
[5] S. Tatematsu, et al, J. Phys. Soc. JPN 79, 123712
(2010).
[6] D. Suetin, J. Mater.. Sci. 47, 3663 (2010).
[7] H. Nakamura and M. Machida, Phys. Rev. B 82,
094503 (2010).
[8] Y. Tojo, J. Appl. Phys. 113, 17E157 (2013).
[9] Y. Tojo, et al, unpublished.
Fig. 1. 57Fe Mössbauer spectra (MS) of polycrystal-
line Sr2VFeAsO3-d (d = 0.232, 0.267 and 0.508) at
several temperatures described in the figure. The
solid lines for each samples are fitted patterns pro-
vided that internal magnetic fields with wide distri-
bution exist around 57Fe. Such internal magnetic
field indicate existence of spin density wave in
Sr2VFeAsO3-d (d = 0.232, 0.267 and 0.508).
PR5-2

28P5-4
Relationship between Heme Electronic Structure and Oxygen Affinity of Myoglobin
K. Hasegawa, M. Saito1, M. Seto1, Y. Kobayashi1, T.
Ohta2, S. Yanagisawa2, T. Ogura2, Y. Yamamoto, T. Shi-
bata, S. Neya3 and A. Suzuki4
Department of Chemistry, University of Tsukuba
1 Research Reactor Institute, Kyoto University 2 Graduate School of Life Science, University of Hyogo 3 Graduate School of Pharmaceutical Sciences, Chiba University
4 Department of Materials Engineering, Nagaoka Na-tional College of Technology
INTRODUCTION: The function of an oxygen storage
hemoprotein, myoglobin (Mb), is regulated through heme
electronic structure, in addition to heme environment
furnished by nearby amino acid residues. We found that a
decrease in the electron density of the heme Fe atom (ρFe)
leads to lowering oxygen affinity and a decrease in the
autoxidation rate of the protein.1 These findings could be
reasonably explained in terms of the effect of a change in
the ρFe on the resonance A ↔ B of oxy form of Mb (ox-
yMb) (scheme 1). In this study, we measured Mӧssbauer
spectra of oxyMbs reconstituted with some chemical-
ly-modified heme cofactors (Fig. 1) in order to charac-
terize the relationship between the ρFe and the resonance
A ↔ B. The formal charges of heme Fe in the canonical
structures A and B are +2 and +3, respectively, and hence
the effect of a change in the ρFe on the resonance A ↔ B
could be analyzed through the resonance hybrid of the
formal charge of heme Fe which is sharply reflected in
the Mӧssbauer spectral parameters, i.e., isomer shift (IS)
and quadrupole splitting (QS).
EXPERIMENTS: ApoMb was prepared from sperm
whale Mb, using the standard procedure, and reconstitut-
ed with 57Fe-labelled heme cofactors. 2 mM Mbs in 50
mM potassium phosphate buffer, pH = 7.4, were cooled
rapidly in liquid nitrogen bath. The Mӧssbauer measure-
ments were performed at 3-6 K.
RESULTS: The Mӧssbauer spectrum of oxyMb recon-
stituted with 57Fe-labelled proto (Fig. 2) was almost iden-
tical to that previously reported.2 The IS values of the
heme cofactors ranged from 0.260 to 0.271 mm/s and
could not be simply interpreted on the basis of the elec-
tronic nature of the hemes. On ther other hand, the heme
cofactors were arranged as 2,8-DPF < 7-PF ≈ Proto <
3,8-DMD < Meso, in order of increasing QS (Fig. 1),
indicating that the QS decreases with decreasing the ρFe.
This result confirmed that a decrease in the ρFe results in
shifting the resonance A ↔ B toward structure A. Proto
and 7-PF exhibited similar QS values, supporting that the
ρFe values of the two heme cofactors are closely similar to
each other. Thus, Mӧssbauer spectroscopy is a powerful
tool to elucidate the electronic structure of oxyMb.
REFERENCES:
[1] T. Shibata, D. Matsumoto, R. Nishimura, H. Tai, A.
Matsuoka, S. Nagao, S. Matsuo, S. Hirota, K. Imai, S.
Neya, S. Suzuki, and Y. Yamamoto, Inorg. Chem., 51,
(2012) 11955–11960.
[2] B. Boso, P. G. Debrunner, G. C. Wagnner, and T.
Inubushi, Biochem. Biophys. Acta, 791, (1984) 244-251.
Fig. 2. Mӧssbauer spectrum of oxyMb (proto) at 3 K.
Fig. 1. Chemically-modified heme cofactors used in
the study, and the obtained Mӧssbauer spectral pa-
rameters.
Scheme 1. Oxygenation and autoxidation of Mb, and the
resonance structures A and B of oxyMb.
436x103
434
432
430
428
426
Cou
nts
-4 -2 0 2 4
Velocity(mm/s)
PR5-3

28P5-7
PR5-4 Magnetic Property and Local Structures of Functional Irons in Glass by Mössbauer Spectroscopy
N. Umesaki, K. Okada1, Y. Kobayashi 2
Graduate School of Engineering, Osaka University 1Research & Utilization division, JASRI 2Research Reactor Institute, Kyoto University
INTRODUCTION and AIM: Glass is used in many applications in our every-day lives and has new applica-
tions. Coexisting divalent iron ions (Fe2+) and trivalent
iron ions (Fe3+) in glass affect the transmission from the
near-ultraviolet (NUV) to the near-infrared (NIR) range
(hereinafter denoted as “transmission-NUV_NIR”) and col-
oring (value, chroma, hue) of glass.[1] The transmis-
sion-NUV_NIR and coloring determine the utilization pur-pose of glass in industry. Commercial glass ineluctably
contains very low concentrations of irons (about 0.01-0.1
wt.% iron oxide concentration), which are derived from
raw materials or industrial processes. Higher iron con-
centration are added by manufacturing design. The iron
concentrations mainly affect the value of coloring. Fe2+
and Fe3+ mainly affect the chroma and hue of coloring.
Fe2+ gives absorption mainly in the NIR range, resulting in bluish coloring.[1] Fe3+ gives strong absorption mainly
in the visible to NUV range, resulting in yellowish color-
ing. [1]
Two macro parameters have been used in industry to
control transmission-NUV_NIR and coloring: (1) the total
iron ion mass concentration in terms of Fe2O3 (hereinaf-
ter denoted as “iron oxide concentration; MFe2O3”), and
(2) the ratio of the number of Fe2+ to the number of total
irons (hereinafter denoted as “Fe2+/nFe”).
Three dimensional (3D) local structures and property of iron ions should also contribute to the transmis-
sion-NUV_NIR and coloring. Although many scientists pro-
posed structures of Fe2+ and Fe3+ by traditional measuring
methods, they could not explain the property of irons in
glass completely.
By enriching with 57Fe, we made basic soda-lime glass
samples that had 0-0.6 57Fe2+/nFe and MFe2O3 of 0.1, 0.5, 1.5, and 5.0 wt.%.
We have investigated these samples by nuclear reso-nant inelastic scattering (NRIS) and XAFS methods at
synchrotron radiation, and revealed the 3D local structure
around iron atoms in sub-nanometer region (Okada et al,
submitted to X-ray Spectrometry). And we found the ca-
pability of complex magnetic fields of Fe3+ in glass at RT.
Then we have proposed Mössbauer measurements to re-
veal the magnetic sates and internal magnetic fields from
Fe3+ and Fe2+ atoms, independently, at various tempera-tures.
EXPERIMENTS: The measurements were performed
using conventional Mössbauer spectrometer. The speci-
mens for Mössbauer measurements were tuned to 10
mm-phi pellet from the 57Fe enriched glass powders. We
investigated samples at room temperature (RT), 150 K
and 77 K.
RESULTS and DISCUSSION: The three glass samples
with 0.5 wt.% MFe2O3 were measured at RT. As shown in
Fig. 1, there were the differences of continuous compo-
nents between samples that had different Fe2+/nFe. These wide structures indicated the local magnetization
around iron atoms. The two Fe3+ components with large
internal magnetic field and the two Fe2+ components with
large quadrupole splitting have been determined from their isomer shifts by our fittings shown in Fig. 1. And
the results from glass with 0.1-5 wt.% MFe2O3, indicated
that the Fe3+ and Fe2+ atoms in glass had separate struc-
tures. Moreover we measured glass with 0.5 wt.% MFe2O3
and with 0 Fe2+/nFe at 150 K and 70 K. The internal magnetic field from Fe3+ in the sample was about 51 T
and had internal distribution. We concluded that about
90 % of the Fe3+ in glass had local magnetic order like
antiferromagnetic materials. On the other hand, we con-cluded that Fe2+ atoms had no magnetic order.
REFERENCES:
[1] F. N. Steele et al., Phys. Chem. Glass. 1965; 6: 246.
Fig. 1. Mössbauer spectra of glass at RT with 0.5 wt.%
MFe2O3 and with Fe2+/nFe of (a) 0, (b) 0.2, and (c) 0.6. The dot lines and dot-and-dash lines were fitting
curves from Fe3+ and Fe2+, respectively. The solid line
showed the total fit.
Fig. 2. Mössbauer spectra of sample glass at (a) 70 K,
(b) 150 K, and (c)R.T. with 0.5 wt.% MFe2O3 and with 0
Fe2+/nFe. Same lines as Fig. 1. The inset panels showed internal magnetic fields of each temperature.

28P5-8
Devlopment of Mössbauer Spectroscopy System on 67
Zn
M. Saito, Y. Kobayashi, R. Masuda, M. Kurokuzu, S.
Kitao and M. Seto
Research Reactor Institute, Kyoto University
INTRODUCTION: Among various Mössbauer spec-
troscopy systems, 67
Zn Mössbauer spectroscopy system
shows relatively very high energy resolution: the energy
width of the gamma rays is narrow ⊿E ~ 50 peV com-paring with the gamma-ray’s energy E0 ~ 93 keV, and the
relative energy uncertainty of the gamma rays ⊿E/E0 is the order of ⊿E/E0 ~ 10
-15. [1,2]
Therefore, 67
Zn Mössbauer spectroscopy system has been
used to study the various physics experiments which re-
quire high energy resolution such as the detection of the
gravitational red shift of the photons as well as to study
the solid state physics on materials including 67
Zn.
However, in spite of its usefulness, only few group suc-
ceeded to develop 67
Zn Mössbauer spectroscopy so far
owing to its difficulty: the system requires very accurate
control of the relative velocity between the source and the
absorber. Recently, by trial experiment, the Mössbauer
absorption of 67
Zn has been observed by authors using
the radioactive Mössbauer source produced by the elec-
tron linear accelerator (KURRI-LINAC).
The purpose of this study is to establish the 67
Zn Möss-
bauer spectroscopy system by controlling velocity accu-
rately using a piezo driving system.
EXPERIMENTS: In this experiment, the source of 67
Zn Mössbauer spectroscopy is
67Zn in ZnO mono-crystal
produced by the 68
Zn (γ,p) 67
Cu reaction using high en-
ergy gamma-rays from the platinum target of the LINAC.
The ZnO mono-crystal was irradiated by the high energy
gamma-rays for three days and taken out from the target
room one-day later after the irradiation. The source was,
then, annealed at 700 ℃ for 9 hours in Ar atmosphere.
Gamma rays and X rays were detected by
Ge-semiconductor detector. In Fig. 1, we show the ob-
tained energy spectrum.
The 93-keV gamma-rays from 67
Zn source could be
nicely observed and selectively used to obtain the Möss-
bauer spectrum. The source and the 67
ZnO mono-crystal
absorber were set to the vacuum chamber and cooled
down to around 10 K. The chamber was put on the vibra-
tion-isolated table for the isolation from the external vi-
bration and a piezo driving stage (P752, PI Japan Co.,
Ltd.) was used for a velocity control. Against for the sta-
ble absorber, a sinusoidal motion with the amplitude of
12 μm/s was induced to the source.
RESULTS: The obtained 67
Zn Mössbauer spectrum is
shown in Fig. 2. The velocity calibration was performed
by the time dependence of the piezo elongation. The error
bar shows the standard deviation of the obtained value.
From the previous studies, absorption with the absorption
depth ratio of 0.7 % is expected at zero position of the
velocity.[1] However, from the experiment, the absorp-
tion depth ratio is, if any, estimated to be less than 0.1 %.
This result suggests that the strong reduction of the depth
of the absorption occurs.
After the experiment, we checked the vibrational noise of
the vacuum chamber by using the laser-Doppler veloci-
meter. The result suggests that the vibrational noise of
our system is larger than our expectation and too large to
obtain the 67
Zn Mössbauer spectrum.
From the experiment, we could obtain fundamentally
important knowledge about the current system such as
the gamma-rays count-rate and degree of the external
noise. Based on the obtained knowledge, further devel-
opment of the 67
Zn Mössbauer spectrum is in progress.
REFERENCES: [1] W. Potzel, A. Forster, and G. M. Kalvius, J. Phys.
Colloques 37 (1976) C6-691.
[2] N.N. Greenwood, and T. C. Gibb, “Mössbauer spec-
troscopy” (Chapman and Hall Ltd., London,1971).
Fig. 2. Obtained 67
Zn Mössbauer spectrum.
Fig. 1. Energy spectrum of radiations from the source.
PR5-5
28P5-9
Mössbauer Study of Ba0.6K0.4Fe2As2 under High Magnetic Fields
S. Kitao, M. Kurokuzu, Y. Kobayashi and M. Seto
Research Reactor Institute, Kyoto University
INTRODUCTION: After the discovery of so-called
“1111” series of Fe-oxipnictide superconductors,
LaFeAsO1-xFx[1], several series of Fe-based supercon-
ductors have been extensively investigated. Among re-
lated Fe-based superconductors, so-called “122” series
has been of great interest because the superconductivity
emerges with various doping methods. That is, the su-
perconductivity was observed not only with hole doping,
Ba1-xKxFe2As2[2] or electron doping, Ba(Fe1-xCox)2As2,
but also with isovalent doping, BaFe2(As1-xPx)2. Recently,
the electronic nematic phase was found in the isovalent-
doped BaFe2(As1-xPx)2[3]. This electronic nematic phase
is considered to have an important relationship with su-
perconductivity. The electronic nematic phase was also
found in Ba(Fe1-xCox)2As2. However, it is not clear in the
case of Ba1-xKxFe2As2. Therefore, it is important to in-
vestigate the electronic nematic phase in Ba1-xKxFe2As2.
Since 57Fe-Mössbauer spectroscopy is an essential
method to extract the electronic states of Fe, a number of
Mössbauer studies on these Fe-based superconductors
have been carried out and revealed many important facts,
for example, in LaFeAsO1-xFx[4]. Moreover, Mössbauer
spectroscopy under high magnetic fields has advanta-
geous to reveal the nature of magnetism in these com-
pounds[5]. In this study, detailed temperature depend-
ences of Mössbauer spectra under high magnetic fields
were measured to investigate the properties of the elec-
tronic nematic phase.
EXPERIMENTS: Ba1-xKxFe2As2 was synthesized by
heating of a stoichiometric mixture of ground Ba and
FeAs with a little excess of K in a crucible of aluminum
oxide sealed in a quartz tube, as in the reported meth-
od[2]. The obtained polycrystalline powder was charac-
terized by x-ray diffraction and magnetic susceptibility
measurements. The doping level of x = 0.4 is the optimal
doping, that is, the superconducting transition tempera-
ture (Tc) has the maximum value of about 38 K. 57Fe-Mössbauer spectra were measured using a pellet of
powder sample using a 57Co source in Rh matrix with a
nominal activity of 1.85 GBq. The velocity scales are
referenced to α-Fe. Magnetic fields were applied by a
superconducting-magnet cryostat with a direction parallel
to the γ-rays.
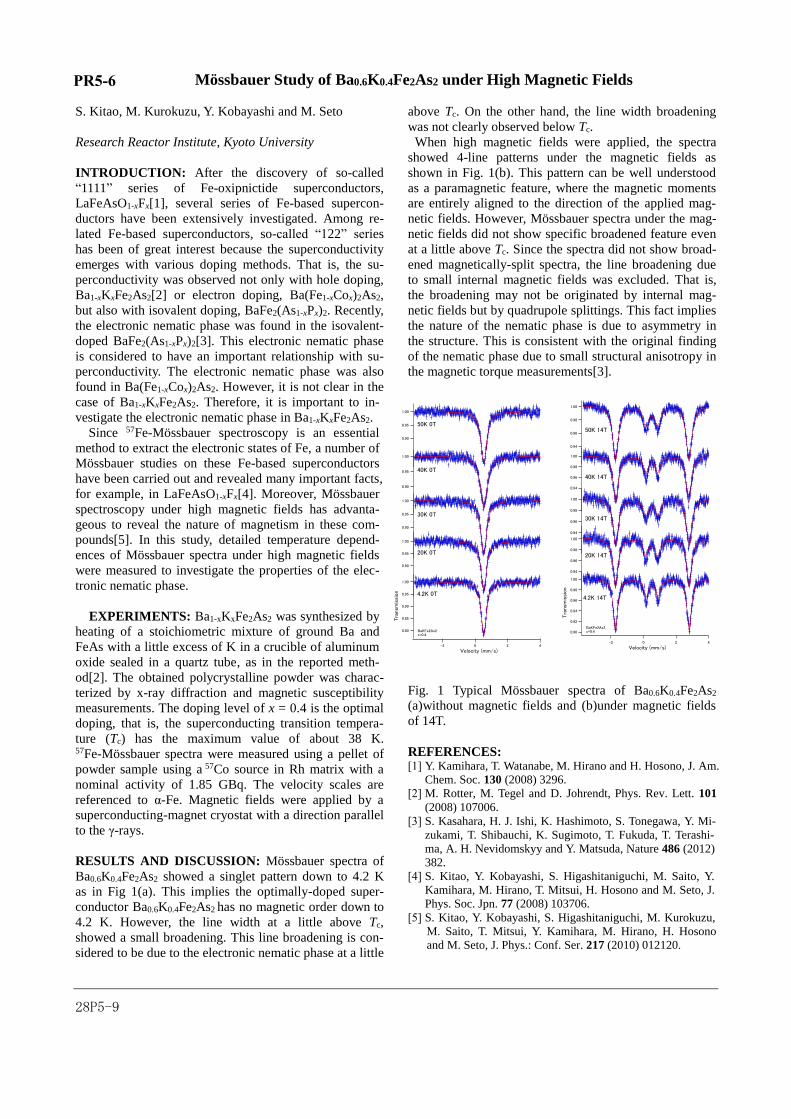
RESULTS AND DISCUSSION: Mössbauer spectra of
Ba0.6K0.4Fe2As2 showed a singlet pattern down to 4.2 K
as in Fig 1(a). This implies the optimally-doped super-
conductor Ba0.6K0.4Fe2As2 has no magnetic order down to
4.2 K. However, the line width at a little above Tc,
showed a small broadening. This line broadening is con-
sidered to be due to the electronic nematic phase at a little
above Tc. On the other hand, the line width broadening
was not clearly observed below Tc.
When high magnetic fields were applied, the spectra
showed 4-line patterns under the magnetic fields as
shown in Fig. 1(b). This pattern can be well understood
as a paramagnetic feature, where the magnetic moments
are entirely aligned to the direction of the applied mag-
netic fields. However, Mössbauer spectra under the mag-
netic fields did not show specific broadened feature even
at a little above Tc. Since the spectra did not show broad-
ened magnetically-split spectra, the line broadening due
to small internal magnetic fields was excluded. That is,
the broadening may not be originated by internal mag-
netic fields but by quadrupole splittings. This fact implies
the nature of the nematic phase is due to asymmetry in
the structure. This is consistent with the original finding
of the nematic phase due to small structural anisotropy in
the magnetic torque measurements[3].
Fig. 1 Typical Mössbauer spectra of Ba0.6K0.4Fe2As2
(a)without magnetic fields and (b)under magnetic fields
of 14T.
REFERENCES: [1] Y. Kamihara, T. Watanabe, M. Hirano and H. Hosono, J. Am.
Chem. Soc. 130 (2008) 3296.
[2] M. Rotter, M. Tegel and D. Johrendt, Phys. Rev. Lett. 101 (2008) 107006.
[3] S. Kasahara, H. J. Ishi, K. Hashimoto, S. Tonegawa, Y. Mi-
zukami, T. Shibauchi, K. Sugimoto, T. Fukuda, T. Terashi-
ma, A. H. Nevidomskyy and Y. Matsuda, Nature 486 (2012) 382.
[4] S. Kitao, Y. Kobayashi, S. Higashitaniguchi, M. Saito, Y. Kamihara, M. Hirano, T. Mitsui, H. Hosono and M. Seto, J. Phys. Soc. Jpn. 77 (2008) 103706.
[5] S. Kitao, Y. Kobayashi, S. Higashitaniguchi, M. Kurokuzu,
M. Saito, T. Mitsui, Y. Kamihara, M. Hirano, H. Hosono and M. Seto, J. Phys.: Conf. Ser. 217 (2010) 012120.
1.00
0.95
0.90
0.85
0.80
Tra
nsm
issi
on
420-2
Velocity (mm/s)
4.2K 0T
BaKFe2As2x=0.4
1.00
0.95
0.90
20K 0T
1.00
0.95
0.90
40K 0T
1.00
0.95
0.90
50K 0T
1.00
0.95
0.90
30K 0T
1.00
0.98
0.96
0.94
0.92
0.90
Tra
nsm
issi
on
420-2
Velocity (mm/s)
4.2K 14T
BaKFe2As2x=0.4
1.00
0.98
0.96
0.94
50K 14T
1.00
0.98
0.96
0.94
20K 14T
1.00
0.98
0.96
0.94
40K 14T
1.00
0.98
0.96
0.94
30K 14T
PR5-6


