International Business EnvironmentAnalysis of industry environment - cable For Prof. K G. Sahadevan IIM Lucknow 08-Oct-2012 Submitted by:- Niraj Kumar (PGP28311) Sandip Murmu (PGP28330) Wamika Mimani (PGP28292)
I. List of Tables .................................................................................................................................. iii
II. List of Figures ................................................................................................................................. iiiIII. Declaration ................................................................................................................................. iv
IV. Executive Summary ..................................................................................................................... v
V. Introduction .................................................................................................................................... 1
VI. Objectives of Study ..................................................................................................................... 2
VII. Industry Analysis ......................................................................................................................... 2
Porter’s five forces Analysis ................................................................................................................ 4
VIII. Findings/ Recommendations ...................................................................................................... 7
IX. Conclusion ................................................................................................................................... 7
The cable industry in India has been growing rapidly. The industry size according to an industryreports is more than US $ 6 billion worth industry. The cable industry is a volume driven industry
with lots of quality and technical specifications. The growth on the cable industry in India is less than
5% annually as compared to CAGR rate of 12% worldwide. This is mostly due to an increase in the
foreign investments as well as transfer of technology in various dependent and related industries.
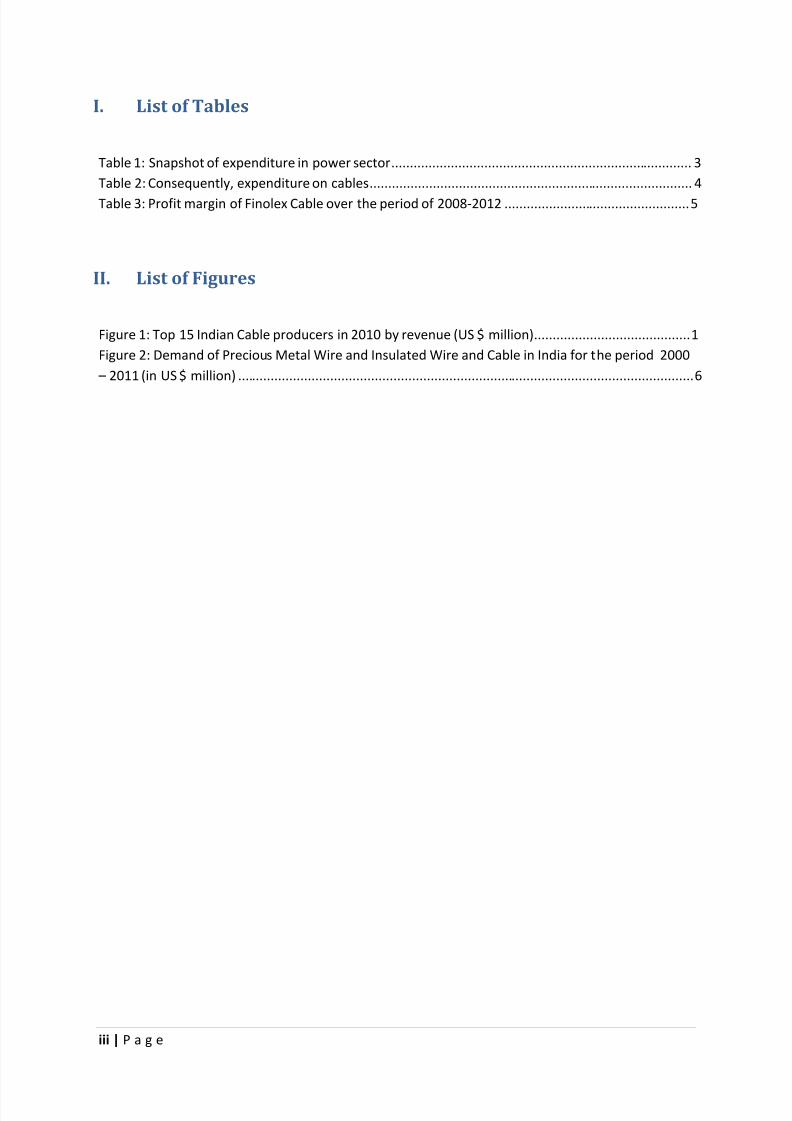
The cable industry in India is highly fragmented with more than 650 significant players. Many
of these are small-scale producers with only limited production capacity and very basic capabilities in
terms of variation in cables produced. There are very few cable-manufacturing companies, which
have revenues exceeding US $ 100 million. In the Figure 1 given below, shows the revenue of the top
15 cable-manufacturing firms in India.
J
In mature markets, the market share of major player varies between 15% - 20%. However due
to the high degree of defragmentation of industry players in India the market leader such as Finolex
accounts to only 5% of total share. There consolidation of cable industry is limited because of the
fact most of them has grown organically in India, rather than by acquisition of competitors leading to
non-emergence of any dominant groups.
The industry structure during the last decade has changed from being largely unorganised to
an organised sector. However, 30% of the market remains unorganised. Due to this, many small
players produce dubious qualities of cables, by-pass regulation norms and avoid taxes. This is also
promoted by tactics such as preferential pricing.
Figure 1: Top 15 Indian Cable producers in 2010 by revenue (US $ million)
The rate of growth of urbanization is astonishing. As per a recent report, by next two
decades over 600 million people will live in cities, which is nearly twice the population of the United
States. Also the number of cities with population of 1 million plus will be 68 up from 42 at present.
By comparison, Europe has 35 such cities. In the medium to low-voltage power cable segment, thegrowth is led by the growth in the industrial, real estate construction sectors.
Telecom sector boom and increase demand for internet connectivity led the demand of optics fibre
and common cable for installation of basic infrastructure of telecom.
Growth outlook of cable industry:
Favourable forces for the attractiveness & performances of industry:
Cables & wires are the basic infrastructure for housing, telecom, information technology,
cables are the backbone of these industries. Growing economy create demand that served
by these industry and caters to the high growth, such as increased demand for residential
property through easy availability of housing loans. Government is encouraging setting in
development of IT parks and development centres which led to formation of many STIP Park
(Software technology & Information Park) and also current boom in IT led by private sector
IT firm this sector expected to grow. The demand for cabling and LAN cables is growing in
commercial and TV - coaxial cables in intelligent building network management. These all
factors would drive demand for cables Major sales of cables & wires comes from the
following sectors: - New Industry setup (Green field or expansion), Housing and constructionof call centres, IT complexes, shopping malls, multiplexes, etc.
New Industrial setup are coming in the form of Industrial plants and administrative buildings
with other electrical and control equipment and machinery that would require power and
control cables. This would drive demand for power cables in industrial sector. Expansion in
industrial sector has been picking up on the back of high GDP growth rate and with revival in
economy.
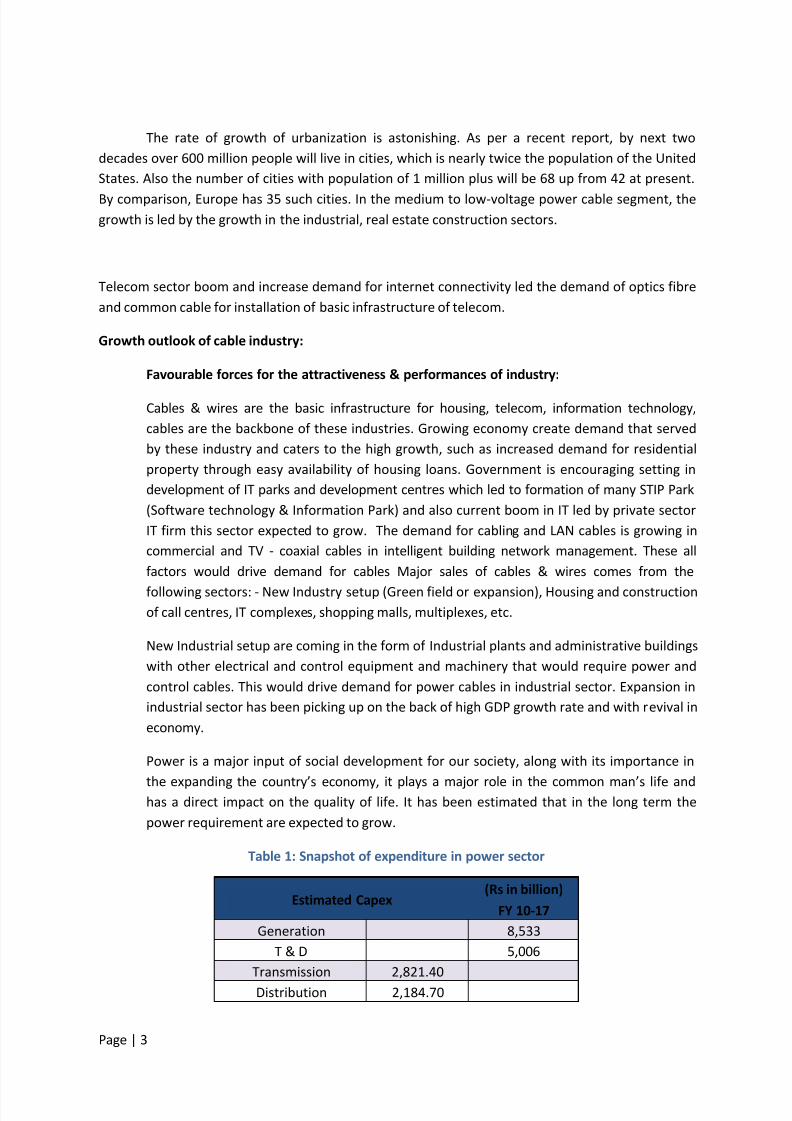
Power is a major input of social development for our society, along with its importance in
the expanding the country’s economy, it plays a major role in the common man’s life andhas a direct impact on the quality of life. It has been estimated that in the long term the
Unfavourable forces for the attractiveness & performances of industry:
Indian wire & cable industry is not looking so promising partially due to highly price sensitive
business and in turn quality standard also get affected, which in turn made this industry to
remunerative business. Cable business is also suffering from fluctuating raw material prices.
Major raw material Copper & aluminium’s prices have stalled the growth of cable industry.
Copper is one of the major raw material used in cable industry, more than 60% of copper
produced worldwide are consumed by wire & Cable industry. There has been continuous
rise in copper prices in last couple of years as the demand increased, mainly due to demand
in china & other developing countries but the supply grew with a comparatively slower pace
and created a demand-supply mismatch that raised the prices to news high.
Due to recent slowdown in Indian economy, industrial growth slowed down and many
infrastructure projects got delayed or stalled and it also led to delayed expansion of many
big industrial projects all of this affected cable & wire industry severely.
Port er’s five forces Analysis
The five-force analysis model developed by Michael E. Porter is one of the most commonly
used framework to analyze the competitive nature of the business environment. These five forcesdetermine the long-run attractiveness / profitability of the market. This framework is used in this
report to analyze and understand the competitive nature of the wire and cable industry in India.
These five forces are as follows:
Threats of New Entrants: According to Microeconomics theory, any profitable industry will attract
newer firms, which will reduce the profitability of all the firms. If the number of new entrants is not
limited by certain measures then the profitability of the industry will tend to be zero. The industry
will be attractive only if the threat of new entrants is low. The threats from new entrants can be
reduced by having entry barriers. In the cable industry, the entry barrier is low, because of which the
threat of new entrants is very high. This is the reason the cable industry has more than 650 players
in the market, lower market shares and no consolidation. The factors because of which are sources
of entry barrier are as follows:
I. Economics of Scale: The wire and cable industry is a volume-driven industry.
However advantage economics of the scale cannot be achieved because even big
manufacture such as Finolex Cable, which is the third largest producer representabout 5% of the market share. Due to presence of large no. of small-scale producer
the price of products are very competitive and the profit margin is very less. Table 3,
provides the profits margin of Finolex cables which varies from 4%-6%.
Table 3: Profit margin of Finolex Cable over the period of 2008-2012
Finolex Cable
Mar '12 Mar '11 Mar '10 Mar '09 Mar '08
Total Income 2,034.87 2,088.35 1,630.85 1,214.69 1,437.14
Reported NetProfit 98.19 86.78 57.63 -35.49 88.92
Reported NetProfit %
5% 4% 4% -3% 6%
II. Product Differentiation: Since in the wire and cable industry the product are
standardized and very little customization is possible very little product
differentiation can be offered to customers. Hence, the threats from new entrants
are high.
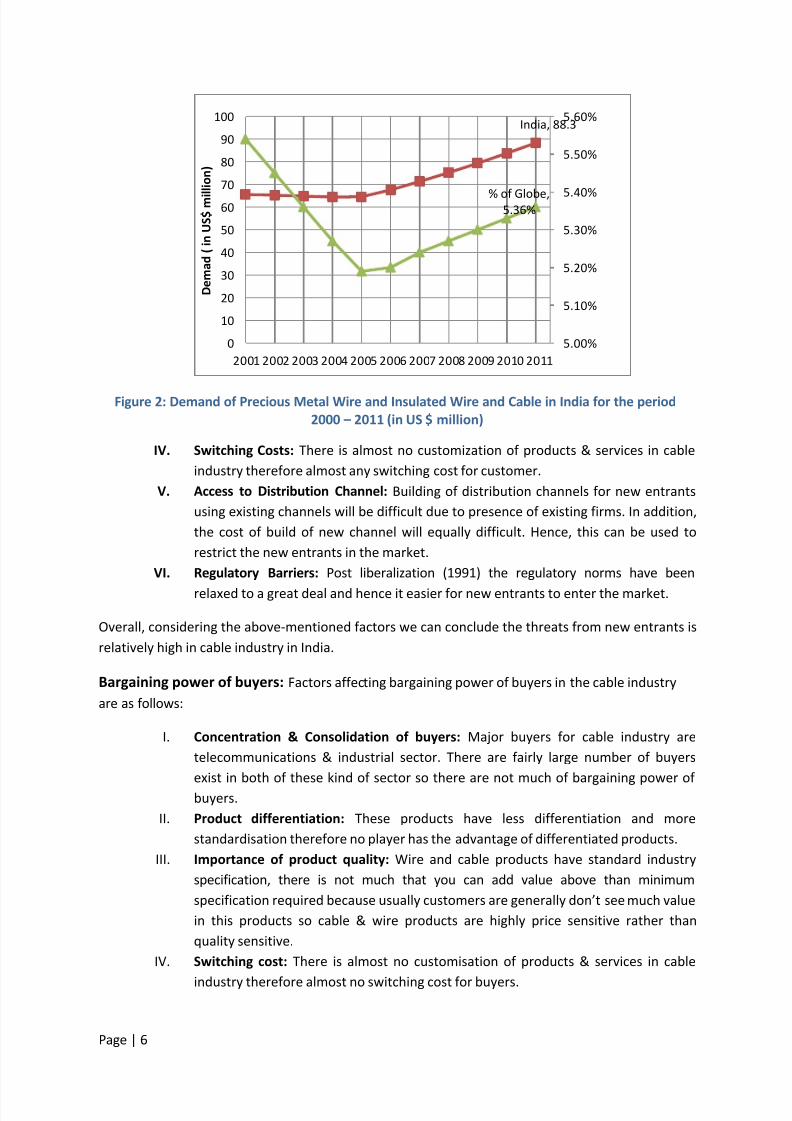
III. Capital Requirements: Cable industry in India has large no. of small-scale firms,
which produces basic qualities of wire, which are less capital intensive. However,
with the increase in electrification of villages a huge demands for power cables exits.The demands of optical wires increase with the growth of telecomm industry. Also,
Figure 2, given below show a rise in demand in precious metal wire and insulated
wire and cable. Hence, we see that there will be sufficient requirement of CAPEX to
built these capabilities to manufacture special wires. Hence, the capital requirement


![[XLS] · Web viewF14/3437 F14/3433 F14/3432 F14/3431 F14/3430 F14/3422 F14/3417 F14/3411 F14/3398 F14/3397 F14/3396 F14/3394 F14/3393 F14/3392 F14/3391 F14/3388 F14/3387 F14/3386](https://static.documents.pub/doc/80x56/5af067057f8b9ad0618e00da/xls-viewf143437-f143433-f143432-f143431-f143430-f143422-f143417-f143411.jpg)


