2 About this Industry 2 Industry Definition 2 Main Activities 2 Similar Industries 3 Additional Resources 4 Industry at a Glance 5 Industry Performance 5 Executive Summary 5 Key External Drivers 6 Current Performance 8 Industry Outlook 11 Industry Life Cycle 13 Products & Markets 13 Supply Chains 13 Products & Services 15 Demand Determinants 15 Major Markets 17 International Trade 19 Business Locations 21 Competitive Landscape 21 Market Share Concentration 21 Key Success Factors 21 Cost Structure Benchmarks 23 Basis of Competition 23 Barriers to Entry 24 Industry Globalisation 26 Major Companies 26 Nestle Australia Ltd 27 Unilever Australia (Holdings) Proprietary Limited 28 Mars Australia Pty Ltd 30 Operating Conditions 30 Capital Intensity 31 Technology & Systems 31 Revenue Volatility 32 Regulation & Policy 32 Industry Assistance 34 Key Statistics 34 Industry Data 34 Annual Change 34 KeyRatios 35 Jargon & Glossary IBISWorld Industry Report C1199 Tea, Coffee and Other Food Manufacturing in Australia May 2015 Ryan Lin Change is brewing: Product innovation is driving growth in consumer demand www.ibisworld.com.au | (03) 9655 3881 | [email protected]
WWW.IBISWORLD.COM.AU Tea, Coffee and Other Food Manufacturing in Australia May 2015 2
Companies in the Tea, Coffee and Other Food Manufacturing industry manufacture food products that are not classified elsewhere. These products include coffee, tea, dressings, seasonings, flavourings, herbs, spices, yeast, yeast
extracts, ice, honey, salt and prepared meals. Manufacturers in this industry procure raw materials and process them into various finished products that are subsequently sold to wholesalers, retailers and related food manufacturers.
The primary activities of this industry are
Coffee roasting and processing
Tea processing and blending
Flavourings, dressings and sauce manufacturing
Blended honey manufacturing
Prepared meal manufacturing
Cooking and table salt manufacturing
Herb and spice manufacturing
Yeast and yeast extract manufacturing
Industrial flavour essence manufacturing
Egg pulping and jelly crystal manufacturing
Industry Definition
Main Activities
Similar Industries
The major products and services in this industry are
Coffee
Food additives
Prepared meals
Salt
Tea
Yeast
About this Industry
C1162 Cereal, Pasta and Baking Mix Manufacturing in AustraliaThis industry manufactures a large range of cereal, pasta and baking mixes.
C1181 Sugar Manufacturing in AustraliaEstablishments in this industry manufacture sugar.
C1813 Basic Inorganic Chemical Manufacturing in AustraliaCompanies in this industry refine salt for industrial purposes.
F3601 General Line Grocery Wholesaling in AustraliaBusinesses in this industry wholesale a range of products including biscuits, canned food, cereals, condiments, cooking oils, eggs, health foods, salt, vinegar and yeast.
WWW.IBISWORLD.COM.AU Tea, Coffee and Other Food Manufacturing in Australia May 2015 3
About this Industry
For additional information on this industry
www.daff.gov.au/abares Australian Bureau of Agricultural and Resource Economics and Sciences
www.acta.org.au Australian Coffee Traders Association Inc.
www.retailmedia.com.au Retail Media
Additional Resources
IBISWorld writes over 500 Australian industry reports, which are updated up to four times a year. To see all reports, go to www.ibisworld.com.au
WWW.IBISWORLD.COM.AU Tea, Coffee and Other Food Manufacturing in Australia May 2015 4
Market ShareNestle Australia Ltd 22.4%
Unilever Australia (Holdings) Proprietary Limited 7.8%
Mars Australia Pty Ltd 7.2%
Key External DriversDemand from supermarkets and grocery storesReal household discretionary incomeDemand from cafes and coffee shopsTrade-weighted index
Key Statistics Snapshot
Industry at a GlanceTea, Coffee and Other Food Manufacturing in 2014-15
Revenue
$5.5bnProfit
$394.6mExports
$560.0mBusinesses
946
Annual Growth 15-20
1.3%Annual Growth 10-15
3.8%
Industry Structure Life Cycle Stage Mature
Revenue Volatility Medium
Capital Intensity Medium
Industry Assistance Low
Concentration Level Medium
Regulation Level Medium
Technology Change Medium
Barriers to Entry Medium
Industry Globalisation High
Competition Level Medium
FOR ADDITIONAL STATISTICS AND TIME SERIES SEE THE APPENDIX ON PAGE 34
% c
hang
e
10
-10
-5
0
5
2109 11 13 15 17 19Year
Demand from supermarkets and grocery stores
SOURCE: WWW.IBISWORLD.COM.AU
% c
hang
e
20
-20
-10
0
10
2107 09 11 13 15 17 19Year
Revenue Employment
Revenue vs. employment growth
Establishments
33.5%NSW
2.8%TAS
26.4%VIC
0.6%ACT
0.2%NT
19.5%QLD
9.5%WA
7.5%SA
SOURCE: WWW.IBISWORLD.COM.AU
p. 26
p. 5
SOURCE: WWW.IBISWORLD.COM.AU
WWW.IBISWORLD.COM.AU Tea, Coffee and Other Food Manufacturing in Australia May 2015 5
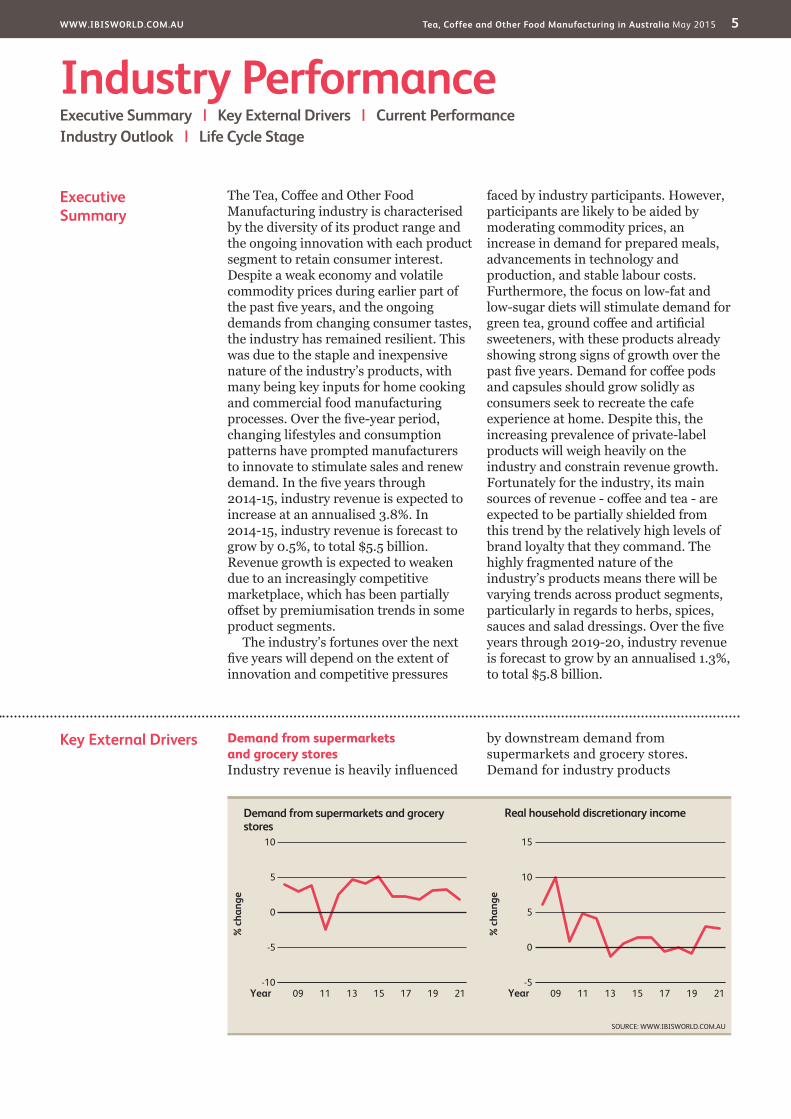
Key External Drivers Demand from supermarkets and grocery storesIndustry revenue is heavily influenced
by downstream demand from supermarkets and grocery stores. Demand for industry products
Executive Summary
The Tea, Coffee and Other Food Manufacturing industry is characterised by the diversity of its product range and the ongoing innovation with each product segment to retain consumer interest. Despite a weak economy and volatile commodity prices during earlier part of the past five years, and the ongoing demands from changing consumer tastes, the industry has remained resilient. This was due to the staple and inexpensive nature of the industry’s products, with many being key inputs for home cooking and commercial food manufacturing processes. Over the five-year period, changing lifestyles and consumption patterns have prompted manufacturers to innovate to stimulate sales and renew demand. In the five years through 2014-15, industry revenue is expected to increase at an annualised 3.8%. In 2014-15, industry revenue is forecast to grow by 0.5%, to total $5.5 billion. Revenue growth is expected to weaken due to an increasingly competitive marketplace, which has been partially offset by premiumisation trends in some product segments.
The industry’s fortunes over the next five years will depend on the extent of innovation and competitive pressures
faced by industry participants. However, participants are likely to be aided by moderating commodity prices, an increase in demand for prepared meals, advancements in technology and production, and stable labour costs. Furthermore, the focus on low-fat and low-sugar diets will stimulate demand for green tea, ground coffee and artificial sweeteners, with these products already showing strong signs of growth over the past five years. Demand for coffee pods and capsules should grow solidly as consumers seek to recreate the cafe experience at home. Despite this, the increasing prevalence of private-label products will weigh heavily on the industry and constrain revenue growth. Fortunately for the industry, its main sources of revenue - coffee and tea - are expected to be partially shielded from this trend by the relatively high levels of brand loyalty that they command. The highly fragmented nature of the industry’s products means there will be varying trends across product segments, particularly in regards to herbs, spices, sauces and salad dressings. Over the five years through 2019-20, industry revenue is forecast to grow by an annualised 1.3%, to total $5.8 billion.
Industry PerformanceExecutive Summary | Key External Drivers | Current Performance Industry Outlook | Life Cycle Stage
% c
hang
e
15
-5
0
5
10
2109 11 13 15 17 19Year
Real household discretionary income
SOURCE: WWW.IBISWORLD.COM.AU
% c
hang
e
10
-10
-5
0
5
2109 11 13 15 17 19Year
Demand from supermarkets and grocery stores
WWW.IBISWORLD.COM.AU Tea, Coffee and Other Food Manufacturing in Australia May 2015 6
Industry Performance
Current Performance
The Tea, Coffee and Other Food Manufacturing industry has been resilient despite facing various adverse conditions over the past five years. Growth opportunities have been weighed down by a saturated marketplace and changing consumer dietary trends and lifestyle patterns, which have affected the broader Food Product Manufacturing subdivision. However, these trends have provided opportunities for new niche players to enter the industry.
Volatility in commodity prices (especially coffee, wheat and sugar) has resulted in higher operating costs, which have restricted growth in profit margins over the past five years. However, the subdued economic climate has been favourable for the industry, since it has led to higher levels of in-home food consumption. This has boosted demand for spices, flavourings, sauces, prepared meals and instant coffee and tea. Over the five years through 2014-15, manufacturers have continued to adapt
their product lines to adequately reflect the needs of consumers. Producers have responded to changing consumer trends by focusing on healthier, organic and ethical food products. In the five years through 2014-15, industry revenue is expected to increase by an annualised 3.8%, to total $5.5 billion. Revenue is forecast to grow by only 0.5% in 2014-15 as heavy competition restricts growth.
Key External Driverscontinued
purchased from supermarkets is driven by consumer tastes and changes in lifestyles. Demand from supermarkets and grocery stores is expected to strengthen over 2014-15, providing an opportunity for the industry.
Real household discretionary incomeWhen household discretionary incomes increase, consumers tend to increase spending on discretionary products. Many of the key products produced by the industry, such as tea and coffee, are considered staple goods and remain popular even during times of economic downturn. Despite this, fluctuations in discretionary income influence the industry’s fortunes, with a fall in income likely to threaten industry growth. In 2014-15, discretionary income levels are anticipated to rise.
Demand from cafes and coffee shopsDemand from cafes and coffee shops reflects Australia’s strong cafe culture. As demand from cafes and coffee shops increases, IBISWorld expects that demand will increase for industry products such as tea and coffee. In 2014-15, demand from cafes and coffee shops is expected to increase.
Trade-weighted indexA high Australian dollar means that exports become more expensive for foreign markets, and imports become comparatively cheaper. This reduces the industry’s potential to export products made domestically, and leads to a growing dependence on imports to satisfy domestic demand. In 2014-15, the trade-weighted index is anticipated to decline.
% c
hang
e
15
-10
-5
0
5
10
2107 09 11 13 15 17 19Year
Industry revenue
SOURCE: WWW.IBISWORLD.COM.AU
WWW.IBISWORLD.COM.AU Tea, Coffee and Other Food Manufacturing in Australia May 2015 7
Industry Performance
Resilient demand The industry performed well in the wake of the global financial crisis. The years following the downturn benefited the industry. Many cash-strapped consumers chose to prepare meals at home rather than eat out, and traded down from more expensive products. Consequently, demand for prepared meals, herbs, spices, flavourings and sauces has increased over the period. Sales of many food products have also benefited from the popularity of reality TV cooking shows. These shows have increased interest in home cooking, leading viewers to recreate recipes from the programs. This has resulted in stronger demand for a broader range of products including
herbs, spices, flavourings and sauces.The sustainability and organic trends
have grown in the past five years, as consumers have become more aware of the ethics surrounding global food sourcing and sustainability. This has had a major effect on the industry, and on the tea and coffee segments in particular. Producers have responded to the marketplace by introducing products that have organic or fair trade certification, such as that of the Rainforest Alliance. Fast-food outlets have also respond to these trends. For example, McDonald’s coffee products display the Rainforest Alliance’s fair trade certification.
Profit and participation
Industry profit is estimated to account for 7.2% of revenue in 2014-15. Profit has fluctuated over the past five years, in conjunction with input costs. Despite this, many of the industry’s major players have managed to post increases in profit by passing unexpected cost increases down the supply chain. The high level of brand loyalty commanded by companies like Nestle and Mars (especially in the
coffee, tea and prepared food segments) has allowed them to pass costs on to consumers during periods of high operating costs.
The number of industry operators is expected to grow over the five years through 2014-15, despite major players engaging in a number of acquisitions. Opportunities for niche players have also emerged as consumer tastes have
Tea and coffee boom The coffee segment, which is the industry’s largest source of revenue, has undergone dramatic changes over the past decade. Australia’s coffee market has become highly sophisticated and competitive, especially in capital cities, where consumers tend to be brand loyal and discerning in their preferences. In 2014-15, the coffee segment is estimated to generate revenue of $1.3 billion. The increasing sophistication of the Australian coffee market is evident in the growth of the pure coffee market (which is comprised of the premium, roasted and ground coffee segments). This means that more consumers are buying coffee bean products instead of instant coffee. Growth in this segment has been driven by soaring demand from both cafes and households.
IBISWorld estimates that more than one billion cups of coffee are consumed in Australian cafes, restaurants and other outlets each year, representing a 65.0% increase over the past 10 years. This phenomenal growth has been driven by Australia’s booming coffee culture. As a result, instant coffee has fallen as a share of total coffee consumed.
In comparison, the tea segment has grown slowly over the past decade. Over the past five years, however, fruit, herbal and green tea sales have grown strongly. This growth has been largely driven by the purported health benefits of these teas, such as the presence of antioxidants. The strong health consciousness of Australian consumers has meant that interest in tea for its health properties has jumped to previously unseen levels.
WWW.IBISWORLD.COM.AU Tea, Coffee and Other Food Manufacturing in Australia May 2015 8
Industry Performance
Profit and participationcontinued
become more sophisticated. Over the period, wages are expected to marginally increase to account for an estimated 14.6% of revenue in 2014-15. Despite rising establishment numbers, industry employment has declined as
new entries are typically small-scale manufacturers. At the same time, larger industry operators have reduced their overall reliance on labour through rising automation and streamlined production.
Industry Outlook
The Tea, Coffee and Other Food Manufacturing industry is forecast to grow at an annualised 1.3% over the five years through 2019-20, to total $5.8 billion. In 2015-16, revenue is expected to rise by 0.4%. This low growth will be due to the ongoing evolution in consumer tastes and strong competition within the industry. However, industry operators will be aided by moderating commodity prices, an increase in
demand for prepared meals, and advancements in technology and production. Industry employment is expected to be largely stagnant while wages are forecast to grow at a stronger rate. Robust demand for fair trade and organic products is expected to spearhead the tea and coffee segments of the industry, while the rising prevalence of private-label products will weigh on industry growth.
International trade The industry has faced some radical changes over the past decade. These have included reductions in tariffs and other forms of government prohibitions, increased foreign ownership, rationalisation of plants and an increased focus on exports. Growing competition from overseas imports and the sourcing of production inputs from low-cost countries have also affected the industry.
In the five years through 2014-15, industry exports are expected to grow slowly, at an annualised 1.5%, to account for 10.2% of industry revenue. The fallout from the global financial crisis and the strength of the Australian dollar are primarily responsible for the slow export growth, as domestic products have remained expensive in foreign markets. However, export growth has been aided by the signing of a number of free trade agreements, especially those across Asia.
Australia has historically been a net importer of the industry’s products,
including coffee, tea, sauces, and industrial flavouring and essences. For some product lines, global players have been able to exploit their brand power, which has limited the ability of some local manufacturers to compete. However, the growth in imports has largely been due to the increasingly diverse range of industry products, with domestic manufacturers unable to keep up with expanding and evolving consumer tastes and overseas production capabilities. Imports are projected to increase by an annualised 5.2% in the five years through 2014-15, to account for 21.5% of domestic demand.
The industry has faced growth in imports due to the increasingly diverse range of products offered
WWW.IBISWORLD.COM.AU Tea, Coffee and Other Food Manufacturing in Australia May 2015 9
Industry Performance
Opportunities and challenges
The increase in the consumption of foods prepared at home is expected to sustain the industry in the short term. This trend will be supported by the continuing popularity of celebrity chefs and TV cooking shows, which encourage viewers to replicate the recipes at home.
As obesity has emerged as one of Australia’s most pressing health concerns, consumers are adopting healthier eating habits and have been more cautious about the nutritional content of their food. These trends are expected to drive the growth of healthy prepared meals and beverages, such as green tea. Australia’s reputation for quality and innovation in agriculture and food production is expected to result in the development of new functional foods, increased shelf lives of products and expansion into new markets. Over the next five years, major industry players such as Nestle and Unilever are expected to continue to invest considerable resources into product innovation and development.
The rising prevalence of private-label grocery products will weigh heavily on industry performance over the next five years. Supermarket giants Woolworths and Coles are expected to capitalise on
their dominant market positions and ongoing consumer demand for cheaper groceries, and greatly increase their private-label offerings over the period. While strong brand loyalty among consumers should prevent significant private-label encroachment into tea and coffee, other industry products (including spices, salt, flavourings and prepared meals) will come under assault from private labels. Since all of these products are manufactured within the industry, rising sales of private-label products will limit returns to manufacturers, thereby constraining industry revenue over the period. This will also restrict growth in the number of establishments and enterprises as potential operators will be less inclined to start operations. Over the five years through 2019-20, enterprise and establishment numbers are forecast to decline at an annualised 0.5% and 1.5%, respectively.
Tea and coffee growth
Over the next five years, consumers are expected to move more towards premium coffee and tea products, driven by premiumisation and the desire to recreate the cafe experience at home. This trend will further help the growth of single-origin teas and coffees. In the coffee segment, sales to cafes are expected to grow strongly, as will sales of ground and pure coffee to the in-home market. Sales of coffee pods and capsules are also expected to boom over the next five years. The use of coffee in food manufacturing is anticipated to rise, especially as the expansion of consumer demand gives rise a range of new flavours and ingredients.
Consumer awareness of health and
wellbeing is expected to benefit the green and herbal teas market, given the increasing public perception of the health benefits of these products. Sales of fair trade and organic products have grown dramatically despite the subdued economic environment, and are expected to spearhead the beverage segments of the industry over the next five years. Industry revenue will also be bolstered by the continuing trend of eating at home, underpinned by rising living costs and the ongoing popularity of TV cooking shows. Despite these trends, more buoyant economic conditions are likely to encourage certain demographics to eat out at restaurants and trade up from cheaper packaged meals.
Industry revenue will be constrained over the next five years as sales of private-label products rise
WWW.IBISWORLD.COM.AU Tea, Coffee and Other Food Manufacturing in Australia May 2015 10
Industry Performance
Profitability and international trade
The Tea, Coffee and Other Food Manufacturing industry is expected to remain profitable over the next five years, with profit averaging 7.0% of revenue. However, this represents a marginal decline from 2014-15. While strong demand for premium and organic products will bolster profitability, rising input costs will continue to be the major burden on industry profitability. Additionally, gains from production efficiencies will likely be partially offset by higher spending on advertising and marketing activities. The growth of private labels is also expected to weigh on industry margins.
IBISWorld expects exports to rebound and perform strongly over the next five years. Exports are forecast to grow by an annualised 5.2% to account for 12.4% of industry revenue in 2019-20 due to growing demand from emerging Asian markets and a weaker Australian dollar. The development of free trade relationships with China, Japan and South Korea will also aid export growth
to the region, especially as rising incomes across the Asia-Pacific region spur on demand for Australian food items. The strong presence of the industry’s major players in overseas markets, and their ease of access to resources and market knowledge, will also assist export growth.
The value of competing imports is also expected to increase over the next five years. Imports are forecast to grow by an annualised 2.1% over the next five years, to account for 22.6% of domestic demand in 2019-20. Free trade agreements with China, Thailand, Singapore, Japan, South Korea, New Zealand and the United States are expected to substantially reduce import tariffs and quotas to ease movement of goods and services between the countries. However, increased import penetration may erode the market share of domestic producers as they struggle to compete with the lower prices. This will require them to engage in aggressive marketing strategies and clever innovations to defend and maintain market share.
WWW.IBISWORLD.COM.AU Tea, Coffee and Other Food Manufacturing in Australia May 2015 11
Industry PerformanceThere is a market emphasis on short product lives
Technology trends relate to product performance and the speed of development
Marketing and advertising activities are coupled with low costs in the industry
Important strategic choices are made based on quality, responsiveness and flexibility of industry products
Life Cycle Stage
SOURCE: WWW.IBISWORLD.COM.AU
20
15
10
5
0
-5
-10
% G
row
th in
sha
re o
f eco
nom
y
% Growth in number of establishments
-10 -5 0 5 10 15 20
DeclineShrinking economicimportance
Quality GrowthHigh growth in economic importance; weaker companies close down; developed technology and markets
MaturityCompany consolidation;level of economic importance stable
Quantity GrowthMany new companies; minor growth in economic importance; substantial technology change
Key Features of a Mature Industry
Revenue grows at same pace as economyCompany numbers stabilise; M&A stageEstablished technology & processesTotal market acceptance of product & brandRationalisation of low margin products & brands
Cereal, Pasta and Baking Mix Manufacturing
Ice Cream ManufacturingSugar Manufacturing
Bread Production
Tea, Coffee and Other Food Manufacturing
WWW.IBISWORLD.COM.AU Tea, Coffee and Other Food Manufacturing in Australia May 2015 12
Industry Performance
Industry Life Cycle The industry is in the mature stage of its life cycle, demonstrated by a saturated market and a range of well-established products and players. The primary concern for manufacturers is to maintain and defend market share and induce sales growth through timely innovation and new product introductions. As some operators have struggled to do this, industry participation has declined over the past five years. In the 10 years through 2019-20, industry value added is expected to increase by an annualised 2.5%, slightly underperforming Australia’s GDP which is estimated to increase by 2.7% over the same period. This suggests that the industry is contributing less to the overall economy.
Over the past five years, niche and
specialised products have led industry growth, especially by new entrants who have focused on the growing trend of premiumisation and niche markets. This has been particularly evident in the organic and fair trade segments of the market, which have grown robustly. However, certain manufacturers have been slow to adopt changing trends, simply re-formatting or re-packaged products in an attempt to stimulate demand. Further, as most of the products supplied by the industry are well established, it is unlikely that future demand will be driven by interest from consumers. There are, however, opportunities for innovative and proactive producers to rouse demand, such as the rapidly expanding packaged fresh meals segment.
This industry is Mature
WWW.IBISWORLD.COM.AU Tea, Coffee and Other Food Manufacturing in Australia May 2015 13
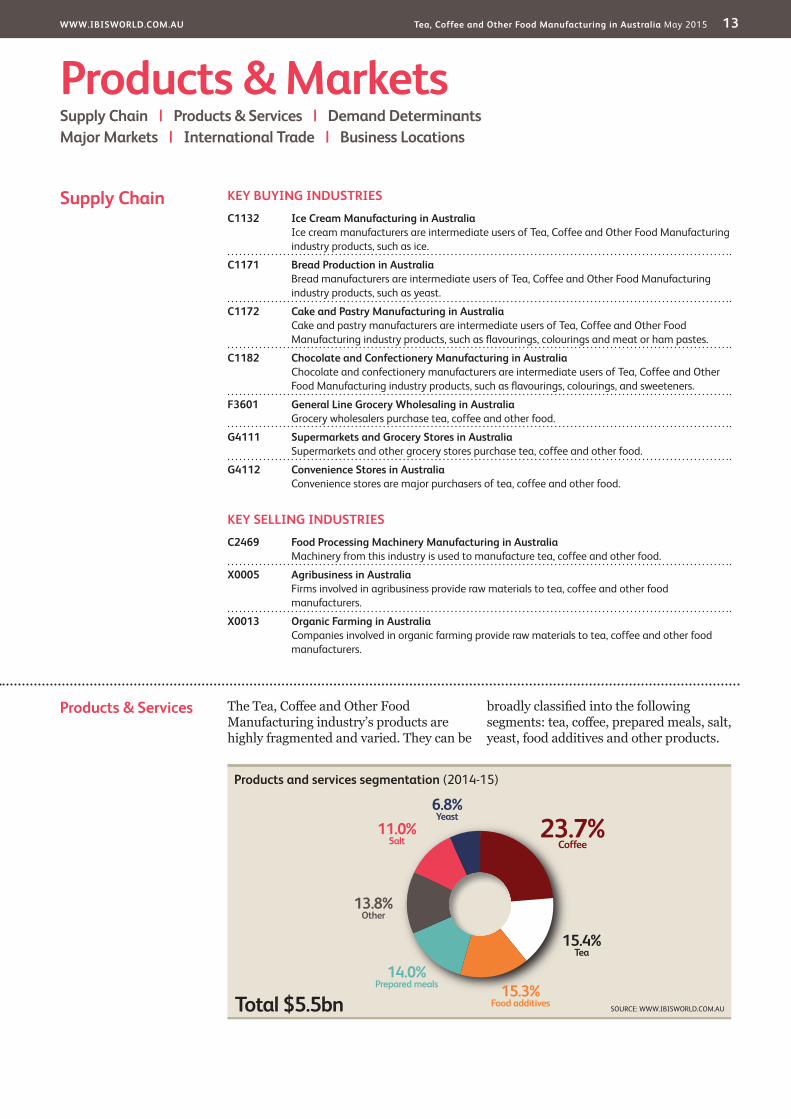
Products & Services The Tea, Coffee and Other Food Manufacturing industry’s products are highly fragmented and varied. They can be
broadly classified into the following segments: tea, coffee, prepared meals, salt, yeast, food additives and other products.
KEY BUYING INDUSTRIES
C1132 Ice Cream Manufacturing in Australia Ice cream manufacturers are intermediate users of Tea, Coffee and Other Food Manufacturing industry products, such as ice.
C1171 Bread Production in Australia Bread manufacturers are intermediate users of Tea, Coffee and Other Food Manufacturing industry products, such as yeast.
C1172 Cake and Pastry Manufacturing in Australia Cake and pastry manufacturers are intermediate users of Tea, Coffee and Other Food Manufacturing industry products, such as flavourings, colourings and meat or ham pastes.
C1182 Chocolate and Confectionery Manufacturing in Australia Chocolate and confectionery manufacturers are intermediate users of Tea, Coffee and Other Food Manufacturing industry products, such as flavourings, colourings, and sweeteners.
F3601 General Line Grocery Wholesaling in Australia Grocery wholesalers purchase tea, coffee and other food.
G4111 Supermarkets and Grocery Stores in Australia Supermarkets and other grocery stores purchase tea, coffee and other food.
G4112 Convenience Stores in Australia Convenience stores are major purchasers of tea, coffee and other food.
KEY SELLING INDUSTRIES
C2469 Food Processing Machinery Manufacturing in Australia Machinery from this industry is used to manufacture tea, coffee and other food.
X0005 Agribusiness in Australia Firms involved in agribusiness provide raw materials to tea, coffee and other food manufacturers.
X0013 Organic Farming in Australia Companies involved in organic farming provide raw materials to tea, coffee and other food manufacturers.
Products & MarketsSupply Chain | Products & Services | Demand Determinants Major Markets | International Trade | Business Locations
Supply Chain
Products and services segmentation (2014-15)
Total $5.5bn
23.7%Coffee
11.0%Salt
15.4%Tea
6.8%Yeast
15.3%Food additives
14.0%Prepared meals
13.8%Other
SOURCE: WWW.IBISWORLD.COM.AU
WWW.IBISWORLD.COM.AU Tea, Coffee and Other Food Manufacturing in Australia May 2015 14
Products & Markets
Products & Servicescontinued
TeaTea accounts for an estimated 15.4% of industry revenue in 2014-15. Demand for tea is growing quickly, although from a much smaller base than coffee. Tea bags have grown at the expense of loose tea during the past decade due to their convenience. This has resulted in an overall decline in volume and rise in value of tea. Over the past five years, there has also been strong growth in green and herbal teas, and this has increased this segment’s share of industry revenue. IBISWorld expects that the overall increase in the popularity of tea has been driven by its perceived health properties (such as the presence of antioxidants) and the negligible levels of carbohydrates, sugar and fat.
CoffeeCoffee accounts for an estimated 23.7% of industry revenue. This portion has been increasing over the past five years with growth across the instant, premium, ground and roasted segments. The pure coffee segment has shown strong growth due to Australia’s ongoing preference for top-quality coffees. Demand for coffee has been relatively resilient over the past five years, as consumers’ coffee purchasing habits have remained relatively unchanged during periods of weaker economic conditions. Fair trade coffee has had the strongest growth in the segment over the past five years. IBISWorld expects that while coffee is more commonly consumed than other industry products, a large portion of coffee is imported, with South American imports making up the majority of imports.
Prepared mealsPerishable prepared meals account for an estimated 14.0% of industry revenue in 2014-15. These include packaged prepared meals and staples such as pasta, rice, soup, salad, peeled and cut vegetables, and fresh pizza. This segment is expected to have remained relatively stable as a share of industry revenue over the past five years. In the years after the
global financial crisis, weak economic conditions have forced some consumers to shift from dining out to prepared meals. As prepared meal production has become more innovative over the past five years, time-conscious consumers have also turned to prepared meals as an alternative. Despite this, the popularity of home cooking, and the health consciousness of consumers have often kept certain consumer groups at bay, especially those that prefer fresh over pre-cooked meals.
SaltSalt is expected to account for 11.0% of industry revenue in 2014-15. Salt is used in the production of a range of foods, and is a staple in household food preparation. Similarly to the prepared meals segment, the level of home cooking influences sales of salt. Over the past five years, premium sea salt has grown the strongest in the salt segment. However, the overall segment has fallen in terms of its contribution to revenue.
Food additivesHerbs, spices, flavourings, essences, sauces and dressings make up a significant portion of industry revenue. In the past five years, the share of this segment has been steadily increasing. Consumers have expanded their tastes to include a greater range of gourmet food additives and a variety of ethnic and international foods - a trend driven by demographic shifts in the Australian population. This segment is expected to come under most pressure from private-label products over the next five years.
YeastYeast and yeast extract account for an estimated 6.8% of industry revenue. Yeast is used mainly in baking, brewing and other beverage manufacturing. Demand for yeast has been driven by rising sales of premium and artisan bread, with major supermarkets expanding in-store bakeries. However, yeast has fallen in proportion to the overall industry due to other segments performing strongly.
WWW.IBISWORLD.COM.AU Tea, Coffee and Other Food Manufacturing in Australia May 2015 15
Products & Markets
Major Markets The Tea, Coffee and Other Food Manufacturing industry’s major markets are dominated by grocery stores and grocery wholesalers. This is largely due to the dominance of the major supermarkets, which have become the primary point-of-sale for industry products.
Grocery wholesalers and retailersGrocery wholesalers and retailers represent the largest buyers of the
industry’s products, accounting for 58.5% of industry sales in 2014-15, and have grown over the past five years. Industry products are redistributed via wholesalers to supermarket chains and grocery outlets throughout the country. Supermarkets and grocery stores account for around two-thirds of total food and liquor retailing in Australia. Over the coming years, large retail chains such as Woolworths and Coles are expected to continue to deal directly with
Demand Determinants
Demand for industry products is largely reflected by consumer conditions. Typically, a rise in discretionary income is directly proportionate to increased consumption expenditure. However, in some cases an increase in income will encourage consumers to switch to brands that are more expensive rather than increase the volume purchased. For example, consumers may prefer switching from tea bags and soluble coffees to specialty teas and premium coffee blends.
On the other hand, given the discretionary nature of most of the industry’s products, increases in price will adversely affect demand as consumers switch to substitute products. For example, beverages like tea and coffee compete with other non-alcoholic drinks, such as soft drinks, juice and cordial.
Over the past five years there has been
a change in the lifestyles and attitudes of consumers and their consumption patterns. Changes in population demographics and ethnicity have given rise to new tastes and preferences, driving manufacturers to adapt their product lines to meet these needs. For example, consumers are increasingly more health conscious and time poor, thereby demanding more convenient, healthy yet tasty products.
The introduction of new product varieties can renew demand for stagnant product categories. A growth area within the industry has been the development of niche products such as those targeting the health-conscious consumer. The prepared healthy meals segment is one such category that has been growing strongly over the past five years. Other strategies like brand extensions have also worked in the past to maintain consumer interest and increase usage.
Products & Servicescontinued
OtherThis product segment includes dessert and beverage mixes, honey, ginger, hop extract, pearl barley, egg pulp and jelly crystals. Sales of mixes have grown significantly over the past five years, as manufacturers have made inroads to creating healthier
dessert and beverage mixes. Honey has also grown in popularity, as its natural properties have remained popular with many consumers. Over the past five years, this segment has grown as a share of industry revenue due to the rapidly increasing range of products.
WWW.IBISWORLD.COM.AU Tea, Coffee and Other Food Manufacturing in Australia May 2015 16
Products & Markets
Major Marketscontinued
manufacturers, increasing their share of the industry. However, a growing range of products will mean that wholesalers will be better placed to capture multiple lines of new products, coordinating demand and delivery of niche and specialty items that larger retailers have yet to stock.
Food manufacturersFood manufacturers represent the second-largest market for the industry, accounting for an estimated 19.3% of revenue in 2014-15. Products such as yeast, baking powder, sweeteners, flavourings and seasonings are used to manufacture foods in related food and beverage industries, or are sometimes packaged with prepared foods. Industry players typically establish direct supplier relationships with producers of products such as beverages, confectionery and bread. Over the coming years, this segment is expected to grow slightly, as food manufacturers continue to provide an increasing range of products.
Food service establishmentsIBISWorld estimates that 12.0% of industry sales are made to companies operating in the hospitality industries. Motels, hotels, restaurants, fast-food
chains and convention centres purchase large quantities of food products for use in their kitchens. Sometimes these products are purchased directly from manufacturers at reduced costs. Like supermarkets, large restaurant chains often wield considerable power in supply relationships with the industry. Over the past five years, food service establishments have been increasingly dealing directly with manufacturers, especially smaller niche manufacturers, in order to cut costs.
Export marketsThe industry also sells its products in foreign markets. While the export market is small compared with other downstream markets, exports still contribute an estimated 10.2% of industry revenue in 2014-15. Export markets have declined as a share of industry revenue over the past five years as a high Australian dollar has made exports relatively costly. New Zealand is the primary export market, mainly due to its proximity and ease of access. However, in the past five years, Singapore, Japan, Hong Kong and Thailand have emerged as major export destinations, reflecting the economic rise of the Asia-Pacific region.
Major market segmentation (2014-15)
Total $5.5bn
58.5%Grocery wholesalers and retailers
19.3%Food manufacturers
12.0%Food service establishments
10.2%Export markets
SOURCE: WWW.IBISWORLD.COM.AU
WWW.IBISWORLD.COM.AU Tea, Coffee and Other Food Manufacturing in Australia May 2015 17
Products & Markets
International Trade Australian tea, coffee and other food manufacturers cater to the majority of the domestic demand. Domestic manufacturers satisfy almost 80% of domestic demand, with the remainder sourced from overseas.
ExportsOver the five years through 2014-15, exports are estimated to increase at an annualised 1.5%, to reach $560.0 million. Growth was impeded by the relatively low value of the industry’s products and the strength of the Australian dollar over much of the past five years. The majority of industry products go to nearby countries due to the products’ low value and the significant transport costs, making it often uneconomical to transport over long distances. New Zealand is expected to account for the largest share of exports, at 29.5%, followed by a number of Asia-Pacific nations such as Singapore and Japan. The industry’s major players account for the majority of exports, owing to their size, international presence and easy access to foreign markets. Over the past five years, exports have been less crucial
for industry growth, with exports falling from 11.4% of industry revenue in 2009-10, to 10.2% in 2014-15.
ImportsIn the five years through 2014-15, imports are expected to increase at an annualised 5.2%, to reach $1.3 billion, making up 21.5% of domestic demand. In terms of markets, New Zealand is expected to account for the largest amount of imports at 13.7%, followed by the United States, Switzerland and
Imports From...
Total $1.3bn
7.8%Netherlands
10.5%Switzerland
11.5%United States
13.7%New Zealand
56.5%Other
Exports To...
Total $560.0m
34.3%Other
29.5%New Zealand
19.5%Singapore
11.4%Japan
5.3%United States
Year: 2014-15SIZE OF CHARTS DOES NOT REPRESENT ACTUAL DATA SOURCE: ABS
$ m
illio
n
1000
-2000
-1500
-1000
-500
0
500
2107 09 11 13 15 17 19Year
Exports Imports Balance
Industry trade balance
SOURCE: WWW.IBISWORLD.COM.AU
Level & Trend Exports in the industry are Medium and Increasing
Imports in the industry are Medium and Increasing
WWW.IBISWORLD.COM.AU Tea, Coffee and Other Food Manufacturing in Australia May 2015 18
Products & Markets
International Tradecontinued
Netherlands. Due to the large variety of products, more than 50% of industry products are from a range of other importing nations. IBISWorld expects that the majority of imports are specialty goods such as teas and herbs
native to regions outside of Australia. The diverse range of industry products means that it is difficult for domestic players to produce all of the products, leading to a strong and growing reliance on imports.
WWW.IBISWORLD.COM.AU Tea, Coffee and Other Food Manufacturing in Australia May 2015 19
Products & Markets
SOURCE: WWW.IBISWORLD.COM.AU
TAS2.8
WA9.5
QLD19.5
VIC26.4
NSW33.5
NT0.2
SA7.5
ACT0.6
Establishments (%)
Cold Zone (<10)
<25 <50 Hot Zone (<100) Not applicable
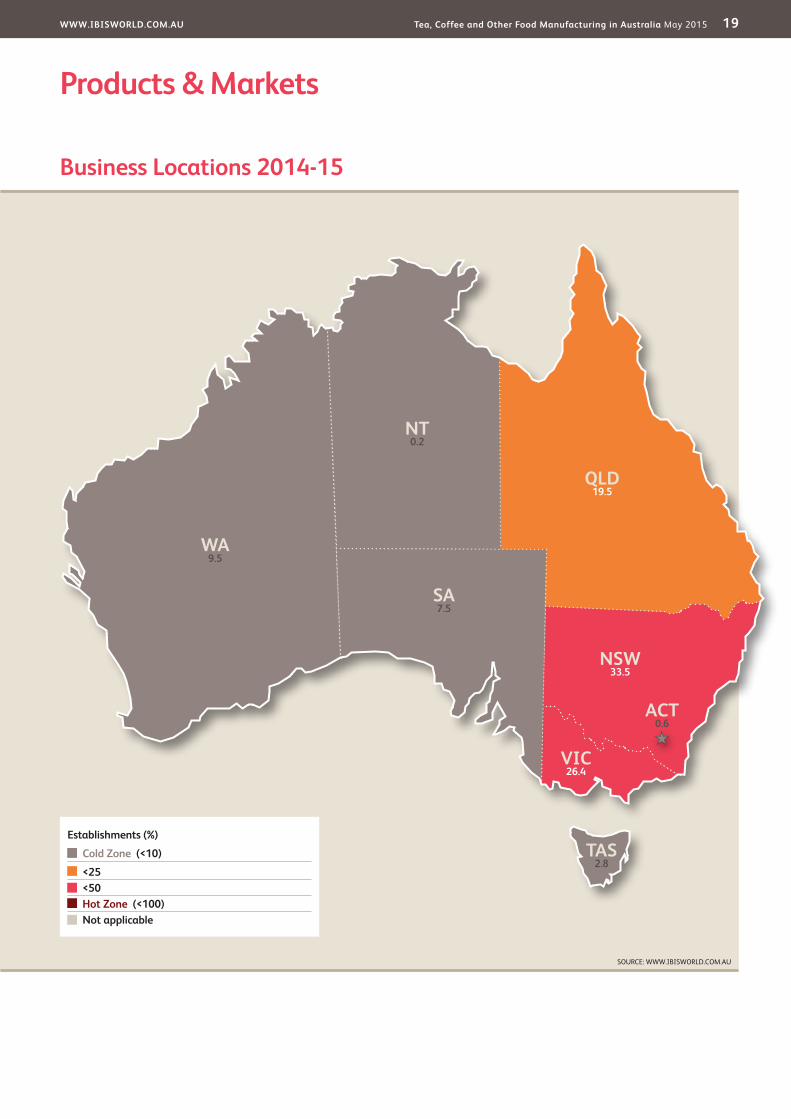
Business Locations 2014-15
WWW.IBISWORLD.COM.AU Tea, Coffee and Other Food Manufacturing in Australia May 2015 20
Products & Markets
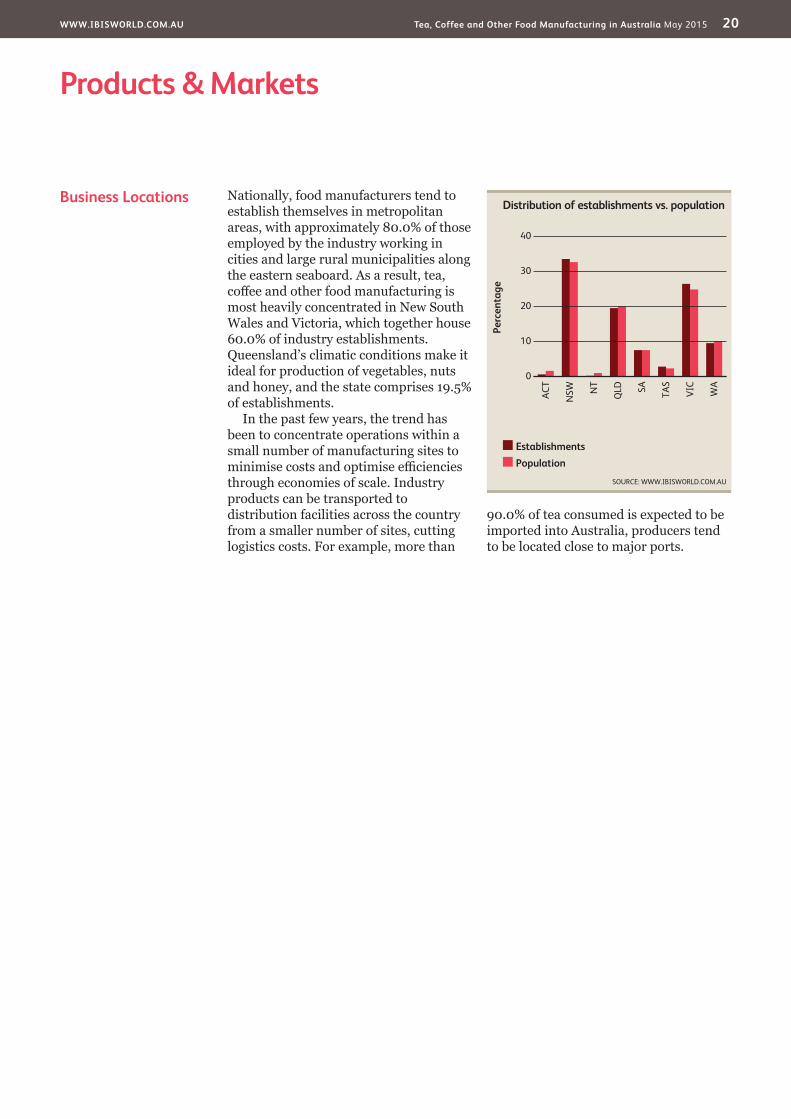
Business Locations Nationally, food manufacturers tend to establish themselves in metropolitan areas, with approximately 80.0% of those employed by the industry working in cities and large rural municipalities along the eastern seaboard. As a result, tea, coffee and other food manufacturing is most heavily concentrated in New South Wales and Victoria, which together house 60.0% of industry establishments. Queensland’s climatic conditions make it ideal for production of vegetables, nuts and honey, and the state comprises 19.5% of establishments.
In the past few years, the trend has been to concentrate operations within a small number of manufacturing sites to minimise costs and optimise efficiencies through economies of scale. Industry products can be transported to distribution facilities across the country from a smaller number of sites, cutting logistics costs. For example, more than
90.0% of tea consumed is expected to be imported into Australia, producers tend to be located close to major ports.
Perc
enta
ge
40
0
10
20
30
WA
ACT
NSW N
T
QLD SA TA
S
VIC
EstablishmentsPopulation
Distribution of establishments vs. population
SOURCE: WWW.IBISWORLD.COM.AU
WWW.IBISWORLD.COM.AU Tea, Coffee and Other Food Manufacturing in Australia May 2015 21
Cost Structure Benchmarks
Depending on the size and scale of production, ease of access to production inputs, level of technology and capital investments, cost structures vary widely among industry players. The larger the manufacturer, the lower per unit cost of production tends to be, as these manufacturers benefit from economies of
scale. However, as large players have expanded their range of products, economies of scale have fallen over the past five years.
ProfitIndustry profit accounts for an estimated 7.2% of revenue in 2014-15, largely stable
Key Success Factors Access to niche marketsIn an industry that is stagnant and mature, product differentiation is one of the most important factors in maintaining market share and increasing sales revenue. The primary goal is to attempt to reduce the directness of competition.
Ability to adapt to changeAnother key factor to industry success is the ability to anticipate and respond to changes in consumer preferences in a timely manner.
Economies of scaleThe scale and breadth of production
largely determines marginal costs while also affecting the volume that a producer is able to supply.
Supply contracts for key inputsReliable contracts with suppliers of key raw materials considerably reduce supply volatility. Guaranteed supplies at fixed prices minimise supply costs and aid production planning.
Ability to pass on cost increasesGiven the volatility of commodity and energy prices, the ability of producers to pass unexpected cost increases down the supply chain is vital to maintaining profitability.
Market Share Concentration
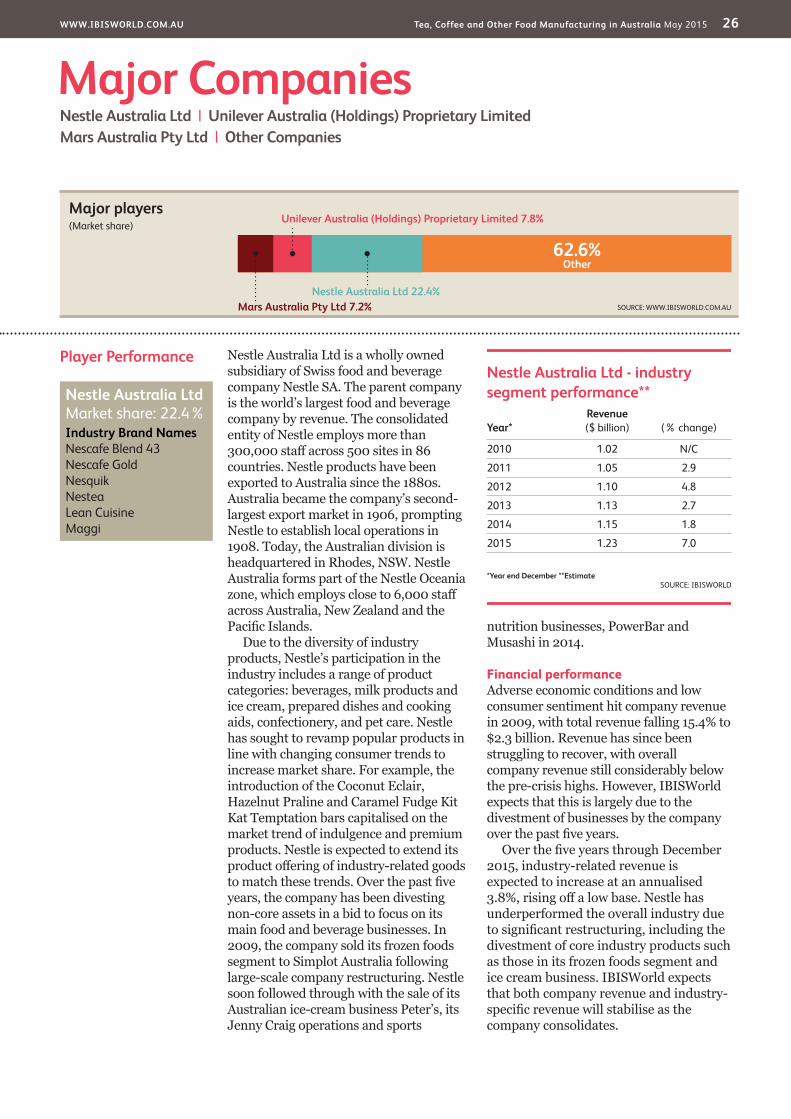
The Tea, Coffee and Other Food Manufacturing industry has a medium level of market share concentration. The top four players are estimated to account for 40.9% of industry revenue in 2014-15. Industry concentration has been mostly stable over the past five years despite major players like Nestle, Mars and Unilever actively focusing on their most profitable operations and engaging in mergers and acquisitions. Smaller industry players focusing on niche products and highly specialised production have entered the industry. This trend has offset any concentration growth within the industry.
In 2014-15, fewer manufacturers are serving wider geographic markets. This has been the result of the rising costs of transportation, ownership consolidation and the extension of the shelf life of products. These factors have forced
smaller industry operators to reduce costs by centralising production facilities. This is especially prevalent for smaller players that have only recently entered the industry and have been unable to build nationwide scale and scope. Despite this, niche and specialised products have given new players the chance to capture a growing segment of the market.
At the other end of the spectrum, consolidation of larger companies is expected to increase in the next five years due to acquisitions, continued product innovation, strong brand loyalty and aggressive marketing initiatives. However, concentration varies between product segments. The highest level of concentration has been in the more generic product segments, while specialised or niche products have had lower levels of concentration.
Competitive LandscapeMarket Share Concentration | Key Success Factors | Cost Structure Benchmarks Basis of Competition | Barriers to Entry | Industry Globalisation
Level Concentration in this industry is Medium
IBISWorld identifies 250 Key Success Factors for a business. The most important for this industry are:
WWW.IBISWORLD.COM.AU Tea, Coffee and Other Food Manufacturing in Australia May 2015 22
Competitive Landscape
Cost Structure Benchmarkscontinued
since 2009-10. The industry is characterised by highly volatile input prices that affect purchase costs and profit margins. The growth of specialty and premium products have helped boost overall industry margins. Manufacturers are faced with high purchase costs and are not always able to pass these price increases down the supply chain. In addition, Australian producers are limited by the sources of their suppliers and are forced to accept high costs during years of rising commodity prices. However, profit margins are expected to grow over the next five years as major players continue to build economies of scale and increase automation.
PurchasesPurchases constitute the largest percentage of industry costs, at approximately 60.5% of revenue in 2014-15. Prices of key production inputs (such as coffee, rice, flour, sugar, potatoes, oils and fats) are the primary drivers of purchase costs. These prices have historically been volatile and unpredictable. Other input materials
required include paperboard containers, plastic packaging and additional ingredients, such as oats, dried fruit, starch, malt, salt, gluten, vitamins, preservatives, colourings, flavourings, emulsifiers and honey. Over the past five years, purchase costs have increased
WagesWages are the second-largest component of industry costs and are expected to account for 14.6% of revenue in 2014-15. Wages as a proportion of revenue have risen slightly from 14.4% in 2009-10. This can be explained by rising niche and specialty manufacturers that require greater labour inputs. Skilled labour (in particular managers and technical staff) will be sought after. This is because the increased level of technological sophistication and automation adopted by larger industry players demands a higher knowledge base for operation and factory management.
OtherExpenses relating to selling, marketing,
Sector vs. Industry Costs
n Profi tn Rentn Utilitiesn Depreciationn Othern Wagesn Purchases
Average Costs of all Industries in sector (2014-15)
Industry Costs (2014-15)
0
20
40
60
Perc
enta
ge o
f rev
enue
80
100
SOURCE: WWW.IBISWORLD.COM.AU
7.9 7.2
60.5
14.6
10.03.2 2.02.5
60.8
14.7
7.83.3 3.61.9
WWW.IBISWORLD.COM.AU Tea, Coffee and Other Food Manufacturing in Australia May 2015 23
Competitive Landscape
Barriers to Entry The industry is characterised by moderate barriers to entry. The biggest threat facing potential entrants is the well-established positions of the industry’s major players, especially in the manufacture of generic goods. Global food companies like Nestle, Mars
and Unilever enjoy high brand and customer loyalty and have considerable resources to invest in advertising and promotions to protect and grow their market share. This give little room for perspective entrants to squeeze into manufacture of generic industry
Basis of Competition The industry has a medium level of competition, with the major players fiercely competing for market share within generic product segments, while smaller industry players will compete less within niche and specialty product segments. The industry operates in a mature market, with per capita consumption of industry products generally remaining steady across a large product base.
Internal competitionCompetition within the industry has traditionally been based on price, with most of the products supplied regarded as essentially homogeneous. This has been particularly important for producers supplying the industrial and food manufacturing industries, as their customers wield tremendous strength and buying power. Price is also an important determinant of demand at the retail level, especially for tea, coffee and prepared meals. The sensitivity of consumers varies greatly between product segments, and is inversely related to the perceived quality of a product or brand. Thus, price is the most critical competitive factor for producers of low-grade, generic brands.
The perceived quality of a particular product or brand will determine the price consumers are willing to pay for it. Brand-loyal customers are not particularly sensitive to changes to price because of the associated perceptions of quality. The importance of branding varies between products segments. Major players, such as Nestle and Unilever, have enormous brand power and spend substantial amounts of money on advertising and promotional campaigns to promote mass market products. Manufacturers of food ingredients that are used as key inputs in intermediate markets, such as bakeries and confectionery manufacturers, have less need to aggressively promote their own products.
External competitionThe industry also competes strongly against imports, which accounts for more than 20.0% of domestic demand. As the Australian consumer palate become increasingly sophisticated, a greater range of products are demanded. Domestic manufacturers are unable to cope with such rapid changes in consumer tastes, resulting in a continual import penetration.
Cost Structure Benchmarkscontinued
promotions and administration are expected to comprise 3.0% of overall industry costs. This represents a relatively small proportion compared with other food manufacturing industries. This is due to many of the products supplied by the industry being used as key inputs in other food manufacturing processes. However, there is a considerable need to invest in advertising and marketing initiatives for
products such as tea, coffee and prepared meals. This is due to fierce competition from niche players. Other costs that can significantly affect the industry include overhead expenses such as distribution, research and development. Collectively, these costs represent an estimated 10.0% of industry revenue. Depreciation, rent and utility costs account for a further combined 7.7% of industry revenue.
Level & Trend Competition in this industry is Medium and the trend is Increasing
Level & Trend Barriers to Entry in this industry are Medium and Steady
WWW.IBISWORLD.COM.AU Tea, Coffee and Other Food Manufacturing in Australia May 2015 24
Competitive Landscape
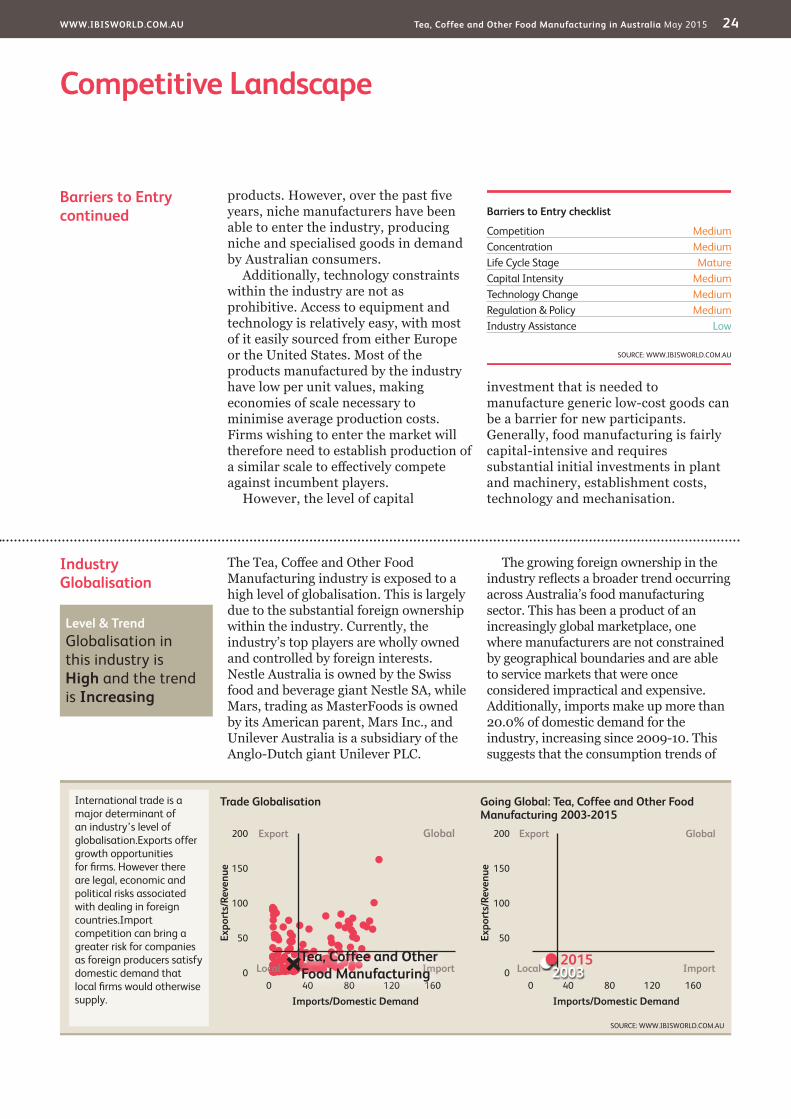
Industry Globalisation
The Tea, Coffee and Other Food Manufacturing industry is exposed to a high level of globalisation. This is largely due to the substantial foreign ownership within the industry. Currently, the industry’s top players are wholly owned and controlled by foreign interests. Nestle Australia is owned by the Swiss food and beverage giant Nestle SA, while Mars, trading as MasterFoods is owned by its American parent, Mars Inc., and Unilever Australia is a subsidiary of the Anglo-Dutch giant Unilever PLC.
The growing foreign ownership in the industry reflects a broader trend occurring across Australia’s food manufacturing sector. This has been a product of an increasingly global marketplace, one where manufacturers are not constrained by geographical boundaries and are able to service markets that were once considered impractical and expensive. Additionally, imports make up more than 20.0% of domestic demand for the industry, increasing since 2009-10. This suggests that the consumption trends of
Barriers to Entrycontinued
products. However, over the past five years, niche manufacturers have been able to enter the industry, producing niche and specialised goods in demand by Australian consumers.
Additionally, technology constraints within the industry are not as prohibitive. Access to equipment and technology is relatively easy, with most of it easily sourced from either Europe or the United States. Most of the products manufactured by the industry have low per unit values, making economies of scale necessary to minimise average production costs. Firms wishing to enter the market will therefore need to establish production of a similar scale to effectively compete against incumbent players.
However, the level of capital
investment that is needed to manufacture generic low-cost goods can be a barrier for new participants. Generally, food manufacturing is fairly capital-intensive and requires substantial initial investments in plant and machinery, establishment costs, technology and mechanisation.
International trade is a major determinant of an industry’s level of globalisation.Exports offer growth opportunities for fi rms. However there are legal, economic and political risks associated with dealing in foreign countries.Import competition can bring a greater risk for companies as foreign producers satisfy domestic demand that local fi rms would otherwise supply.
Export ExportGlobal Global
ImportLocal ImportLocalTea, Coffee and Other Food Manufacturing 2003
2015
Level & Trend Globalisation in this industry is High and the trend is Increasing
WWW.IBISWORLD.COM.AU Tea, Coffee and Other Food Manufacturing in Australia May 2015 25
Competitive Landscape
Industry Globalisationcontinued
Australian consumers are also becoming more globalised, with a rising portion of food needs satisfied by imports. However, exports have grown at a slower rate,
suggesting that the industry is becoming less dependent on export growth, with more emphasis placed on tackling demand at home.
WWW.IBISWORLD.COM.AU Tea, Coffee and Other Food Manufacturing in Australia May 2015 26
Player Performance Nestle Australia Ltd is a wholly owned subsidiary of Swiss food and beverage company Nestle SA. The parent company is the world’s largest food and beverage company by revenue. The consolidated entity of Nestle employs more than 300,000 staff across 500 sites in 86 countries. Nestle products have been exported to Australia since the 1880s. Australia became the company’s second-largest export market in 1906, prompting Nestle to establish local operations in 1908. Today, the Australian division is headquartered in Rhodes, NSW. Nestle Australia forms part of the Nestle Oceania zone, which employs close to 6,000 staff across Australia, New Zealand and the Pacific Islands.
Due to the diversity of industry products, Nestle’s participation in the industry includes a range of product categories: beverages, milk products and ice cream, prepared dishes and cooking aids, confectionery, and pet care. Nestle has sought to revamp popular products in line with changing consumer trends to increase market share. For example, the introduction of the Coconut Eclair, Hazelnut Praline and Caramel Fudge Kit Kat Temptation bars capitalised on the market trend of indulgence and premium products. Nestle is expected to extend its product offering of industry-related goods to match these trends. Over the past five years, the company has been divesting non-core assets in a bid to focus on its main food and beverage businesses. In 2009, the company sold its frozen foods segment to Simplot Australia following large-scale company restructuring. Nestle soon followed through with the sale of its Australian ice-cream business Peter’s, its Jenny Craig operations and sports
nutrition businesses, PowerBar and Musashi in 2014.
Financial performanceAdverse economic conditions and low consumer sentiment hit company revenue in 2009, with total revenue falling 15.4% to $2.3 billion. Revenue has since been struggling to recover, with overall company revenue still considerably below the pre-crisis highs. However, IBISWorld expects that this is largely due to the divestment of businesses by the company over the past five years.
Over the five years through December 2015, industry-related revenue is expected to increase at an annualised 3.8%, rising off a low base. Nestle has underperformed the overall industry due to significant restructuring, including the divestment of core industry products such as those in its frozen foods segment and ice cream business. IBISWorld expects that both company revenue and industry-specific revenue will stabilise as the company consolidates.
Major CompaniesNestle Australia Ltd | Unilever Australia (Holdings) Proprietary Limited Mars Australia Pty Ltd | Other Companies
62.6%Other
Nestle Australia Ltd 22.4%
Unilever Australia (Holdings) Proprietary Limited 7.8%
Mars Australia Pty Ltd 7.2% SOURCE: WWW.IBISWORLD.COM.AU
Major players(Market share)
Nestle Australia Ltd - industry segment performance**
Year*Revenue ($ billion) (% change)
2010 1.02 N/C
2011 1.05 2.9
2012 1.10 4.8
2013 1.13 2.7
2014 1.15 1.8
2015 1.23 7.0
*Year end December **Estimate SOURCE: IBISWORLD
Nestle Australia Ltd Market share: 22.4% Industry Brand Names Nescafe Blend 43 Nescafe Gold Nesquik Nestea Lean Cuisine Maggi
WWW.IBISWORLD.COM.AU Tea, Coffee and Other Food Manufacturing in Australia May 2015 27
Major Companies
Player Performance Unilever Australia (Holdings) Proprietary Limited is a subsidiary of the Anglo-Dutch multinational Unilever PLC, which is one of the world’s largest branded consumer goods companies. It has operations in over 150 countries and a portfolio of over 400 brands. Unilever Australia’s business is organised in three main divisions: food, home and personal care. Many household brand names are among its portfolio, including Bertolli, Bushells, Continental, Flora, Lipton, Raguletto, Dove and Rexona.
The company operates multiple major production sites across Australia and New Zealand. The Continental Foods factory is situated in Melbourne, while the Raguletto, Five Brothers and Chicken Tonight brands are manufactured at a factory in Tatura, VIC. Although Unilever also owns the Lipton, Bertolli and Slim-Fast brands, these products are manufactured outside Australia. The company operates in the industry through its range of seasonings, dessert mixes, specialty sauces, and tea and coffee products.
Growing consumer demand for convenience has driven demand for soups, sauces and other ready-to-eat meals. Continental Cup a Soup product introductions focused on convenience-based packaging improvements, coupled with visible marketing and advertising messages and promotional campaigns. In 2010, the company announced the intention to expand its Ben and Jerry’s ice cream in Australia, with Unilever Australia becoming the holding company for their ice cream business. However, during 2011, global parent company Unilever agreed to sell its US frozen foods business, indicating a possibility that it could also exit the packaged meal segment in Australia.
Financial performanceUnilever Australia has exhibited strong industry-related growth over the past five years. The company’s industry-specific revenue is expected to grow at an annualised 5.8% over the five years through December 2015, in line with industry performance (in nominal terms) over the same period. Over the past five years, the strong sales of Continental products have offset falling sales volumes for the company’s personal- and hair-care products in the Australasian markets. Growth also came from innovation and new product introductions such as Continental Recipe Mixes and Continental Hot Pot. This was coupled with packaging initiatives such as the use of resealable packaging, clearer materials and larger font sizes to make storage and identification easier. In late 2013, the company acquired Tea Too Pty Limited and T2 NZ Limited for an undisclosed sum. This is expected to boost the company’s overall participation within the industry from 2014.
Unilever Australia (Holdings) Proprietary Limited - industry segment performance**
Year*Revenue
($ million) (% change)
2010 322.5 N/C
2011 342.5 6.2
2012 357.9 4.5
2013 366.8 2.5
2014 402.3 9.7
2015 428.5 6.5
*Year end December **Estimate SOURCE: IBISWORLD
Unilever Australia (Holdings) Proprietary Limited Market share: 7.8% Industry Brand Names Continental Bushells Chicken Tonight Raguletto
WWW.IBISWORLD.COM.AU Tea, Coffee and Other Food Manufacturing in Australia May 2015 28
Major Companies
Player Performance Mars Australia is a foreign-owned Australian proprietary company that generates the majority of its income from food manufacturing. The company is wholly owned by Mars Inc., a US-based diversified food manufacturer. The parent company also operates globally in pet care and beverage manufacturing. Mars Inc. services over 100 countries across five continents and owns some of the most iconic brands in the food and beverage world, such as M&M’s, Skittles, Mars Bar and Snickers. The first factory in Australia was built in 1967, and operations have since expanded to six manufacturing sites across the nation, employing more than 2,000 staff across Australia and New Zealand.
In Australia, Mars operates in the Tea, Coffee and Other Food Manufacturing industry through MasterFoods, an Australian food business that Mars acquired in 1967. MasterFoods products and brands are a household name in the food ingredients, spices, dips, spreads, flavourings and sauce categories. The company also owns Uncle Ben’s range of branded rice, sauces and curries; the Dolmio brand of fresh and frozen pasta and sauces; and the Kan Tong range of prepared Asian-inspired dishes.
As a foreign-owned Australia-based company, MasterFoods supplies both local and export markets with its range of prepared meals and kitchen staples. Although most of Mars Australia’s revenue is derived from its domestic operations, the company exports to more than 30 countries, and accounts for a large proportion of the industry’s exports.
Financial performanceMars Australia’s industry-related revenue is expected to account for almost one-third of total company revenue. MasterFoods has performed strongly
over the past decade, fuelled by growing interest in home-cooking and the broader fine dining trend. From a company perspective, Mars’ consolidated accounts reveal a slight upward trend in overall sales revenue.
The growth in cooking at home has been particularly positive for MasterFoods, as consumers have increasingly required spices, flavours, sauces and other products for home cooking. The trend towards gourmet spices and flavourings combined with aggressive marketing has helped keep demand buoyant. IBISWorld expects the company’s industry-related revenue to grow at an annualised 4.5% over the five years through December 2015. This growth is expected to be largely driven by increased volume as more sophisticated cooking becomes increasingly popular. This should positively affect MasterFoods’ sales for food ingredients, spices and dips. Despite this, the company is expected to underperform the overall industry in nominal terms over the five-year period, with niche players rapidly gaining on larger industry operators.
Mars Australia Pty Ltd Market share: 7.2% Industry Brand Names MasterFoods
Mars Australia Pty Ltd - industry segment performance**
Year*Revenue
($ million) (% change)
2010 318.6 N/C
2011 325.7 2.2
2012 338.3 3.9
2013 356.5 5.4
2014 375.2 5.2
2015 396.8 5.8
*Year end December **Estimate SOURCE: IBISWORLD
WWW.IBISWORLD.COM.AU Tea, Coffee and Other Food Manufacturing in Australia May 2015 29
Major Companies
Other Companies The Tea, Coffee and Other Food Manufacturing industry is characterised by a large number of highly fragmented companies. Larger industry players manufacture a wider range of industry products to appeal to a broader range of consumers. Meanwhile, smaller industry players focus on only a few industry products catering for specific markets. This is predominantly due to the diverse nature of industry products, which include a range of dried goods, foods and food condiments. Over the past five years, IBISWorld expects that smaller industry players have grown significantly, capturing much of the growth demonstrated by the industry. Specialisation into niche markets by smaller players has allowed them to gain significant penetration into their target markets. Meanwhile, larger players with a broader range of products on offer have found it comparatively more difficult to build similar penetration into specialty markets, relying on mass market production instead.
Simplot Australia (Holdings) Pty Limited Estimated market share: 3.5%Simplot Australia (Holdings) Pty Limited is wholly owned by the US-based J. R. Simplot Inc. The company is one of the world’s largest frozen-potato processors and beef cattle producers, and ranks as a major agricultural fertiliser manufacturer across the North American region. Simplot Australia was founded in 1995, when its parent acquired some of the country’s most popular food brands such as Edgell, Chiko, Birds Eye, Harvest, Plumrose and Leggo’s. The company is the market leader in the frozen-fish
segment through its Birds Eye brand. It is also a major player in the tuna segment, driven by the John West brand. The company’s Leggo’s and Edgell brands are significant players in the pasta and stir-through sauce segments.
Food Investments Pty Limited Estimated market share: 2.0%Food Investments is the Australian subsidiary of UK-based Associated British Foods. The group is a diversified international food, ingredients and retail company headquartered in North Ryde, NSW. It employs more than 8,000 people. Over the past five years, the company has expanded significantly through a number of strategic acquisitions and facilities upgrades. The company operates in the industry through a number of its food and ingredients manufacturing divisions, manufacturing iconic brands such as Twinings Tea and Ovaltine.
Ridley Corporation Estimated market share: 2.0%Ridley Corporation has significant interests in salt production, but is primarily a stockfeed producer. Cheetham Salt, a subsidiary of Ridley Corporation, operates throughout Australia, Asia and New Zealand. It produces and refines solar salt (sea salt) products for both food production and industrial applications. Cooking and table salt activities (which are included in the industry) are conducted through Salpak Pty Ltd, a joint venture of which the company owns 49.0%. Salpak distributes household table and cooking salt in Australia and the Asia-Pacific region, exporting over 60,000 tonnes.
WWW.IBISWORLD.COM.AU Tea, Coffee and Other Food Manufacturing in Australia May 2015 30
Capital Intensity The Tea, Coffee and Other Food Manufacturing industry is characterised by a medium level of capital intensity. While the industry is highly reliant on automated machinery, niche manufactures also require a higher level of labour input. IBISWorld anticipates that for every dollar operators pay as wages, approximately $0.22 is required for investment into capital. However, the level of capital intensity varies considerably among product segments and according to the size of the manufacturer.
Small- and medium-size facilities will have a higher labour-to-capital ratio, as they lack the resources to invest in expensive technology and equipment, and have to employ additional labour to increase production volumes. Similarly, the capital requirements for the manufacture of products such as coffee, tea and yeast are significantly higher, primarily due to the size of the
high levels of capital expenditure on sophisticated technology and equipment that aim to increase productivity without the need for additional labour. This is crucial for large industry enterprises that
Operating ConditionsCapital Intensity | Technology & Systems | Revenue VolatilityRegulation & Policy | Industry Assistance
Tools of the Trade: Growth Strategies for Success
SOURCE: WWW.IBISWORLD.COM.AU
Labo
ur In
tens
ive Capital Intensive
Change in Share of the Economy
New Age Economy
Recreation, Personal Services, Health and Education. Firms benefi t from personal wealth so stable macroeconomic conditions are imperative. Brand awareness and niche labour skills are key to product differentiation.
Traditional Service Economy
Wholesale and Retail. Reliant on labour rather than capital to sell goods. Functions cannot be outsourced therefore fi rms must use new technology or improve staff training to increase revenue growth.
Old Economy
Agriculture and Manufacturing. Traded goods can be produced using cheap labour abroad. To expand fi rms must merge or acquire others to exploit economies of scale, or specialise in niche, high-value products.
Investment Economy
Information, Communications, Mining, Finance and Real Estate. To increase revenue fi rms need superior debt management, a stable macroeconomic environment and a sound investment plan.
Ice Cream Manufacturing
Food Processing Machinery Manufacturing
Sugar Manufacturing
Bread Production
Tea, Coffee and Other Food Manufacturing
Capital intensity
0.5
0.0
0.1
0.2
0.3
0.4
SOURCE: WWW.IBISWORLD.COM.AUDotted line shows a high level of capital intensity
Capital units per labour unit
Tea, Coffee and Other Food
Manufacturing
ManufacturingEconomy
Level The level of capital intensity is Medium
WWW.IBISWORLD.COM.AU Tea, Coffee and Other Food Manufacturing in Australia May 2015 31
Operating Conditions
Revenue Volatility There is a medium level of volatility in the industry, with variations in revenue being a largely a function of the changes in material costs, household incomes and
consumer tastes. Commodities, such as wheat, sugar and oils, represent the primary inputs into production and any changes in their price affects the
Technology & Systems The Tea, Coffee and Other Food Manufacturing industry exhibits a medium level of technological change. Due to the diversity in industry products, the technology used by the participants is equally varied. Large food companies have shown interest in developing new, healthy additives and flavourings. For instance, an American biotechnology company, Senomyx, is developing additives and flavours, which focus on the development of savoury, sweet and salt ingredients that are intended to allow for their reduction (up to 30.0%) in the manufacturing of food products to achieve greater efficiency in the utilisation of ingredients. Nestle is one such player that is currently marketing products that contain one of Senomyx’s savoury flavoured ingredients.
Much of the research and development
within the industry has been focused on improving the ingredients and recipes to meet consumers’ expectations and to reflect the most current consumer trends in food. The introduction of automated, computer assisted equipment for quality control and stock control has raised industry efficiency and in many cases, has also improved product quality.
Food Science Australia, a joint venture of CSIRO and the Australian Food Industry Science Centre, is the largest food research organisation in the Asia-Pacific region. They provide the whole-of-food-chain research and development capabilities for convenience meals, starting at functional ingredient selection, through product, process and packaging development to storage and distribution trials, sensory evaluation and food safety planning.
Capital Intensitycontinued
aim to cut costs to increase price competitiveness. However, over the past five years, the rising presence of niche and specialist manufacturers has meant
that labour functions are increasingly required to manufacture high-value products such as hand-grinded coffee products or organic goods.
Level The level of Technology Change is Medium
SOURCE: WWW.IBISWORLD.COM.AU
Volatility vs Growth
Reve
nue
vola
tility
* (%
)
1000
100
10
1
0.1
Five year annualised revenue growth (%)–30 –10 10 30 50 70
Hazardous
Stagnant
Rollercoaster
Blue Chip
* Axis is in logarithmic scale
A higher level of revenue volatility implies greater industry risk. Volatility can negatively affect long-term strategic decisions, such as the time frame for capital investment.
When a fi rm makes poor investment decisions it may face underutilised capacity if demand suddenly falls, or capacity constraints if it rises quickly.
Tea, Coffee and Other Food Manufacturing
Level The level of Volatility is Medium
WWW.IBISWORLD.COM.AU Tea, Coffee and Other Food Manufacturing in Australia May 2015 32
Operating Conditions
Industry Assistance The industry receives a low level of industry assistance. Although there are no specific tariffs pertaining to the industry, some generic taxes apply to certain products. Generally, there is a 5.0% tariff for products imported from developed countries and a concession or zero tariff rates on products sourced from developing or emerging countries. However, with the continual development of free-trade relationships, tariffs for many industry products are declining.
Improved transportation systems that
can safely move perishable foods over large distances have greatly increased the range of products that can be imported from overseas markets. Australia’s free trade agreements with New Zealand, Thailand, Singapore and the United States have considerably reduced trade barriers, facilitating free movement of goods and services between the countries.
At the state level, industry participants can receive funding under assistance programs targeting the general Manufacturing division. Commonly, state
Regulation & Policy The industry is characterised by medium levels of regulatory policing. Food manufacturers are required to adhere to various food and health regulations as governed by the Australia New Zealand Joint Food Standards Code (FSANZ). These are aimed at maintaining high levels of food hygiene and safeguarding the community against potential health scares associated with poor food safety.
Food Standards Australia New Zealand also places labelling requirements on industry players. Under the code, manufacturers are required to provide information on the percentage share of ingredients used as well as the nutritional value of the food product. All food product claims are also subject to laws against misleading or deceptive conduct,
as mandated by the Trade Practices Act (1974) and enforced by the Australian Competition and Consumer Commission.
Failure to comply with regulations, laws and other rules governing food manufacturing can subject industry players to civil remedies, administrative penalties, injunctive relief and possible recalls of products. It can also result in considerable negative publicity that can damage the reputation and credibility of non-compliant manufacturers. This can have a material effect on the earnings and competitive position of firms operating in the industry. Further, laws and regulations relating to food production are becoming more stringent, resulting in increased compliance costs for Australian food manufacturers.
Revenue Volatilitycontinued
industry. Historically, the prices of these inputs have been highly volatile as their yield is often dependent on unpredictable weather conditions. As the majority of industry products are classified as discretionary purchases, any changes in the level of household discretionary income will affect the volume consumed. Further, the presence of a large number of substitute products, such as biscuits, cakes, chocolates and other confectionery, will also intensify competition between related industries.
Downstream demand is derived from
national consumption, which changes in response to household tastes and preferences. Increasing consolidation among retail supermarket chains has led to increased buying power and negotiating strength, which has led to intense rivalry, discounting and price wars that have squeezed industry profit margins. IBISWorld anticipates that due to the ongoing product innovation by industry players, volatility levels will remain in check as industry operators continue to manufacture according to consumer tastes.
Level & Trend The level of Regulation is Medium and the trend is Steady
Level & Trend The level of Industry Assistance is Low and the trend is Steady
WWW.IBISWORLD.COM.AU Tea, Coffee and Other Food Manufacturing in Australia May 2015 33
Operating Conditions
Industry Assistancecontinued
governments operate export programs aimed at encouraging manufacturers to develop markets abroad. The Victorian Government, for example, is currently operating a program that offers funding for export initiatives. To be eligible, Victorian-based firms must be established for a minimum of two years and provide evidence that they are financially viable. Under the program, businesses can receive grants valued at between $10,000 and $30,000.
The Victorian Employers’ Chamber of Commerce & Industry also formed an alliance with the Food Industry
Machinery Manufacturers Association (FIMMA), which is aimed at further strengthening the services that FIMMA offers to the food equipment manufacturing sector. Finally, food manufacturers continue to benefit from the lobbying efforts and public relations work conducted by peak industry associations. Organisations like Australian Industry Group have played a prominent role in promoting the interests of the industry. Money raised through membership fees and government grants is used to fund policy initiatives and advisory services.
WWW.IBISWORLD.COM.AU Tea, Coffee and Other Food Manufacturing in Australia May 2015 34
WWW.IBISWORLD.COM.AU Tea, Coffee and Other Food Manufacturing in Australia May 2015 35
Jargon & Glossary
BARRIERS TO ENTRY High barriers to entry mean that new companies struggle to enter an industry, while low barriers mean it is easy for new companies to enter an industry.
CAPITAL INTENSITY Compares the amount of money spent on capital (plant, machinery and equipment) with that spent on labour. IBISWorld uses the ratio of depreciation to wages as a proxy for capital intensity. High capital intensity is more than $0.333 of capital to $1 of labour; medium is $0.125 to $0.333 of capital to $1 of labour; low is less than $0.125 of capital for every $1 of labour.
CONSTANT PRICES The dollar figures in the Key Statistics table, including forecasts, are adjusted for inflation using the current year (i.e. year published) as the base year. This removes the impact of changes in the purchasing power of the dollar, leaving only the ‘real’ growth or decline in industry metrics. The inflation adjustments in IBISWorld’s reports are made using the Australian Bureau of Statistics’ implicit GDP price deflator.
DOMESTIC DEMAND Spending on industry goods and services within Australia, regardless of their country of origin. It is derived by adding imports to industry revenue, and then subtracting exports.
EMPLOYMENT The number of permanent, part-time, temporary and casual employees, working proprietors, partners, managers and executives within the industry.
ENTERPRISE A division that is separately managed and keeps management accounts. Each enterprise consists of one or more establishments that are under common ownership or control.
ESTABLISHMENT The smallest type of accounting unit within an enterprise, an establishment is a single physical location where business is conducted or where services or industrial operations are performed. Multiple establishments under common control make up an enterprise.
EXPORTS Total value of industry goods and services sold by Australian companies to customers abroad.
IMPORTS Total value of industry goods and services brought in from foreign countries to be sold in Australia.
INDUSTRY CONCENTRATION An indicator of the dominance of the top four players in an industry. Concentration is considered high if the top players account for more than 70% of industry revenue. Medium is 40% to 70% of industry revenue. Low is less than 40%.
INDUSTRY REVENUE The total sales of industry goods and services (exclusive of excise and sales tax); subsidies on production; all other operating income from outside the firm (such as commission income, repair and service income, and rent, leasing and hiring income); and capital work done by rental or lease. Receipts from interest royalties, dividends and the sale of fixed tangible assets are excluded.
INDUSTRY VALUE ADDED (IVA) The market value of goods and services produced by the industry minus the cost of goods and services used in production. IVA is also described as the industry’s contribution to GDP, or profit plus wages and depreciation.
INTERNATIONAL TRADE The level of international trade is determined by ratios of exports to revenue and imports to domestic demand. For exports/revenue: low is less than 5%; medium is 5% to 20%; and high is more than 20%. Imports/domestic demand: low is less than 5%; medium is 5% to 35%; and high is more than 35%.
LIFE CYCLE All industries go through periods of growth, maturity and decline. IBISWorld determines an industry’s life cycle by considering its growth rate (measured by IVA) compared with GDP; the growth rate of the number of establishments; the amount of change the industry’s products are undergoing; the rate of technological change; and the level of customer acceptance of industry products and services.
NONEMPLOYING ESTABLISHMENT Businesses with no paid employment or payroll, also known as nonemployers. These are mostly set up by self-employed individuals.
PROFIT IBISWorld uses earnings before interest and tax (EBIT) as an indicator of a company’s profitability. It is calculated as revenue minus expenses, excluding interest and tax.
VOLATILITY The level of volatility is determined by averaging the absolute change in revenue in each of the past five years. Volatility levels: very high is more than ±20%; high volatility is ±10% to ±20%; moderate volatility is ±3% to ±10%; and low volatility is less than ±3%.
WAGES The gross total wages and salaries of all employees in the industry. Benefits and on-costs are included in this figure.
Industry Jargon
IBISWorld Glossary
ADDITIVE A substance added to a product usually to preserve the product’s quality.
BEST PRACTICE A technique that ensures utmost efficiency in the production process.
FUNCTIONAL FOOD Food that is claimed to have medicinal or health-promoting benefits beyond its basic function.
PROBIOTICS Live microorganisms thought to be healthy for the host organism.
Disclaimer
This product has been supplied by IBISWorld Pty Ltd. (‘IBISWorld’) solely for use by its authorised licensees strictly in accordance with their license agreements with IBISWorld. IBISWorld makes no representation to any other person with regard to the completeness or accuracy of the data or information contained herein, and it accepts no responsibility and disclaims all liability (save for liability which cannot be lawfully disclaimed) for loss or damage whatsoever suffered or incurred by any other person resulting from
the use of, or reliance upon, the data or information contained herein. Copyright in this publication is owned by IBISWorld Pty Ltd. The publication is sold on the basis that the purchaser agrees not to copy the material contained within it for other than the purchasers own purposes. In the event that the purchaser uses or quotes from the material in this publication - in papers, reports, or opinions prepared for any other person - it is agreed that it will be sourced to: IBISWorld Pty Ltd
At IBISWorld we know that industry intelligence is more than assembling factsIt is combining data with analysis to answer the questions that successful businesses askIdentify high growth, emerging & shrinking marketsArm yourself with the latest industry intelligenceAssess competitive threats from existing & new entrantsBenchmark your performance against the competitionMake speedy market-ready, profit-maximising decisions
Who is IBISWorld?We are strategists, analysts, researchers, and marketers. We provide answers to information-hungry, time-poor businesses. Our goal is to provide real world answers that matter to your business in our 500 Australian industry reports. When tough strategic, budget, sales and marketing decisions need to be made, our suite of Industry and Risk intelligence products give you deeply-researched answers quickly.
IBISWorld MembershipIBISWorld offers tailored membership packages to meet your needs.