28
www.icinsights.com +1-480-348-1133 www.icinsights.com +1-480-348-1133 IC MARKET UPDATE AND CHINA IMPACT ANALYSIS The ConFab 2017 San Diego, California May 17, 2017
www.icinsights.com+1-480-348-1133
www.icinsights.com+1-480-348-1133
IC MARKET UPDATE AND CHINA IMPACT ANALYSIS
The ConFab 2017San Diego, California
May 17, 2017
About IC Insights
IC Insights, Inc., based in Scottsdale, Arizona, is dedicated to providing high-quality, cost-effective market research for the semiconductor industry. Founded in 1997, IC Insights offers coverage of global economic trends, the
semiconductor market forecast, capital spending and fab capacity trends, product market details, and technology trends, as well as complete IC company profiles and evaluations of end-use applications driving demand for ICs.
IC Insights Products & Services
The McCLEAN REPORTA Complete Analysis and Forecast of the Integrated Circuit Industry
IC MARKET DRIVERS
A Study of Emerging and Major End-Use Applications Fueling Demand for ICs
O-S-D REPORT
A Market Analysis and Forecast for Optoelectronics, Sensors, and Discretes
STRATEGIC REVIEWS
Extensive Profiles of the World’s IC Manufacturers and Fabless Suppliers
GLOBAL WAFER CAPACITY
A Thorough Examination of the IC Industry's Wafer Fab Capacity
Additional Informationwww.icinsights.com +1-480-348-1133
May 17, 2017 The ConFab 2017 2

Presentation Outline
• Global Economic and Cycle Trends
• China Impact Analysis
May 17, 2017 The ConFab 2017 3

Global Economic and Cycle Trends
May 17, 2017 The ConFab 2017 4
May 17, 2017 The ConFab 2017 5
Source: IC Insights
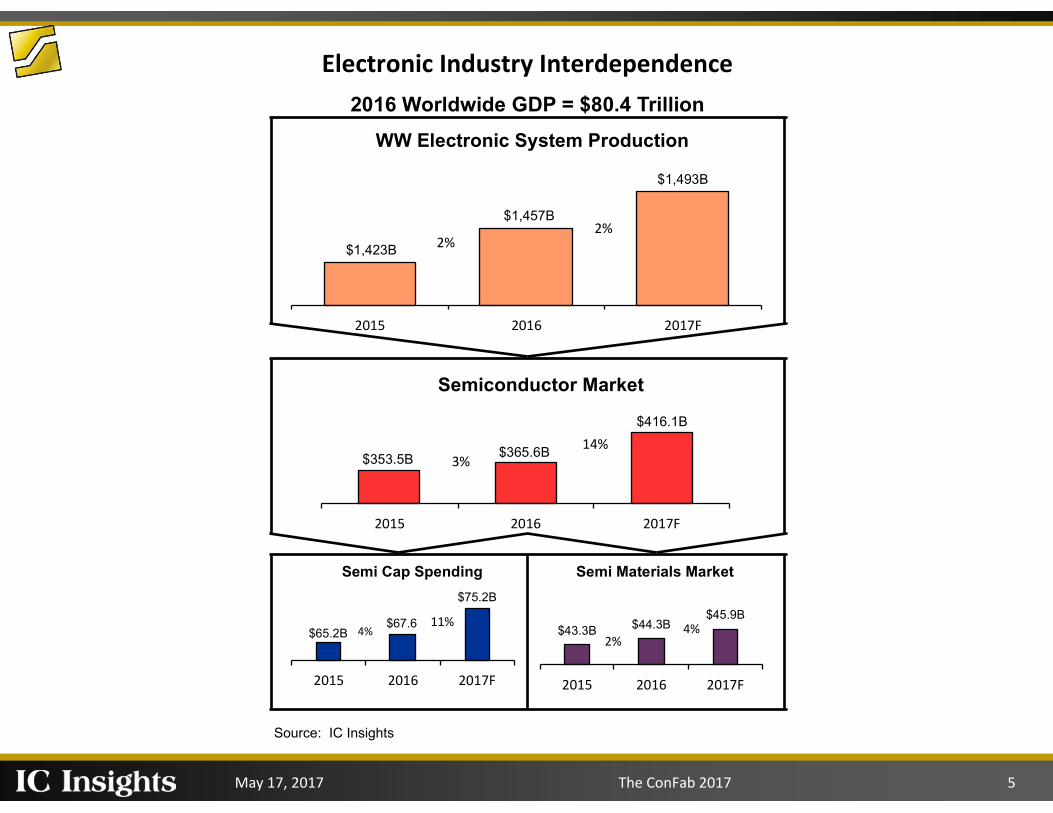
Electronic Industry Interdependence
2016 Worldwide GDP = $80.4 Trillion
$1,423B
$1,457B
$1,493B
2015 2016 2017F
WW Electronic System Production
2% 2%
$353.5B $365.6B
$416.1B
2015 2016 2017F
Semiconductor Market
3% 14%
$65.2B $67.6
$75.2B
2015 2016 2017F
Semi Cap Spending
4% 11%
$43.3B $44.3B
$45.9B
2015 2016 2017F
Semi Materials Market
2% 4%

May 17, 2017 The ConFab 2017 6
2015 GDP 2015 GDP 2015 2016 GDP 2016 GDP 2016 2017F GDP 2017F GDP 2017F Growth % ($ Trillions) (% of Total) Growth % ($ Trillions) (% of Total) Growth % ($ Trillions) (% of Total)
High Income Countries/Region
U.S. 2.6% 17.39 22.1% 1.6% 17.67 22.0% 2.2% 18.06 21.9%
Eurozone 2.0% 12.51 15.9% 1.7% 12.72 15.8% 1.5% 12.91 15.6%
Japan 1.2% 6.11 7.8% 1.0% 6.17 7.7% 0.9% 6.23 7.5%
U.K. 2.2% 2.65 3.4% 2.0% 2.70 3.4% 1.5% 2.74 3.3%
Canada 0.9% 1.88 2.4% 1.3% 1.90 2.4% 1.9% 1.94 2.4%
Other 2.0% 11.86 15.1% 1.9% 12.09 15.0% 2.2% 12.35 15.0%
Total High Income 2.1% 52.40 66.7% 1.6% 53.25 66.2% 1.8% 54.23 65.7%
Developing Countries 4.0% 26.12 33.3% 4.0% 27.16 33.8% 4.3% 28.33 34.3%
Worldwide Total 2.6% 78.52 100.0% 2.4% 80.42 100.0% 2.7% 82.57 100.0%
China* 6.9% 10.18 13.0% 6.7% 10.86 13.5% 6.5% 11.57 14.0%
India* 7.6% 2.25 2.9% 7.3% 2.41 3.0% 7.0% 2.58 3.1%
Brazil* -3.8% 2.26 2.9% -3.4% 2.18 2.7% 0.4% 2.19 2.7%
*Included in Developing CountriesSource: World Bank, IMF, IC Insights
Worldwide GDP Breakdown (2015-2017F)
Country/Region

May 17, 2017 The ConFab 2017 7
! "#$%&'() '* +#, - "
. &&#- //01- '
) +20"+3'! 2- %40%&
!0&%05
6+%"'
)+2
+60"7'.4
4-
48#06
- '90#:
0%&
;0<
3-'
)+2
+60
"7'.
44
-4
8#06- '! $
= - %0%&
> - +, '() '* +#, - "
) +2+60"7?) +20"+3'! 2- %40%&'@#01- %'() '(%4A/"#7') 763- '* $4- 3'BCDEFGHBH
! " #$%&'()*()+, -. / 0,
) $%/- #1+I 1- '
) +20"+3'! 2- %40%&
12(3(14
54(3(4647(3(45
16(3(18
15(3(14
54(3(48
47(3(45
16(3(1812(3(14
41(3(48
47(3(45
16(3(19
15(3
(14
41
(3(4
8
42
(3(4
4
18
3(1
9
61
49(3(4:
44(3(11
19(3(1;
61
49(3(4:
44(3(11
19(3(1;
49(3(47
11(3(16
1; (3(17
47
(3(45
11
(3(16
1;
(3(17
61

May 17, 2017 The ConFab 2017 8
0.35
-0.10
0.63
0.90
-0.20
0.00
0.20
0.40
0.60
0.80
1.00
1980-1989 1990-1999 2000-2009 2010-2016
Co
rre
lati
on
Co
eff
icie
nt
Timeperiod
Worldwide GDP and IC Market Growth Correlation Coefficient History and Forecast (1980-2016)
Source: IC Insights
Japanese Co's Ramp Production
S. Korean & Taiwanese Co's Ramp Production
Company Consolidation Begins
Consolidation Gains Momentum

May 17, 2017 The ConFab 2017 9

May 17, 2017 The ConFab 2017 10

May 17, 2017 The ConFab 2017 11

May 17, 2017 The ConFab 2017 12
Rank
1 Intel 7.6 Intel 29.7 Intel 31.6 Intel 57.0 Intel 14.2
2 NEC 7.1 Toshiba 11.0 Samsung 19.7 Samsung 44.3 Samsung 13.6
3 Toshiba 6.3 NEC 10.9 TI 13.7 Qualcomm (1) 15.4 SK Hynix 5.5
4 Motorola 5.8 Samsung 10.6 Toshiba 10.0 Broadcom (1) 15.2 Micron 4.9
5 Hitachi 5.2 TI 9.6 ST 9.9 SK Hynix 14.9 Broadcom (1) 4.1
6 TI 4.0 Motorola 7.9 Renesas 8.2 Micron 13.5 Qualcomm (1) 3.7
7 Samsung 3.1 ST 7.9 Hynix 7.4 TI 12.5 TI 3.2
8 Mitsubishi 3.0 Hitachi 7.4 Freescale 6.1 Toshiba 10.9 Toshiba 2.9
9 Fujitsu 2.9 Infineon 6.8 NXP 5.9 NXP 9.5 NXP 2.2
10 Matsushita 2.3 Philips 6.3 NEC 5.7 MediaTek (1) 8.8 Infineon 1.9
Top 10 Total ($B) 47.2 108.1 118.2 202.1 56.0
Semi Market ($B) 108.8 218.6 265.5 365.6 99.6
Top 10 % of Total Semi 43% 49% 45% 55% 56%
Source: IC Insights (1) Fabless
1Q17
Top 10 Worldwide Semiconductor Sales Leaders (Excluding Foundries, $B)
1993 2000 2006 2016

May 17, 2017 The ConFab 2017 13
1.9% 1.6%
3.2%
2.9%
3.3%
3.7%
2.5%
3.4%
4.3%
1.7%
2.1%
2.8%
4.2%
3.6%
4.1% 4.0%
1.4%
4.1%
2.9% 2.5%
2.4%
2.7% 2.6%
2.4%
2.7%
12%
32% 33%
43%
-9%
4%
-9%
19%
35%
-33%
2%
16%
28%
8%
9% 4%
-6%
-10%
33%
1%
-4%
5% 7%
-2%
4%
15%
-40%
-30%
-20%
-10%
0%
10%
20%
30%
40%
50%
-2%
-1%
0%
1%
2%
3%
4%
5%
92 93 94 95 96 97 98 99 00 01 02 03 04 05 06 07 08 09 10 11 12 13 14 15 16 17 F
IC M
ark
et
Ch
an
ge
Wo
rld
wid
e G
DP
Ch
an
ge
Year
1992-2017F IC Market Growth versus Worldwide GDP Growth
Global GDP Growth WW IC Market Growth
Source: IC Insights
= Global Recession Threshold
-2.1%

May 17, 2017 The ConFab 2017 14
2.9%
2.5% 2.4% 2.7% 2.6%
2.4% 2.7%
1%
-4%
5% 7%
-2%
4%
15%
-40%
-30%
-20%
-10%
0%
10%
20%
30%
40%
50%
-2%
-1%
0%
1%
2%
3%
4%
5%
11 12 13 14 15 16 17F
IC M
ark
et
Ch
an
ge
Wo
rld
wid
e G
DP
Ch
an
ge
Year
2011-2017F IC Market Growth versus Worldwide GDP Growth
Global GDP Growth WW IC Market Growth
Source: IC Insights
= Global Recession Threshold
6%*
*IC market growth excl. DRAM and NAND

May 17, 2017 The ConFab 2017 15

China Impact Analysis
May 17, 2017 The ConFab 2017 16

May 17, 2017 The ConFab 2017 17

May 17, 2017 The ConFab 2017 18
$48 $54 $56 $54
$75 $81 $82
$101 $90
$106 $112
$166
$3.5 $4.6 $4.9 $4.2 $5.8 $7.9 $8.8 $11.7 $10.3 $13.4 $13.0
$29.7
0
40
80
120
160
200
06 07 08 09 10 11 12 13 14 15 16 21F
Bill
ion
s o
f D
olla
rs
Year
China IC Market vs. China IC Produc on Trends
China IC Market ($B) China IC Produc on ($B)
Source: IC Insights
IC Produc on Share of China IC Market: 2011: 9.8% 2016: 11.6% 2021F: 17.9%
2016-2021F CAGR = 8%
2016-2021F CAGR = 18%

May 17, 2017 The ConFab 2017 19
2016 Rank Company
2010 IC Sales ($M)
2011 IC Sales ($M)
2012 IC Sales ($M)
2013 IC Sales ($M)
2014 IC Sales ($M)
2015 IC Sales ($M)
2016 IC Sales ($M) Products
2021 IC Sales
($M, Fcst)
1 SK Hynix* 2,040 2,450 2,360 3,200 4,040 4,100 3,680 DRAM 5,500
2 SMIC** 1,555 1,320 1,542 1,962 1,970 2,236 2,914 Foundry 5,100
3 Samsung* 0 0 0 0 270 2,370 2,725 3D NAND Flash 6,100
4 Hua Hong Semi 0 0 571 585 665 650 721 Foundry 1,000
5 TSMC* 263 366 470 510 550 590 635 Foundry 1,500
6 Intel* 30 1,865 2,380 2,650 2,710 1,830 520 3D NAND Flash 2,700
7 Shanghai Huali 0 0 70 210 295 370 460 Foundry 1,100
8 CR Micro 259 213 179 165 180 190 205 Foundry/Std ICs 290
9 Diodes-BCD 119 125 139 155 170 180 200 Foundry/Std ICs 275
10 XMC** 0 0 160 150 165 175 205 Foundry/3D NAND 1,300
11 ASMC 145 147 135 117 130 119 120 Foundry 140
— HeJian*** 223 208 215 0 0 0 0 Foundry 0
— Others 1,211 1,211 590 575 590 605 625 — 4,700
—Total Chinese IC Production
$5,845 $7,905 $8,811 $10,279 $11,735 $13,415 $13,010 — $29,705
— WW IC Market ($B) $267.8 $270.3 $259.3 $271.9 $291.6 $286.9 $297.7 — $392.1
—
Chinese Companies' Share of WW IC Market
2.18% 2.92% 3.40% 3.78% 4.02% 4.68% 4.37% — 7.58%
*China fab production only.
Source: IC Insights' Strategic Reviews database, ** XMC's sales listed separately from SMIC starting in 2012.
CCID, CSIA, PwC ***Merged with UMC beginning in 2013.
Major IC Manufacturers in China

May 17, 2017 The ConFab 2017 20
Phase Approach Timeframe Initiated Successful?
1Build a strong indigenous pure-play
foundry industryLate 1990s - Early 2000s No
2Build a strong presence in the fabless IC
supplier spaceEarly 2000s - Mid 2000s No
The Three Phases of China's IC Industry Strategy
3
Build a strong China-based IC supplier/manufacturer base with
startups, acquisitions, and mergers
Mid 2010s - Late 2010s ????
Source: IC Insights

May 17, 2017 The ConFab 2017 21
3.9%
6.3%
11.5% 12.5%
13.3% 13.3%
12.0%
10.3% 9.8%
8.5% 8.7% 8.8% 7.7% 7.9%
9.2%
12.3%
0%
3%
6%
9%
12%
15%
02 03 04 05 06 07 08 09 10 11 12 13 14 15 16 21F
Mar
kets
har
e
Year
Chinese Companies' Share of the Pure-Play Foundry Market
Source: IC Insights

May 17, 2017 The ConFab 2017 22
U.S. Companies 53%
Taiwanese Companies
18%
Chinese Companies**
10%
European Companies
1%
Japanese Companies
<1%
Other Companies* 17%
2016 Fabless Company IC Sales by Company Headquarters Loca on ($90.4B)
Source: IC Insights
*
2010 U.S. 69% Taiwan 17% China 5% Europe 4% Japan 1% Other 4% **6% excluding internal transfers of
HiSilicon (Huawei), ZTE, and Datang
*Singapore-headquartered Broadcom Ltd's share is 16%

May 17, 2017 The ConFab 2017 23
Investment Fund Amount of Money Purpose Managers of the FundChina's Government Funds for National IC
Industry Support
120 billion RMB ($19.5B) between 2014-2017
1. National level support and funding
—China Development Bank
2. Support target IC enterprises
3. Facilitate IC industry consolidation and enhance the competitiveness of the leading IC enterprises4. Allocation of funds:
Wafer manufacturing (40%)
Chip design (30%)
Chip packaging and testing (30%)
Local Government and Private Equity
Investments in China
600 billion RMB ($97.4B)
This pacesetting fund is to promote resource integration and M&A through investment in key enterprises, projects and innovative entities or platforms.
— Beijing IC Industry Equity Investment Fund ($4.9B)
— Other Chinese Provinces, like Wuhan, Shanghai, Shenzhen, are following the Beijing fund model and building up the local fund to support the IC industry.
— Government's fiscal funds as a lead to attract more private equity investment in China.
6.16 RMB = $1.00
Source: EE Times
Outline of China's Semiconductor Industry Investment Funds

May 17, 2017 The ConFab 2017 24

May 17, 2017 The ConFab 2017 25

May 17, 2017 The ConFab 2017 26

May 17, 2017 The ConFab 2017 27
17%
40%
25%
70%
0%
10%
20%
30%
40%
50%
60%
70%
80%
IC Insights' 2020 Fcst "MIC 2025" 2020 Goal
IC Insights' 2025 Fcst "MIC 2025" 2025 Goal
Pe
rcen
t
China-based Share of Total China IC Market
Source: IC Insights

May 17, 2017 The ConFab 2017 28
Thank you for your attention!Additional information
www.icinsights.com+1-480-348-1133


