26
ICM Minnesota – Interstate 394 Brian Kary, Minnesota Department of Transportation
| Date post: | 24-Dec-2015 |
| Category: |
Documents |
| Upload: | amberly-gallagher |
| View: | 218 times |
| Download: | 0 times |
ICM Minnesota – Interstate 394
Brian Kary, Minnesota Department of Transportation

2
Operational – I-394 Existing Corridor Networks
3
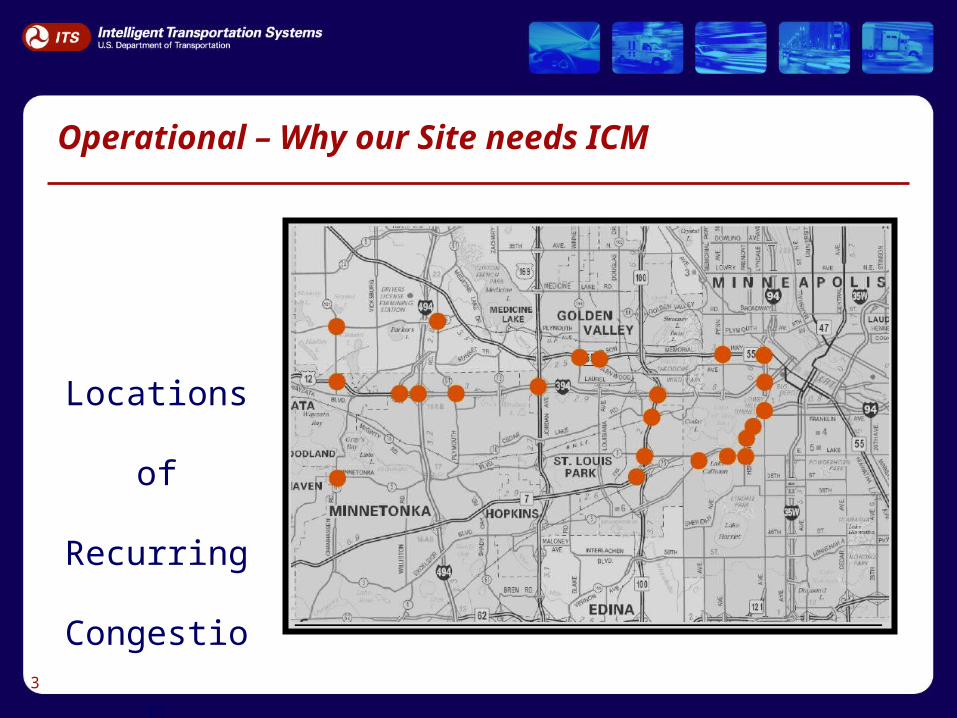
Operational – Why our Site needs ICM
Locations of
Recurring
Congestion
4
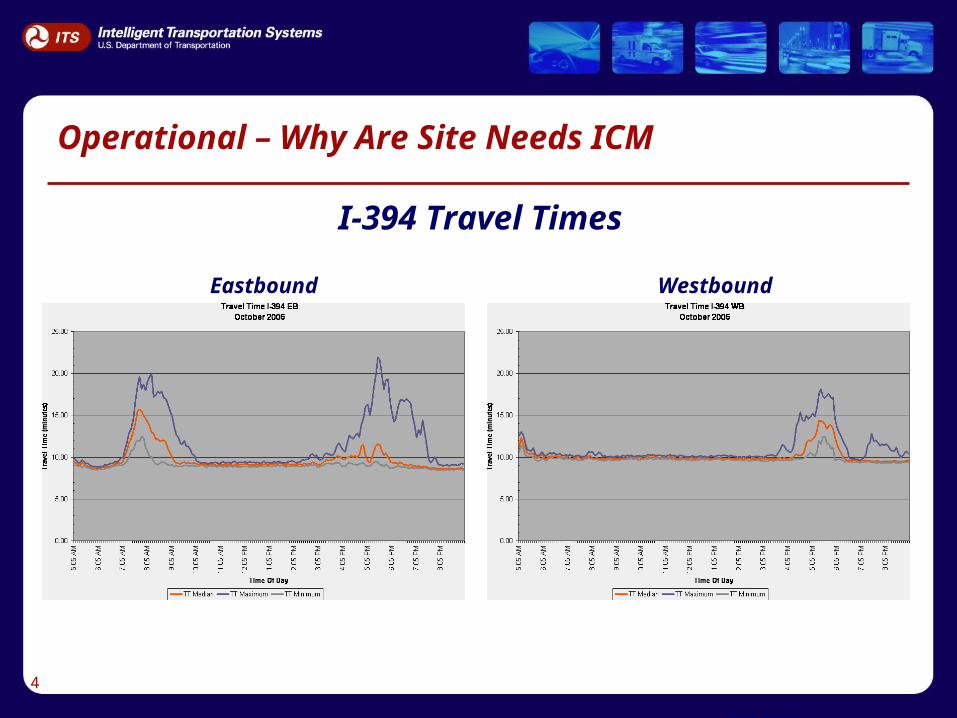
Operational – Why Are Site Needs ICM
I-394 Travel Times
Eastbound
PM PEAK
Westbound

5
Operational – Why our Site needs ICM
• Gaps in Coordination Between Traffic and Transit Management Centers– During Normal
Conditions
– During Incident Conditions
• Gaps in Incident Data On Arterial Network– State Patrol Response
– Local PD Response
6
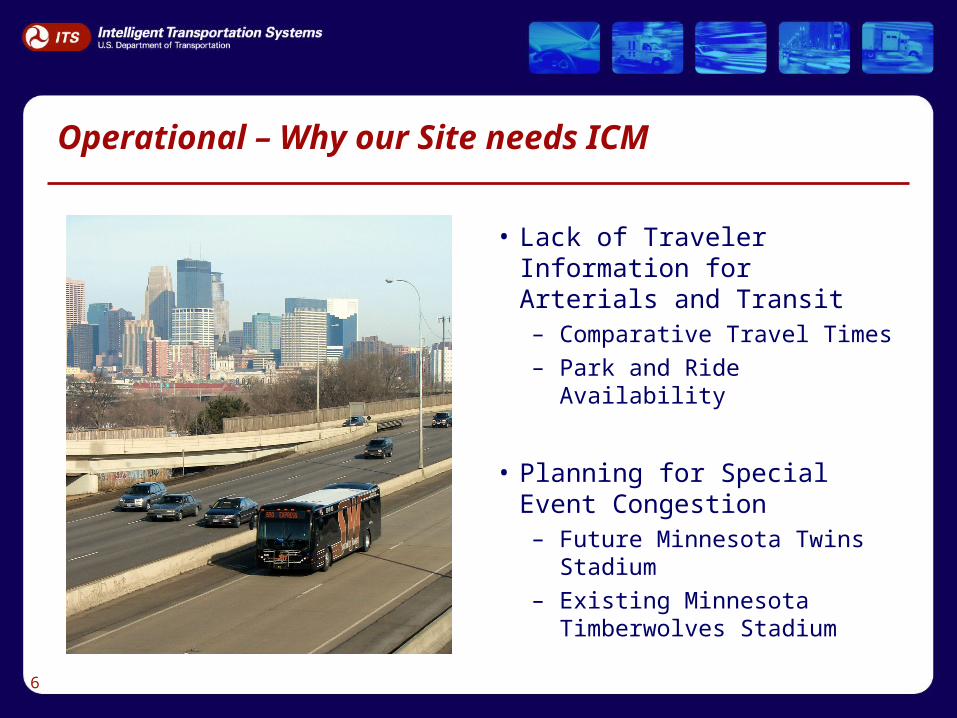
Operational – Why our Site needs ICM
• Lack of Traveler Information for Arterials and Transit– Comparative Travel Times
– Park and Ride Availability
• Planning for Special Event Congestion– Future Minnesota Twins
Stadium
– Existing Minnesota Timberwolves Stadium

7
Operational – How ICM will help our Site
• Provide Traveler Information Across All Networks and Modes– Freeway Travel Times– Transit Travel Times– Arterial Travel Times– Park and Ride Availability
• Improved Agency Communication and Coordination– Improved Incident Management and Detection on Arterials– Coordinated Incident Signal Timing Plans– Transit Rerouting During Incidents
• Reduce Congestion and Improve Trip Reliability

8
Institutional – Who are our ICM Stakeholders
• Mn/DOT (Freeway, Arterials, MnPASS)
• Hennepin County (Traffic, EMS dispatch)
• City of Minneapolis (Traffic, EMS dispatch)
• Transit Agencies (Metro Transit, SW Transit, Plymouth Transit)
• Minnesota State Patrol

9
Institutional – How our Site defined Roles and achieved Buy-in among ICM Stakeholders
• Mn/DOT Lead Role
• Consultant Hired to Write ConOps and SRS
• Steering Committee and Working Group Meetings
• Stakeholder Workshop
• Individual Stakeholder Meetings
• Project Management Team

10
Technical – What our proposed ICMS will look like
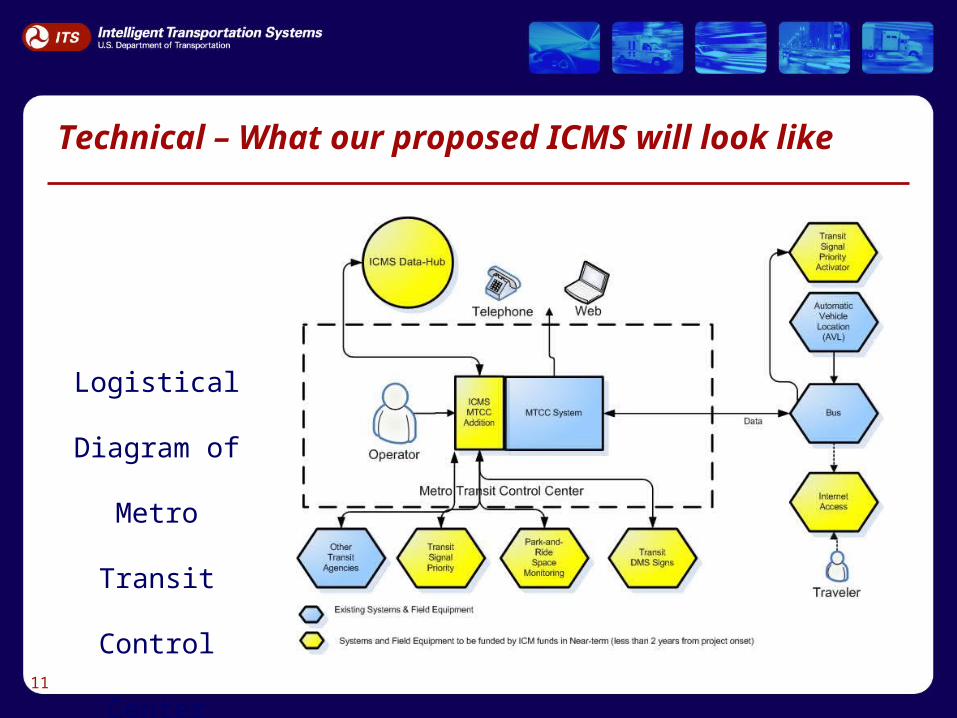
• Connection of Existing Systems
• Add-ons to Existing Systems
• ICMS Data Hub
11
Technical – What our proposed ICMS will look like
Logistical
Diagram of
Metro Transit
Control Center

12
Technical – What our proposed ICMS will look like
Functional
Diagram of
Metro Transit
Control Center

13
Technical – What our proposed ICMS will look like
Logistical
Diagram of
Mn/DOT Traffic
Operations

14
Technical – What our proposed ICMS will look like
• Planned Instrumentation of Hwy 55 and Hwy 7 with CMAQ Funds
• Gaps in Providing Arterial Travel Time Gaps
• Jointly Developed Incident Signal Timing Plans
15
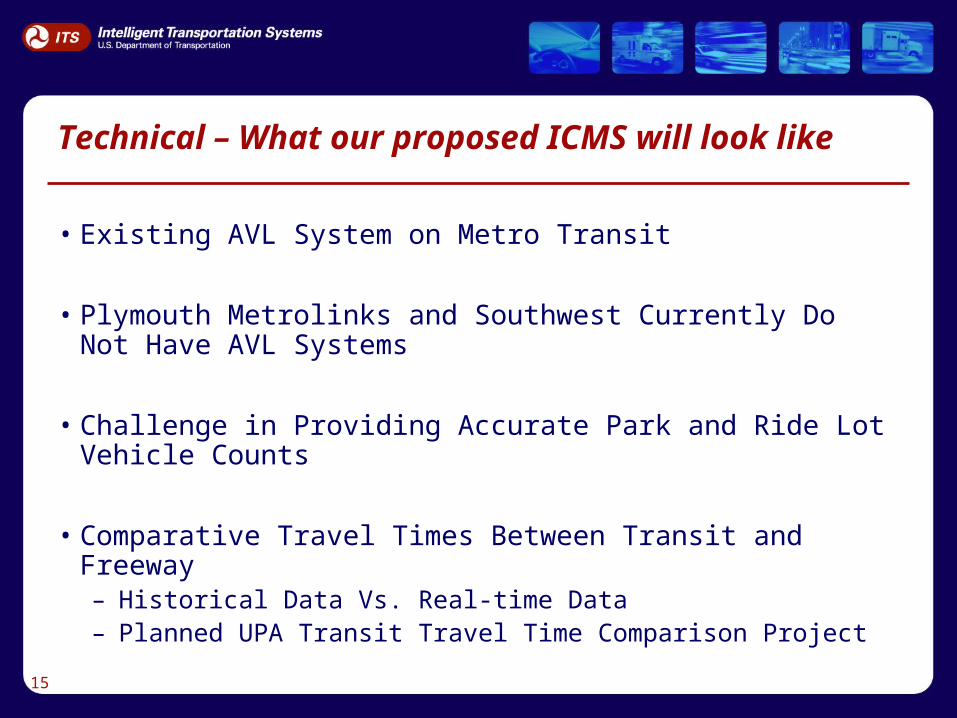
Technical – What our proposed ICMS will look like
• Existing AVL System on Metro Transit
• Plymouth Metrolinks and Southwest Currently Do Not Have AVL Systems
• Challenge in Providing Accurate Park and Ride Lot Vehicle Counts
• Comparative Travel Times Between Transit and Freeway– Historical Data Vs. Real-time Data– Planned UPA Transit Travel Time Comparison Project
16
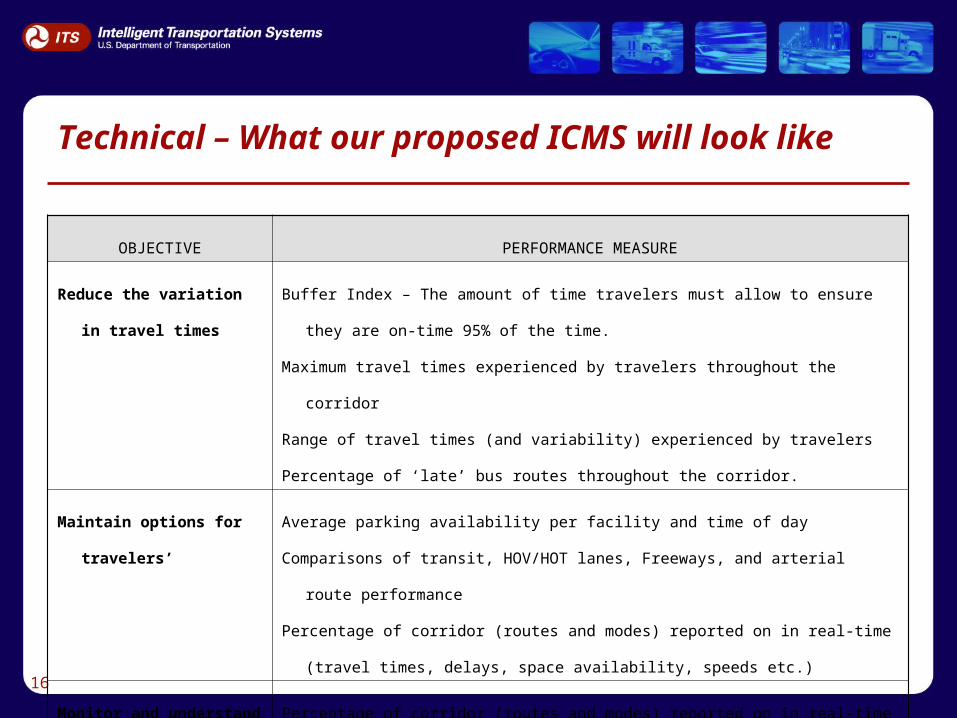
Technical – What our proposed ICMS will look like
OBJECTIVE PERFORMANCE MEASURE
Reduce the variation in travel
times
Buffer Index – The amount of time travelers must allow to ensure they are on-time 95% of the
time.
Maximum travel times experienced by travelers throughout the corridor
Range of travel times (and variability) experienced by travelers
Percentage of ‘late’ bus routes throughout the corridor.
Maintain options for travelers’ Average parking availability per facility and time of day
Comparisons of transit, HOV/HOT lanes, Freeways, and arterial route performance
Percentage of corridor (routes and modes) reported on in real-time (travel times, delays, space
availability, speeds etc.)
Monitor and understand the
ever changing available
capacity
Percentage of corridor (routes and modes) reported on in real-time (travel times, delays, space
availability, speeds etc.)
Encourage pattern changes to
better utilize spare
capacity
Percentage of drivers altering route or mode based on traveler information
Average capacity utilization across all modes during incidents and normal conditions.

17
Technical – What our proposed ICMS will look like
OBJECTIVE PERFORMANCE MEASURE
Inform travelers of incidents
& impacts
Number of events where viable alternates are delivered to travelers (either via. phone, web or push)
Number of callers receiving alternate route/mode information
Web page hits and call volumes during incident events
Manage traffic around events Number of closures where vehicles are routed onto appropriate alternate routes
Number of times alternate plans are implemented, and the real-world results.
Response/ clearance times for major events.
Travelers are aware of their
modal and route options
Web page hits, phone requests, and push deliveries of specific route/mode options
Travelers do not experience
delays without also being
informed of options
Travelers’ feedback after incidents and events.

18
Lessons Learned – Operational
• Difficult Not to Focus on Technology
• Use of Operational Scenarios to Engage Stakeholders– Recommend Developing Operational Scenarios First– Assumed Connectivity or Coordination Between Centers– Recognized New Partners During Discussions
• Near Term Strategies to Achieve Benefits of ICM Sooner

19
Lessons Learned - Operational
• Incident Data Sharing Example– Near Term Strategy
• Manual sharing of incident data via email, phone or radio.– Long Term Strategy
• Automated sharing of incident data via integrated CAD/AVL systems.
• Came From Meetings with Stakeholders!
• Either:– Require Basic Agreements / Procedural Changes
– Already Existing or Funded Development in process

20
Lessons Learned – Operational
I-35W Bridge Collapse
• Improved Coordination and Communications Between Stakeholders in Responding to Changing Traffic Conditions
• Weekly Traffic Operations Meetings Including Freeway, Arterials, and Transit Staff – likely to continue as biannual meetings.

21
Lessons Learned – Operational
I-35W Urban Partnership Agreement
• Conversion of I-35W HOV Lanes to MnPass HOT Lanes
• Arterial Traffic Management on Hwy 13
• Transit Traveler Information– Park and Ride Lot Availability– Next Bus Arrival Times– Travel Time Comparisons
• Improved Traveler Information Across All Networks and Modes.
22
Lessons Learned – Institutional
Stakeholder Concerns of Usefulness of ICM
• Lack of Spare Capacity on Alternate Routes
• Focus More on Incident Management and Buffer Time Index
• Overcoming the Legacy of Past Project Failures

23
Lessons Learned – Institutional
Ownership, Maintenance, Operations
• Legal Issues Allowing Joint Control Equipment
• Assigning Agency Responsibility – eliminate wish list
• Virtual System – Enhancements to existing systems

24
Lessons Learned – Institutional
Maintaining Stakeholder Interest in ICM
• Making ICM a Priority
• What’s in it for me?
• Major Incident Debriefing Related to ICM
25
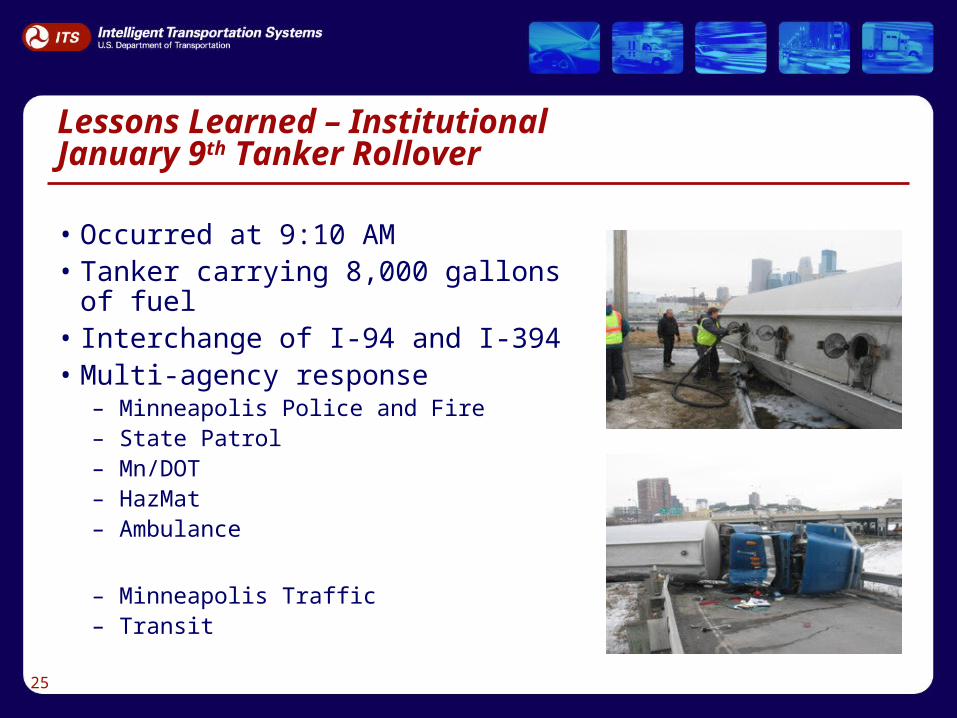
Lessons Learned – InstitutionalJanuary 9th Tanker Rollover
• Occurred at 9:10 AM• Tanker carrying 8,000 gallons of fuel• Interchange of I-94 and I-394• Multi-agency response
– Minneapolis Police and Fire– State Patrol– Mn/DOT– HazMat– Ambulance
– Minneapolis Traffic– Transit
26
Lessons Learned – Technical
• Develop Functional Diagrams and Logistical Diagrams Early
• Defining Requirements for New Techniques– TT calculation frequency– How often do you really need it?– Storage of data? Associated cost?


