Identification of Substrate Binding Sites in Enzymes by Computational Solvent Mapping Michael Silberstein 1 , Sheldon Dennis 2 , Lawrence Brown III 2 Tamas Kortvelyesi 2,3 , Karl Clodfelter 1 and Sandor Vajda 2 * 1 Program in Bioinformatics Boston University, Boston, MA 02215, USA 2 Department of Biomedical Engineering, Boston University 44 Cummington Street, Boston MA 02215, USA 3 Department of Physical Chemistry, University of Szeged, 6701 Szeged, P.O. Box 105, Hungary Enzyme structures determined in organic solvents show that most organic molecules cluster in the active site, delineating the binding pocket. We have developed algorithms to perform solvent mapping computationally, rather than experimentally, by placing molecular probes (small molecules or functional groups) on a protein surface, and finding the regions with the most favorable binding free energy. The method then finds the con- sensus site that binds the highest number of different probes. The probe–protein interactions at this site are compared to the intermolecular interactions seen in the known complexes of the enzyme with various ligands (substrate analogs, products, and inhibitors). We have mapped thermolysin, for which experimental mapping results are also available, and six further enzymes that have no experimental mapping data, but whose binding sites are well characterized. With the exception of halo- alkane dehalogenase, which binds very small substrates in a narrow chan- nel, the consensus site found by the mapping is always a major subsite of the substrate-binding site. Furthermore, the probes at this location form hydrogen bonds and non-bonded interactions with the same residues that interact with the specific ligands of the enzyme. Thus, once the struc- ture of an enzyme is known, computational solvent mapping can provide detailed and reliable information on its substrate-binding site. Calcu- lations on ligand-bound and apo structures of enzymes show that the mapping results are not very sensitive to moderate variations in the pro- tein coordinates. q 2003 Elsevier Ltd. All rights reserved. Keywords: structural genomics; X-ray structure; protein solvation; organic solvent; ligand binding *Corresponding author Introduction A major challenge in structural genomics is the elucidation of biochemical and biological proper- ties of enzymes, including the determination of amino acid residues that belong to the ligand/ substrate-binding site. 1,2 The two main sources of information on specific molecular interactions are the structures of the enzyme, co-crystallized with various ligands (substrates, cofactors, inhibitors, products, and transition state analogs), and site- directed mutagenesis of the putative binding site residues. Since the available complexes provide complete structural characterization only for a frac- tion of the enzymes with known structure, 2 and mutational analyses are slow and labor-intensive, developing a method for determining the func- tional site on the basis of protein structure has been an important goal. 3 A potentially useful strategy for determining ligand-binding sites on the surface of a protein is solvent mapping, i.e. solving the X-ray structure of the protein in a variety of organic solvents. 4,5 0022-2836/$ - see front matter q 2003 Elsevier Ltd. All rights reserved. Present addresses: S. Dennis, Biotechnology Research Institute, National Research Council of Canada, Montreal, Canada; L. Brown III, Fish and Neave, New York City, NY 10020,USA. E-mail address of the corresponding author: [email protected]Abbreviations used: NMR, nuclear magnetic resonance; PDB, Protein Data Bank; CS-Map, computational solvent mapping; GRAMM, global range molecular matching; ACP, atomic contact potential; ACE, analytical continuum electrostatics; DMSO, dimethylsulfoxide; 2-PGA, 2-phosphoglycerate. doi:10.1016/j.jmb.2003.08.019 J. Mol. Biol. (2003) 332, 1095–1113
Transcript
Identification of Substrate Binding Sites in Enzymesby Computational Solvent Mapping
Michael Silberstein1, Sheldon Dennis2, Lawrence Brown III2
Tamas Kortvelyesi2,3, Karl Clodfelter1 and Sandor Vajda2*
1Program in BioinformaticsBoston University, Boston, MA02215, USA
2Department of BiomedicalEngineering, Boston University44 Cummington Street, BostonMA 02215, USA
3Department of PhysicalChemistry, University ofSzeged, 6701 Szeged, P.O. Box105, Hungary
Enzyme structures determined in organic solvents show that most organicmolecules cluster in the active site, delineating the binding pocket. Wehave developed algorithms to perform solvent mapping computationally,rather than experimentally, by placing molecular probes (small moleculesor functional groups) on a protein surface, and finding the regions withthe most favorable binding free energy. The method then finds the con-sensus site that binds the highest number of different probes. Theprobe–protein interactions at this site are compared to the intermolecularinteractions seen in the known complexes of the enzyme with variousligands (substrate analogs, products, and inhibitors). We have mappedthermolysin, for which experimental mapping results are also available,and six further enzymes that have no experimental mapping data, butwhose binding sites are well characterized. With the exception of halo-alkane dehalogenase, which binds very small substrates in a narrow chan-nel, the consensus site found by the mapping is always a major subsite ofthe substrate-binding site. Furthermore, the probes at this location formhydrogen bonds and non-bonded interactions with the same residuesthat interact with the specific ligands of the enzyme. Thus, once the struc-ture of an enzyme is known, computational solvent mapping can providedetailed and reliable information on its substrate-binding site. Calcu-lations on ligand-bound and apo structures of enzymes show that themapping results are not very sensitive to moderate variations in the pro-tein coordinates.
A major challenge in structural genomics is theelucidation of biochemical and biological proper-ties of enzymes, including the determination of
amino acid residues that belong to the ligand/substrate-binding site.1,2 The two main sources ofinformation on specific molecular interactions arethe structures of the enzyme, co-crystallized withvarious ligands (substrates, cofactors, inhibitors,products, and transition state analogs), and site-directed mutagenesis of the putative binding siteresidues. Since the available complexes providecomplete structural characterization only for a frac-tion of the enzymes with known structure,2 andmutational analyses are slow and labor-intensive,developing a method for determining the func-tional site on the basis of protein structure hasbeen an important goal.3
A potentially useful strategy for determiningligand-binding sites on the surface of a protein issolvent mapping, i.e. solving the X-ray structureof the protein in a variety of organic solvents.4,5
0022-2836/$ - see front matter q 2003 Elsevier Ltd. All rights reserved.
Present addresses: S. Dennis, Biotechnology ResearchInstitute, National Research Council of Canada,Montreal, Canada; L. Brown III, Fish and Neave, NewYork City, NY 10020,USA.
Abbreviations used: NMR, nuclear magneticresonance; PDB, Protein Data Bank; CS-Map,computational solvent mapping; GRAMM, global rangemolecular matching; ACP, atomic contact potential; ACE,analytical continuum electrostatics; DMSO,dimethylsulfoxide; 2-PGA, 2-phosphoglycerate.
doi:10.1016/j.jmb.2003.08.019 J. Mol. Biol. (2003) 332, 1095–1113
Data for elastase4– 6 and thermolysin7,8 show thatthe protein structure remains virtually identical tothe native structure, and a limited number oforganic molecules (typically 1 to 12) are associatedwith the protein surface in the first shell of watermolecules. The power of the method arises fromsuperimposing at least four or five structures of aprotein solved in different solvents.5 For enzymes,the probes cluster in the active site, forming a “con-sensus” site that delineates the binding pocket. Allother binding sites are either in crystal contact,occur only at high ligand concentrations, or are insmall, buried pockets that bind only a subset ofthe solvent molecules rather than all of them. Thepreferential binding of organic molecules to theactive site has also been shown in aqueous solutionby NMR methods.9
Since experimental solvent mapping requiresrepeated structure determination, and the proteinmay have to be cross-linked for added stability inorganic solvents, the method is relatively expen-sive. We have developed algorithms to performthe mapping computationally by using smallorganic molecules as probes on the protein surface,and determining the consensus sites that bind anumber of different probes.10,11 The method hasbeen first applied to hen egg-white lysozyme9 andthermolysin,7,8 because these proteins have beenexperimentally mapped using a number of organicsolvents. In both cases, the probes cluster in theactive site, in good agreement with the results ofthe mapping experiments.
While structural genomics efforts are likely toprovide structures for an increasing number ofpoorly characterized proteins, few computationaltools are available for determining the functionallyimportant residues,12 – 20 even when the structure isknown, and hence computational mapping ispotentially important. However, several problemsneed to be addressed before the method can beconsidered a useful tool. First, both experimentaland computational mapping methods have beenapplied only to a handful of proteins. Thus, thegeneral applicability of the approach is not at allclear, and more proteins should be mapped to seeif the organic solvents cluster in the active site, irre-spective of their size and polarity.4 – 8 Second,assuming that such clustering occurs, it is stillnecessary to study a number of well-knownenzymes, and to carefully evaluate the informationprovided by mapping.
Here we address the above problems. First, themapping algorithm is applied to thermolysin, theprotein with the most extensive experimental map-ping data available. The results are compared tothe ligand positions in the X-ray structures of theprotein, determined in aqueous solutions of iso-propanol, acetone, acetonitrile, and phenol.7,8 Theinteractions between the probes and particularresidues of the protein are also compared to theinteractions seen in the known complexes ofthermolysin with various ligands (substrate andtransition state analogs, products, and inhibitors),
extracted from the RCSB PDB. Second, we map sixenzymes, enolase, fructose-1,6-biphosphatase, ribo-nuclease T1, trypsin, haloalkane dehalogenase, andtriosephosphate isomerase, that have no experi-mental mapping data, but whose binding sites arewell characterized. These particular enzymes wereselected because their substrate binding sites arenot in the largest pockets,21 thereby avoiding thepossibility that the mapping finds the largestcrevice on the protein surface, which is frequentlythe case when using simple geometric methods.15–18
We map each protein using acetone, urea, dimethyl-sulfoxide (DMSO), isopropanol, t-butanol, andphenol as probes, identify the consensus site, andcompare the results to the interactions extractedfrom all complexes of these enzymes with variousligands in the PDB. Mapping is performed bothfor the ligand-bound and the apo structures ofeach enzyme.
With the exception of haloalkane dehalogenase,which binds substrates that are smaller than someof the probes, the consensus site with the highestnumber of different probes occurs in a major sub-site of the enzyme active site. Clusters at nearbylocations indicate other subsites of the active site,and hence are also considered in the further analy-sis. As we will show, the selected clusters generallydelineate the entire active site. In particular, theresidues of an enzyme that most frequently interactwith the probes also bind many ligands (substrateanalogs, products, and inhibitors). Apart from par-ticular cases in which either the binding site is notaccessible to probes, or part of the protein is notpresent in the calculations, the mapping alwaysfinds most of the binding site residues, and thereare very few false positives, i.e. residues hit by theprobes that do not belong to the binding site. Ourresults suggest that the clustering of organic sol-vents in the binding sites of enzymes is a generalproperty that applies to all enzymes, and thus sol-vent mapping is a potentially important tool tostudy poorly characterized enzymes if their struc-ture is available.
Results
Identification of the thermolysin binding site
Thermolysin is zinc endopeptidase with twoquasi-spherical domains separated by a largegroove containing the active site zinc ion, coordin-ated by H142, H146, E166, and one watermolecule.22,23 Since structures are available formore than 20 complexes of thermolysin withbound ligands, including transition-state analogueinhibitors, the binding site and catalytic mechan-ism are well understood. English et al.7,8 deter-mined high resolution crystal structures ofthermolysin, generated from crystals soaked inaqueous solutions of isopropanol, acetone, aceto-nitrile, and phenol. An increasing number of sol-vent interaction sites could be identified as the
1096 Computational Solvent Mapping
solvent concentration was increased, up to 12bound molecules in the case of isopropanol. How-ever, the S0
1 subsite was shown to be exceptionalon two accounts. First, at low solvent concen-trations, this is the only binding site, and the con-centrations must be substantially increased (up to80% in the case of isopropanol) before bindingoccurs at any other location. Second, superimpos-ing all structures shows that S0
1 is the only sitewhere all four solvent molecules bind. Isopropanolalso binds to subsites S1 and S2, but only at highconcentrations.7 Figure 1a shows the ligand posi-tions in the active site of superimposed thermo-
lysin structures solved in 10% isopropanol,7 50%acetone, 50% acetonitrile, and 50 mM phenol.8
Computational mapping was applied to athermolysin structure (RCSB PDB code: 2tlx), co-crystallized with the dipeptide Val-Lys, a cleavageproduct, which is also shown in Figure 1 for refer-ence. The PDB does not include any thermolysinstructure without a bound ligand. We haveremoved the peptide, the active site Zn2þ, and allcrystallographic water molecules, and mapped theentire protein surface using both the CS-Map algor-ithm and the GRAMM-based approach to map-ping. In agreement with the experimental data,7,8
Figure 1. Experimental and computational mapping of thermolysin. a, Superimposed ligand positions in thermoly-sin co-crystallized with the V-K dipeptide (2tlx), and in structures solved in 10% isopropanol,7 50% acetone, 50% aceto-nitrile, and 50 mM phenol.8 The color scheme used for the ligands is ochre, V-K dipeptide; red, isopropanol; blue,acetone; black, acetonitrile; and purple, phenol. For the protein side-chains we use the standard atomic colors, i.e.car-bon, grey; oxygen, red; nitrogen, blue; and hydrogen, white. All solvents bind in the S0
1 pocket, and isopropanol alsobinds at the S1 and S2 sites (the latter is not shown). b, Computational mapping of thermolysin using the CS-Map algor-ithm. The Figure shows the main consensus site in the S0
1 pocket that binds all four solvents (Table 1, site 1), and thesecond consensus site close to S1, which binds three solvents (Table 1, site 2). c, Distribution of intermolecular non-bonded interactions among thermolysin residues. The interactions were determined from three sources: computationalmapping; extracted from 43 complexes of thermolysin with different ligands in the RCSB PDB database; and exper-imental mapping.7,8 Computational mapping results are based on the interactions found between various thermolysinresidues and the probes in the main consensus site. The Figure shows the union of the three sets of interacting residuesas determined by the three methods. d, The same as c, but for hydrogen bonds rather than non-bonded interactions.
Computational Solvent Mapping 1097
isopropanol, acetone, acetonitrile, and phenol wereused as probes. For each method, the five lowestfree energy clusters for each probe were super-imposed (see Methods) to find the consensus sitesshown in Table 1. The integers in this Table repre-sent the ranking of probe clusters, e.g. the consen-sus site 1 found by CS-Map is located in the S0
1
pocket, contains the fourth lowest free energy clus-ter of acetone, the second lowest free energy clusterof phenol, and so on. For reference, Table 1 alsoshows the distances from the center of a isopro-panol molecule, labeled as IPA1 in the X-ray struc-tures of thermolysin solved in isopropanol,7 whichbinds in the S0
1 pocket.According to Table 1, CS-Map finds a single con-
sensus site that binds all four molecules in the S01
pocket (Figure 1b), in good agreement with theexperimental data. Phenol, acetone, and aceto-nitrile cluster at two additional positions, the firstbeing close to the S1 subsite (Table 1, consensussite 2). Although the computational mapping alsoplaces the lowest free energy isopropanol clusterinto the S1 pocket, this location is distinct from thesecond consensus site that includes the other threesolvents. GRAMM also finds a single consensussite, with four solvents bound, in the S0
1 site, evencloser to IPA1 than the one found by CS-Map. Themethod places the lowest free energy clusters ofacetone and isopropanol, and the second lowestfree energy clusters of acetonitrile in an almostcompletely buried pocket (Table 1, site 2 forGRAMM). It is interesting that this pocket hasbeen shown experimentally to bind three of thefour solvents at elevated concentrations, but theexception was acetonitrile rather than phenol.8
While CS-Map and GRAMM yield the same con-sensus site for thermolysin, the results also showthat GRAMM has a higher tendency to put probesin largely buried pockets. We note that combiningthe results from CS-Map and GRAMM we findthe main consensus site to include eight probeclusters, whereas at most three clusters overlap atany other location. As will be discussed further,such combination of results from the two methodsgenerally helps to better discriminate the consen-sus site from other locations that bind some of theprobes.
In the case of thermolysin we have used theCS-Map results to characterize the binding site.Since the main consensus site (Table 1, site 1) andsite 2 are within 3 A to each other, both were con-sidered in the analysis (see Methods), and theclusters at both locations were divided into sub-clusters. Sub-clustering shows that each probe mol-ecule binds in a number of rotational states, withthe non-polar moiety located in a hydrophobicpocket defined by the side-chains of L202, F130,L133, and F114 (Figure 1b), and the polar partpointing toward various polar patches on the pro-tein, in some cases forming one or two hydrogenbonds.10 The X-ray structures also suggest that,apart from the solvent in the buried pocket, thebound molecules are fairly mobile, generally withB factors around 60, and the existence of severalpossible binding modes has been noted by thecrystallographer.7,8 Selecting a representative con-formation from each sub-cluster, we counted thenon-bonded interactions and hydrogen bondsbetween the probes and the protein, and deter-mined their distribution among the amino acidresidues.
The above distributions were compared to theones based on experimental solvent mapping,7,8 aswell as to the interactions extracted from the 23thermolysin complexes in the RCSB PDB. Thebinding of substrate and transition state analogs,products, and inhibitors always involves thelargely hydrophobic S0
1 sub-site, with the substratesand longer inhibitors extending toward sub-sites S1
and S2. At least four hydrogen bonds are formed ineach complex, most frequently with the side-chainsof R203, E143, Y157, and N112, and with the polarbackbone atoms of Y115, A113, and N111. Asshown in Figure 1c and d, the residues that areimportant for the binding of specific ligands alsointeract with many probes.
While experimental solvent mapping identifiesonly a subset of the important residues (E143,R203, N112, and A113), computational mappingprovides essentially complete information on theresidues in the binding site, in terms of both non-bonded interactions and hydrogen bonds (Figure 1cand d, respectively). Indeed, H142, H146, andE166 coordinate the Zn2þ in the active site, E143
Table 1. Ranking of probe clusters within the consensus sites for thermolysin
Distance of each cluster center from the isopropanol position IPA17 is shown in parentheses.a The two consensus sites in the substrate binding region are shown in bold.
1098 Computational Solvent Mapping
serves as the general base, Y157 and H231 providefurther stabilization of the transition state, whileN112 and the backbone of A113 form hydrogenbonds with the leaving group.22,23 While the sameresidues interact with many of the probes, themapping results reflect the importance of each resi-due for substrate binding rather than for catalyticactivity. For example, the mapping finds the high-est number of hydrogen bonds for R203(Figure 1d) which does not directly participate inhydrolysis, but forms hydrogen bonds with thecarbonyl group of a residue at the P0
1 position, andis known to be crucial for substrate binding.24 Themapping does not find D226, which is part of thecatalytic mechanism,22 but the D226A mutationintroduces only a minor perturbation in theactivity.25 It is important that we do not find anyfalse positives, i.e. amino acid residues hit by theprobes that are not part of the binding site.
Mapping and binding site identification inmodel enzymes
In our previous paper10 we mapped hen egg-white lysozyme, which binds polysaccharides andhas a very large cleft six saccharide units long.The mapping placed the lowest free energy clustersfor each of eight different solvents in sub-site C ofthe binding site, in good agreement with inter-molecular Overhauser effects that show site C tobind, almost exclusively, all eight compounds inaqueous solution.9 Since finding a large bindingsite was really easy, here we study six enzymes,enolase (1ebg), ribonuclease T1 (1rnt), triosephos-phate isomerase (2ypi), fructose-1,6-biphosphatase(1fbc), trypsin (1tng), and haloalkane dehalogenase(2dhc), that all have relatively small binding sites.21
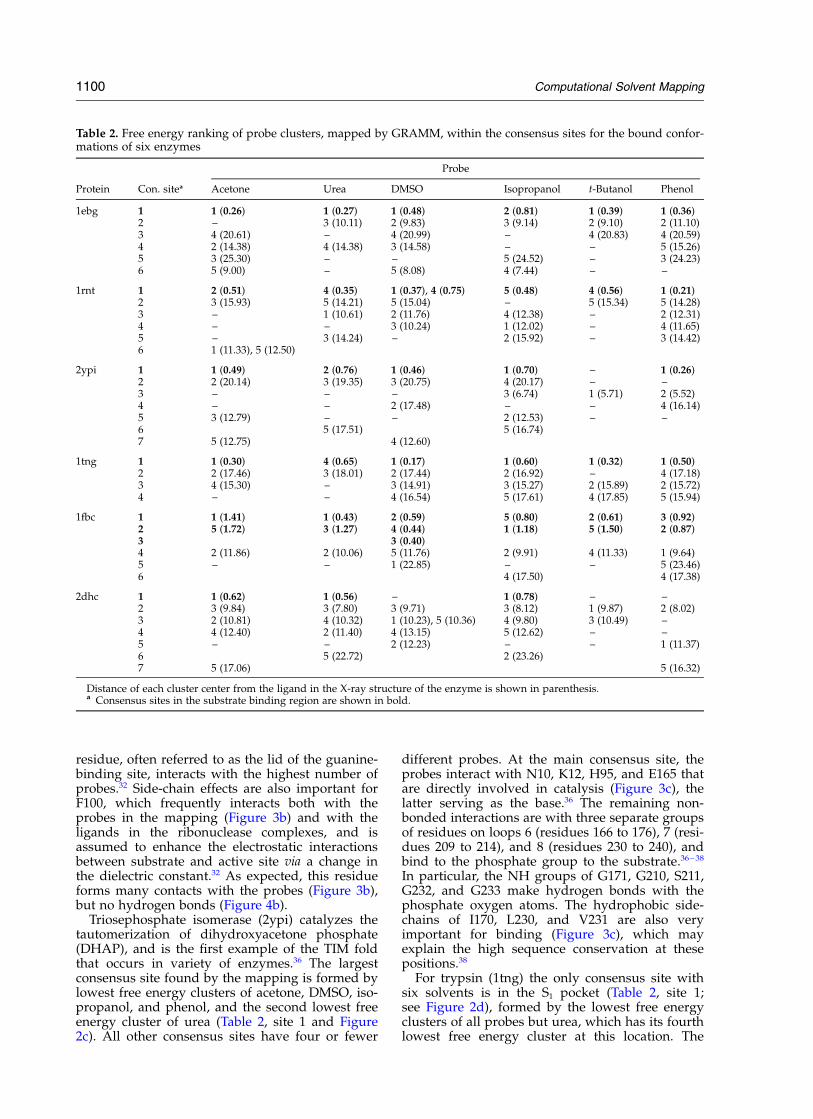
This eliminates the possibility that the mappingsimply finds the largest pocket on the protein sur-face. All ligands, including ions and crystallo-graphic water molecules, were removed before themapping by the less reliable, but faster GRAMM-based approach. Acetone, urea, DMSO, isopro-panol, t-butanol, and phenol were used as probes.The five lowest free energy clusters of each probewere superimposed (see Methods) to find the con-sensus sites shown in Table 2.
Enolase (1ebg) catalyzes the dehydration of2-phospho-D-glycerate (2-PGA) during glycolysis,and contains two Mg ions in the binding site.26 – 28
Computational mapping, applied to the proteinfinds only one position at which clusters of all sixprobes overlap (Table 2, site 1 and Figure 2a). Asshown in Table 2, these clusters are the lowest freeenergy ones for all solvents but isopropanol,which has its second lowest free energy cluster atthis location. The consensus clustering occurs inthe active site, with cluster centers less than 1 Aaway from the position of 2-PGA. All other consen-sus sites are formed by the clusters of four or lessdifferent probes (Table 2).
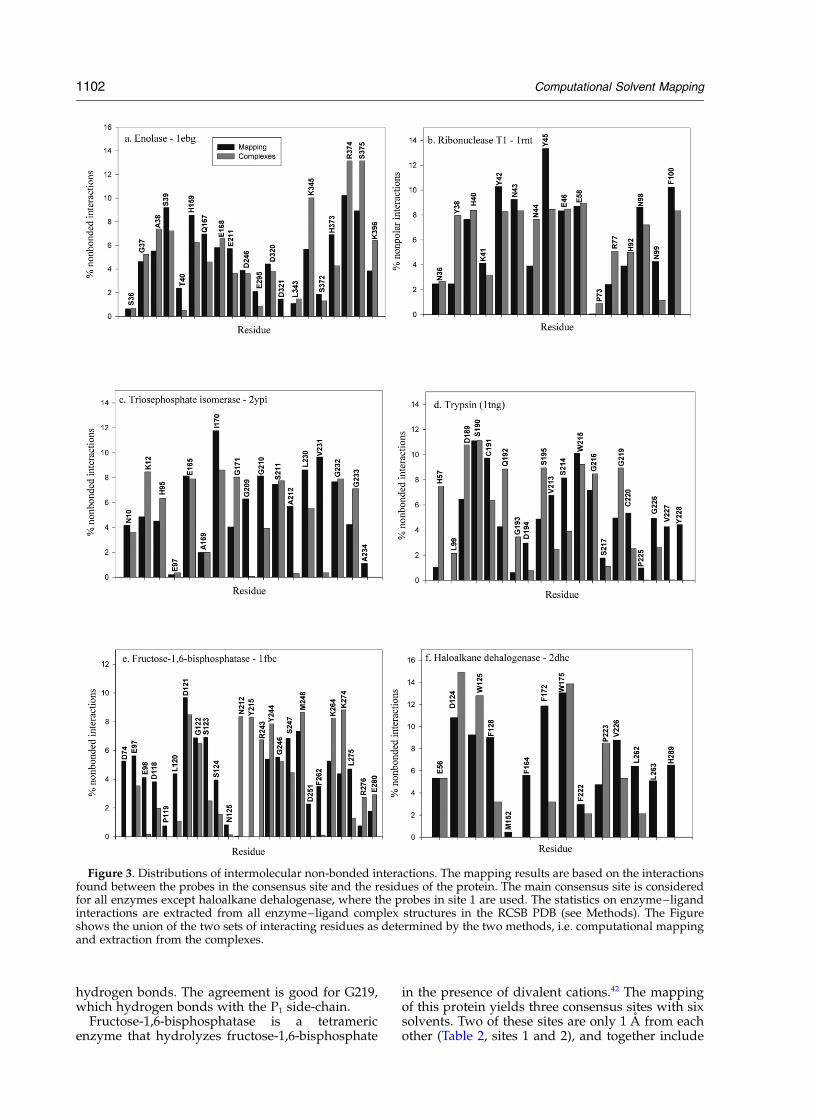
In the clusters belonging to the main consensussite, the probes interact with all the residues that
participate in the catalytic mechanism (Figures 3aand 4a). These residues are K345, the catalyticbase; E211, the catalytic acid which donates protonto C3 hydroxyl group of 2-PGA; K396, interactingwith one of the C1 carboxylate oxygen atoms tostabilize the redistribution of negative chargeformed in the intermediate; E168, which may beessential for proper orientation of K396 and E211,as well as pKa adjustment of these residues; andH373 which interacts with C3 hydroxyl oxygenatom of 2-PGA.26 – 28 However, the highest numbersof contacts are found for residues that are import-ant for substrate binding rather than catalysis.These are S39, which coordinates the lower affinityMg ion,29 and H159, R374, and S375 that interactwith the phosphate group of the substrate (Figure3a).26 –28 Recently, an alternative mechanism hasbeen proposed in which H159 serves as the cata-lytic base,30 but later it was shown that the H159Amutant of yeast enolase still has 0.2% of the nativeactivity.31
In general, there is an excellent agreementbetween the non-bonded interactions predicted bythe mapping, and those seen in the complexes ofenolase with various ligands (Figure 3a). Accord-ing to Figure 4a, the predicted and observedhydrogen bonds differ substantially more. Themain deviation is due to S39, which coordinatesthe lower affinity Mg2þ through its backbone car-bonyl and side-chain hydroxyl. Mapping has beenperformed without metal ions, and S39 hydrogenbonds with almost all probes. By contrast, theside-chains of D246, E295, and D320 that coordin-ate the higher affinity Mg2þ, did not show a strongtendency to form hydrogen bonds (Figure 4a),although they interact with many probes (Figure3a). All other hydrogen-bonding groups are cor-rectly identified by the mapping.
Ribonuclease T1 (1rnt) is an extensively studiedenzyme that catalyzes the hydrolysis of RNA atguanylyl residues.32 According to the mapping,we have all six solvents clustering in the activesite (Table 2, site 1). The probes interact with thecatalytic residues E58, H92, and H40,32 but the resi-dues with the highest number of contacts andhydrogen bonds are in the guanine-binding loopY42–E46 (Figures 3b and 4b). These latter residuesrender ribonuclease T1 guanine-specific through aseries of intermolecular hydrogen bonds, and theirmutations affect the dissociation constant of theenzyme–substrate complex but do not affect theturnover rate.33 – 35 We find the strongest hydrogenbonding affinity for N43, and large numbers ofnon-bonded interactions for Y45 and Y42. Thelatter is known to contribute significantly toguanine binding through a face-to-face parallelstacking, and the interactions with the side-chainare revealed by the mapping (Figure 3b). Bycontrast, for N43 and Y45 most interactions arewith the backbone, i.e. the NH group of N43interacts with guanine N7, and the NH ofY45 hydrogen bonds to O6 of guanidine moiety.33
The Y45 side-chain is also important, and this
Computational Solvent Mapping 1099
residue, often referred to as the lid of the guanine-binding site, interacts with the highest number ofprobes.32 Side-chain effects are also important forF100, which frequently interacts both with theprobes in the mapping (Figure 3b) and with theligands in the ribonuclease complexes, and isassumed to enhance the electrostatic interactionsbetween substrate and active site via a change inthe dielectric constant.32 As expected, this residueforms many contacts with the probes (Figure 3b),but no hydrogen bonds (Figure 4b).
Triosephosphate isomerase (2ypi) catalyzes thetautomerization of dihydroxyacetone phosphate(DHAP), and is the first example of the TIM foldthat occurs in variety of enzymes.36 The largestconsensus site found by the mapping is formed bylowest free energy clusters of acetone, DMSO, iso-propanol, and phenol, and the second lowest freeenergy cluster of urea (Table 2, site 1 and Figure2c). All other consensus sites have four or fewer
different probes. At the main consensus site, theprobes interact with N10, K12, H95, and E165 thatare directly involved in catalysis (Figure 3c), thelatter serving as the base.36 The remaining non-bonded interactions are with three separate groupsof residues on loops 6 (residues 166 to 176), 7 (resi-dues 209 to 214), and 8 (residues 230 to 240), andbind to the phosphate group to the substrate.36 – 38
In particular, the NH groups of G171, G210, S211,G232, and G233 make hydrogen bonds with thephosphate oxygen atoms. The hydrophobic side-chains of I170, L230, and V231 are also veryimportant for binding (Figure 3c), which mayexplain the high sequence conservation at thesepositions.38
For trypsin (1tng) the only consensus site withsix solvents is in the S1 pocket (Table 2, site 1;see Figure 2d), formed by the lowest free energyclusters of all probes but urea, which has its fourthlowest free energy cluster at this location. The
Table 2. Free energy ranking of probe clusters, mapped by GRAMM, within the consensus sites for the bound confor-mations of six enzymes
Probe
Protein Con. sitea Acetone Urea DMSO Isopropanol t-Butanol Phenol
Distance of each cluster center from the ligand in the X-ray structure of the enzyme is shown in parenthesis.a Consensus sites in the substrate binding region are shown in bold.
1100 Computational Solvent Mapping
probes establish interactions with the specificitydetermining residues D189 and G216, and withcatalytic residues S195 and H5739,40 (Figure 3d).Most contacts occur with S190 and the backboneatoms of C191, W215, S214, and V213. The lastthree residues are known to fix the scissile bond ofthe substrate in a fixed orientation.39,41 The side-chain of V213 is at the bottom of the S1 pocket,and interacts with the probes more often than it isseen in the complexes of trypsin with variousligands. Similarly, the residue G226, the backbone
of V227, and the side-chain of Y228 are all deep inthe binding site, and thus are more available tothe probe than to the larger substrate, resulting insome overprediction of their interactions (Figure3d). The mapping finds many hydrogen bondswith S190, formed both by the backbone and bythe side-chain (Figure 4d). Since S190 hydrogenbonds with the P1 side-chain,41 this prediction iscorrect. The probes also form hydrogen bondswith W215 and C191 that contact the P3 and P1 resi-dues, respectively, in the substrate, but rarely form
Figure 2. Consensus sites found by computational mapping, superimposed with the specific ligand of the enzyme.The color scheme for the ligands is ochre, ligand in X-ray structure of the enzyme; blue, acetone; yellow, urea; pink,DMSO; red, isopropanol; green, t-butanol; and purple, phenol. a, Enolase (1ebg), ligand: phosphonoacetohydroxamate.b, Ribonuclease T1 (1rnt), ligand: 20-guanylic acid. c, Triosephosphate isomerase (2ypi), ligand: 2-phosphoglycolate. d,Trypsin (1tng) ligand: aminomethylcyclohexane. e, Fructose-1,6-bisphosphatase (1fbc) ligand: 2,5-anhydroglucitol-1,6-biphosphate. Sites 1 and 2 are shown overlapping the two ends of the ligand. f, Haloalkane dehalogenase (2dhc),ligand: 1,2-dichloroethane. Site 4 is the putative ligand collision site.30 The mapping suggests that the substratebound at site 4 is shifted toward site 2 (one of the two main consensus sites), and then enters the channel and movestoward the catalytic site (site 1). The role of the second main consensus site (site 3) is not clear.
Computational Solvent Mapping 1101
hydrogen bonds. The agreement is good for G219,which hydrogen bonds with the P1 side-chain.
Fructose-1,6-bisphosphatase is a tetramericenzyme that hydrolyzes fructose-1,6-bisphosphate
in the presence of divalent cations.42 The mappingof this protein yields three consensus sites with sixsolvents. Two of these sites are only 1 A from eachother (Table 2, sites 1 and 2), and together include
Figure 3. Distributions of intermolecular non-bonded interactions. The mapping results are based on the interactionsfound between the probes in the consensus site and the residues of the protein. The main consensus site is consideredfor all enzymes except haloalkane dehalogenase, where the probes in site 1 are used. The statistics on enzyme–ligandinteractions are extracted from all enzyme–ligand complex structures in the RCSB PDB (see Methods). The Figureshows the union of the two sets of interacting residues as determined by the two methods, i.e. computational mappingand extraction from the complexes.
1102 Computational Solvent Mapping
the lowest free energy clusters for acetone, urea,and isopropanol, and the second lowest freeenergy clusters for DMSO, t-butanol, and phenol.As described in Methods, nearby consensus sites
usually delineate different subsites of the activesite, and this is really the case for this protein,site 1 being close to the location of the sugarring in the enzyme–substrate complex, and site 2
Figure 4. Distributions of intermolecular hydrogen bonds. The mapping results are based on the interactions foundbetween the probes in the consensus site and the residues of the protein. The main consensus site is considered forall enzymes except haloalkane dehalogenase, where the probes in site 1 are used. The statistics on enzyme–ligandhydrogen bonds are extracted from all enzyme–ligand complex structures in the RCSB PDB (see Methods). The Figureshows the union of the two sets of interacting residues as determined by the two methods, i.e. computational mappingand extraction from the complexes.
Computational Solvent Mapping 1103
surrounding the 2-phosphate group of the sub-strate (Figure 2e). Site 3 in Table 2 also binds sixsolvents, but with substantially higher free ener-gies than sites 1 and 2 for four of the six probes.
The probes in the consensus site, formed by sites1 and 2, interact with the catalytic bases D74 andE98,42,43 but the most frequent interactions occurwith residues that bind the ligand or one of thecations (Figure 3e). These are: L120, G122, S123,S124, and N125, which form hydrogen bonds withthe 2-phosphate group of the substrate;42 S247,M248, and K274, which contact the sugar ring;41,42
Y244 and K264, which hydrogen bond to the6-phosphate group;43 and E97, D118, D121, R276,and E280, which coordinate with the cation.42 –44
The mapping does not find any interactions withN212, Y215, and R243. This result is due to map-ping only a monomer of the dimeric protein. SinceN212, Y215, and R243 are in a crevice formed byresidues from two subunits, restricting consider-ation to a single subunit in the mapping removesthe pocket, and the probes will not bind in thisregion.42 In fact, R243 of one subunit interacts withthe ligand bound to another subunit, and hencewill not appear to be important for binding if onlyone subunit is considered.
As emphasized, mapping generally reflects theimportance of residues for binding rather thanfor catalytic activity. Therefore, it is somewhatunexpected that it shows D74 and E98 to be rela-tively important (Figures 3e and 4e), in spite ofthe fact that these residues interact rarely with theligand, but were proposed to act as the catalyticbase, abstracting protons from the metal–hydroxidecomplex.45 Apart from the minor differences wehave mentioned, the agreement between predictedand observed non-bonded interactions is remark-ably good (Figure 3e). The hydrogen-bondingresidues are also correctly identified by the map-ping, but the predicted frequency is less accuratethan for the non-bonded interactions (Figure 4e).For example, S123 hydrogen bonds with the2-phosphate group of the substrate41 and hence isexpected to interact with the probes, but the fre-quency of predicted hydrogen bonds is dispropor-tionately large. The same applies to D121 thatcoordinates with a metal ion in the active site.43,45
For the haloalkane dehalogenase (2dhc) we findtwo consensus locations (Table 2, sites 2 and 3; seeFigure 2e), both with six different solvents. Sinceneither of the two is close to the bound substrate,ethylene dichloride, it may appear that the map-ping has failed, but this is not the case. Haloalkanedehalogenase binds very small ligands, such asethylene dichloride, and the binding site is in themiddle of a long and narrow channel.46,47 Consen-sus site 1 (see Figure 2f and Table 2), whichincludes the lowest free energy clusters for acetone,urea, and isopropanol, is exactly at this location,and the correlation between the frequency of non-bonded interactions revealed by the mapping andseen in the complexes of haloalkane dehalogenasewith ligands is very good (Figure 3e). However,
the larger solvents are unable to enter the channel.The two large consensus sites (sites 2 and 3) are atthe two ends of the channel. Thus, all ligands pre-ferentially bind at these locations, but only thesmall ligands (acetone, urea, and isopropanol) canmove into the channel toward the catalytic site(Table 2, site 1). An additional consensus site ofthree solvents (Table 2, site 4) is adjacent to site 3,and the existence of a collision complex formedduring halide import is supported by bothcrystallographic and kinetic evidence, the latterinvolving the mutations of residues T197 and F294that are at consensus site 4.47 Taken together, thesekinetic data and the mapping results stronglysuggest that the substrate enters the channel atsite 2 (Figure 2f). The role of binding at site 3 isnot clear.
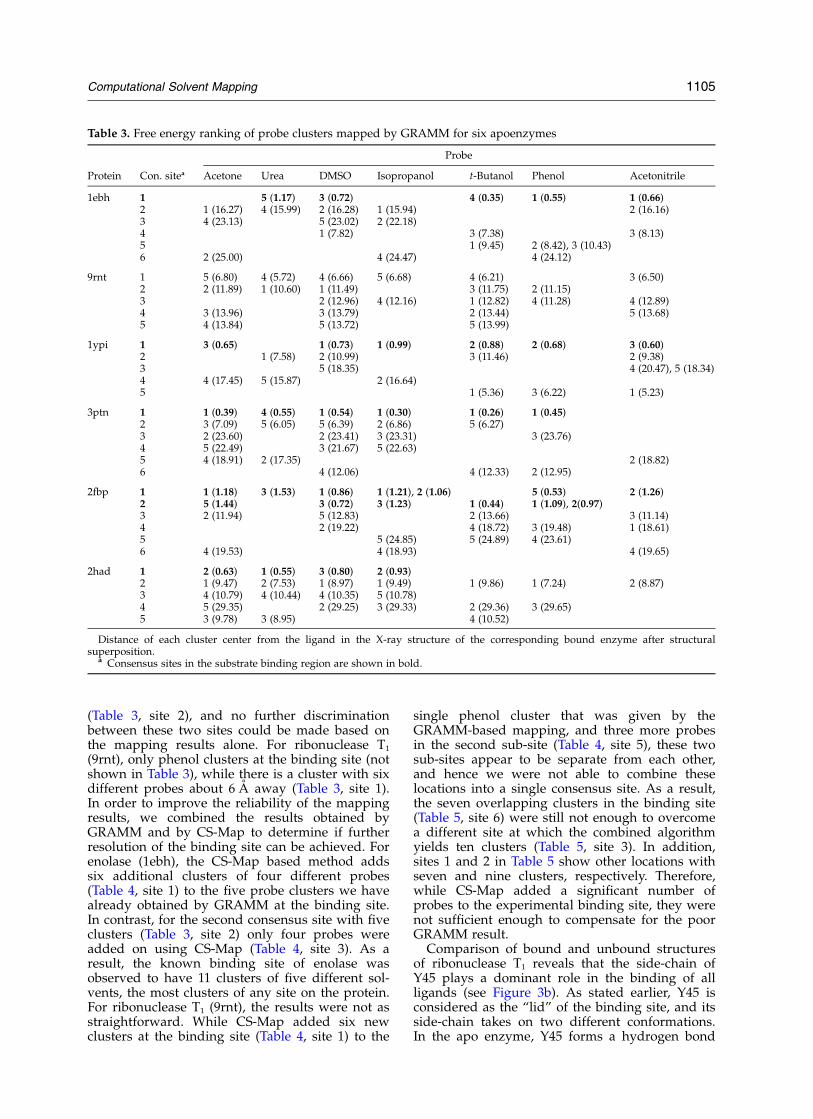
Mapping the apostructures of themodel enzymes
In order to study the effect of conformationalchanges on the mapping results, the sameGRAMM-based algorithm was applied to the apostructures of the six enzymes. Since more probesgenerally yield higher reliability of results, wehave added acetonitrile as the seventh probe.Table 3 shows the derived consensus sites. Forfour of the apo structures we were still successfulin locating the known substrate-binding site, withvery little deviation from the analysis of thebound forms. For triosephosphate isomerase(1ypi), six out of the seven probes cluster at theexperimental binding site, while the next largestconsensus site has only four different solvents.Trypsin (3ptn) also has six probes clustered at theexperimental S1-binding site, while its closestrunner-up site has five solvents clustered. For fruc-tose-1,6-bisphosphatase (2fbp), both subsites of thebinding site (as described earlier) were successfullyfound with seven and six solvent probes, respect-fully. The next most occupied site had only fourclustered probes. Finally, for haloalkane dehalo-genase (2had), the most occupied consensus siteconsisted of one of the two ends of the channelthat leads to the internal active site (Table 3, site2). This site had all seven probes successfullymapped to it. In addition to this, the active site(site 1) had four solvents clustered, while theadditional end of the channel (site 3) also had fourprobes. Therefore, as stated earlier, although themain consensus site for haloalkane dehalogenaseis not the internal active site, the observation thatmost probes cluster at the entrance of the deepinternal channel by which the substrate must tra-verse implies a successful mapping result.
The fast, GRAMM-based mapping algorithmwas less successful in locating the binding site ofthe remaining two enzymes, enolase and ribo-nuclease T1 when their apo structures were used.For enolase (1ebh) five different probes cluster atthe binding site (Table 3, site 1), but a secondlocation, about 16 A away, also binds five probes
1104 Computational Solvent Mapping
(Table 3, site 2), and no further discriminationbetween these two sites could be made based onthe mapping results alone. For ribonuclease T1
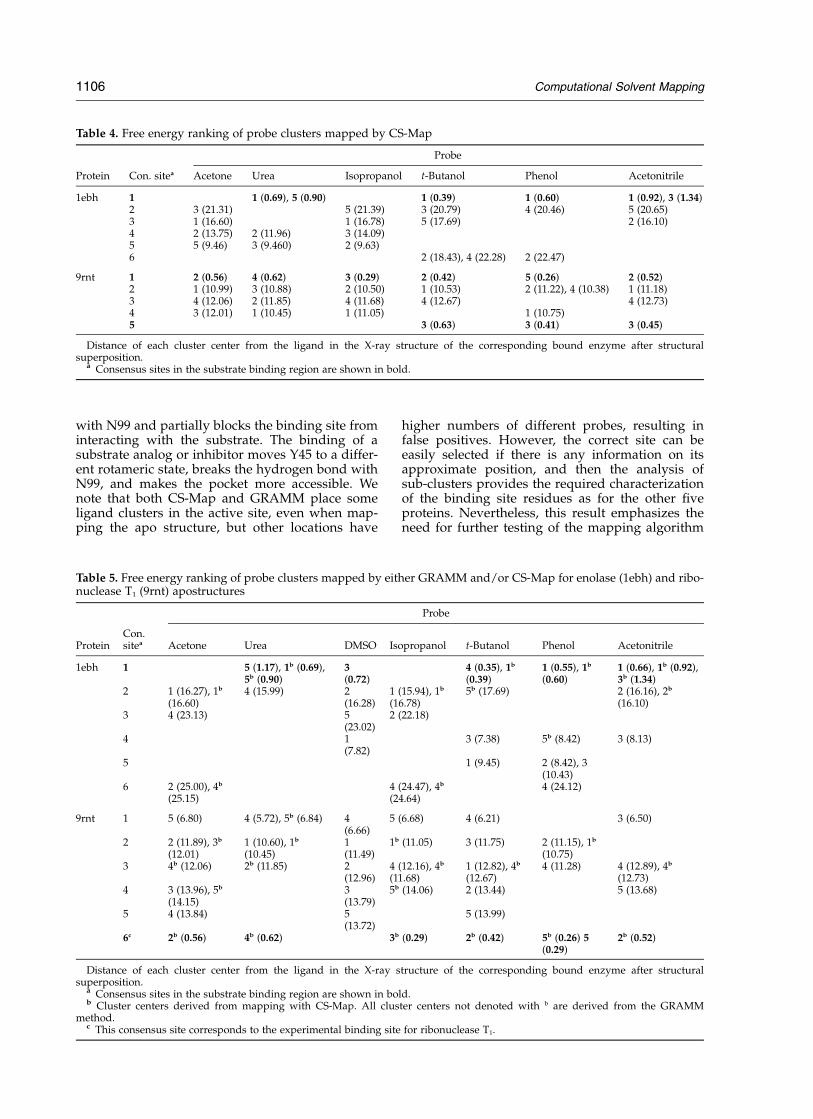
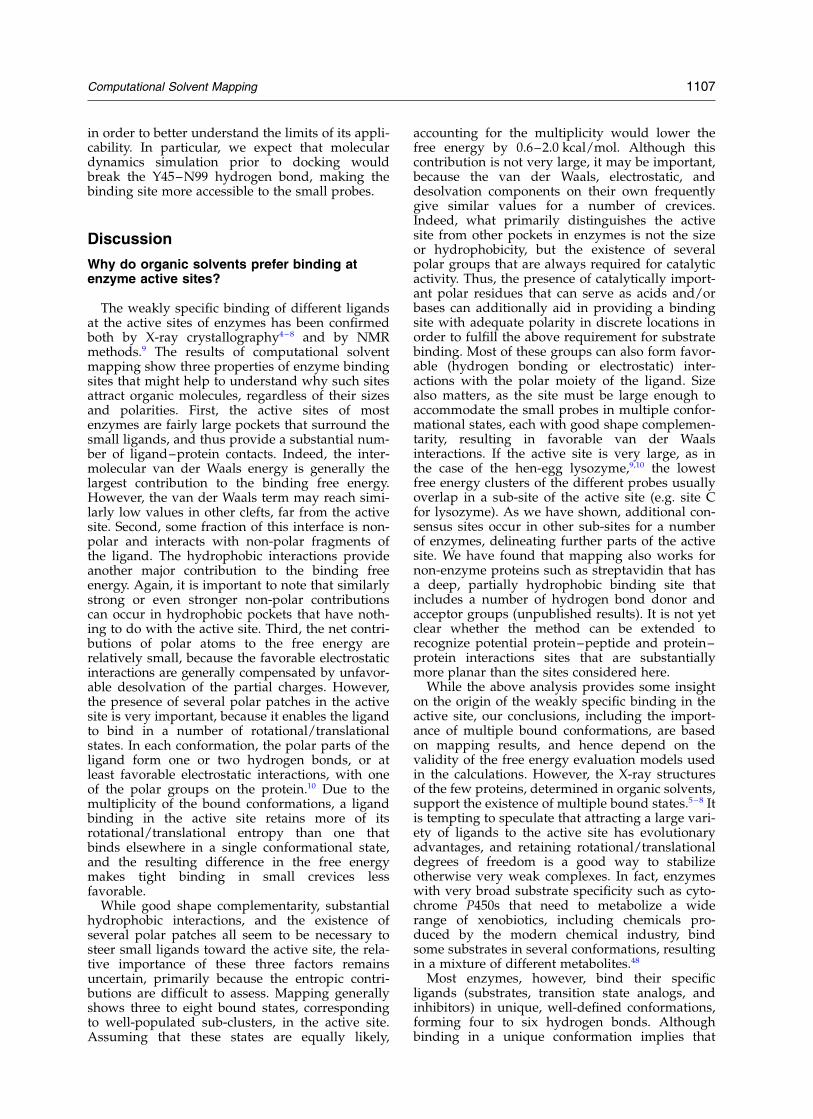
(9rnt), only phenol clusters at the binding site (notshown in Table 3), while there is a cluster with sixdifferent probes about 6 A away (Table 3, site 1).In order to improve the reliability of the mappingresults, we combined the results obtained byGRAMM and by CS-Map to determine if furtherresolution of the binding site can be achieved. Forenolase (1ebh), the CS-Map based method addssix additional clusters of four different probes(Table 4, site 1) to the five probe clusters we havealready obtained by GRAMM at the binding site.In contrast, for the second consensus site with fiveclusters (Table 3, site 2) only four probes wereadded on using CS-Map (Table 4, site 3). As aresult, the known binding site of enolase wasobserved to have 11 clusters of five different sol-vents, the most clusters of any site on the protein.For ribonuclease T1 (9rnt), the results were not asstraightforward. While CS-Map added six newclusters at the binding site (Table 4, site 1) to the
single phenol cluster that was given by theGRAMM-based mapping, and three more probesin the second sub-site (Table 4, site 5), these twosub-sites appear to be separate from each other,and hence we were not able to combine theselocations into a single consensus site. As a result,the seven overlapping clusters in the binding site(Table 5, site 6) were still not enough to overcomea different site at which the combined algorithmyields ten clusters (Table 5, site 3). In addition,sites 1 and 2 in Table 5 show other locations withseven and nine clusters, respectively. Therefore,while CS-Map added a significant number ofprobes to the experimental binding site, they werenot sufficient enough to compensate for the poorGRAMM result.
Comparison of bound and unbound structuresof ribonuclease T1 reveals that the side-chain ofY45 plays a dominant role in the binding of allligands (see Figure 3b). As stated earlier, Y45 isconsidered as the “lid” of the binding site, and itsside-chain takes on two different conformations.In the apo enzyme, Y45 forms a hydrogen bond
Table 3. Free energy ranking of probe clusters mapped by GRAMM for six apoenzymes
Probe
Protein Con. sitea Acetone Urea DMSO Isopropanol t-Butanol Phenol Acetonitrile
Distance of each cluster center from the ligand in the X-ray structure of the corresponding bound enzyme after structuralsuperposition.
a Consensus sites in the substrate binding region are shown in bold.
Computational Solvent Mapping 1105
with N99 and partially blocks the binding site frominteracting with the substrate. The binding of asubstrate analog or inhibitor moves Y45 to a differ-ent rotameric state, breaks the hydrogen bond withN99, and makes the pocket more accessible. Wenote that both CS-Map and GRAMM place someligand clusters in the active site, even when map-ping the apo structure, but other locations have
higher numbers of different probes, resulting infalse positives. However, the correct site can beeasily selected if there is any information on itsapproximate position, and then the analysis ofsub-clusters provides the required characterizationof the binding site residues as for the other fiveproteins. Nevertheless, this result emphasizes theneed for further testing of the mapping algorithm
Table 4. Free energy ranking of probe clusters mapped by CS-Map
Probe
Protein Con. sitea Acetone Urea Isopropanol t-Butanol Phenol Acetonitrile
Distance of each cluster center from the ligand in the X-ray structure of the corresponding bound enzyme after structuralsuperposition.
a Consensus sites in the substrate binding region are shown in bold.b Cluster centers derived from mapping with CS-Map. All cluster centers not denoted with b are derived from the GRAMM
method.c This consensus site corresponds to the experimental binding site for ribonuclease T1.
1106 Computational Solvent Mapping
in order to better understand the limits of its appli-cability. In particular, we expect that moleculardynamics simulation prior to docking wouldbreak the Y45–N99 hydrogen bond, making thebinding site more accessible to the small probes.
Discussion
Why do organic solvents prefer binding atenzyme active sites?
The weakly specific binding of different ligandsat the active sites of enzymes has been confirmedboth by X-ray crystallography4 – 8 and by NMRmethods.9 The results of computational solventmapping show three properties of enzyme bindingsites that might help to understand why such sitesattract organic molecules, regardless of their sizesand polarities. First, the active sites of mostenzymes are fairly large pockets that surround thesmall ligands, and thus provide a substantial num-ber of ligand–protein contacts. Indeed, the inter-molecular van der Waals energy is generally thelargest contribution to the binding free energy.However, the van der Waals term may reach simi-larly low values in other clefts, far from the activesite. Second, some fraction of this interface is non-polar and interacts with non-polar fragments ofthe ligand. The hydrophobic interactions provideanother major contribution to the binding freeenergy. Again, it is important to note that similarlystrong or even stronger non-polar contributionscan occur in hydrophobic pockets that have noth-ing to do with the active site. Third, the net contri-butions of polar atoms to the free energy arerelatively small, because the favorable electrostaticinteractions are generally compensated by unfavor-able desolvation of the partial charges. However,the presence of several polar patches in the activesite is very important, because it enables the ligandto bind in a number of rotational/translationalstates. In each conformation, the polar parts of theligand form one or two hydrogen bonds, or atleast favorable electrostatic interactions, with oneof the polar groups on the protein.10 Due to themultiplicity of the bound conformations, a ligandbinding in the active site retains more of itsrotational/translational entropy than one thatbinds elsewhere in a single conformational state,and the resulting difference in the free energymakes tight binding in small crevices lessfavorable.
While good shape complementarity, substantialhydrophobic interactions, and the existence ofseveral polar patches all seem to be necessary tosteer small ligands toward the active site, the rela-tive importance of these three factors remainsuncertain, primarily because the entropic contri-butions are difficult to assess. Mapping generallyshows three to eight bound states, correspondingto well-populated sub-clusters, in the active site.Assuming that these states are equally likely,
accounting for the multiplicity would lower thefree energy by 0.6–2.0 kcal/mol. Although thiscontribution is not very large, it may be important,because the van der Waals, electrostatic, anddesolvation components on their own frequentlygive similar values for a number of crevices.Indeed, what primarily distinguishes the activesite from other pockets in enzymes is not the sizeor hydrophobicity, but the existence of severalpolar groups that are always required for catalyticactivity. Thus, the presence of catalytically import-ant polar residues that can serve as acids and/orbases can additionally aid in providing a bindingsite with adequate polarity in discrete locations inorder to fulfill the above requirement for substratebinding. Most of these groups can also form favor-able (hydrogen bonding or electrostatic) inter-actions with the polar moiety of the ligand. Sizealso matters, as the site must be large enough toaccommodate the small probes in multiple confor-mational states, each with good shape complemen-tarity, resulting in favorable van der Waalsinteractions. If the active site is very large, as inthe case of the hen-egg lysozyme,9,10 the lowestfree energy clusters of the different probes usuallyoverlap in a sub-site of the active site (e.g. site Cfor lysozyme). As we have shown, additional con-sensus sites occur in other sub-sites for a numberof enzymes, delineating further parts of the activesite. We have found that mapping also works fornon-enzyme proteins such as streptavidin that hasa deep, partially hydrophobic binding site thatincludes a number of hydrogen bond donor andacceptor groups (unpublished results). It is not yetclear whether the method can be extended torecognize potential protein–peptide and protein–protein interactions sites that are substantiallymore planar than the sites considered here.
While the above analysis provides some insighton the origin of the weakly specific binding in theactive site, our conclusions, including the import-ance of multiple bound conformations, are basedon mapping results, and hence depend on thevalidity of the free energy evaluation models usedin the calculations. However, the X-ray structuresof the few proteins, determined in organic solvents,support the existence of multiple bound states.5 – 8 Itis tempting to speculate that attracting a large vari-ety of ligands to the active site has evolutionaryadvantages, and retaining rotational/translationaldegrees of freedom is a good way to stabilizeotherwise very weak complexes. In fact, enzymeswith very broad substrate specificity such as cyto-chrome P450s that need to metabolize a widerange of xenobiotics, including chemicals pro-duced by the modern chemical industry, bindsome substrates in several conformations, resultingin a mixture of different metabolites.48
Most enzymes, however, bind their specificligands (substrates, transition state analogs, andinhibitors) in unique, well-defined conformations,forming four to six hydrogen bonds. Althoughbinding in a unique conformation implies that
Computational Solvent Mapping 1107
more rotational/translational entropy is lost, theincrease in the free energy is more than compen-sated by favorable van der Waals and electrostaticinteractions.
Why do our mapping algorithms work?
Mapping proteins computationally rather thanexperimentally goes back as far as 1985, whenGoodford developed the GRID program49 to mapreceptor sites. Another popular approach to map-ping is the Multiple Copy Simultaneous Search(MCSS†50 version 2.1, Harvard University,Cambridge, MA, USA) method, which optimizesthe free energy of numerous ligand copies simul-taneously, each transparent to the others but sub-ject to the full force of the receptor. However, theclassical algorithms generally fail to reproduce theavailable NMR and X-ray data on the binding oforganic solvents to proteins. The major problem isthat they result in too many energy minima on thesurface of the protein, and it is difficult to deter-mine which of these minima is actually relevant.4
This shortcoming was demonstrated by Englishet al.,8 who used both GRID and MCSS to mapthermolysin for the binding sites of isopropanol,acetone, acetonitrile, and phenol, and comparedthe results to those of mapping experiments.While they found local minima close to the experi-mentally observed binding positions, the closestminima were generally not among those with thelowest free energies, resulting in false positives(i.e. configurations with favorable energy whichare not located near any experimentally observedbinding site).
The algorithms presented here differ from tra-ditional mapping methods in four major respects.First, while very different, both the CS-Map algor-ithm and the GRAMM-based mapping methodprovide much better sampling of the potentialbinding sites than GRID and MCSS that includeonly local minimization rather than any systematicsearch. Second, while neither GRID nor MCSSaccount for desolvation, the free energy potentialused in step 2 of our mapping algorithm includesa relatively accurate electrostatics and desolvationmodel. Third, the docked ligand positions areclustered, and the clusters, rather than individualdocked conformations, are ranked on the basis oftheir average free energies. The main goal of thisstep is to estimate the entropic effects of the mul-tiple bound states, a contribution that otherwisewould not be accounted for in our model. Dis-crimination by clustering, introduced by Bakerand co-workers in the context of protein structuredetermination,51 and extended by us to protein–protein docking,52 is based on the idea that thenative structure has more structural neighborsthan other, non-native conformations do. Indeed,
the multiple bound states in the active site resultin a cluster of low energy conformations thatdefine a relatively broad free energy minimum.
Clustering and considering the average freeenergies of the clusters eliminate most of the localminima that correspond to binding in narrow, iso-lated pockets. Nevertheless, this approach isunable to fully account for the extra entropy thatcomes from the multiplicity of the bound states,and hence the mapping is not expected to yieldperfect discrimination of the correct bound states.In fact, the ligand positions that are the closest tothe active site do not necessarily have the lowestvalues of the free energy (see Tables 1–4). Thefourth, and probably the most important, differ-ence between our method and earlier approachesis that we seek consensus sites at which the lowestfree energy clusters of different solvents overlap.Restricting considerations to consensus sitesimplies that some false positives for specificligands can be tolerated. For example, if the prob-ability of obtaining a false positive is as high as20%, but the false positives for the different probesare independently distributed over the protein sur-face, then the probability of obtaining a false con-sensus site using six probes is less than 0.01%. Inreality, the situation is less favorable, since thefalse positives tend to be in relatively large pocketsand hence are not independent. Nevertheless, aswe have shown, mapping with six or seven probesusually gives very good results.
Solvent mapping generalizes the geometricanalysis of protein binding sites
Since the size and shape of a protein cavity dic-tate the geometry of ligands that can bind there,geometry-based computational tools have beenused to predict putative binding sites.15 – 20 Forexample, PASS (Putative Active Sites with Spheres)is a simple computational tool that maps theprotein surface with a water-sized sphere tocharacterize regions of buried volume. Compu-tational solvent mapping generalizes the geometricanalysis by using a number of small molecularprobes with different sizes and shapes, and consist-ing of polar and non-polar fragments. As weargued, such probes are likely to prefer functionalsites to other cavities, because the functional sitesgenerally include a mixture of non-polar patches(for strong binding) and polar groups (forenzymatic activity). While it would be possible touse an arbitrary set of probes, the use of smallorganic solvents ensures that the results can becompared to data from solvent mappingexperiments.4 – 8 Furthermore, the detailed atomicmodels used in the mapping provide hydrogenbonding information that cannot be derived by ageometric analysis.
For comparison with the mapping results weapplied the PASS algorithm18 to the ligand-boundand apo structures of the six enzymes. As shownin Table 6, with two exceptions the ranked list of
† Evensen, E., Joseph-McCarthy, D. & Karplus, M.(1997).
1108 Computational Solvent Mapping
putative binding sites, generated by PASS, includesthe known binding site. However, the latter isranked first (in degree of confidence) only for twoof the bound structures (trypsin and ribonucleaseT1) and two of the apo structures (enolase and ribo-nuclease T1). We recall that the mapping fails torank the binding site first only for the ribonucleaseT1 apo structure. For haloalkane dehalogenase,PASS was able to find the location of one end (theentrance) of the extended binding channel, andwas not able to successfully predict any additionalpart of the protein with known biological signifi-cance, including the active site (Table 7). Addition-ally, the prediction of the channel entrance for theapo and bound forms of the enzymes, respectively,were fifth and fourth ranked. It is clear that PASS,employing a single spherical probe, provides lessspecific information on the binding site than themapping, which employs a variety of probes, eachsupplying its own geometric orientations as wellas its interspersions of hydrophobic locations withhydrogen bond donor and acceptor atoms.
Mapping versus docking
In principle, one should be able to predict thebinding properties of a protein by docking variousligands to its binding sites using docking programssuch as DOCK53 or Autodock.54 However, ligandbinding can substantially alter the structure of theprotein (see, e.g. Yu & Koshland),55 and docking to
the unbound form is a non-trivial problem.56,57
Low resolution and theoretically predicted recep-tors present even greater challenges.58 Dockingprograms are frequently used for finding potentialligands in large databases, but it has been observedthat the ligands found usually do not have thetightest fit, but instead leave some space move-ment in the binding site.56 Small ligands areobviously easier to dock than large ones, and thusmapping is generally less sensitive to variations instructure than docking. In fact, the only proteinfor which mapping failed to correctly identify theresidues that are important for ligand binding wasribonuclease T1. Docking results are generallymore sensitive to the conformational differencesbetween bound and apo forms, and hence thebound forms are used for drug design wheneveravailable.
Conclusions
Computational mapping employs small organicmolecules to probe the surface of proteins. Wehave performed mapping calculations for sevenenzymes. With the exception of haloalkane dehalo-genase, which binds very small substrates in anarrow channel, the probes cluster in major sub-sites of the substrate-binding site. For haloalkanedehalogenase, the clusters occur at the two endsof the channel, but the smaller probes also find the
Table 6. Prediction of experimental binding site locations using the PASS algorithm
a The number to the left represents the ranking of the binding site prediction while the number to the right represents the totalnumber of predicted sites along the protein surface. Any failed attempt to predict the experimental binding site is represented by –.
Table 7. Prediction of binding site locations on haloalkane dehalogenase using the PASS algorithm
EnzymeBound struc-ture, 2dhc
Prediction ofbinding site
Ranking of success-ful predictiona
Apo-struc-ture, 2had
Prediction ofbinding site
Ranking successfulpredictiona
Haloalkanedehalogenase
Active site Failed –/9 Active site Failed –/12
Consensussite 2b
Failed –/9 Consensussite 2b
Failed –/12
Consensussite 3b
Succeeded 5/9 Consensussite 3b
Succeeded 4/12
Consensussite 4b
Failed –/9 Consensussite 4b
Failed –/12
a The number to the left represents the ranking of the binding site prediction while the number to the right represents the totalnumber of predicted sites along the protein surface. Any failed attempt to predict the experimental binding site is represented by –.
b Refer to Table 2 for the designation of these specific consensus site locations. The significance of each of these four consensus sitesis described in the text. Note that the consensus sites specified in this Table are based solely on mapping results using 2dhc.
Computational Solvent Mapping 1109
active site. Residues that interact with manyligands (substrate analogs, products, and inhibi-tors) also tend to bind the probes with high fre-quency. Since the probe–residue interactionsreflect the residue’s role in binding rather thancatalytic activity, the method can be used to charac-terize the substrate binding sites of enzymes.
As we have shown, results are slightly betterwhen mapping ligand bound versus apo structuresof enzymes, a situation well known in structure-based drug design. However, since it is easier todock very small molecules to a rigid protein thanlarger ones, the sensitivity of results to moderatechanges in the protein coordinates remains rela-tively low.
Here we were able to resolve a number of openproblems. First, mapping results for sevenenzymes strongly suggest that the binding ofsmall organic compounds at the active site ofenzymes is a general phenomenon. Since X-raystructures have been determined in organic sol-vents only for a few enzymes, extending the analy-sis to more proteins was absolutely necessary forany progress. Second, the results convincinglyshow that solvent mapping can be performed com-putationally rather than experimentally. Third, theanalysis of mapping results enabled us to betterunderstand why the small ligands bind in theactive site, regardless of their sizes and polarities.Fourth, comparing the probe–protein interactionsin the mapping results with the ligand–proteininteractions, extracted from the X-ray structures ofenzyme–ligand complexes shows that the map-ping provides a detailed and reliable characteriz-ation of enzyme binding sites, and we hope thatwe will be able to apply it to a number of struc-tures produced by structural genomics initiatives.
Methods
Computational mapping by the CS-Map algorithm
The five computational steps of the algorithm are asfollows.9,10
Step 1: rigid body search
In the CS-Map algorithm10,11 a multi-start simplexmethod is used to move the probes around the protein,starting from a number of evenly distributed pointsover the entire protein surface, i.e. no a priori assumptionis made about the location of the binding site. The scor-ing function in the search is given by:
DGs ¼ DEelec þ DGdes þ Vexc ð1Þ
where DEelec denotes the direct (Coulombic) part of theelectrostatic energy, DGdes is the desolvation free energy,and Vexc is an excluded volume penalty term such thatVexc ¼ 0 if the ligand does not overlap with the protein.The electrostatic energy is determined by the expressionDEelec ¼
Pi Fiqi; where qi is the charge of the ith probe
atom, and Fi is the electrostatic field of the solvated pro-tein at that point.59,60 The electric field F is calculated bya finite difference Poisson–Boltzmann (FDPB) method59,60
using the CONGEN program.61 Dielectric constants1 ¼ 4 and 1 ¼ 78 are used for the protein and the solvent,respectively. We use the template partial charges pro-vided by the Quanta program† (Molecular Simulations,Inc) for the probe molecules. The desolvation term,DGdes, is obtained by the Atomic Contact Potential(ACP) model,62 an atomic level extension of theMiyazava–Jernigan potential.63
In this step, we also use an alternative approach basedon the docking program GRAMM (global range molecu-lar matching).64,65 The program places the protein andthe ligand molecule on separate grids, and performs anexhaustive six-dimensional search through the relativeintermolecular translations and rotations using a veryefficient Fast Fourier Transform (FFT) correlation tech-nique and a simple scoring function that measuresshape complementarity and penalizes overlaps. Wehave used 1.5 A grid step for translations and 15o incre-ments for rotations. A total of 1000 docked confor-mations were retained for refinement in step 2.
Step 2: minimization and re-scoring
Step 1 produces a large number of protein–ligandcomplexes at various local minima of DGs. The freeenergy of each complex is minimized using the moreaccurate free energy potential:
DG ¼ DEelec þ DEvdw þ DGpdes ð2Þ
where DEvdw denotes the receptor–ligand van der Waalsenergy, and the superscript in DGdes
p emphasizes that thedesolvation term includes the change in the solute–solvent van der Waals interaction energy. The sumDEelec þ DGdes
p is obtained by the Analytic ContinuumElectrostatic (ACE) model,66 as implemented in version27 of CHARMM67 using the parameter set from version19 of the program. The minimization is performed usingan adopted basis Newton–Raphson method.67 Duringthe minimization the protein atoms are held fixed, whilethe atoms of the probe molecules are free to move.
Step 3: clustering and ranking
The minimized probe conformations from step 2 aregrouped into clusters based on Cartesian coordinateinformation. The method creates a number of clusterssuch that the maximum distance between a cluster’shub and any of its members (the cluster radius) issmaller than half of the average distance between all theexisting hubs. We have slightly modified this algorithmby introducing an explicit upper bound U ¼ 4:0 �A onthe cluster radius. We retain only the clusters with morethan T entries, where the threshold T is defined by theaverage clusters size, T ¼ m=n if T , 20, where m is thetotal number of probes and n is the number of clusters.Otherwise T ¼ 20; i.e. clusters with more than 20elements are always retained. For each retained cluster,we calculate the partition function Qi ¼
Pj exp
ð2DGj=RTÞ; obtained by summing the Boltzmann factorsover the conformations in the ith cluster only. The clustersare ranked on the basis of their average free energieskDGli ¼
Pj pijDGj; where pij ¼ expð2DGj=RTÞ=Qi; and
the sum is taken over the members of the ith cluster.
† QUANTA/CHARMM Program, MolecularSimulations Inc., Waltham, MA, USA.
1110 Computational Solvent Mapping
Step 4: determination of consensus sites
Mapping is primarily used to find “consensus” sites atwhich many different probe molecules cluster. In orderto find the consensus sites, we select the minimum freeenergy conformation in each of the five lowest averagefree energy clusters for each solvent. The structures aresuperimposed, and the position at which most probes ofdifferent types overlap is defined as the main consensussite. An additional clustering of probes close to themain consensus site is likely to indicate another sub-siteof the active site, and hence the probes in the secondcluster are added to those already in the consensus site.
Step 5: sub-cluster analysis
For each ligand, the cluster at the consensus site isfurther divided into sub-clusters based on probe orien-tations and free energies. The latter are included, becausesimilar conformations with very different free energiesusually have different mechanisms of binding (e.g.different hydrogen bonding interactions), and hence it ispreferable to group them into different sub-clusters.10,11
The sub-clusters of the ith cluster are ranked on thebasis of the probabilities pij ¼ Qij=Qi; where Qi is thesum of the Boltzmann factors over all conformations ofthe ith cluster, and Qij is obtained by summing theBoltzmann factors over the conformations in the jth sub-cluster only. Each subcluster with pij . 0:05 was repre-sented by a single conformation. The LIGPLOTprogram68,69 of Thornton and co-workers was used tofind the non-bonded interactions and hydrogen bondsformed between each probe conformation and the pro-tein. After counting all interactions, we have determinedtheir distribution among the residues of the protein, asshown in Figures 1, 3, and 4.
For each enzyme considered here we downloaded thestructures of all complexes available in the RCSB PDB,including those of close homologues. Non-bonded inter-actions and hydrogen bonds have been determinedusing the SAS program†. For each amino acid residuewe counted the number of interactions, and determinedhow these interactions distribute among the various resi-dues, as shown in Figures 1, 3, and 4. Details of the inter-actions and a description of the roles of individualresidues in each enzyme are available electronically‡.
Acknowledgements
We thank Professor Dagmar Ringe for useful dis-cussions. This research has been supported bygrants DBI-9904834 from the National ScienceFoundation, GM61867 and GM64700 from theNational Institute of Health, and P42 ES07381from the National Institute of EnvironmentalHealth Sciences.
References
1. Bonanno, J. B., Edo, C., Eswar, N., Pieper, U.,Romanowski, M. J., Ilyin, V. et al. (2001). Structuralgenomics of enzymes involved in sterol/isoprenoidbiosynthesis. Proc. Natl Acad. Sci. USA, 98,12896–12901.
2. Erlandsen, H., Abola, E. E. & Stevens, R. C. (2000).Combining structural genomics and enzymology:completing the picture in metabolic pathways andenzyme active sites. Curr. Opin. Struct. Biol. 10,719–730.
3. Skolnick, J., Fetrow, J. S. & Kolinski, A. (2000). Struc-tural genomics and its importance for gene functionanalysis. Nature Biotechnol. 18, 283–287.
4. Mattos, C. & Ringe, D. (1996). Locating and charac-terizing binding sites on proteins. Nature Biotechnol.14, 595–599.
5. Ringe, D. & Mattos, C. (1999). Analysis of the bind-ing surfaces of proteins. Med. Res. Rev. 19, 321–331.
6. Allen, K. N., Bellamacina, C. R., Ding, X., Jeffery, C. J.,Mattos, C., Petsko, G. A. & Ringe, D. (1996). Anexperimental approach to mapping the binding sur-faces of crystalline proteins. J. Phys. Chem. 100,2605–2611.
7. English, A. C., Done, S. H., Caves, L. S., Groom, C. R.& Hubbard, R. E. (1999). Locating interaction sites onproteins: the crystal structure of thermolysin soakedin 2% to 100% isopropanol. Proteins: Struct. Funct.Genet. 37, 628–640.
8. English, A. C., Groom, C. R. & Hubbard, R. E. (2001).Experimental and computational mapping of thebinding surface of a crystalline protein. Protein Eng.14, 47–59.
9. Liepinsh, E. & Otting, G. (1997). Organic solventsidentify specific ligand binding sites on protein sur-faces. Nature Biotechnol. 15, 264–268.
10. Dennis, S., Kortvelyesi, T. & Vajda, S. (2002). Compu-tational mapping identifies the binding sites oforganic solvents on proteins. Proc. Natl Acad. Sci.USA, 99, 4290–4295.
11. Kortvelyesi, T., Dennis, S., Silberstein, M., Brown, L.,III & Vajda, S. (2003). Algorithms for computationalsolvent mapping of proteins. Proteins: Struct. Funct.Genet. 51, 340–351.
12. Lichtarge, O., Bourne, H. R. & Cohen, F. E. (1996).The evolutionary trace method defines the bindingsurfaces common to a protein family. J. Mol. Biol.257, 342–358.
13. Yao, H., Kristensen, D. M., Mihalek, I., Sowa, M. E.,Shaw, C., Kimmel, M. et al. (2003). An accurate, sensi-tive, and scalable method to identify functional sitesin protein structures. J. Mol. Biol. 326, 255–261.
14. del Sol Mesa, A., Pazos, F. & Valencia, A. (2003).Automatic methods for predicting functionallyimportant residues. J. Mol. Biol. 326, 1289–1302.
15. Hendlich, M., Rippmann, F. & Barnickel, G. (1997).LIGSITE: automatic and efficient detection of poten-tial small molecule-binding sites in enzymes. J. Mol.Graph. Model. 15, 359–363.
16. Liang, J., Edelsbrunner, J. & Woodward, C. (1998).Anatomy of protein pockets and cavities: measure-ment of binding site geometry and implications forligand design. Protein Sci. 7, 1884–1897.
17. Edelsbrunner, H., Facello, M. & Liang, J. (1998). Onthe definition and the construction of pockets inmacromolecules. Disc. Appl. Math. 88, 83–102.
18. Brady, G. P., Jr & Stouten, P. F. W. (2000). Fast predic-† http://www.biochem.ucl.ac.uk/bsm/pdbsum/‡ http://structure.bu.edu/
tion and visualization of protein binding pocketswith PASS. J. Comput. Aided Mol. Des. 14, 383–401.
19. Ondrechen, M. J., Clifton, J. G. & Ringe, D. (2001).THEMATICS: a simple computational predictor ofenzyme function from structure. Proc. Natl Acad. SciUSA, 98, 12473–12478.
20. Gutteridge, A., Bartlett, G. J. & Thornton, J. M.(2003). Using a neural network and sparial clusteringto predict the location of active sites in enzymes.J. Mol. Biol. 330, 719–734.
21. Laskowski, R. A., Luscombe, N. M., Swindells, M. H.& Thornton, J. M. (1996). Protein clefts in molecularrecognition and function. Protein Sci. 5, 2438–2452.
22. Matthews, B. W. (1988). Structural basis of the actionof thermolysin and related zinc peptidases. AcctsChem. Res. 21, 333–340.
23. Lipscomb, W. N. & Strater, N. (1996). Recentadvances in zinc enzymology. Chem. Rev. 96,2375–2433.
24. Marie-Claire, C., Ruffet, E., Antonczak, S., Beaumont,A., O’Donohue, M., Roques, B. P. & Fournie-Zaluski,M. C. (1997). Evidence by site-directed mutagenesisthat arginine 203 of thermolysin and arginine 717 ofneprilysin (neutral endopeptidase) play equivalentcritical roles in substrate hydrolysis and inhibitorbinding. Biochemistry, 36, 13938–13945.
25. Marie-Claire, C., Ruffet, E., Tiraboschi, G. & Fournie-Zaluski, M. C. (1998). Differences in transition statestabilization between thermolysin (EC 3.4.24.27) andneprilysin (EC 3.4.24.11). FEBS Letters, 438, 215–219.
26. Reed, G. H., Poyner, R. R., Larsen, T. M., Wedekind &J. E., Rayment, I. (1996). Structural and mechanisticstudies of enolase. Curr. Opin. Struct. Biol. 6, 736–743.
27. Zhang, E., Brewer, J. M., Minor, W., Carreira, L. A. &Lebioda, L. (1997). Mechanism of enolase: the crystalstructure of asymmetric dimer enolase—2-phospho-D-glycerate/enolase—phosphoenolpyruvate at 2.0 Aresolution. Biochemistry, 36, 12526–12534.
28. Larsen, T. M., Wedekind, J. E., Rayment, I. & Reed,G. H. (1996). A carboxylate oxygen of the substratebridges the magnesium ions at the active site of eno-lase: structure of the yeast enzyme complexed withthe equilibrium mixture of 2-phosphoglycerate andphosphoenolpyruvate at 1.8 A resolution. Biochemis-try, 35, 4349–4358.
29. Brewer, J. M., Glover, C. V. C., Holland, M. J. &Lebioda, L. (1998). Significance of the enzymaticproperties of yeast S39A enolase to the catalyticmechanism. Biochim. Biophys. Acta, 1383, 351–355.
30. Vinarov, D. A. & Nowak, T. (1999). Role of His159 inyeast enolase catalysis. Biochemistry, 18, 12138–12149.
31. Brewer, J. M., Holland, M. J. & Lebioda, L. (2000).The H159A mutant of yeast enolase has significantactivity. Biochem. Biophys. Res. Commun. 276,1199–1202.
32. Steyaert, J. (1997). A decade of protein engineeringon ribonuclease T1. Atomic dissection of theenzyme–substrate interactions. Eur. J. Biochem. 247,1–11.
33. Hubner, B., Haensler, M. & Hahn, U. (1999). Modifi-cation of ribonuclease T1 specificity by randommutagenesis of the substrate binding segment. Bio-chemistry, 38, 1371–1376.
34. Balaji, P. V., Saenger, W. & Rao, V. S. R. (1993). Com-puter modeling studies on the binding of 20,50-linkeddinucleotide phosphates to ribonucleotide T1—influ-ence of subsite interactions on the substrate speci-ficity. J. Biomol. Struct. Dynam. 10, 891–903.
35. Kumar, K. & Walz, F. G. (2001). Probing functional
perfection in substructures of ribonuclease T-1:double combinatorial random mutagenesis involvingAsn43, Asn44, and Glu46 in the guanine bindingloop. Biochemistry, 40, 7348–7357.
36. Alber, T. C., Davenport, R. C., Jr, Giammona, D. A.,Lolis, E., Petsko, G. A. & Ringe, D. (1987). Crystallo-graphy and site directed mutagenesis of yeast triose-phosphate isomerase: what can we learn aboutcatalysis from a “simple” enzyme? Cold SpringHarbor Symp. Quant. Biol. 52, 603–613.
37. Joseph, D., Petzko, G. A. & Karplus, M. (1990). Anat-omy of a conformational change: hinged “lid”motion of the triosephosphate isomerase loop.Science, 249, 1425–1428.
38. Norledge, B. V., Lamber, A. M., Abagyan, R. A.,Rottmann, A., Fernandez, A. M., Filimonov, V. V.et al. (2001). Modeling, mutagenesis, and structuralstudies on the fully conserved phosphate-bindingloop (loop 8) of triosephosphate isomerase: toward anew substrate specificity. Proteins: Struct. Funct.Genet. 42, 383–389.
39. Perona, J. J., Hedstrom, L., Rutter, W. J. & Fletterick,R. J. (1995). Structural origins of substrate deter-mination in trypsin and chymotrypsin. Biochemistry,34, 1489–1499.
40. Sprang, S., Standing, T., Fletterick, R. J., Stroud, R. M.,Finer-Moore, J., Xuong, N. H. et al. (1987). The three-dimensional structure of Asn102 mutant of trypsin:role of Asp102 in serine protease catalysis. Science,237, 905–909.
41. Helland, R., Leiros, I., Berglund, G. I., Willassen, N. P.& Smalas, A. O. (1998). The crystal structure ofanionic salmon trypsin in complex with bovine pan-creatic trypsin inhibitor. Eur. J. Biochem. 256, 317–324.
42. Choe, J., Fromm, H. J. & Honzatko, R. B. (2000). Crys-tal structures of fructose-1,6-bisphosphatase: mech-anism of catalysis and allosteric inhibition revealedin product complexes. Biochemistry, 39, 8565–8574.
43. Liang, J., Huang, S., Zhang, Y., Ke, H. & Lipscomb,W. N. (1992). Crystal structure of the neutral form offructose-1,6-bisphosphatase complexed with regu-latory inhibitor fructose-2,6-bisphosphate at 2.6 Aresolution. Proc. Natl Acad. Sci. USA, 89, 2404–2408.
44. Ke, H., Zhang, Y. & Lipscomb, W. N. (1990). Crystalstructure of fructose-1,6-bisphosphatase complexedwith fructose 6-phosphate, AMP, and magnesium.Proc. Natl Acad. Sci. USA, 87, 5243–5247.
45. Villeret, V., Huang, S., Fromm, H. J. & Lipscomb,W. N. (1995). Crystallographic evidence for theaction of potassium, thallium, and lithium ions onfructose-1,6-bisphosphatase. Proc. Natl Acad. Sci.USA, 92, 8916–8920.
46. Schanstra, J. P., Ridder, I. S., Heimeriks, G. J., Rink,R., Poelarends, G. J., Kalk, K. H. et al. (1996). Kineticcharacterization and X-ray structure of a mutant ofhaloalkane dehalogenase with higher catalyticactivity and modified substrate range. Biochemistry,35, 13186–13195.
47. Pikkemaat, M. G., Ridder, I. S., Rozeboom, H. J.,Kalk, K. H., Dijkstra, B. W. & Janssen, D. B. (1999).Crystallographic and kinetic evidence of a collisioncomplex formed during halide import in haloalkanedehalogenase. Biochemistry, 38, 12052–12061.
48. Ogury, K., Yamada, H. & Joshimura, H. (1994).Regiochemitry of cytochrome P450 isozymes. Annu.Rev. Pharmacol. Toxicol. 34, 251–279.
49. Goodford, P. J. (1985). A computational procedurefor determining energetically favorable binding sites
1112 Computational Solvent Mapping
on biologically important macromolecules. J. Med.Chem. 28, 849–875.
50. Miranker, A. & Karplus, M. (1991). Functionalitymaps of binding sites: a multiple copy simultaneoussearch method. Proteins: Struct. Funct. Genet. 11,29–34.
51. Shortle, D., Simons, K. T. & Baker, D. (1998). Cluster-ing of low-energy conformations near the nativestructures of small proteins. Proc. Natl Acad. Sci.USA, 95, 11158–11162.
52. Comeau, S. R., Gatchell, D., Vajda, S. & Camacho,C. J. (2003). ClusPro: an automated docking and dis-crimination method for the prediction of proteincomplexes. Bioinformatics, in the press..
53. Gschwend, D. A., Good, A. C. & Kuntz, I. D. (1996).Molecular docking towards drug discovery. J. Mol.Recognit. 9, 175–816.
54. Goodsell, D. S. & Olson, A. J. (1990). Automateddocking of substrates to proteins by simulatedannealing. Proteins: Struct. Funct. Genet. 8, 195–202.
55. Yu, E. W. & Koshland, D. E., Jr (2001). Propagatingconformational changes over long (and short) dis-tances in proteins. Proc. Natl. Acad. Sci. USA, 98,9517–9520.
56. Kazlauskas, R. J. (2000). Molecular modeling andbiocatalysis: explanations, predictions, limitations,and opportunities. Curr. Opin. Chem. Biol. 4, 81–88.
57. DeVoss, J. J., Sibbesen, O., Zhang, Z. & Ortiz deMontellano, P. R. (1997). Substrate docking algor-ithms and predictions of the substrate specificity ofcytochrome P450cam and its L244A mutant. J. Am.Chem. Soc. 119, 5489–5498.
58. Wojciechowski, M. & Skolnick, J. (2002). Docking ofsmall ligands to low-resolution and theoretically pre-dicted receptor structures. J. Comp. Chem. 23,189–197.
59. Gilson, M. K. & Honig, B. (1988). Calculation of thetotal electrostatic energy of a macromolecular sys-tem: solvation energies, binding energies, and con-
60. Honig, B. & Nicholls, A. (1995). Classical electro-statics in biology and chemistry. Science, 268,1144–1149.
61. Bruccoleri, R. E. (1993). Grid positioning indepen-dence and the reduction of self-energy in the solu-tion of the Poisson–Boltzmann equation. J. Comp.Chem. 14, 1417–1422.
62. Zhang, C., Vasmatzis, G., Cornette, J. L. & DeLisi, C.(1996). Determination of atomic desolvation energiesfrom the structures of crystallized proteins. J. Mol.Biol. 267, 707–726.
63. Miyazava, S. & Jernigan, R. (1985). Estimation ofeffective interresidue contact energies from proteincrystal structures: quasi-chemical approximation.Macromolecules, 18, 534–552.
64. Vakser, I. A. (1995). Protein docking for low-resolutionstructures. Protein Eng. 8, 371–377.
65. Vakser, I. A., Matar, O. G. & Lam, C. F. (1999). Asystematic study of low-resolution recognition inprotein–protein complexes. Proc. Natl Acad. Sci.USA, 96, 8477–8482.
66. Schaefer, M. & Karplus, M. A. (1996). A comprehen-sive analytical treatment of continuum electrostatics.J. Phys. Chem. 100, 1578–1599.
67. Brooks, B. R., Bruccoleri, R. E., Olafson, B., States,D. J., Swaminathan, S. & Karplus, M. (1983).CHARMM: a program for macromolecular energy,minimization, and dynamics calculations. J. Comp.Chem. 4, 197–214.
68. Wallace, A. C., Laskowski, R. A. & Thornton, J. M.(1995). LIGPLOT: a program to generate schematicdiagrams of protein–ligand interactions. ProteinEng. 8, 127–134.
69. McDonald, I. K. & Thornton, J. M. (1994). Satisfyinghydrogen bonding potential in proteins. J. Mol. Biol.238, 777–793.
Edited by J. Thornton
(Received 28 May 2003; received in revised form 10 August 2003; accepted 11 August 2003)