Dunton is with the Dept. of Preventive Medicine, University of Southern California, Alhambra, CA. Atienza is with the Health Promotion Research Branch, National Cancer Institute, Rockville, MD. Tscherne and Rodriguez are with the Dept. of Psychiatry, University of Pennsylvania, Philadelphia, PA.
Identifying Combinations of Risk and Protective Factors Predicting Physical
Activity Change in High School Students
Genevieve Fridlund DuntonUniversity of Southern California
Audie A. AtienzaNational Cancer Institute
James Tscherne and Daniel RodriguezUniversity of Pennsylvania
Research sought to identify combinations of risk and protective factors predicting change in physical activity (PA) over one year in high school students. Adolescents (N = 344; M = 15.7 years) participated in a longitudinal study with assessment of demographics, substance use/smoking exposure, height and weight, psychological factors, and PA in 10th and 11th grade. PA participation in 11th grade was great-est for adolescents who engaged in PA and had high sports competence (78%), and least for adolescents who did not engage in or enjoy PA (13%) in 10th grade. Identifying adolescent subgroups at risk for decreasing PA can inform the devel-opment of tailored interventions.
Recent U.S. physical activity guidelines suggest that children and adolescents should engage in at least 60 min of moderate-to-vigorous physical activity (MVPA) per day for chronic disease prevention and other health benefits (39). These rec-ommendations are based upon a growing body of evidence showing that regular physical activity at a moderate-to-vigorous intensity is associated with reduced risk of diabetes, overweight, asthma and other health concerns in youth (39). Despite these outcomes, the percentage of students meeting recommendations drops from 38% of 9th graders to 30% of 12th graders in the U.S (19). Likewise in European countries, the total time spent in physical activity at age 18 represents only 63% of the time reported at age 15 (18), and that only 19% of boys and 11% of girls are persistent exercisers across the high school years (1). These disconcerting trends highlight the need to identify adolescent subgroups that may be at particular risk for
Physical Activity Change Over One Year in High School Students 107
becoming physically inactive and to design appropriately targeted and/or tailored intervention programs.
Cross-sectional and prospective studies have uncovered potential demographic, environmental, behavioral, and psychosocial correlates of adolescent physical activ-ity. A greater percentage of adolescent boys (vs. girls) and Whites (vs. Blacks and Hispanics) tend to meet recommended levels of physical activity in the U.S (19). Family socioeconomic status (SES) is positively associated with physical activ-ity in adolescents in some studies but not others (4,9,22). Information is lacking about the association of parental education levels and employment with adolescent physical activity. A growing body of literature also suggests that adolescents who smoke or use other substances are less likely to be physically active (34,41) and that increasing physical activity can reduce smoking initiation, and support cessation efforts (35,36,40). Past physical activity behavior has been consistently identified as a strong predictor of future physical activity levels during adolescence (6). Evi-dence also suggests that physical activity is negatively associated with depression (31), and positively associated with self-esteem (23), physical self-concept (8) and physical activity enjoyment (32) during the teen years.
Despite the contributions of this literature, research on the correlates of physical activity during adolescence suffers from some major methodological limitations. First, the majority of these studies are cross-sectional in nature. As such, they are unable to identify potential risk and protective factors related to patterns of physical activity change during adolescence. In addition, research on this topic typically examines the main (bivariate or independent) effects of demographic, environ-mental, behavioral, and psychosocial variables on physical activity. Information is lacking about the complex and multifaceted ways in which these predictive factors may combine and interact with each other. To address these concerns, the current study used a 1-year longitudinal design and a novel analytic approach to test unique combinations of two or more demographic, environmental, behavioral, and/or psychosocial factors (measured in 10th grade) that predict the likelihood of physical activity participation in 11th grade. The overall aim of this research was to identify constellations of risk and protective factors based on unique combinations of these characteristics that predict change in physical activity over one year in high school students. This information will enable researchers and practitioners to design tailored interventions and policies addressing the needs of particular subgroups.
Methods
Participants and Procedures
The sample was comprised of 344 high school students participating in a larger study of physical activity and smoking. Students were enrolled a suburban high school in the Northeastern region of the United States. Adolescents who were placed in special classrooms (e.g., severe learning disability, English as a second language) were not eligible due to practical considerations. In the beginning of the spring semester of 2006, the school district mailed recruitment letters to parents/guardians of 10th graders. The letters included a phone number to call with ques-tions pertaining to the study and to decline their teen’s participation (i.e., active information and passive consent procedures). If a parent/guardian did not call to
108 Dunton et al.
decline their teen’s participation, the student was approached for assent during the school day. The Institutional Review Board at the University of Pennsylvania approved the study procedures.
Data collection occurred across two time points separated by a year (spring of 10th grade and spring of 11th grade). At each time point, surveys were administered during a class in which all of the target grade students were enrolled. The question-naire required approximately 30 min to complete at each time point. Surveying was conducted over a three-day period. Participants received a $10 gift certificate for completing each questionnaire. The goal of the larger study was to determine how health behaviors, intrapersonal processes, and environmental factors contribute to risk of smoking initiation during this developmental window (36). The current study analyzed changes in physical activity across a one-year period, whereas previously published articles from this larger project only examined physical activity levels in 10th grade.
MeasuresDemographics. The questionnaire included a number of questions assessing demographic characteristics, including age, sex, race/ethnicity, the receipt of free and reduced cost lunch at school, highest grade completed by each parent, employment status or each parent, height, and weight.
Smoking and Alcohol Use. Smoking and alcohol use were assessed through standard epidemiological surveillance questions used in the Youth Risk Behavior Surveillance (YRBS; 26). The smoking items consisted of the following: “Have you tried or experimented with cigarette smoking, even a few puffs? (1 = yes, 0 = no),” “If Yes, how old were you when you first experimented with cigarettes,” “Have you ever smoked a whole cigarette at one time? (1 = yes, 0 = no),” “If Yes, how old were you when you smoked your first whole cigarette?,” “Do you smoke daily? (1 = yes, 0 = no),” and “How many cigarettes a day do you smoke?” Alcohol use was assessed through the following questions: “During your life, on how many days have you had at least one drink (not just a sip) of alcohol?,” “How old were you when you had your first drink of alcohol other than a few sips?,” “During the past 30 days, on how many days did you have at least one drink (not just a sip) of alcohol?,” and “During the past 30 days, on how many days did you have 5 or more drinks (not just sips) of alcohol in a row, that is, within a couple of hours?”
Exposure to Smoking. Peer smoking was measured with three items asking whether the participant’s best friend smokes (1 = yes, 0 = no), and how many of the participant’s other four best male (0–4) and other four best female (0–4) friends smoke (11). Exposure to smoking at home was assessed with the following items: “Does anyone living in your household smoke? (1 = yes, 0 = no)” and “If Yes, is (are) the smoker(s) in your household allowed to smoke indoors? (1 = yes, 0 = no)”
Psychosocial Factors. Subscales of the Physical Self-Description Questionnaire (PSDQ) measured physical self-concept (6 items, a = .96; e.g., “I am satisfied with the kind of person I am physically”), perceived attractiveness (6 items, a = .89; e.g., “I am good looking”), sports competence (6 items, a = .96; e.g., “I am good at most sports), and global self-esteem (8 items, a = .90) (e.g., “Most things I do, I do well”) on a 6-point response scale ranging from “false” to “true.” Research
Physical Activity Change Over One Year in High School Students 109
supports the convergent and discriminant validity of the PSDQ (30). The 18-item Physical Activity Enjoyment Scale (PACES; a = .92; 27) measured enjoyment of physical activity (e.g., “I find it pleasurable,” “It is very invigorating,” “It’s no fun at all,” “I dislike it”) on a 6-point response scale ranging from “disagree a lot” to “agree a lot.” Internal and cross-structure analyses support the single factor structure of the PACES, as well as its reliability and discriminant validity (32). Depressive symptoms were assessed through the 20-item Center for Epidemiological Studies Depression Scale (CES-D; a = .91; 21) using 4-point response scale ranging from “none of the time” to “most of the time.” Participants reported how frequently they experienced depressive symptoms such as feeling lonely, having restless sleep, feeling sad, having crying spells, and feeling depressed. Evidence supports the reliability and validity of the CES-D as measure of adolescent depression symptoms (33).
Physical Activity. Physical activity was assessed using a past year recall instrument designed for epidemiologic studies on adolescents (2). The questionnaire asked respondents to identify physical activities that that they did at least 10 times in the past year using a list of common activities. Next, they were asked to identify the months in which they practiced those activities and the estimated time spent in each activity. Evidence for reliability as well as criterion and construct validity is available for this measure. Test-retest reliability estimates for past year recall measured one year apart was .66 and .72 for hours per week of all leisure time PA (LTPA) and vigorous PA, respectively (2). Correlations of past year recall from the current instrument with past week recall (averaged over four measures three month apart) ranged from .63 to .76, for hours of LTPA per week, and .76 to .84 for hours of vigorous PA weekly. The current measure also correlated significantly and negatively with time to complete a one mile run (2). The instrument is acceptable for the longitudinal assessment of physical activity change in individuals (2). Minutes per week in activities greater than or equal to 3.0 METS (3) were summed to develop an indicator of moderate-to-vigorous physical activity (MVPA). Participants were classified according to whether they met (³ 300 min of MVPA per week) or did not meet (< 300 min of MVPA per week) physical activity recommendations for youth at each time point (39).
Data Analyses. Descriptive statistics were generated and t tests and chi-square analyses were conducted to compare students who met physical activity recommendations with students who did not meet physical activity recommendations at time 2 (spring of 11th grade) on demographic, behavioral, environmental, and psychosocial characteristics measured at time 1 (spring of 10th grade).
A novel analytic strategy, called signal detection methodology (SDM), was used to identify unique combinations of two or more demographic, environmental, behavioral, and/or psychosocial factors (measured in 10th grade) that predict the likelihood of meeting physical activity recommendations in 11th grade. SDM is a nonparametric approach frequently used in engineering, mathematics, psychol-ogy and other applied sciences to detect subgroups that are more or less likely to have an outcome of interest through recursive partitioning with classification trees. SDM is based on the principles of signal detection theory, which offers a process for discerning thresholds that differentiate between signal and noise. In the current study, the signal and noise represent the presence versus absence of our outcome
110 Dunton et al.
of interest, meeting physical activity recommendations in 11th grade. SDM is an iterative process that uses a data-driven strategy to generate a sequence of “and/or” Boolean decision rules based on the predictor characteristics entered (28,29). Differ-ent combinations of these characteristics (e.g., age, smoking, depressive symptoms) create unique subgroups. The subgroups detected do not overlap in membership and maximally discriminate from each other according to the particular outcome. SDM is useful for generating hypotheses when multiple higher-order interactions among predictor variables are plausible. Our analyses were performed using the ROC4 statistical program. The selection of cutpoints for subgroup partitioning was based on a formula to optimize sensitivity and specificity in predicting who met physical activity recommendations at time 2. The program first creates two groups by determining a cutpoint for the variable that most effectively differentiates the groups on a dichotomous outcome (step 1). It subsequently repeats this partition-ing procedure with each of those subgroups to create further subgroups (steps 2 through n). The partitioning process typically halted when the significance level for the chi-square statistic comparing the next predictor value on the outcome exceeded .05 or the sample size of the subgroup drops below 10. However, we used a more conservative significance level (p < .01) as the stopping point of the partitioning process. Advantages of SDM over multiple regression techniques are that it does not require listwise deletion of missing data (missing data are considered separately for each predictor at each level), and it does not rely on parametric assumptions of normality and linearity (24,37).
The subgroups identified by the SDM analysis were given descriptive names based on the factors offering cutpoints that distinguished them. Exploratory follow-up analysis using ANOVAs and chi-square compared the subgroups identified by SDM on all of the demographic, behavioral, environmental, and psychosocial characteristics measured at time 1 (spring of 10th grade).
ResultsOf the 407 10th graders eligible for the study, two did not receive parental consent, and 16 were absent on the survey days and the survey make-ups days, resulting in 389 participants at baseline, all of whom assented to participate. However, parents withdrew two assenting participants late, resulting in a final baseline sample of 387 participants (95% of all possible participants). Three hundred and forty four students (89%) completed surveys at 11th grade follow-up, representing a reduc-tion of 11%. School records indicate those lost to follow-up moved, withdrew, or were expelled from school.
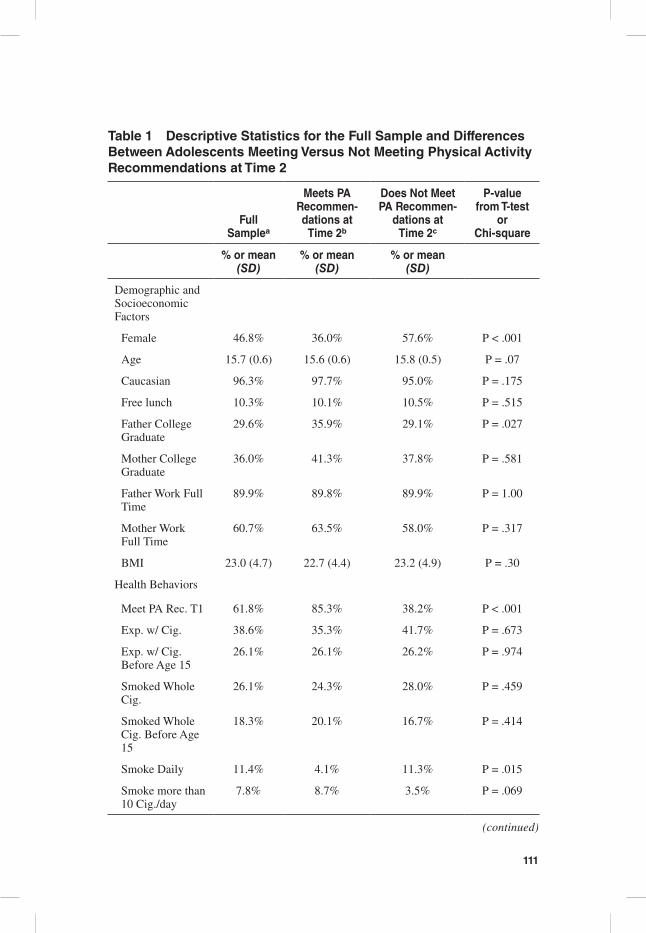
Table 1 provides descriptive statistics for the full sample. Overall, 61.8% of adolescents met physical activity recommendations in the spring of 10th grade, and 50% met recommendations in the spring of 11th grade. Bivariate analyses indicated that adolescents who met physical activity recommendations in the spring of 11th grade were more likely to be male, have a father that graduated from college, and to have met physical activity recommendations in the spring of 10th grade; and less like to smoke daily than those who did not meet recommendations. Adolescents meeting recommendations in the spring of 11th grade also reported greater physical activity enjoyment, self esteem, physical self-concept, attractiveness, and sports competence; and lower depression scores than those not meeting recommendations.
111
Table 1 Descriptive Statistics for the Full Sample and Differences Between Adolescents Meeting Versus Not Meeting Physical Activity Recommendations at Time 2
Full Samplea
Meets PA Recommen-dations at
Time 2b
Does Not Meet PA Recommen-
dations at Time 2c
P-value from T-test
or Chi-square
% or mean (SD)
% or mean (SD)
% or mean (SD)
Demographic and Socioeconomic Factors
Female 46.8% 36.0% 57.6% P < .001
Age 15.7 (0.6) 15.6 (0.6) 15.8 (0.5) P = .07
Caucasian 96.3% 97.7% 95.0% P = .175
Free lunch 10.3% 10.1% 10.5% P = .515
Father College Graduate
29.6% 35.9% 29.1% P = .027
Mother College Graduate
36.0% 41.3% 37.8% P = .581
Father Work Full Time
89.9% 89.8% 89.9% P = 1.00
Mother Work Full Time
60.7% 63.5% 58.0% P = .317
BMI 23.0 (4.7) 22.7 (4.4) 23.2 (4.9) P = .30
Health Behaviors
Meet PA Rec. T1 61.8% 85.3% 38.2% P < .001
Exp. w/ Cig. 38.6% 35.3% 41.7% P = .673
Exp. w/ Cig. Before Age 15
26.1% 26.1% 26.2% P = .974
Smoked Whole Cig.
26.1% 24.3% 28.0% P = .459
Smoked Whole Cig. Before Age 15
18.3% 20.1% 16.7% P = .414
Smoke Daily 11.4% 4.1% 11.3% P = .015
Smoke more than 10 Cig./day
7.8% 8.7% 3.5% P = .069
(continued)
112
Full Samplea
Meets PA Recommen-dations at
Time 2b
Does Not Meet PA Recommen-
dations at Time 2c
P-value from T-test
or Chi-square
% or mean (SD)
% or mean (SD)
% or mean (SD)
Exp. w/ Alcohol Before Age 15
37.6% 38.6% 36.7% P = .716
Drink Alcohol > 5 days (Past Mo.)
3.0% 3.5% 2.3% P = .750
5+ Alcoholic Drinks >2 days (Past Mo.)
3.6% 3.5% 3.5% P = 1.00
Environmental Factors
Best Friend Smokes
28.2% 25.6% 31.0% P = .332
# Male Friends Smoke
1.1 (1.4) 1.1 (1.3) 1.2 (1.5) P = .68
# Female Friends Smoke
0.8 (1.3) 0.7 (1.2) 1.0 (1.3) P = .08
Household Member Smokes
41.7% 44.4% 39.1% P = .378
Household Member Smokes Indoors
21.7% 21.9% 18.5% P = .498
Psychosocial Factors
Depression 1.8 (0.5) 1.7 (0.5) 1.9 (0.6) P = .007
PA Enjoyment 4.9 (0.8) 5.1 (0.6) 4.8 (0.9) P < .001
Self-esteem 5.0 (0.9) 5.1 (0.7) 4.8 (1.0) P = .001
Physical self-concept
4.2 (1.4) 4.4 (1.3) 3.9 (1.6) P < .001
Attractiveness 3.8 (0.8) 3.9 (0.8) 3.7 (0.9) P = .02
Sports Competence
4.0 (1.4) 4.5 (1.3) 3.5 (1.4) P < .001
Note. PA = Physical activity, T1 = time 1 (spring of 10th grade), T2 = time 2 (spring of 11th grade). aSample sizes range from n = 316 to n = 344.bSample sizes range from n = 157 to n = 172. cSample sizes range from n = 159 to n = 172. Percent-ages for each of the groups are not necessarily comparable to the percentage for the total sample due to missing data.
Table 1 (continued)
Physical Activity Change Over One Year in High School Students 113
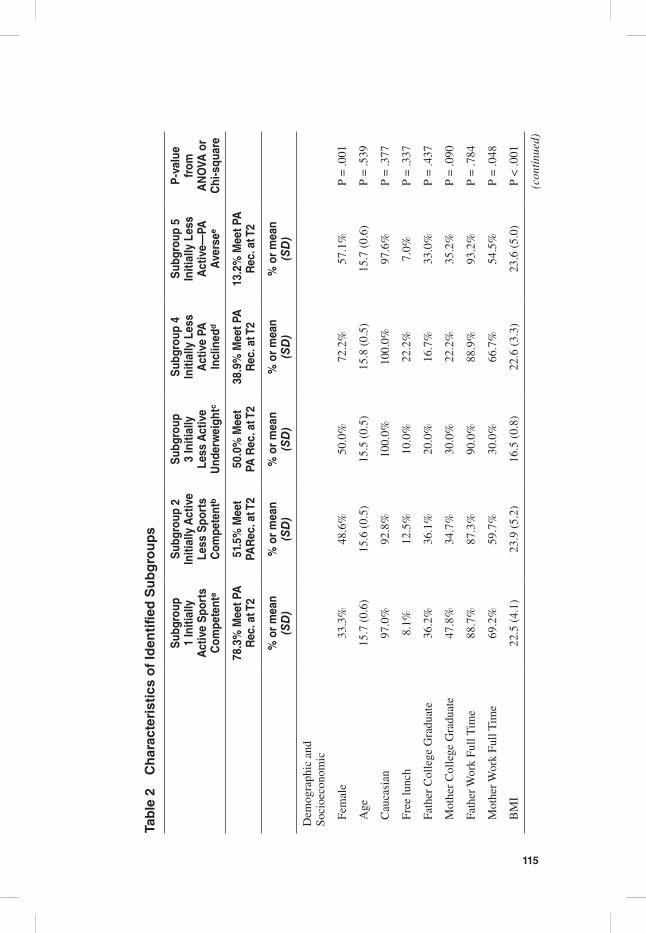
The signal detection analyses identified five mutually exclusive subgroups with varying rates of meeting physical activity recommendations in the spring of 11th grade (See Figure 1). Subgroup 1 (Initially Active-Sports Competent; n = 138) had the higher proportion of adolescents (78.3%) who met physical activity recommendations at the end of 11th grade. This subgroup consisted of individu-als who met physical activity recommendations in the spring of 10th grade and reported high sports competence beliefs with an average score equal to or greater than 4.17 (out of 6 points) on the PSDQ sports competence scale. The second highest proportion of adolescents meeting physical activity recommendations in the spring of 11th grade (51.5%) belonged to Subgroup 2 (n = 66; Initially Active- Less Sports Competent). Individuals in this subgroup met recommendations in the spring of 10th grade and low to moderate sports competence beliefs with a PSDQ sports competence score of less than 4.17. Approximately 50% of adolescents in subgroup 3 (Initially Less Active-Underweight; n = 10) met physical activity recommendations in the spring of 11th grade. This subgroup was comprised of individuals who had a BMI of less than 18.1 and did not meet recommendations in the spring of 10th grade. Subgroup 4 (n = 18; Initially Less Active-PA inclined; 38.9% met physical activity recommendations in the spring of 11th grade) con-sisted of adolescents who did not meet physical activity recommendations in the spring of 10th grade, had a BMI equal to or greater than 18.1, and reported high physical activity enjoyment with an average score greater than or equal to 5.39 (out of 6 points) on the PACES scale. Subgroup 5 (n = 91; Initially Less Active-PA averse) had the smallest proportion of adolescents who met physical activity recommendations in the spring of 11th grade (13.2%). Members of this group did not meet recommendations in the spring of 10th grade, had a BMI equal to or greater than 18.1, and a low to moderate level of physical activity enjoyment with an average PACES scale score less than 5.39.
Beyond the features identified by the signal detection analyses, the subgroups differed on a number of other descriptive characteristics in additional exploratory analyses (See Table 2). Subgroup 4 (Initially Less Active PA inclined) had the great-est percentage who were female (72% compared with 33–57% in other subgroups), smoked a whole cigarette (44% as compared with 10–36%), had experimented with alcohol (78% as compared with 20–64%), and had a best friend who smokes (39% as compared with 10–36%). Further analyses found that subgroup 5 (Initially Less Active-PA averse) had the greatest proportion of adolescents who smoked daily (17% as compared with 2–11%) and smoked greater than 10 cigarettes a day (13% as compared with 1–11%), and the highest average depression scores. In contrast, subgroup 3 (Initially Less Active-Underweight) had the lowest percentage of moth-ers who work (30% as compared with 55–69%), lower rates of experimenting with cigarettes (10% as compared with 39–50% in other groups), the greatest percentage of household members who smoke indoors (40% as compared with 15–33%), and the lowest average self-esteem and attractiveness scores. They also had the lowest scores on the sports competence scale compared with the other subgroups.
114
Fig
ure
1 —
Sub
grou
ps I
dent
ified
by
Sign
al D
etec
tion
Ana
lysi
s fo
r M
eetin
g Ph
ysic
al A
ctiv
ity R
ecom
men
datio
ns a
t Tim
e 2.
Not
e: S
ampl
e si
zes
for
bran
ched
box
es m
ay n
ot s
um to
the
sam
ple
size
in th
e pr
ocee
ding
box
due
to m
issi
ng d
ata
on th
at v
aria
ble.
115
Tab
le 2
C
har
acte
rist
ics
of
Iden
tifie
d S
ub
gro
up
s
Sub
grou
p 1
Initi
ally
A
ctiv
e S
port
s C
ompe
tent
a
Sub
grou
p 2
Initi
ally
Act
ive
Less
Spo
rts
Com
pete
ntb
Sub
grou
p 3
Initi
ally
Le
ss A
ctiv
e U
nder
wei
ghtc
Sub
grou
p 4
Initi
ally
Les
s A
ctiv
e PA
In
clin
edd
Sub
grou
p 5
Initi
ally
Les
s A
ctiv
e—PA
A
vers
ee
P-v
alue
fr
om
AN
OVA
or
Chi
-squ
are
78.3
% M
eet P
A
Rec
. at T
251
.5%
Mee
t PA
Rec
. at T
250
.0%
Mee
t PA
Rec
. at T
238
.9%
Mee
t PA
R
ec. a
t T2
13.2
% M
eet P
A
Rec
. at T
2
% o
r m
ean
( SD
)%
or
mea
n (S
D)
% o
r m
ean
(SD
)%
or
mea
n
(SD
)%
or
mea
n
(SD
)
Dem
ogra
phic
and
So
cioe
cono
mic
Fem
ale
33.3
%48
.6%
50.0
%72
.2%
57.1
%P
= .0
01
Age
15.7
(0.
6)15
.6 (
0.5)
15.5
(0.
5)15
.8 (
0.5)
15.7
(0.
6)P
= .5
39
Cau
casi
an97
.0%
92.8
%10
0.0%
100.
0%97
.6%
P =
.377
Free
lunc
h8.
1%12
.5%
10.0
%22
.2%
7.0%
P =
.337
Fath
er C
olle
ge G
radu
ate
36.2
%36
.1%
20.0
%16
.7%
33.0
%P
= .4
37
Mot
her
Col
lege
Gra
duat
e47
.8%
34.7
%30
.0%
22.2
%35
.2%
P =
.090
Fath
er W
ork
Full
Tim
e88
.7%
87.3
%90
.0%
88.9
%93
.2%
P =
.784
Mot
her W
ork
Full
Tim
e69
.2%
59.7
%30
.0%
66.7
%54
.5%
P =
.048
BM
I22
.5 (
4.1)
23.9
(5.
2)16
.5 (
0.8)
22.6
(3.
3)23
.6 (
5.0)
P <
.001
(con
tinu
ed)
116
Tab
le 2
(co
nti
nu
ed)
Sub
grou
p 1
Initi
ally
A
ctiv
e S
port
s C
ompe
tent
a
Sub
grou
p 2
Initi
ally
Act
ive
Less
Spo
rts
Com
pete
ntb
Sub
grou
p 3
Initi
ally
Le
ss A
ctiv
e U
nder
wei
ghtc
Sub
grou
p 4
Initi
ally
Les
s A
ctiv
e PA
In
clin
edd
Sub
grou
p 5
Initi
ally
Les
s A
ctiv
e—PA
A
vers
ee
P-v
alue
fr
om
AN
OVA
or
Chi
-squ
are
78.3
% M
eet P
A
Rec
. at T
251
.5%
Mee
t PA
Rec
. at T
250
.0%
Mee
t PA
Rec
. at T
238
.9%
Mee
t PA
R
ec. a
t T2
13.2
% M
eet P
A
Rec
. at T
2
% o
r m
ean
( SD
)%
or
mea
n (S
D)
% o
r m
ean
(SD
)%
or
mea
n
(SD
)%
or
mea
n
(SD
)
Hea
lth B
ehav
iors
Exp
. w/ C
ig.
39.1
%50
.0%
10.0
%50
.0%
39.6
%P
= .0
26
Exp
. w/ C
ig. B
efor
e A
ge 1
523
.9%
30.4
%10
.0%
31.8
%29
.6%
P =
.504
Smok
ed W
hole
Cig
.20
.0%
36.1
%10
.0%
44.4
%24
.2%
P =
.026
Smok
ed W
hole
Cig
. Bef
ore
Age
15
16.9
%25
.3%
10.0
%36
.4%
22.2
%P
= .1
73
Smok
e D
aily
1.5%
6.9%
10.0
%11
.1%
16.5
%P
= .0
01
Smok
e m
ore
than
10
Cig
./day
1.4%
5.6%
10.0
%11
.1%
13.2
%P
= .0
09
Exp
. w/ A
lcoh
ol60
.9%
63.9
%20
.0%
77.8
%54
.9%
P =
.034
Exp
. w/ A
lcoh
ol B
efor
e A
ge
1536
.8%
41.8
%20
.0%
50.0
%40
.7%
P =
.585
Dri
nk A
lcoh
ol >
5 d
ays
(Pas
t M
o.)
3.6%
4.2%
0.0%
5.6%
1.1%
P =
.675
5+ A
lcoh
olic
Dri
nks
>2
days
(P
ast M
o.)
4.3%
2.8%
0.0%
11.1
%2.
2%P
= .3
90
(con
tinu
ed)
117
Tab
le 2
(co
nti
nu
ed)
Sub
grou
p 1
Initi
ally
A
ctiv
e S
port
s C
ompe
tent
a
Sub
grou
p 2
Initi
ally
Act
ive
Less
Spo
rts
Com
pete
ntb
Sub
grou
p 3
Initi
ally
Le
ss A
ctiv
e U
nder
wei
ghtc
Sub
grou
p 4
Initi
ally
Les
s A
ctiv
e PA
In
clin
edd
Sub
grou
p 5
Initi
ally
Les
s A
ctiv
e—PA
A
vers
ee
P-v
alue
fr
om
AN
OVA
or
Chi
-squ
are
78.3
% M
eet P
A
Rec
. at T
251
.5%
Mee
t PA
Rec
. at T
250
.0%
Mee
t PA
Rec
. at T
238
.9%
Mee
t PA
R
ec. a
t T2
13.2
% M
eet P
A
Rec
. at T
2
% o
r m
ean
( SD
)%
or
mea
n (S
D)
% o
r m
ean
(SD
)%
or
mea
n
(SD
)%
or
mea
n
(SD
)
# M
ale
Frie
nds
Smok
e0.
9 (1
.2)
1.5
(1.6
)0.
7 (1
.3)
1.5
(1.5
)1.
2 (1
.5)
P =
.032
# Fe
mal
e Fr
iend
s Sm
oke
0.6
(0.9
)0.
9 (1
.2)
0.9
(1.4
)1.
2 (1
.7)
1.2
(1.5
)P
= .0
03
Hou
seho
ld M
embe
r Sm
okes
19.9
%18
.1%
22.2
%27
.8%
23.1
%P
= .8
73
Hou
seho
ld M
embe
r Sm
okes
In
door
s17
.9%
15.3
%40
.0%
22.2
%33
.0%
P =
.024
Psyc
hoso
cial
Fac
tors
Dep
ress
ion
1.7
(0.9
)1.
9 (0
,5)
1.9
(0.6
)1.
7 (0
.5)
2.0
(0.6
)P
= .0
01
PA E
njoy
men
t5.
3 (0
.5)
4.9
(0.7
)4.
5 (0
.9)
5.6
(0.2
)4.
3 (0
.8)
P <
.001
Self
-est
eem
5.3
(0.6
)4.
8 (1
.0)
4.4
(1.0
)5.
3 (0
.5)
4.6
(1.1
)P
< .0
01
Phys
ical
sel
f-co
ncep
t4.
9 (1
.0)
3.4
(1.3
)3.
6 (1
.8)
4.5
(1.1
)3.
7 (1
.4)
P <
.001
Attr
activ
enes
s4.
1 (0
.6)
3.5
(0.9
)3.
3 (1
.3)
4.2
(0.2
)3.
5 (0
.8)
P <
.001
Spor
ts C
ompe
tenc
e5.
2 (0
.6)
2.9
(0.9
)2.
4 (1
.5)
4.1
(1.3
)3.
2 (1
.4)
P <
. 001
Not
e. P
A =
Phy
sica
l act
ivity
, T1
= ti
me
1 (s
prin
g of
10t
h gr
ade)
, T2
= ti
me
2 (s
prin
g of
11t
h gr
ade.
a Sam
ple
size
s ra
nge
from
n =
129
to n
= 1
38. b S
ampl
e si
zes
rang
e fr
om n
= 5
9 to
n =
66.
c Sam
ple
size
s ra
nge
from
n =
9 to
n =
10.
d Sam
ple
size
s ra
nge
from
n =
17
to n
= 1
8. e S
ampl
e si
zes
rang
e fr
om n
= 8
5 to
n =
91.
118 Dunton et al.
DiscussionPhysical inactivity is associated with increased risk of numerous chronic diseases and declines progressively across the adolescent years. Previous research examining risk and protective factors for physical activity maintenance across high school may mask important subgroups that may have particularly high or low rates of physical activity. These studies have been unable to identify potentially relevant subgroups that are characterized by unique combinations of distinguishing factors and differ in future likelihood of engaging in recommended levels of physical activity. This study found that taking into accounts sets of two or more variables may be neces-sary to differentiate between groups of high school students that vary in the rates of being physically active.
Departing slightly from research on the tracking of physical activity across adolescence (38), results from the current study suggest that initial levels of physical activity alone may not sufficiently predict who will maintain these behaviors over time. There was still much variability in proportions of adolescents meeting PA recommendations at T2 among the initially active adolescents. Thus, the presence of other factors, such as sports competence, in addition to engaging in recommended levels of physical activity as in the 10th grade may create the best prognosis for meeting physical activity recommendations after 1 year. The importance of per-ceived sports competence in predicting adolescents’ future physical activity and fitness in echoed in other studies (7,15). These findings suggest that discovering ways to bolster a sense of competence in sports participation may help to reduce physical activity drop-out among adolescents who were initially active the year prior. Alternatively, modifying the focus from sports competition to personalized fitness competence may help to keep these initially active adolescents involved in physical activity (10,42).
Initial level of activity, BMI, and exercise enjoyment combined in unique ways to predict longitudinal change in physical activity during high school. The increased likelihood of underweight (vs. normal or overweight) initially less active students to become physically active within the next year may reflect body image dissatisfaction or eating disorders that compel adolescents to increase activity levels to maintain or further reduce body weight (14). For inactive adolescents who were normal or overweight at the end of 10th grade, the likelihood of future physical activity adoption was dependent on initial levels of exercise enjoyment. While prior research, has noted that enjoyment of physical activity is associated with increased physical activity levels (13,32), the current study found that physical activity enjoyment was particularly important for the subgroup that was initially inactive and normal/overweight.
Despite the benefits of a longitudinal research design and the capacity to con-sider sets of multiple predictor variables, this study had some limitations. First, all data were assessed through self-report, which can be vulnerable to biases, measure-ment errors, and outcome misclassifications. Approximately 60% of the current sample met physical activity recommendations in the spring of 10th grade, which is substantially higher than the U.S. national rates of 35% for this age group (11). While reporting biases are a concern with the past-year physical activity measure used, the elevated rates of physical activity participation could be a function of the economically well-off nature of this sample. Nonetheless, using objective measures
Physical Activity Change Over One Year in High School Students 119
of physical activity such as accelerometers may generate more reliable and valid data. Second, initial levels of each factor varied naturally (and were not randomly assigned). Therefore, causal inferences cannot be made with certainty. The SDM model did not take into account the effects of factors measured at T2 (end of 11th grade). For example, increased physical activity enjoyment at T1 could cause increased physical activity enjoyment at T2, which could in turn influence physi-cal activity levels at T2 (instead of physical activity enjoyment at T1 having direct effects on physical activity at T2). Third, some of the observed changes in physical activity levels from 10th to 11th grade among certain subgroups identified could have resulted from “regression to the mean” between the two measurement periods. Participants with usually high or low estimates of initial physical activity levels (as a result of measurement error) may report more normative levels at follow-up. Lastly, findings from the signal detection analyses may be quite specific to the population at hand. High school students came from primarily White and middle-class households in the Eastern U.S. and the findings may not be generalizable to more ethnically-diverse or economically disadvantaged adolescents or other areas of the U.S. Future studies should also examine the stability and reproducibility of the subgroups identified in more representative samples.
This study identified unique adolescent subgroups that varied in the rates of meeting physical activity recommendations the following year. These findings may have implications for the targeting and tailoring of physical activity interventions and policies for high school students. Adolescents who are active but display lower levels of sports competence (i.e., at or below the mean score in our sample) may require specialized programs to prevent declining physical activity levels over subsequent years. In contrast, inactive adolescents could benefit from programs that enhance physical activity enjoyment to a high level (i.e., at least a half of a standard deviation unit above the mean in our sample), as this factor may be related to physical activity adoption during high school. Thus, although initial levels of physical activity are important in high school, they do not necessarily lead to the same level of physical activity a year later. Instead, they may work in combination with other unique factors to predict who will maintain, relapse, or adopt physical activity regimens over the next year.
Acknowledgments
This work was supported by the Prevent Cancer Foundation (Rodriguez, PI).
References 1. Aarnio, M., T. Winter, J. Peltonen, U.M. Kujala, and J. Kaprio. Stability of leisure-time
physical activity during adolescence–a longitudinal study among 16-, 17- and 18-year-old Finnish youth. Scand J Med Sci Sports. 12:179–185, 2002.
2. Aaron, D.J. A.M, Kriska, S.R. Dearwater, J.A. Cauley, K.F. Metz, and R.E. LaPorte. Reproducibility and validity of an epidemiologic questionnaire to assess past year physical activity in adolescents. Am. J. Epidemiol. 142:191–201, 1995b.
3. Ainsworth, B.E., W.L. Haskell, M.C. Whitt, et al. Compendium of physical activities: An update of activity codes and MET intensities. Med. Sci. Sports Exerc. 32:S498–S504, 2000.
120 Dunton et al.
4. Aitken, R., L. King, and A. Bauman. Comparison of Australian families’ expenditure on active and screen-based recreation using the ABS Household Expenditure Survey 2003/04. Aust. N. Z. J. Public Health. 32:238–245, 2008.
5. Audrain-McGovern, J., D. Rodriguez, K.P. Tercyak, G. Neuner, and H.B. Moss. The impact of self-control indices on peer smoking and adolescent smoking progression. J. Pediatr. Psychol. 31:139–151, 2006.
6. Baggett, C.D., J. Stevens, R.G. McMurray, et al. Tracking of Physical Activity and Inactivity in Middle School Girls. Med. Sci. Sports Exerc. 40:1916–1922, 2008.
7. Barnett, L.M., P.J. Morgan, E. van Beurden, and J.R. Beard. Perceived sports competence mediates the relationship between childhood motor skill proficiency and adolescent physical activity and fitness: a longitudinal assessment. Int. J. Behav. Nutr. Phys. Act. 5:40, 2008.
8. Biddle, S.H., and J. Wang. Motivation and self-perception profiles and links with physi-cal activity in adolescent girls. J. Adolesc. 26:687–701, 2003.
9. Butcher, K., J.F. Sallis, J.A. Mayer, and S. Woodruff. Correlates of physical activity guideline compliance for adolescents in 100 U.S. Cities. J. Adolesc. Health. 42:360–368, 2008.
10. Centers for Disease Control and Prevention. Increasing physical activity: A report on recommendations of the Task Force on Community Preventive Services. MMWR Recomm. Rep. 50:1–14, 2001.
11. Centers for Disease Control and Prevention. Youth Risk Behavior Surveillance — United States, 2007. MMWR. 57(No. SS-4): 2008.
12. Choi, W.S., J.P. Pierce, E.A. Gilpin, A.J. Farkas, and C.C. Berry. Which adolescent experimenters progress to established smoking in the United States. Am. J. Prev. Med. 13:385–391, 1997.
13. Cox, A.E., A.L. Smith, and L. Williams. Change in physical education motivation and physical activity behavior during middle school. J. Adolesc. Health. 43(5):506–513, 2008.
14. Davis, C., S.H. Kennedy, E. Ralevski, et al. Obsessive compulsiveness and physical activity in anorexia nervosa and high-level exercising. J. Psychosom. Res. 39:967–976, 1995.
15. Davison, K.K., D.S. Downs, and L.L. Birch. Pathways linking perceived athletic com-petence and parental support at age 9 years to girls’ physical activity at age 11 years. Res. Q. Exerc. Sport. 77(1):23–31, 2006.
16. Department of Veterans Affairs. Mental Illness Research, Education, and Clinical Centers. ROC4 Software, 2002.
17. Desha, L.N., J.M. Ziviani, J.M. Nicholson, G. Martin, and R.E. Darnell. Physical activity and depressive symptoms in American adolescents. J Sport Exer Psychol. 29:534–543, 2007.
18. Dovey, S.M., A.I. Reeder, and D.J. Chalmers. Continuity and change in sporting and leisure time physical activities during adolescence. Br. J. Sports Med. 32:53–57, 1998.
19. Eaton, D.K., L. Kann, S. Kinchen, et al., and Center for Disease Control and Prevention(CDC). Youth Risk Behavior Surveillance –United States, 2007. MMWR Surveill. Summ. 57:1–131, 2008.
20. French, S., M. Rosenberg, and M. Knuiman. The clustering of health risk behaviours in a Western Australian adult population. Health Promot. J. Austr. 19:203–209, 2008.
21. Garrison, C.Z., M.D. Schluchter, V.J. Schoenbach, and B.K. Kaplan. Epidemiology of depressive symptoms in young adolescents. J. Am. Acad. Child Adolesc. Psychiatry. 28:343–351, 1989.
22. Gustafson, S.L., and R.E. Rhodes. Parental correlates of physical activity in children and early adolescents. Sports Med. 36:79–97, 2006.
23. Hallal, P.C., C.G. Victora, M.R. Azevedo, and J.C. Wells. Adolescent physical activity and health: a systematic review. Sports Med. 36:1019–1030, 2006.
Physical Activity Change Over One Year in High School Students 121
24. James, K. E., R.F. White, and H.C. Repeated split sample validation to assess logistic regression and recursive partitioning: an application to the prediction of cognitive impairment. Stat. Med. 24:3019–3035, 2005.
25. Kaczynski, A.T., S.R. Manske, R.C. Mannell, and K. Grewal. Smoking and physical activity: a systematic review. Am. J. Health Behav. 32:93–110, 2008.
26. Kann, L., S.A. Kinchen, B.I. Williams, et al. Youth Risk Behavior Surveillance–United States, 1997. State and Local YRBSS Coordinators. J. Sch. Health. 68:355–369, 1998.
27. Kendzierski, D., and K. DeCarlo. Physical activity enjoyment scale: two validation studies. J Sport Exer Psychol. 13:50–64, 1991.
28. Kiernan, M., H.C. Kraemer, M.A. Winkleby, A.C. King, and C.B. Taylor. Do logistic regression and signal detection identify different subgroups at risk? Implications for the design of tailored interventions. Psychol. Methods. 6:35–48, 2001.
29. Kramer, H.C. Evaluating Medical tests: Objective and quantitative guidelines. Newbury Park: Sage, 1992.
30. Marsh, H.W., G.E. Richards, S. Johnson, L. Roche, and P. Termayne. Physical self-description questionnaire: Psychometric properties with a multitrait-multimethod analysis of relations to existing instruments. J Sport Exer Psychol. 16:270–305, 1994.
31. Motl, R.W., A.S. Birnbaum, M.Y. Kubik, and R.K. Dishman. Naturally occurring changes inphysical activity are inversely related to depressive symptoms during early adolescence. Psychosom. Med. 66:336–342, 2004.
32. Motl, R.W., R.K. Dishman, R. Saunders, M. Dowda, G. Felton, and R.R. Pate. Measur-ing enjoyment of physical activity in adolescent girls. Am. J. Prev. Med. 21:110–117, 2001.
33. Myers, K., and N.C. Winters. Ten-year review of rating scales. II: Scales for internal-izing disorders. J. Am. Acad. Child Adolesc. Psychiatry. 41:634–659, 2002.
34. Paavola, M., E. Vartiainen, and A. Haukkala. Smoking, alcohol use, and physical activ-ity: a 13-year longitudinal study ranging from adolescence into adulthood. J. Adolesc. Health. 35:238–244, 2004.
35. Prochaska, J. J., S.M. Hall, G. Humfleet, R.F. Munoz, V. Reus, J. Gorecki. and D. Hu. Physical activity as a strategy for maintaining tobacco abstinence: a randomized trial. Prev. Med. 47:215–220, 2008.
36. Rodriguez, D., G.F. Dunton, J. Tscherne, and J. Sass. Physical Activity and adolescent smoking: A moderated mediation model. Ment. Health Phys. Act. 1:17–25, 2008.
37. Smith, P.M., H.C. Kramer, N.H. Miller, R.F. DeBusk, and C.B. Taylor. In-hospital smoking cessation programs: who responds, who doesn’t? J. Consult. Clin. Psychol. 67:19–27, 1999.
38. Telama, R. Tracking of Physical Activity from Childhood to Adulthood: A Review. Obes Facts. 2(3):187–195, 2009. Epub 2009 Jun 12.
39. U.S. Department of Health and Human Services. Physical Activity Guidelines Advisory Committee Report, 2008. Washington DC. 2008.
40. Ussher, M.H., A. Taylor, and G. Faulkner. Exercise interventions for smoking cessation. Cochrane Database Syst. Rev. (Issue 3):CD002295, 2008. .
41. Verkooijen, K.T., G.A. Nielsen, and S.P. Kremers. The Association between leisure time physical activity and smoking in adolescence: an examination of potential mediating and moderating factors. Int. J. Behav. Med. 15:157–163, 2008.
42. Waldron, J.J. Influence of involvement in the girls on track program on early adolescent girls’ self-perceptions. Res. Q. Exerc. Sport. 78(5):520–530, 2007.