1 IDENTIFYING SYNERGY IN SMALL GROUP COMPETITIONS: AN APPLIED SETTING APPROACH Cheryl Clark (Georgia Gwinnett College) Beach Clark (Mercer University) Abstract When forming small groups, ideally the performance of the group would exceed that of any individual in the group. This increased performance is often described as synergy. Yet identifying and quantifying the presence of synergy in small groups, specifically dyads has been difficult. Even more challenging has been the ability to demonstrate synergistic relationships in “real world” or applied settings. The purpose of this study was to determine if synergy could be measured in a competitive sport. In other words, can we compare the performance of small groups (dyads) to that of individual performance to determine the existence of synergy? The individual performance metrics of skill and money earnings were assigned to each participating golfer and ranked before comparing to dyad performance. Then, using the dyad performance data from 2004 through 2013 from the Ryder Cup and President’s Cup golf tournaments the performance outcomes of dyads were compared to the individual metrics and analyzed. Using Larson’s definition of synergy, the results showed that when comparing individual performance to dyad performance, synergy was evident in more than 40% of the dyads and in particular, 25% of the dyads demonstrated strong synergy. Acknowledgement: Many thanks to the PGA TOUR for providing access to the “ShotLink®” Powered by CDW® data. Introduction Synergy is an elusive term that is often associated with groups of individuals and performance. Ideally, if the ‘right’ group of individuals is assembled they will outperform those same individuals working alone. While leaders in various organizations form groups with the expectation that the combination of skill and interaction will improve performance it can be difficult or impossible to measure. This study sought to determine if synergy was measurable in the performance of small groups specifically dyads. The study analyzed data of various dyads who participated in an annual sporting competition over a ten year period. Research Question:
Transcript
1
IDENTIFYING SYNERGY IN SMALL GROUP COMPETITIONS: AN APPLIED
SETTING APPROACH
Cheryl Clark (Georgia Gwinnett College)
Beach Clark (Mercer University)
Abstract
When forming small groups, ideally the performance of the group would exceed that of any
individual in the group. This increased performance is often described as synergy. Yet
identifying and quantifying the presence of synergy in small groups, specifically dyads has been
difficult. Even more challenging has been the ability to demonstrate synergistic relationships in
“real world” or applied settings. The purpose of this study was to determine if synergy could be
measured in a competitive sport. In other words, can we compare the performance of small
groups (dyads) to that of individual performance to determine the existence of synergy? The
individual performance metrics of skill and money earnings were assigned to each participating
golfer and ranked before comparing to dyad performance. Then, using the dyad performance
data from 2004 through 2013 from the Ryder Cup and President’s Cup golf tournaments the
performance outcomes of dyads were compared to the individual metrics and analyzed. Using
Larson’s definition of synergy, the results showed that when comparing individual performance
to dyad performance, synergy was evident in more than 40% of the dyads and in particular, 25%
of the dyads demonstrated strong synergy.
Acknowledgement: Many thanks to the PGA TOUR for providing access to the “ShotLink®”
Powered by CDW® data.
Introduction
Synergy is an elusive term that is often associated with groups of individuals and performance.
Ideally, if the ‘right’ group of individuals is assembled they will outperform those same
individuals working alone. While leaders in various organizations form groups with the
expectation that the combination of skill and interaction will improve performance it can be
difficult or impossible to measure. This study sought to determine if synergy was measurable in
the performance of small groups specifically dyads. The study analyzed data of various dyads
who participated in an annual sporting competition over a ten year period.
Research Question:
2
Is synergistic performance measurable in dyads competing in a sporting event?
Review of the Literature
While research on group performance (Hackman & Morris, 1975, Kerr & Tindale, 2004, Kerr,
2010, Steiner, 1972, Volmer, et.al. 2011), and synergy (Hertel, 2011, Larson, 2010) has been
conducted in various contextual settings, few studies have linked the two outside laboratory and
classroom settings. In fact, even if linked, previous research has produced mixed results in group
performance gain (Kerr and Tindale, 2004). This paper analyzes the competitive golf
environment to better understand, if, by measuring both skill and synergy, dyad synergy is
measurable in this applied setting.
Small Groups/Dyads
Since small groups are comprised of individuals both engaging and influencing each other in a
manner that improves performance, a competitive sporting venue provides an opportunity to
explore this improvement. Most sports are played with groups or teams of athletes (baseball,
basketball, football, hockey) with the goal of the captain to create the group of players who will
perform as a group better than they would as individuals. Yet certain literature has focused on
the weaknesses of measuring group performance but as suggested by Wang and Thompson
(2006), this study focuses on the strengths and benefits of small groups.
Group Task
When analyzing group performance a clear definition of group task must remain constant. Using
the construct identified by Larson (2010) and Hackman, (1969) to validate the presence of group
task in this setting, Figure 1, demonstrates that each of the elements are clearly developed and
defined. The event venue, equipment and player skill all create a ‘stimulus complex’, while the
3
score, the dyad wins and tournament wins provide ‘goal direction’, finally the rules of the game,
etiquette and scoring process all ensure a ‘procedural directive’.
Figure 1.
Group Effectiveness
Group effectiveness is a result of inputs, processes and outputs and goes beyond task
performance to include the attitudes and behavioral outcomes of the team members (Kozlowski
& Ilgen, 2006, Cohen & Bailey, 1997). Performance effectiveness is directly related to the
outcome and determined by the quality or score for a particular event and evaluated by an
externally defined standard (Larson). The standard governing these tasks are the rules and
scoring methodology of the United States Golf Association and the Royal & Ancient Golf Club
(Cullity, 2011).
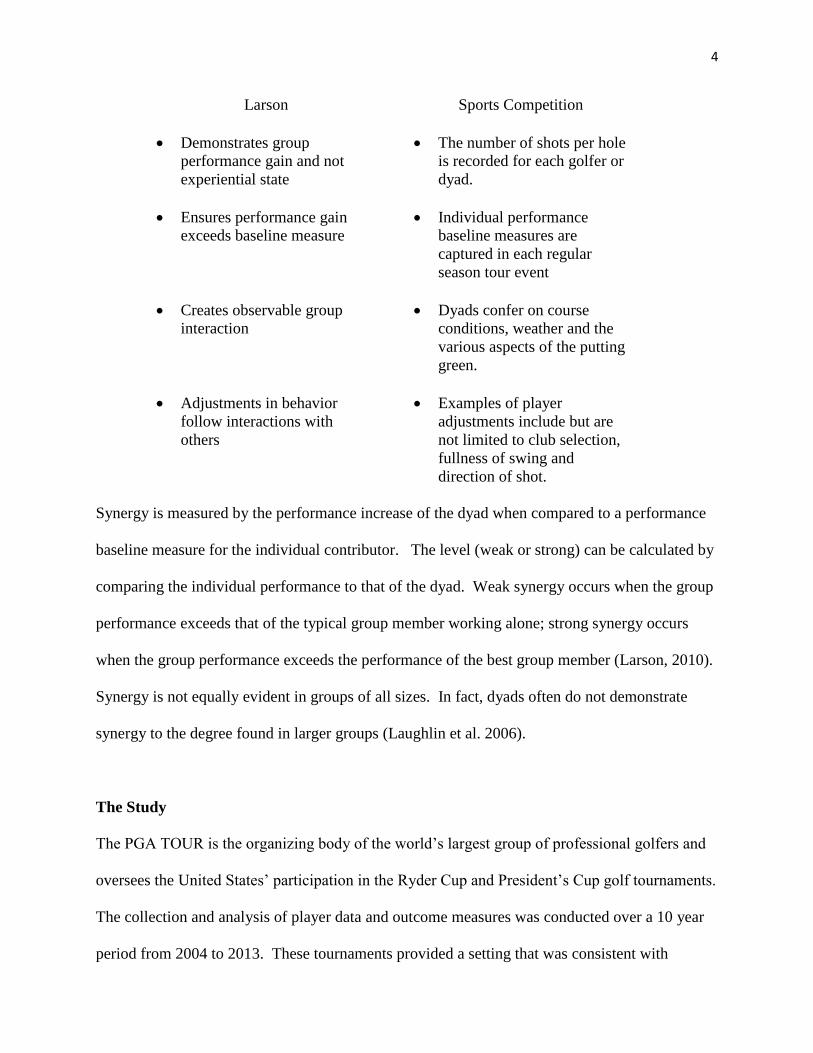
Synergy
Whether in business or the business of sports, synergy is described as the increase in
performance by the collective group beyond what could be achieved by individuals (Larson,
2010, Hertel, 2011). Larson’s definition of synergy is readily linked to this sports competition in
that it:
1. Stimulus Complex
(Preexisting set of materials)
2. Goal Directives
(Expectations to produce or achieve)
3. Procedural Directives
(How task performed)
Course
Conditions
Player dyad
Competitor dyad
Player skill
Player equipment
Number of shots per hole
Hole wins
Match win
Event win
Rules
Format
Etiquette
Scoring
4
Larson Sports Competition
Demonstrates group
performance gain and not
experiential state
The number of shots per hole
is recorded for each golfer or
dyad.
Ensures performance gain
exceeds baseline measure
Individual performance
baseline measures are
captured in each regular
season tour event
Creates observable group
interaction
Dyads confer on course
conditions, weather and the
various aspects of the putting
green.
Adjustments in behavior
follow interactions with
others
Examples of player
adjustments include but are
not limited to club selection,
fullness of swing and
direction of shot.
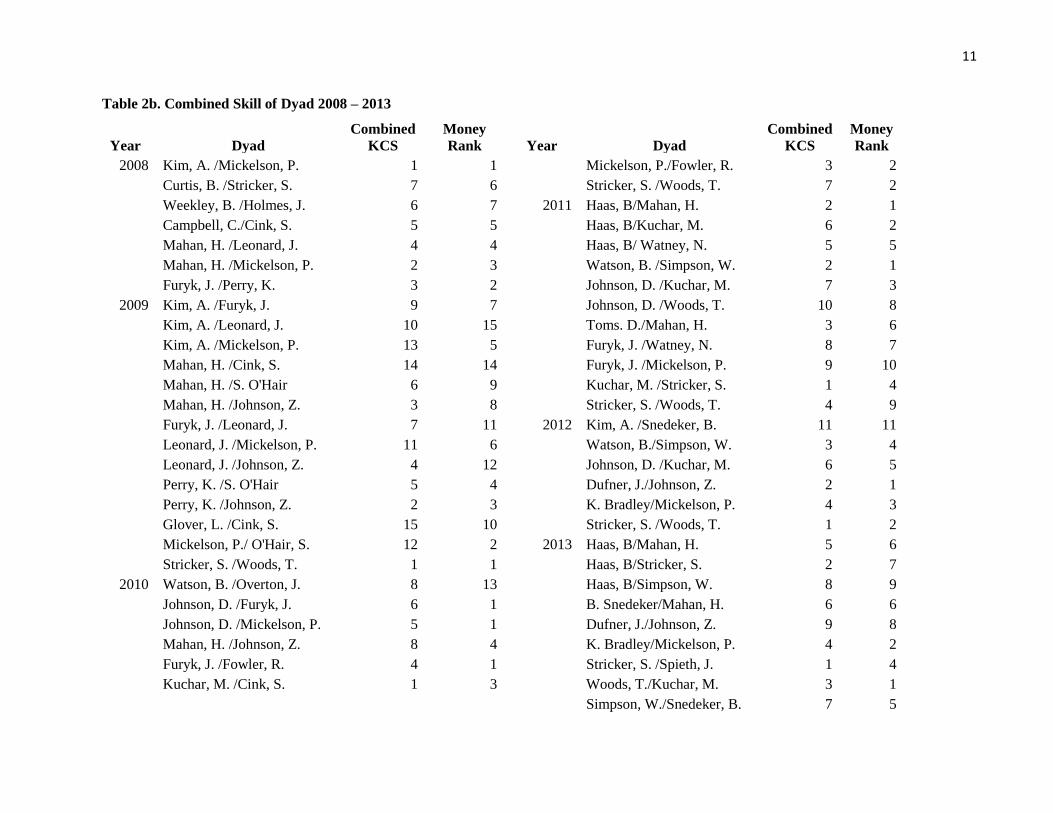
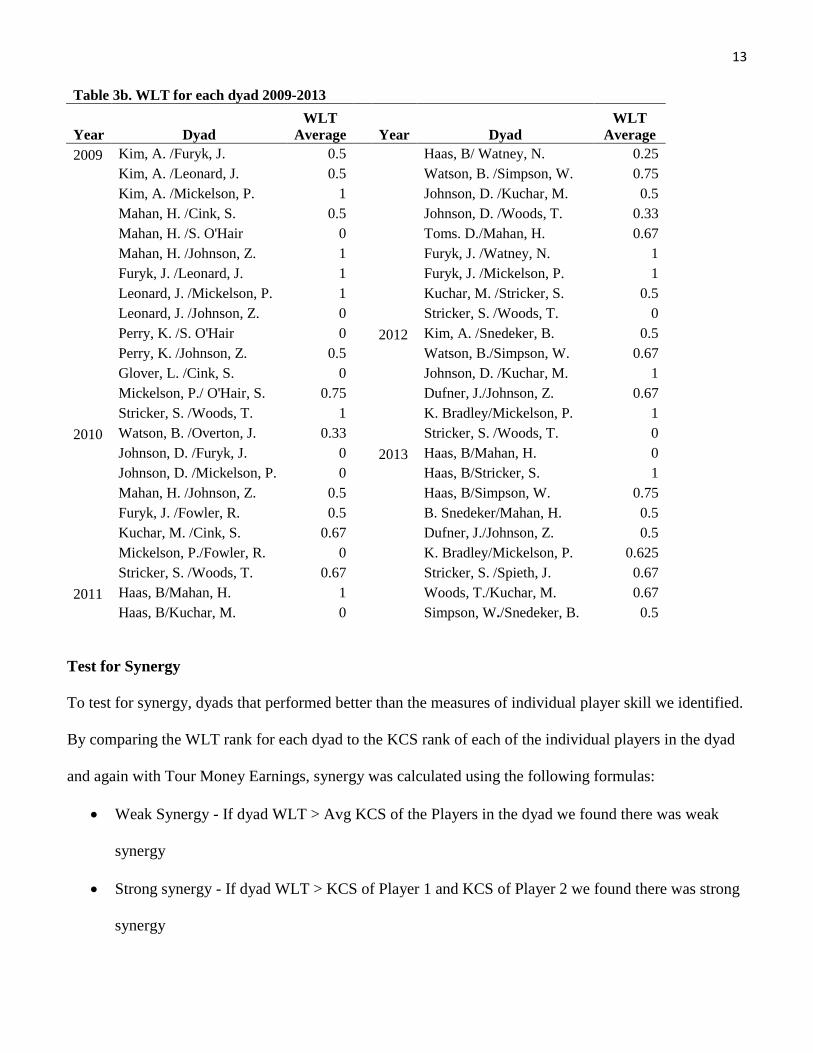
Synergy is measured by the performance increase of the dyad when compared to a performance
baseline measure for the individual contributor. The level (weak or strong) can be calculated by
comparing the individual performance to that of the dyad. Weak synergy occurs when the group
performance exceeds that of the typical group member working alone; strong synergy occurs
when the group performance exceeds the performance of the best group member (Larson, 2010).
Synergy is not equally evident in groups of all sizes. In fact, dyads often do not demonstrate
synergy to the degree found in larger groups (Laughlin et al. 2006).
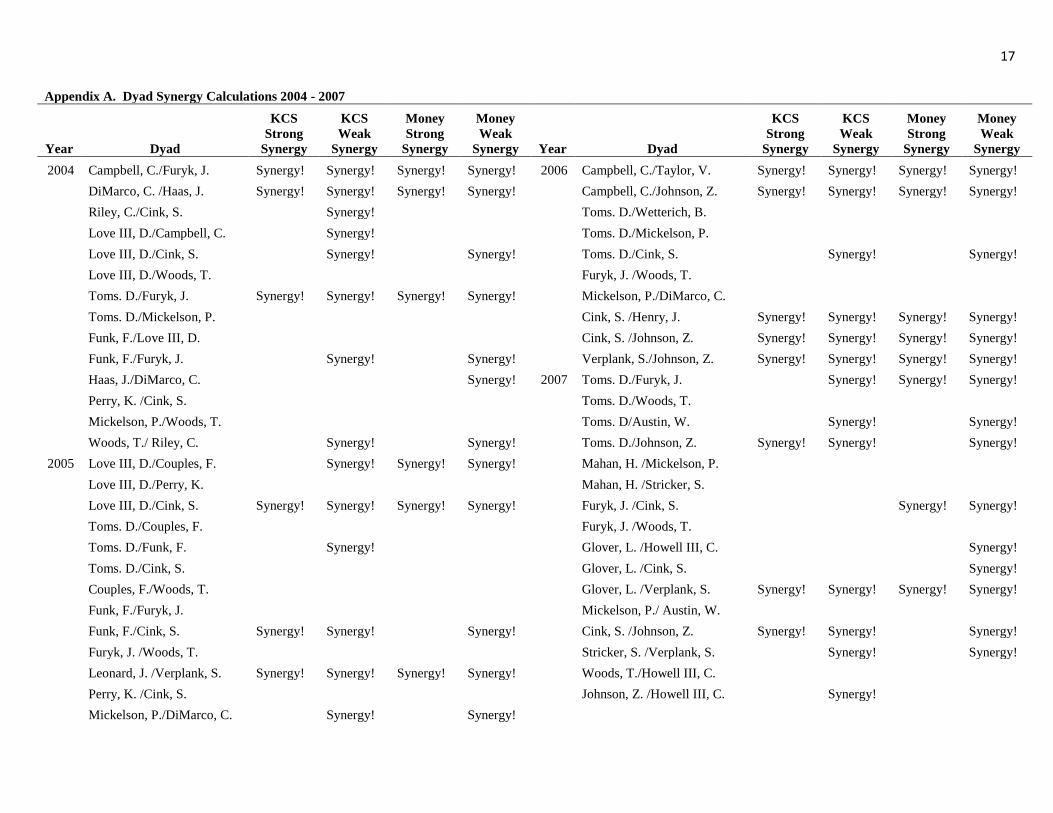
The Study
The PGA TOUR is the organizing body of the world’s largest group of professional golfers and
oversees the United States’ participation in the Ryder Cup and President’s Cup golf tournaments.
The collection and analysis of player data and outcome measures was conducted over a 10 year
period from 2004 to 2013. These tournaments provided a setting that was consistent with
5
evaluating group performance. First, the tournament structure was a defined group task and that
provided the opportunity to measure synergy as it related to performance outcomes. Second,
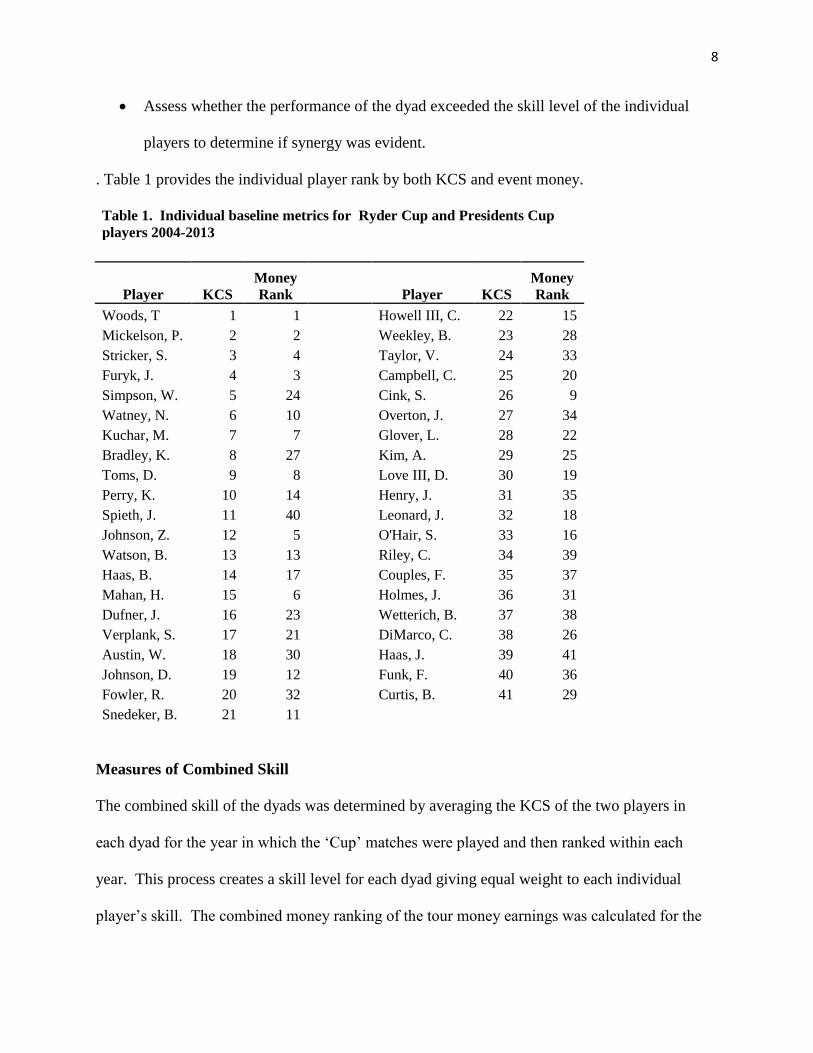
measures of skill were available for each player by determining an individual performance
metric. Third, a performance metric was calculated for each dyad based on the performance
ranking for each player in the dyad. Fourth, using the individual player skill metric for each
dyad, a test for synergy in each annual competition over ten year period was conducted. Finally,
the results of this analysis were used to answer the skill or synergy research question:
Is synergistic performance measurable in dyads competing in a sporting event?
With the availability of the PGA TOUR’s performance data (ShotLink™), academic research is
gaining momentum to better understand specific player performance and the contributing factors
that may be predictors of tournament wins. These include strokes gained (Broadie, 2012), peer