The IES Annual Graduate Review 2000: a diverse and fragmented market R Pearson J Aston P Bates N Jagger the Institute for Employment Studies IES Report 367 R Supported by the IES Research Club
Transcript
HR Response to Organisational Change 1
The IES AnnualGraduate Review 2000:
a diverse and fragmented market
R PearsonJ AstonP BatesN Jagger
the Institutefor Employment
Studies
I E SReport 367
RSupported by the IESResearch
Club
THE IES ANNUAL GRADUATE REVIEW 2000:
a diverse and fragmented market
Other titles from IES:
The Art of Getting Started: Graduate skills in a fragmented labour marketLa Valle I, O’Regan S, Jackson CIES Report 364, 2000. ISBN 1-85184-294-2
Nurturing Conservators: the Early Career Paths of Conservation GraduatesJagger N, Aston JIES Report 362, 2000. ISBN 1-85184-291-8
Employability and Employers: the missing piece of the jigsawTamkin P, Hillage JIES Report 361, 1999. ISBN 1-85184-290-X
Graduates Mean BusinessTackey N, Perryman SIES Report 357, 1999. ISBN 1-85184-286-1
The IES Annual Graduate Review 1998-1999: the Key FactsPearson R, Perryman S, Connor H, Jagger N, Aston JIES Report 354, 1999. ISBN 1-85184-283-7
What do Graduates do Next?Connor H, La Valle I, Pollard E, Millmore BIES Report 343, 1997. ISBN 1-85184-271-3
The IES Annual Graduate Review, 1997-1998: the Fragmenting Graduate MarketPearson R, Perryman S, Connor H, Jagger N, La Valle IIES Report 340, 1997. ISBN 1-85184-268-3
The FE/HE Interface: a UK PerspectiveRawlinson S, Frost D, Walsh KIES Report 316, 1996. ISBN 1-85184-242-X
Ethnic Minority Graduates: Differences by DegreesConnor H, La Valle I, Tackey N, Perryman SIES Report 309, 1996. ISBN 1-85184-235-7
What do Graduates Really do?Connor H, Pollard EIES Report 308, 1996. ISBN 1-85184-234-9
University Challenge: Student Choices in the 21st Century. A report to the CVCPConnor H, Pearson R, Court G, Jagger NIES Report 306, 1996. ISBN 1-85184-232-2
A catalogue of these and over 100 other titles is available from IES, or on the IES Website,www.employment-studies.co.uk
IES Report 367
The IES AnnualGraduate Review 2000:
a diverse and fragmented market
R PearsonJ AstonP BatesN Jagger
the Institutefor Employment
Studies
Published by:
THE INSTITUTE FOR EMPLOYMENT STUDIESMantell BuildingFalmerBrighton BN1 9RFUK
No part of this publication may be reproduced or used in any form by any means—graphic,electronic or mechanical including photocopying, recording, taping or information storage orretrieval systems—without prior permission in writing from the Institute for EmploymentStudies.
British Library Cataloguing-in-Publication Data
A catalogue record for this publication is available from the British Library
ISBN 1-85184-297-7
Printed in Great Britain by IKON Office Solutions plc
v
The Institute for Employment Studies
The Institute for Employment Studies is an independent,apolitical, international centre of research and consultancy inhuman resource issues. It works closely with employers in themanufacturing, service and public sectors, governmentdepartments, agencies, professional and employee bodies, andfoundations. For over 30 years the Institute has been a focus ofknowledge and practical experience in employment and trainingpolicy, the operation of labour markets and human resourceplanning and development. IES is a not-for-profit organisationwhich has a multidisciplinary staff of over 50. IES expertise isavailable to all organisations through research, consultancy,publications and the Internet.
IES aims to help bring about sustainable improvements inemployment policy and human resource management. IESachieves this by increasing the understanding and improving thepractice of key decision makers in policy bodies and employingorganisations.
The IES Research Club
This report is the product of a study supported by the IESResearch Club, through which a group of IES CorporateMembers finance, and often participate in, applied research onemployment issues. The members of the Club are:
Anglian WaterThe Benefits AgencyBOC Group plcBBCBT plcCabinet OfficeCorusDepartment of the Environment,
Transport and the RegionsElectricity AssociationGlaxo Wellcome plcHalifax plcHM Customs & ExciseHome Office
Inland RevenueLittlewoods Organisation plcLloyds TSB Bank plcNatWest GroupNHS ExecutiveOrange plcPost OfficeRolls-Royce plcScottish Equitable plcScottish ExecutiveShell International LtdStandard LifeUnilever UK Ltd
vi
Acknowledgements
Thanks are due to the many organisations and individualsinvolved with the provision of source data and material on whichthis report is based, in particular the Association of GraduateRecruiters (AGR), Department for Education and Employment(DfEE), the Universities and Colleges Admissions Service(UCAS), and the Higher Education Statistics Agency (HESA).
Within IES thanks are due to Emma Hart and Andy Davidsonwho helped prepare the report for publication.
vii
Contents
Executive Summary ix
1. Introduction 1
1.1 Introduction 11.2 The review 2
2. The Changing Employment Context 3
2.1 The shift to a service based economy 32.2 The growing demand for high level skills 5
3. A Graduate Elite No More 7
3.1 The growth in higher education 73.2 The changing student population 83.3 How students choose their degree course 103.4 Graduate numbers 113.5 Looking ahead 12
4. Graduate Recruitment and Employment 13
4.1 Graduate recruitment into mainstream employment 134.2 Expansion has not solved employers’ recruitment
difficulties 154.3 Starting salaries 164.4 Graduate salary progression and retention 174.5 Many graduates have other destinations 184.6 Graduates are taking longer to settle into established
employment 19
5. In Conclusion — an Ever More Diverse and FragmentedLabour Market 22
5.1 Introduction 225.2 A diverse range of jobs to be filled 225.3 With a diverse population graduating 235.4 Improving graduate recruitment 245.5 Helping graduates as job seekers 255.6 In conclusion 25
Figures 27
Bibliography and Further Reading 45
Sources of Information 48
viii
ix
Executive Summary
At the start of the century, the labour market for graduates canbe characterised by two words: ‘diversity’ and ‘fragmentation’.Despite the strength of the economy, recruitment difficulties forgraduates among the major recruiters eased in 1999, as vacancylevels fell. Vacancy levels, however, are expected to recover in2000 and the need for graduate and high level skills has not goneaway. Competition for the relatively small number of the bestgraduates will remain intense, despite the large numbersgraduating. Many graduates will, however, have to set lowerhorizons in terms of the jobs and careers they seek and can enter.
Demand for good graduates
Competition, technology and rising consumer power arechanging the way we work, the skills and jobs needed, andwhere they are located. Traditional boundaries are fastdisappearing as companies move into new activities andmarkets, such as internet banking and retailing, or enter cross-border and cross-sector alliances, and seek to resourceoperations internationally. As a result, the staffing profile soughtis shifting to higher level occupations and higher skill profileswithin occupations. While a small number of graduates are beingsought to fill ‘high flier’ development schemes, many are beingsought for, or entering, an increasingly diverse range of jobs, interms of entry to:
! fast track management training schemes: for small numbersin large organisations. Personal skills are critical, the supplylimited and competition intense.
! professional and functional careers: eg accountancy andengineering. A growth area; personal qualities are growing inimportance, the supply of suitable candidates is limited forsome functions. Recruitment may focus on key technicalcourses.
! ‘graduate level’ administrative and management jobs: withmore limited initial career prospects. Personal qualities aremore important than qualifications. Graduates may berecruited alongside non-graduates, internal and experiencedcandidates.
x
! self-employment: where the rewards may be uncertain butlifestyle is more important. A traditional area for arts anddesign graduates.
! lower level jobs: where graduates can ‘add value’, upgradingthe contribution to the job. They may be in competition, andwork alongside non-graduates, finding jobs within thebroader recruitment market.
! the wider labour market: in competition with non-graduates,where there may be little advantage in being a graduate.
Despite recurrent recruitment difficulties, the major recruitershave not markedly raised graduate starting salaries. While a fewpaid in excess of £25,000 in 1999, many jobs are jobs advertisedat £10-12,000 per annum. Changes to the median starting salary(£17,500 in 1999) largely track the rise in national earnings.
Diversity among graduate job seekers
In the forty years since Robbins, numbers graduating havegrown ten-fold. In 1999, over 250,000 graduated with a firstdegree and 115,000 more with sub-degree or postgraduatequalifications. The introduction of new two year ‘foundation’degrees is expected to boost numbers further in future years. Thegraduate supply is now far more diverse:
! one in three young people enter higher education
! employability is important in choice of course
! two-thirds are still from the ‘top’ two social classes
! one in three enter with non ‘A’ level qualifications
! they study at over 250 universities and colleges
! women are now a majority of those graduating
! one in three are over 25 when they graduate
! one in seven come from ethnic minorities
! many now study near home and may be less mobile
! growing numbers will graduate with sub-degree qualifications
! they have diverse aspirations and expectations.
Finding the ‘right’ job
As the number of ‘traditional‘ graduate jobs (managers andprofessionals) has failed to grow in line with graduate supply, somore graduates have entered intermediate level jobs astechnicians and associate professionals, or lower-level jobs.Many are also taking two or more years to settle into ‘stable’employment, with one in three entering temporary or fixed-termjobs.
xi
There have always been big differences experienced by thosefrom different disciplines. Those from the humanities, languagesand biological sciences have the highest initial unemploymentand the lowest proportions entering ‘graduate’ jobs. In contrast,those from computer science, engineering, education andmedicine have the best employment profiles. Most find whatthey regard as satisfactory employment within two or threeyears of graduation: under eight per cent of 1999 graduates wereunemployed six months after graduation.
Retention remains good
Retaining good graduates is influenced by a wide range oforganisational and personal factors, including initial selection byboth recruiter and recruit, the variety and challenge of workundertaken, and career prospects. Despite intense competitionfor the ‘best’, relatively good retention rates are beingmaintained. In late 1999, half of the recruiters had held onto atleast 95 per cent of their 1998 intake (ie for their first year) and 72per cent of their 1996 intake (ie for their first three years),although there are considerable variations around theseaverages. These figures have been remarkably stable over thelast 20 years and at different points in the economic cycle.
Improving graduate recruitment
The major recruiters have rarely been able to get all the ‘good’graduates they have sought. To improve this they need torecognise the diverse nature of the supply, and that competitionfor the best will remain intense. They do not always need, norcan they develop and retain, the ‘best’ graduates in all the rolesthey need to fill, so they need to consider the range of jobs andcareers to be filled, the job specifications and competenciesneeded for each, and how they can be identified; qualificationsmay provide little guidance as to capability. Overemphasis ontargeting particular institutions will restrict the pool of talentseen and maximise competition from other recruiters. Theprovision of work experience can help improve the supply andact as a filter, simplifying the recruitment and selection process.Appropriate and coherent recruitment, development andretention strategies, embracing the specialists and line managerswho will be involved, are essential.
Improving graduates’ job prospects
The possession of a degree or equivalent qualification is not asufficient indicator of competence for particular jobs and careers.Whilst being largely beneficial to job seekers, it is not a passportto a good job. If graduates are to make an effective transition intothis increasingly fragmented labour market, they need to ensurethey develop their employability skills:
xii
! their assets (knowledge, skills and attitudes)
! career management skills (awareness of their strengths,weaknesses, and adaptability)
! self-presentation skills.
In this they need to be supported by up to date and accessiblecareers information and guidance before, during, and after theygraduate.
Conclusion
The coming years are likely to see further fragmentation of thegraduate labour market. Many more graduate jobs andgraduates will become incorporated into the operation of thewider recruitment market. The graduate labour market that doesexist will be focused on the activities of a minority of recruiterswith structured recruitment schemes which will be focused, byvirtue of numbers and the qualities sought, on a small minorityof graduates.
The IES Annual Graduate Review 2000 1
1. Introduction
1.1 Introduction
The purpose of this Review is to provide a brief on the graduatelabour market at the start of the new century. It builds onprevious editions of the IES Graduate Review1, and it draws onand synthesises a wide range of other published material. It hasbeen prepared under the auspices of the IES Research Club.
Given the timing of this year’s Review, the opportunity has beentaken to reflect back on the some of the key changes affecting thegraduate labour market since the 1960s, when the Robbins report(1963) ushered in the modern expansion of higher education. Atthat time the UK had a relatively small, elitist higher educationsystem. Under ten per cent of young people entered highereducation, with just over 30,000 entering full-time first degreecourses in the 31 universities. In 1963 some 24,000 studentsgraduated with first degrees, and similar numbers with teachingqualifications, diplomas or higher degrees. In contrast, the UKnow has a mass higher education system with over 35 per cent ofyoung people entering higher education. There are now morethan 1.7 million students studying at over 250 universities andcolleges, with many taking HE courses in FE colleges. Over250,000 graduate each year with a first degree and 115,000 morewith sub-degree or postgraduate qualifications.
The labour market has also changed dramatically over thisperiod. It has moved from a relatively stable industrial structure,dominated by manufacturing, utilities and other industries withlarge numbers of manual workers, to today’s more volatile,service based economy, with much stronger internationalcompetition and connections. It is increasingly dominated bywhite collar jobs. Indeed, parts of the labour market may be at apoint of further upheaval as deregulation, the rise in consumerpower, technology and globalisation rewrite the employmentlandscape again in the early years of the new century.
This Review, therefore, provides a briefing on key trends forgraduate recruiters, employers and others concerned to
1 The first edition was published in 1982 (Pearson, 1982).
The Institute for Employment Studies2
understand the interface between the supply of graduates,recruitment and the labour market.
1.2 The review
The format of this Review is one of a commentary followed by aseries of graphs and figures which illustrate key trends andcharacteristics.1
Chapter 2 sets the scene by mapping the broad employmenttrends and emerging skill needs. Chapter 3 examines thechanging supply of graduates since the 1960s and the expectedtrends in the first years of this century. The demand forgraduates is considered in Chapter 4, as are the employment andother experiences of graduates in their early years aftergraduation. Chapter 5 then draws together the key features andconclusions, highlighting the key challenges facing employersand graduates in the coming years.
A series of over 30 figures follows, mapping the key trends andcharacteristics of this changing market.
Appendices detail the relevant references and sources of furtherinformation.
1 Consistent time series data are not available for the whole period
1960-1999 so some estimates are included; in other cases, time seriescan only start in the 1980s or 1990s.
The IES Annual Graduate Review 2000 3
2. The Changing Employment Context
2.1 The shift to a service based economy
Overall employment levels have grown slowly since the early1960s, with steady recovery from the declines in the recessionaryperiods of the mid 1970s, the early 1980s and the early 1990s. In1999, employment totalled 27 million, of whom 24 million wereemployees and a further three million self-employed.
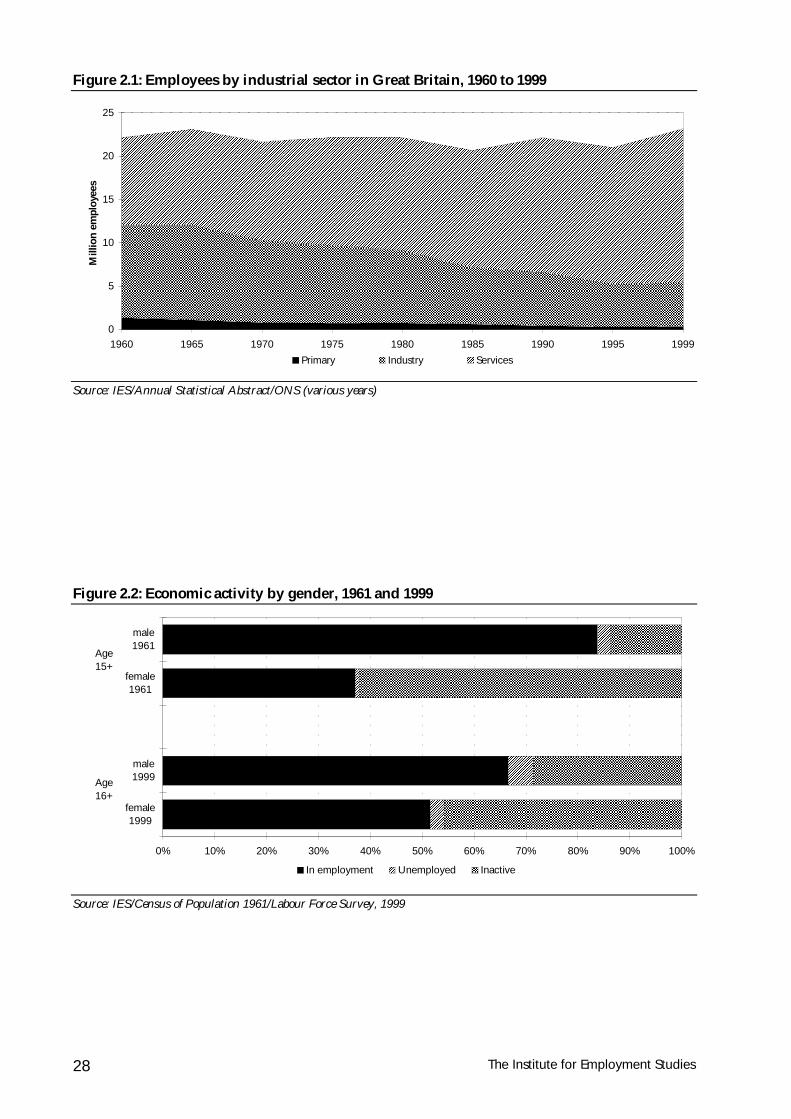
The economy has restructured in response to a wide range offactors, including competitive pressures, technological andorganisational change, and the emergence of new activities. Thishas led to industrial employment, in sectors such asmanufacturing, energy and construction, falling from a peak ofover 12 million to 6.5 million: under one in four of those now inemployment. This decline has, however, been counterbalancedby the rise in service sector employment. A small part of thisshift has, however, been accounted for by a statisticalreclassification (for example, when a manufacturing companyoutsources its transport, catering or IT, the jobs reappearclassified under service sector employment) (Figure 2.1).
The years around the turn of the century are proving to be aparticularly dramatic point in this evolution. Employers andrecruiters are seeking to meet the ever growing challenges ofglobal competition, more rapid rates of technological change, thegrowth of consumer power and the changing expectations of theworkforce. These pressures are all changing the balance,distribution and content of jobs at an ever faster rate. Indeed,while many outsourced jobs are being moved from the traditionalemployer to, for example, call centres around the UK, many arealso being moved and sourced outside the UK (Huws, 2000).
In manufacturing there are major sectoral differences, with thehigh value added sectors such as electronics and IT growing fast,along with car production which has also benefited from inwardinvestment, while many traditional firms in sectors such astextiles and clothing continue to contract. Cross-border mergersand consolidation are also leading to rationalisation of jobs insectors as diverse as the pharmaceutical and defence sectors.
Telecoms, IT, and business services are benefiting from thegrowth in new services, the economy and outsourcing, while
The Institute for Employment Studies4
retailing is responding to an apparent segmentation of themarket and the arrival of Internet shopping. As yet, no oneknows how this will impact in terms of jobs and indeed wherethe jobs will be: in the pure Internet companies, in the rapidlyresponding traditional players, or in those organisationsconcentrating on delivery. In banking and financial services, newtechnology and the Internet are major forces for change, with agrowth in employment in call centres and a decline in the highstreet. Meanwhile, reduced barriers to entry by foreign-ownedand sourced organisations is rewriting the map for financialservices. In the media sector, traditional sectoral boundaries arealso falling as newspapers go online and TV companies moveinto Internet retailing, and small firms and self-employmentproliferate. The catering and hospitality industries are alsogrowth sectors, and while they may not be major recruiters ofthe highly qualified, they are expecting staff to have ever-highercustomer and interpersonal skills. Finally, in the public sector,outsourcing, performance league tables and the Civil ServiceModernising Government initiative are leading to major changes inthe balance of jobs and the skills needed. Staff are having tobecome more accountable for delivering clearer service outcomes,whether they are in local or central government, teaching, or thehealth service.
The growth in employment has also been boosted by theincreased participation by women in the labour force. In 1961,only one in three of women over the age of 15 were working;nowadays over half do so. At the same time, the proportion ofworking men in these age groups has fallen from 85 to 66 percent. This is caused by rising levels of participation in educationamongst the young, with many staying in, or returning toeducation in their mid-20s, and rising levels of retirementsamong those aged over 50 (Figure 2.2). As a result, women nowaccount for over 40 per cent of the workforce, up from one-thirdin 1961.
The proportion of people working part time has also risen, fromnine per cent in 1961 to over 25 per cent, and is expected to movetowards nearly 30 per cent in the early years of the century(Figure 2.3). This has come about due to a number of factors,including the decline in manufacturing and rise in services,related changes to the occupational profile of jobs, employers’need for greater flexibility in deploying staff to meet businesspatterns, and the preference of many workers, especially women,for part-time working.
Self-employment has also grown with the rise of the servicesector. There was particularly rapid growth in the 1980s with thenumbers nearly doubling to 3.4 million, over 13 per cent of thosein employment. A wide range of factors underpinned this growthincluding structural changes and the rise in unemployment,regulatory, financial and public policy changes, and a growth in‘outsourcing’ or contracting out of business services. Since then
The IES Annual Graduate Review 2000 5
the numbers have fluctuated, mirroring changes in economicconditions, but the proportion in self-employment has yet to reachthe previous peak in 1991 of 13 per cent (Figure 2.4). The mainoccupations of the self-employed are managerial, professional,and craft, including many in the construction sector (Meager,1998).
The unemployment rate1 at the end of the century is regarded asbeing at a modern low of under five per cent. This represents amajor decline from the peak of over 13 per cent in the early1980s. The level is still high compared with that in the 1960s,when it was well under five per cent, and somewhat lower overthe period back to 1945. The unemployment figures are one ofthe few administrative data sets that go back to the 19th century.They are presented here to demonstrate the long, stable period oflow unemployment over the period 1945 to the early 1970s. Thehigher and more volatile levels of unemployment in the 1980sand 1990s have more in common with the 19th century and thefirst half of the 20th century (Figure 2.5).
Assuming the economy continues to grow at its long-term rate,the overall level of employment is expected to grow by aboutfive per cent over the decade to 2006. Given the rapid rates ofchange in the economy, there is uncertainty as to which types oforganisations will be employing what types of staff over thisperiod. Nor is it certain how many will be employed, where theywill be located, or what skills will be needed. However, somebroad trends are clear.
2.2 The growing demand for high level skills
The changes and pressures noted above have led organisationsto increase the skills profile of their workforce, while increasedinternational competition, technology and improved workingmethods have taken out many lower skilled jobs. The relatedshift from the low to higher valued added manufacturingsectors, and to services, has also meant growth being focused onjobs requiring higher level skills in all sectors and occupations.
Since 1960 the proportions employed in managerial, and admini-strative jobs has grown more than six-fold, those in professionaland technical occupations have more than doubled, while thenumbers in sales occupations have been broadly static. Clericalemployment has shown 25 per cent growth but there has been aone-third decline in the numerically large group of ‘otheroccupations’, which includes many manual jobs (Figure 2.6).
1 Definitions used have changed over time; the figures presented here
are based on registered unemployed and show the broad trendsover time. The alternative measure is derived from the Labour ForceSurvey and gives slightly higher totals.
The Institute for Employment Studies6
Looking ahead, the econometric forecasts in the UK and mostmature OECD economies point to a continuing growth in thedemand for people with high level skills, and continued declinein opportunities for the unskilled (OECD, 1998). The latest UKeconometric forecasts (IER, 1999) suggest that the numbersemployed in managerial and high level administrative positionswill grow by about eight per cent over the decade to 2006, andthose in professional occupations by nearly 20 per cent. Theparticular occupations within these groups which are expectedto show the most growth are health professional and ‘otherprofessions’ including lawyers, accountants, architects and socialworkers. Growth at associate professional and technician level,where more graduates have been finding employment in recentyears, is also projected to rise by nearly 15 per cent. Personal andprotective services in sectors such as catering, cleaning andsecurity are also expected to show particularly rapid growth. Asmall decline is expected in clerical and secretarial occupations,reversing the long-term growth in their numbers. Majorcontinuing declines are expected in craft and related occupations,and other (largely unskilled manual) occupations (Figure 2.7).
These occupational changes mask another important change inthe need for skills, namely the rise and broadening of the skillsneeded within occupations. The days of the single skilledcraftsmen or narrowly focused technical expert or ‘boffin’ arelong gone. The challenge for organisations is to have a flexibleand responsive workforce which can respond to what are often,as yet, ill-defined challenges and customer needs. Of particularsignificance for virtually all types of jobs, both technical andnon-technical, is the growing importance employers are placingon recruiting people with the right ‘soft’, non-subject basedattributes. Jobs are becoming increasingly demanding, and anorganisation’s competitive strength relies on the overall qualityand responsiveness of its workforce. As noted in last year’s IESAnnual Graduate Review (Pearson et al., 1999a) many employersare now starting to define more rigorously what they are lookingfor in potential graduate recruits. However, articulating, definingand assessing such skills and values is fraught with difficulties.There is a lack of common terminology, with terms such asbehavioural, generic, transferable, soft, non-occupational, andorganisational all being used interchangeably. The breadth andcomplexity of the key skills that are often talked about isillustrated in Figure 2.8.
All this is changing the employment map in terms of the jobsavailable and the skills being sought, with profound consequencesfor those seeking graduates. At the same time, the numbers andprofile of the graduates seeking work has also been transformed,as detailed below.
The IES Annual Graduate Review 2000 7
3. A Graduate Elite No More
3.1 The growth in higher education
In the early 1960s the UK had what was regarded as an elitisthigher education system. Thirty-one universities enrolled undersix per cent of young people as undergraduates, with anotherfour per cent entering teacher training and other forms of highereducation.
The expansion of higher education was, however, under way atthis time with the establishment of the new universities such asSussex and Warwick, and the Robbins Report of 1963underpinned further expansion. The numbers entering highereducation grew steadily from the 1960s until the early 1980s. Thegovernment then put a brake on expansion. In part this was tolimit the growth in public expenditure and in part because therewas expected to be a downturn in the demand for places. Thenumber of 18 year olds was projected to decline by some 35 percent over the period to the mid 1990s (Figure 3.1). This declinegave rise to the great scare about the ‘demographic time bomb’and the shortage of young people both to enter higher educationand the labour market.1 At the time, the fact that the decline inthe number of young people from middle class families (the thendominant entry group to higher education) was very small, wasoverlooked in the official forecasts, and even subsequent forecastsstill suggested a small decline in applications (Pearson et al.,1989). In practice, the numbers of applications continued to growin absolute terms and has always exceeded the supply of places.There have, however, have been subject imbalances; places insome institutions, on some courses, in subjects such asengineering, physics and the humanities have been under-subscribed.
In the mid and late 1980s, government policy shifted back to oneof expansion driven both by concerns that there would beshortages of new graduates (DfEE, 1990) and also the need towiden access, with financial incentives being offered to the
1 In the event, the shortage of young people to enter the labour market
was masked by the recession of the early 1990s.
The Institute for Employment Studies8
universities and then polytechnics1 to expand. Some institutionsdid this with gusto, introducing access and marketing prog-rammes and boosting intakes. Growing numbers of entrantscame from non-traditional sources, including mature applicants,those with vocational and non-traditional entry qualifications,and the ethnic minorities. Others, however, showed much lesschange. Overall there was an exceptionally rapid rate of growthin the decade from the late 1980s, with the number of entrantsand those graduating doubling (Figure 3.2) before plateauingagain (see Section 3.4).
There are now over 1.7 million students in higher education, anear ten-fold increase since the 1960s. While most of theattention is focused on full-time first degree students, they onlyaccounted for half of those studying 1998; another ten per centwere studying part time for first degrees, while the balance wassplit between other undergraduate courses, and postgraduatestudy. In the latter, the numbers of full- and part-time studentswere broadly equal.
3.2 The changing student population
Young people have been and continue to be the main entry groupentering higher education. In the early 1960s older, ‘mature’entrants were a small minority and nearly 90 per cent of under-graduate were aged 22 or under. Despite the fluctuations in thenumbers of 18 years olds in the population (Figure 3.1), thenumber of young people applying to, and entering highereducation has continued to grow since the 1960s, with the activeencouragement of government over most of this period, as notedabove.
The most critical driver in the demand by the young for highereducation has been the staying on rates in schools. Seventy percent of 16 year olds remained in full-time education (includingthe FE sector) in 1998/99, more than double the proportion of the1960s. The proportions of 18 year olds in full-time education alsodoubled over this period. It reached a peak of 40 per cent in1995/6 before showing a small decline in subsequent years,which is thought to be related to the improvement of theeconomy and increased availability of employment (Figure 3.3).
Paralleling this has been the rise in the numbers achieving ‘A’level2 passes, the normal entry requirement for higher education.The numbers with one or more passes increased from just over50,000 in 1962 to over 300,000 in 1998, with a higher proportion,82 per cent (over 250,000) having two or more passes (Figure 3.4).
1 Polytechnics were redesignated as universities in 1992 and the higher
education system unified with the abolition of the ‘binary line’.2 or Scottish Highers, the equivalent qualification for entry into HE in
Scotland.
The IES Annual Graduate Review 2000 9
As a result of these developments, the proportion of youngpeople participating1 in higher education has risen from underten per cent in the early 1960s to over 35 per cent in the late1990s (Figure 3.5).
While the majority (70 per cent) of entrants to first degreecourses in 1998 were still accepted on the basis of traditional,non-vocational qualifications (ie ‘A’ levels or Scottish Highers)the proportions with vocational and other qualifications hasrisen from under three per cent at the time of Robbins to 30 percent in the late 1990s,2 with the biggest growth coming in the1990s (Figure 3.6). There are strong subject differences, withmedicine and dentistry taking few entrants with non-traditionalqualifications, while in languages and physical sciences theyaccounted for under ten per cent of entrants. There are muchhigher proportions in the vocational areas such as creative arts(over 40 per cent) where many degree courses require someprevious vocational study or portfolio preparation, and inbusiness studies, creative arts, education and mathematicalsciences (Pearson et al., 1999a).
As higher education has shifted from an elite to a mass system,so has the composition of the student body changed. While thenumber of young entrants grew, so did the number of older, or‘mature’ entrants. These accounted for one in three entrants in1998, up from one in ten in the 1960s. Older students also tend tostudy different subjects, with relatively few taking physicalscience and engineering degrees, and rather more in socialsciences, creative arts and education (Pearson et al., 1999a).
Women accounted for only one in four undergraduates in 1962but are now the majority (54 per cent) of entrants to first degreecourses. This growth in participation took place steadilythroughout the period and passed the 50 cent point in the early1990s. Their subject profile, however, continues to be markedlydifferent from that of men. In particular, women are most likelyto be found on social science, medicine and nursing, education,languages and biological sciences courses. Men continue to bethe majority in the physical sciences, engineering and technology,and mathematical sciences — which includes computing (Pearsonet al., 1999a).
Despite the attempts to widen access, the social class compositionof higher education has not changed as fast as many had hoped.Entry is still dominated by those from families in social classes Iand II (professional and intermediate): 60 per cent of the intakes
1 This has been calculated in different ways over the years. The trends,
not the detail, is the important point to note.2 Drawing a clear trend is complicated by the merging of the university
and polytechnic sectors in 1992, as no data are available for the non-university sector prior to 1992.
The Institute for Employment Studies10
in 1998. The proportion coming from families in social classes IVand V (defined as being in partly and unskilled occupations) hasonly grown from five to ten per cent (Figure 3.7).
Attempts to widen participation have also focused on the ethnicminorities and here numbers have increased significantly duringthe 1990s when overall entry was also growing. They accountedfor over 14 per cent of accepted applicants in 1998, up from tenper cent a decade earlier (Figure 3.8). This representation isslightly higher than the population of this age group in the widerpopulation. There are, however, large differences between thedifferent ethnic minority groups. The Asian Indian ethnic grouphas the highest representation in higher education, while there isgeneral under-representation of Moslem women and youngBlack Caribbean men. There are also significant differencesbetween the subjects they are studying, with particularly highproportions in medicine, mathematical sciences and businessstudies, and much lower than average proportions in thehumanities, languages, arts and education (Pearson et al., 1999a).
This diversity accompanying the shift from an elite to a masshigher education system has given educationalists manychallenges as they seek to relate to students with a wide range ofbackgrounds and expectations. The introduction of fees is alsoencouraging students to act as paying consumers, many ofwhom are now demanding higher levels of ‘service’.
3.3 How students choose their degree course
Motivations towards higher education, and the different types ofinstitutions and courses vary greatly between young and matureapplicants, and between ethnic groups. Influencing factorsinclude the qualifications held, routes into higher education,social class, family income and family experience of highereducation (Connor et al., 1999). Their main priority, however, isto choose the right subject, with gender the factor most likely toaffect subject choice, as noted above. Next in importance arequality (particularly in terms of teaching, and academic supportand facilities), overall image, and employment prospects forgraduates. Priorities do, however, vary between different groupsof students and while good employment prospects arising fromtheir course are important for most applicants, this is especiallythe case for women, black and Asian applicants, and Scottishapplicants (Figure 3.9).
Over the last decade the maintenance grant was steadily reducedand has now been abolished; means tested fees were introducedin 1998.1 Cost is therefore a significant factor in the choice process,particularly for non-traditional student groups, encouraging
1 Separate arrangements now apply in Scotland, see Section 3.5.
The IES Annual Graduate Review 2000 11
increasing numbers to study close to home and/or on a coursewhere there are good employment prospects. While most feelwell informed on most aspects of higher education, the majorityestimate the costs of study to be in the range £2,000-5,000,excluding fees (Connor et al., 1999). This is below the £5,900which is the latest estimate of living costs (Cubie, 1999). Mostexpect to have to work while they are students; their preferenceis to work during the vacation rather than in term time, whichgives a boost to moves to widen work experience for under-graduates. A high proportion of undergraduates, more than onein three, currently work during their course, but only a minoritysay that the work is relevant to their chosen career. Nevertheless,work experience can enhance more general employability skills,especially if students use it as a learning experience (Harvey,1998) and not just as a means to supplement their income.Indeed, recent US research has shown that small levels of termtime working can also be beneficial to a student’s results(Pearson et al., 1999a).
Most applicants use the formal sources of information to guidetheir choices, such as the UCAS Handbook, prospectuses anduniversity visits. They also consult a wide range of individuals,from family and friends through to professional careers advisers.While they are largely satisfied with the information and adviceavailable at the time, a range of improvements are needed toensure students make well informed choices about courses,including the relevance of courses to subsequent employmentand careers (Figure 3.10) (Connor et al., 1999).
3.4 Graduate numbers
The numbers graduating from higher education each year havegrown from under 50,000 in the early 1960s to nearly 400,000 atthe end of the 1990s. Of these, over 250,000 had first degrees,65,000 had completed postgraduate degrees and 50,000 qualifiedfrom sub-degree courses such as HNDs (Figure 3.2). These levelsof graduation match those of our international competitors, withUK higher education being seen as more responsive to the needsof the labour market than is the case in many other Europeancountries (Pearson et al., 2000).
Between the 1960s and 1998, the distribution of first degreesbetween the subjects showed a relative decline in the case ofhumanities, down from 38 per cent to 22 per cent of the total. Italso showed a small decline in the case of science andtechnology, down from 40 to 35 per cent, while the proportionqualifying in the social sciences grew from 18 to 30 per cent. In1998 there were over 29,000 first degree graduates in businessand financial studies, another 30,000 in social studies and 19,000in creative arts. In contrast, there were 22,000 in engineering,
The Institute for Employment Studies12
13,000 in physical sciences and 14,000 in maths and computing(Figure 3.11).
3.5 Looking ahead
The government put the brake on expansion again in the mid-1990s but the number of applications continued to exceed theoverall number of places. However, subject imbalances exist andsome courses remain undersubscribed. There was a surge inapplications in 1998 to beat the introduction of fees, with somestudents putting off their gap year. Since then the number ofyoung applicants has grown slightly, but the number ofapplications from mature students has fallen back (UCAS, 1999).Projections carried out in 1996 over the period to 2005 suggestedthere would still be considerable potential and unmet demandfor higher education through the early years of the new century.The number of entrants was projected to grow by ten per cent ormore by 2005, if current trends at the time were to prevail, andsufficient places were made available (Connor et al., 1996a). Inthe event, the introduction of fees and the final abolition ofmaintenance grants in 1998 appears to have restricted thatgrowth in the short term, but the longer term consequences arenot yet clear.
The government has now said that future expansion shouldfocus at sub-degree level with two year ‘foundation degrees’.Particular emphasis will be on vocational courses and greaterprovision of part-time and modular options, and the possibilityfor these graduates to progress to complete a first degree. Muchof the increased provision is likely to take place in FE colleges. Itis not, however, clear whether there will be employer demandfor those with such foundation degrees, and whether largeproportions will choose to stay on to complete first degrees.
In Scotland, following the publication of the Cubie report (Cubie,1999), the payment of fees by Scottish students is to be abolished,with Scottish students having to make a partial repayment whenthey earn over £10,000 per annum. English and Welsh studentsstill have to pay fees wherever they study. In England thegovernment has, however, announced extra funding for studentsto encourage wider access, and fee waivers for part-timestudents. The issue of universities charging supplementary feesto boost their incomes is also coming back on the agenda. This isall likely to put great pressure on the government to amend theposition on fees. These changes, in turn, are likely to furtheraffect student demand for places.
The UK has now moved from an 1960s elite, to a mass highereducation system at the start of this century. With great diversityamong the education on offer and the student body, this ishaving profound implications for recruiters and graduates alikeas they enter the employment market.
The IES Annual Graduate Review 2000 13
4. Graduate Recruitment and Employment
4.1 Graduate recruitment into mainstream employment
In 1965 nearly 13,000 new first degree graduates (40 per cent)entered employment (Figure 4.1). Of these nearly 4,000 went intothe public services, including medicine, education and the civilservice, and 8,000 into industry and commerce. Many of thelatter were recruited into management training schemes wherethey had structured career development and career paths. By theearly 1970s there were growing concerns that there would not beenough ‘suitable’ jobs for the increased numbers graduating(DfEE, 1974). In the event, an analysis of the market at the timeshowed that graduates were being recruited through threestreams, each of which had different characteristics and growthprospects.
! Management trainees were recruited by large organisationsin relatively small numbers to enter formal training anddevelopment schemes. The recruiters targeted key campusesthrough the ‘milk round’, and the personal qualities of thegraduates were more important than their discipline. Thenumber being recruited in this way were not expected togrow significantly.
! Others entered into professional and functional roles, eg inengineering or accountancy, and where the increased skillneeds of the professions, and specialists’ functions andoccupational changes, were expected to underpin growth inthe demand for graduates.
! Others were recruited as direct entrants into a wide range of(normally larger) organisations. They were often in directcompetition with non-graduates. This, for example, was thestarting point for graduate recruitment into the retail sector.There was great potential for expanding graduate recruitmentin this way, but numbers were expected to fluctuate stronglyaccording to economic circumstances.
Overall, the number of opportunities was expected to expand,the extent being subject to the vagaries of the economic cycle(Pearson, 1976).
Since then, graduate recruitment has grown significantly. Majorrecruiters were seeking an estimated 20,000 or more graduates in
The Institute for Employment Studies14
the mid 1980s (Parsons, 1986) in sectors such as chemicals,electronics and the utilities, along with the public sector andaccountancy which was then growing its intakes fast to becomewhat is now a major recruiters of graduates. The legal professionhas followed, seeking significant numbers, as have the policeand nursing. The IT sector and retailing1 grew their graduateintakes dramatically in the 1980s and 1990s. Many more smallorganisations are also now actively seeking graduates throughstructured recruitment schemes, as evidenced by the growth inthe coverage and membership of the Association of GraduateRecruiters.
While the overall numbers being recruited by the major graduaterecruiters through graduate recruitment schemes have fluctuatedwith the economic cycle, little growth has been seen in the decadesince the late 1980s economic boom (Pearson et al., 1999a). Intakesthen were estimated to be around 30,000, with other significantrecruitment being into teaching and medicine, between them alsotaking more than 30,000 graduates per annum. Since then thenumbers entering employment have continued to grow as thenumbers graduating more than doubled.
Vacancies for graduates among the major recruiters unexpectedlyfell in 1999. The reasons for this are not clear but it may be areflection of the multi-speed economy. The outlook in somegraduate intensive sectors was looking unclear as a result of thespate of mergers, alliances and associated business uncertainty,concerns about recession at the start of the year, the cutbacks inretailing, a pause from growth in the IT sector, and continuedretrenchment in manufacturing. Forecasts for 2000 suggest arecovery, with vacancies growing by about 20 per cent or more,the growth being concentrated in the service sector (Jagger et al.,2000a).
While the overall numbers graduating have increased (Figure3.2), the proportion entering employment within six months ofgraduation also rose, from 40 per cent in the 1960s to over 60 percent in the 1970s. This has since fluctuated between highs ofaround 60 per cent at the peaks of the economic cycle and lowsof 50 per cent in the recessionary periods of the early 1980s andthe early 1990s (Figure 4.2).
Notwithstanding the economic cycle, graduates have been takinglonger to settle into ‘permanent’ or ‘stable’ career patterns, andmore have been entering employment where their graduatequalification has not been a necessary entry requirement. Partlythis has been out of choice, and partly because they have found itharder to find suitable jobs and careers. During the 1990s, a periodof particularly rapid expansion in the numbers graduatingcoincided with an improvement in the economy. The overall
1 although their intakes have now fallen back for economic reasons,
and some others have shifted away from graduate to ‘A’ level entry.
The IES Annual Graduate Review 2000 15
numbers moving into employment rose from just over 100,000 toover 160,000, although a rising proportion entered fixed-term ortemporary employment (Figure 4.3).
There has also been a shift in the occupational profile of thoseentering employment during the 1990s, with a noticeable declinein the proportions going into professional occupations, and anincrease in those entering associate professional and technicaloccupations and other, generally lesser skilled, occupations. Ofthose going into employment in 1998, half went into what havetraditionally been considered graduate jobs, ie as managers,administrators and professionals. A further 17 per cent went intoassociated professional and technical occupations, not generallyconsidered to be of graduate level a decade ago. One-third wentinto lower level jobs (Figure 4.4).
There are also marked differences between graduates fromdifferent disciplines. Those from the humanities, languages,biological sciences and the social sciences have been the leastlikely to enter ‘graduate jobs,’ ie as managers and administrators,professionals, and nowadays into associate professional andtechnical occupations. Those in medicine, education, computerscience and engineering have been the most likely to enter‘graduate jobs’. Among those entering employment in 1998,those in business studies, languages, humanities and the socialsciences were more likely to go into management roles, whilethose in engineering and the sciences were more likely to go intoprofessional roles (Figure 4.5).
Thus, overall, while increasing numbers have been enteringemployment, more have been going into temporary jobs and‘non-graduate’ jobs.
4.2 Expansion has not solved employers’ recruitment difficulties
Despite the growth in the number of job seekers, recruiters havenever seen a period when there have been enough ‘good’ or‘relevant’ graduates (see eg Swan, 1968). Time series data onemployers’ difficulties recruiting graduates only start in the late1970s. These show that the incidence of reported recruitmentdifficulties among the major recruiters has been stronglyinfluenced by the economic cycle and were not mitigated by theboom in output in the 1990s (Figure 4.6). While these recruiterswere seeking similar numbers in the late 1980s and late 1990s,the doubling of the number graduating over this period onlypartially eased the incidence of recruitment difficulties by thelate 1990s. However, the severity for individual recruiters wasnot as bad as in the late 1990s. This reinforces the morequalitative evidence that recruitment problems nowadays relatemore to issues of quality rather than quantity, with a particularconcern focusing on graduates’ lack of good personal attributesrather than their technical skills (see Section 2.2).
The Institute for Employment Studies16
Scientists and technologists have been regarded as one of the keyresources needed to underpin the UK’s science and technologybase and maintain and enhance the competitiveness of keysectors such as pharmaceuticals and electronics. Attention hasbeen paid to the (lack of) availability of suitably trainedgraduates since the mid 19th century, and numerous enquiriesand reports since Robbins have expressed concern that therewere so few good science and technology graduates going intoindustry or teaching. The evidence from the employers ofscientists in the second half of the 1990s does not suggest thatthere is a widespread problem in terms of an inadequatenumerical supply of science skills, but there are qualitativeissues. There are, however, problems for some employers, eghigher education, where employment packages may not becompetitive, which in the sciences includes the use of up to dateequipment. Problems also exist in some areas of teaching, and inthe case of some very specialist skills, such as electronics. Themost frequently quoted problems in the UK relate to thepersonal qualities of potential recruits and the need for recruitsto have better ‘personal’ skills and competencies in areas such asbusiness awareness and commercial skills, project management,team working and communication, alongside their technicalcompetence (Pearson et al., 1999b; Mason, 1999). This is a concernraised about non-science, graduate recruits (Section 2.2). Thereis, however, evidence of an over-supply of some sciencegraduates, especially biologists, who have difficulty moving intojobs and careers where they can use their scientific skills. Theyhave longer-term problems of under-employment and lowerrelative earnings, and many move into technician level roles, orareas unrelated to science. This is not a recent trend and isexpected to increase in future years. Similar patterns are also tobe found in other European countries and, to some extent, theUnited States (Pearson et al., 2000).
4.3 Starting salaries
Despite the resurgence of recruitment difficulties with theeconomic upturns, the major recruiters1 have not responded bymarkedly raising starting salaries for graduates. While theheadline starting salaries for some graduates seem to rise everhigher, with a few recruiters paying in excess of £25,000 for newgraduates in 1999, changes to the median starting salary (£17,500in 1999) largely tracks the steady rise in median weekly earnings.In the early and mid 1990s the rate of growth of graduates’starting salaries lagged the growth in median weekly earningsbut has since started catching up again (Figure 4.7). A similarpattern prevailed in the 1980s (Pearson et al., 1999a).
1 These figures come from the membership of the Association of
Graduate Recruiters (AGR).
The IES Annual Graduate Review 2000 17
Median figures can, of course, hide wide differences. While themedian starting salary in 1999 was £17,500 among the majorrecruiters, the lowest ten per cent were paying nearer £15,000.Teachers were starting on £15,537 (and £17,778 or more in centralLondon). Figures for a broader group of jobs advertised forgraduates shows salaries on average over £1,500 lower (CSU,1999). Many graduates move into jobs paying far less (nearer£10-12,000 per annum), including some going into accountancyand the law training outside London, and especially wheregraduates are entering lower level jobs and competing with non-graduates.
4.4 Graduate salary progression and retention
Given the diversity of jobs graduates enter, it is not possible totalk about the career progression of a ‘typical’ graduate. It is,however, possible to focus on salary progression and retentionamong the major recruiters.
Evidence on salary progression among the major recruitersshows that the median salary in mid 1999 for graduates recruitedin 1998 was £19,950 (an uplift of 14 per cent on that paid to a1999 recruit) and for those recruited three years earlier (ie in1996) it was £24,000 (an uplift of 37 per cent). There was,however, a wide range reported, with an upper decile of £25,000and lower decile of £16,500 for those with one year’s service, andan upper decile of £31,000 and a lower decile of £17,750 withthree year’s service (Jagger et al., 2000a). Another comparison ofthe 1998 salaries of those who graduated three and five yearsearlier (in 1995 and 1993 respectively) also shows very widesalary ranges, with an average salary uplift of 41 per cent forthose recruited three years earlier (comparing as above) and 69per cent for those recruited five years earlier (IDS, 1999) (Figure4.8). In both cases salary progression was faster in the servicesector. These figures for progression were similar to thosereported a year earlier.
Alongside progression, another important measure for recruitersis retention. This depends on a number of factors, including theinitial selection by both recruiter and recruit, the variety andchallenge of the work undertaken, subsequent professionaldevelopment, relevant HR policies and good line management,including access to individual career planning and mentoringschemes, and long-term career prospects. Salary increases canalso be important, but they are not normally the dominantreason for staff leaving. Along with retention bonuses, goldenhellos or golden handcuffs, these are only a significant issue orbenefit in a small number of cases (Bevan et al., 1997; Sturgess etal., 1999). It is also important to recognise that mistakes will bemade both by the recruiters and the graduates themselves, andthat some losses are inevitable, while very high retention caninhibit the career progression of more recent recruits.
The Institute for Employment Studies18
The evidence from the major graduate recruiters is that, on thewhole, despite the increased competition for the ‘best’, relativelygood retention rates are being maintained, though again theaverage figures conceal considerable variation. In late 1999, halfof the recruiters who had figures available had held on to at least95 per cent of their 1998 intake (ie for their first year) and 72 percent of their 1996 intake1 (ie for their first three years). The bestten per cent of recruiters had held on to 90 per cent or more ofgraduates recruited three years earlier (Jagger et al., 2000a).These figures are remarkably similar to those being experiencedin the late 1970s, a period of economic growth, the early 1980s aperiod of recession, and the early 1990s, a period of recession(Figure 4.9) (Parsons, 1986). These ‘averages’ do, however, hide awide variation between organisations, with some losing halftheir intakes within two years, while other have only lost ten percent over five years.
4.5 Many graduates have other destinations
While the majority of graduates go directly into ‘mainstream’jobs within a few months of graduating, not all do so. A smallminority go into self-employment, assisted by a number ofschemes which are encouraging and helping graduates to starttheir own businesses and enter self-employment. In part this is aresponse to the lack of growth of ‘traditional’ job vacancies, butit also reflects the national emphasis to build a more entre-preneurial society. The overall proportion of new graduatesrecorded as going into self-employment has remained low, atunder two per cent, although this a particularly importantdestination for those studying on art and design courses. Heretheir careers resemble a patchwork of short-term contracts andprojects, self-employment and freelance work, as well as workoutside their profession and with low monetary rewards. There isa particular need for such graduates to develop better negotiatingand networking skills, as well as the broader personal and socialskills (La Valle et al., 2000). The wish to be self-employed or starttheir own business is not restricted to such groups, but was alsoto be found in others including conservationists (Jagger et al.,2000b) as well as among those graduating from mainstreamsubjects such as science and technology, where the attractionwas one of independence and freedom rather than high earnings(Tackey et al., 1999).
Not all graduates go into employment; some go overseas, otherswithdraw from the labour market, while a growing minority aretaking their ‘gap year’ after they graduate, rather than before theyenter higher education. The major alternative to employment istaken by those who stay on for further study or research. This
1 These figures may be affected by a high proportion of accountancyfirms where trainees stay for three years to qualify and then leave.The drop-out rates while studying are not available.
The IES Annual Graduate Review 2000 19
was as high as 40 per cent in the mid 1960s, but the proportionsdoing so has been in decline since the late 1970s, falling to under20 per cent by the 1990s. While men were markedly more likelythan women to stay on for further study in the 1970s, the gendergap had largely closed by the late 1990s. Here again theeconomic cycle has had an effect, with the recessionary periodsboosting the proportions staying on for further study, and beinga greater influence on men than on women (Figure 4.10).Another major influence has been the availability of grants tofinance postgraduate study, and these have not grown in linewith the growing numbers graduating.
The final major balancing item on the destinations is the initialunemployment rate1 which, not surprisingly, shows markedvariations with the economic cycle, reaching highs of nearly 20per cent in 1982 and 1992. The lows of six per cent in the late1970s, seven per cent in 1989 and under eight per cent in 1999 allreflect high points in the economic cycle (Figure 4.11). Therehave always been marked variations between subjects, withmedicine and education always having the highest rates ofemployment and lowest unemployment, and the biologicalsciences, languages and humanities having some of the highestinitial unemployment rates (Figure 4.12). The balance betweenthe subjects is similar to that found in terms of those finding‘graduate jobs’ (Figure 4.5).
The overall balance of destinations (Figure 4.13) thus showsmarked changes since the 1960s with far fewer staying on forfurther study, and a much higher proportion going intoemployment, although the ‘quality’ of the jobs now entered isvery broad and graduates are taking longer to find appropriateemployment.
4.6 Graduates are taking longer to settle into establishedemployment
Some graduates are postponing their move into employment bystaying on for further study or research, or taking a gap year.One in four graduates said they were taking such a break in 1998(Guardian/NOP, 1998). In other cases, they are taking ontemporary, relatively low skilled work while they considercareer options, and or to pay off the debts incurred while theywere studying. Others wanting to enter sectors such as the mediaand advertising often have to take low level jobs, sometimeswithout pay, to gain some work experience which may then givethem an opportunity get a ‘foot on the ladder’ or as a steppingstone into a specific career. Many others, however, are finding it
1 There are a number of ways in which this can be measured, the rate
chosen here is that based on the international ILO definition. TheFirst Destination Statistics (HESA) often provide an alternativemeasure.
The Institute for Employment Studies20
hard to move quickly into satisfactory employment and are takingan increasingly long time period to settle into established jobsand career paths. Many are moving into associate professionaland technician roles (Figure 4.4) which is expected to be agrowth destination in the future (BSL, 1998).
With the rapid growth in the numbers graduating, substantialnumbers of graduates are entering jobs that do not requiredegree level qualifications and are doing similar work to non-graduates (Section 4.1). The true extent is not, however, easy tomeasure and is complicated by the changing nature of jobs andwork organisation. Some jobs which have traditionally been‘non-graduate’ jobs, eg in technician roles, now require higherskill levels. Recruiters are seeking graduates to fill them, as inthe case of laboratory work in the pharmaceutical industry,while professions such as accountancy, the law, and nursingmoved to a graduate entry a number of years ago. In other cases,employers have been increasing the education requirements ofjobs simply because more graduates are available, as was thecase among the retailers in the early 1980s, while others recruitgraduates because they apply. In some of these cases thegraduates are adding value and ‘growing’ the job. For example,almost one in five employers have reported directly substitutinggraduates for non-graduates, although only one in four weredoing this as a deliberate policy as opposed to a by-product ofincreased graduate supply. Just over half of the graduatessurveyed in these companies said that some use was being madeof their graduate skills, and in only one-third was good usebeing made of them (Nove et al., 1997). These developments havebeen identified in a wide range of recent research (see eg Connoret al., 1996b, 1997; Elias et al., 1999).
While the ‘quality’ of these initial jobs was not always whatgraduates wanted, most graduates saw some career progressionin terms of the quality of their jobs once they had been inemployment for a few years. Graduates who had been in thelabour market for three or more years were more likely to saytheir skills were being used as they moved into higher level, ormore demanding roles, or found a graduate-level job. Forexample, four and six year years after graduation, a much higherproportion of graduates were in ‘graduate jobs’, defined asprofessional and managerial occupations, than at the two tothree year stage. There was also a noticeable reduction in theproportion who felt under-employed (Connor et al., 1997). Theseresults have been borne out in a recent national study, with 65per cent of all the 1995 graduates surveyed believing they werein jobs requiring their degrees after three years in employment.This study also showed that high initial rates of unemploymentfall quickly over time. As with other elements of graduate supplyand the labour market, there have been marked differences in theexperiences of different types of graduates with, for example,those from the humanities, arts and biological sciences, oldergraduates and women showing least satisfactory progression
The IES Annual Graduate Review 2000 21
after graduation (Elias et al., 1999). The improvements do,however, have to be set in the context of a rapidly improvinglabour market from the mid 1990s.
Being in an established or mainstream job or career does not,however, mean that graduates are settled. While retention ratesare relatively good among the major recruiters (Section 4.3,Figure 4.9), one in five graduates were looking for a different jobin 1999; interestingly this is a lower proportion than in the mid1990s when unemployment was higher and there was lessapparent alternative employment (Figure 4.14).
The Institute for Employment Studies22
5. In Conclusion — an Ever More Diverse andFragmented Labour Market
5.1 Introduction
At the start of the century, the labour market for graduates canbe characterised by two words: ‘diversity’ and ‘fragmentation’.Despite the strength of the economy, recruitment difficulties forgraduates among the major recruiters eased in 1999, as vacancylevels fell. Vacancies, however, are expected to recover in 2000(Section 4.1, Jagger et al., 2000a). The need for graduate and highlevel skills has not gone away. Competition for the best graduatesremains, and will remain intense, despite the large numbersgraduating. Many graduates have to set somewhat lowerhorizons in terms of the jobs and careers they seek and can enter.
This Chapter provides a model of the clusters of jobs employersare seeking to fill, and highlights the diverse body of graduatesseeking to fill them. It then draws out some key conclusions forrecruiters and graduates as they seek a better match in anincreasingly competitive and fragmented labour market.
5.2 A diverse range of jobs to be filled
The jobs graduate recruiters are seeking to fill have changedsignificantly in recent years, reflecting major industrial, occupa-tional and business changes, and the speed of change isaccelerating. While there remains a relatively small cohort of‘high flier’ graduate jobs, graduates are being sought for and areentering an increasingly diverse range of jobs. Many largeorganisations are recruiting into more than one stream, offeringa wide range of salaries and career paths. They are recruitinggraduates throughout the year, often alongside non-graduates. Inmany cases, the central graduate recruiters are not involved in,and are often unaware of, the numbers entering in the latter way.
A model of graduate recruitment identifies entry to:
! fast track management training schemes which take limitednumbers of graduates in large organisations. Recruitment iscentrally managed and targeted on those with goodintellectual and personal skills, often at selective universities.
The IES Annual Graduate Review 2000 23
Vacancy levels are not expected to grow markedly. Thesupply of suitable candidates appears limited, andcompetition for the best is intense.
! professional and functional careers, eg accountancy,engineering, IT and teaching. Recruitment is functionallybased and initial development is often regulated by anexternal professional body. Vacancy levels are expected tocontinue to grow. In most, but not all cases, eg IT, the degreesubject and course is important but personal qualities aregrowing in importance. The supply of suitable candidatesappears limited for some functions. Recruitment is broader-based than above, but in technical areas may be focused oncertain universities and courses.
! ‘graduate level’ administrative jobs, providing initial trainingbut more limited initial career prospects. Personal qualitiesare more important than technical qualifications. There areincreasing numbers of these jobs, although vacancy levelsfluctuate with the economic cycle. Vacancies may appearthroughout the year and in many parts of an organisation,and in smaller firms. Graduates may be recruited alongsidenon-graduates, internal and experienced candidates.
! self-employment, where the rewards may be uncertain butlifestyle is more important; a traditional area for arts anddesign students.
! lower level jobs where graduates can ‘add value’, upgradingthe content and quality of the job. Here they may be incompetition, and work alongside those with lesserqualifications. Vacancies can appear at many points and inall types of organisations. Vacancies will appear throughoutthe year, within the broader recruitment market, and willfluctuate with the economic cycle.
! the wider labour market in competition with, and workingalongside, those with lesser qualifications where there maybe little advantage in being a graduate.
5.3 With a diverse population graduating
The forty years since Robbins have seen major changes in thesupply of graduates. The numbers graduating have grown ten-fold and are now far more diverse in terms of gender, age,ethnicity, qualifications and aspirations. Looking ahead, thenumbers graduating are expected to rise very slightly. Thegovernment is seeking a significant expansion in the numbersgraduating with two year ‘foundation’ degrees, with manycourses being taken in FE colleges.
Diversity characterises the graduate population:
! one in three of the young now go on to higher education
! employability is an important factor in their choice of course
The Institute for Employment Studies24
! two-thirds are still from the top two social classes
! one in three enter with non ‘A’ level qualifications
! they study at over 250 universities and colleges
! women are now a majority of those graduating
! one in three are over 25 when they graduate
! one in seven come from ethnic minorities
! many now study near home and may be less mobile
! growing numbers will graduate with sub-degree qualifications
! graduates have diverse aspirations and expectations.
5.4 Improving graduate recruitment
The supply has grown far faster than the number of traditional‘graduate jobs’. On the face of it, this would suggest that graduaterecruitment should have become easier for recruiters. However,the history of the last twenty years is that the major recruitershave not been able to get all the ‘good’ graduates they havesought. In part this may reflect over-reliance on only recruitingfrom certain universities, or inadequately defined selectioncriteria. It is also a reflection of the shift in the types of skillssought; in particular, the growing emphasis on the need forrecruits with the right personal qualities. This has become arequirement in vocational and specialist areas such as engineeringand accountancy, as well as more general management roles.
Employers need to recognise that competition for the best willremain intense, and that they do not always need, nor can theydevelop and retain, only the ‘best’ graduates in all the roles theyneed to fill. They also need to understand the changing supplyside and the nature of the competition for the types of graduatesthey seek.
Recruiters need to consider carefully the diverse range of jobsand careers they need to fill, the job specifications and thedifferent competencies they need for each. They will need tolearn how to identify the required attributes among applicants,when qualifications may provide little guidance as to theircapability. Any overemphasis on targeting particular types ofgraduates or universities will unnecessarily restrict the pool oftalent seen, and maximise the competition from other recruiters.The provision of work experience can help improve the supplyof relevant graduates, and act as a filter to help simplify therecruitment and selection process.
Appropriate and coherent recruitment, development andretention strategies can then be developed, drawing in thespecialists and line managers who will be involved.
The IES Annual Graduate Review 2000 25
Employers also have to recognise the diverse needs of the staffthey recruit, and tailor their approach to staff development andmotivation appropriately, if they are to meet and manage theaspirations of their recruits and build their workforce for thefuture. While the average levels of retention look reasonable,many employers need to monitor and understand their own levelsof retention and progression to ensure that their long-term needsare being met, and to identify where problems may be arising.
Such strategies require careful planning, commitment and co-ordination. Today’s internal labour markets and organisationalstructures are increasingly fragmented and fast changing; centralmanagement and records are often a thing of the past.
5.5 Helping graduates as job seekers
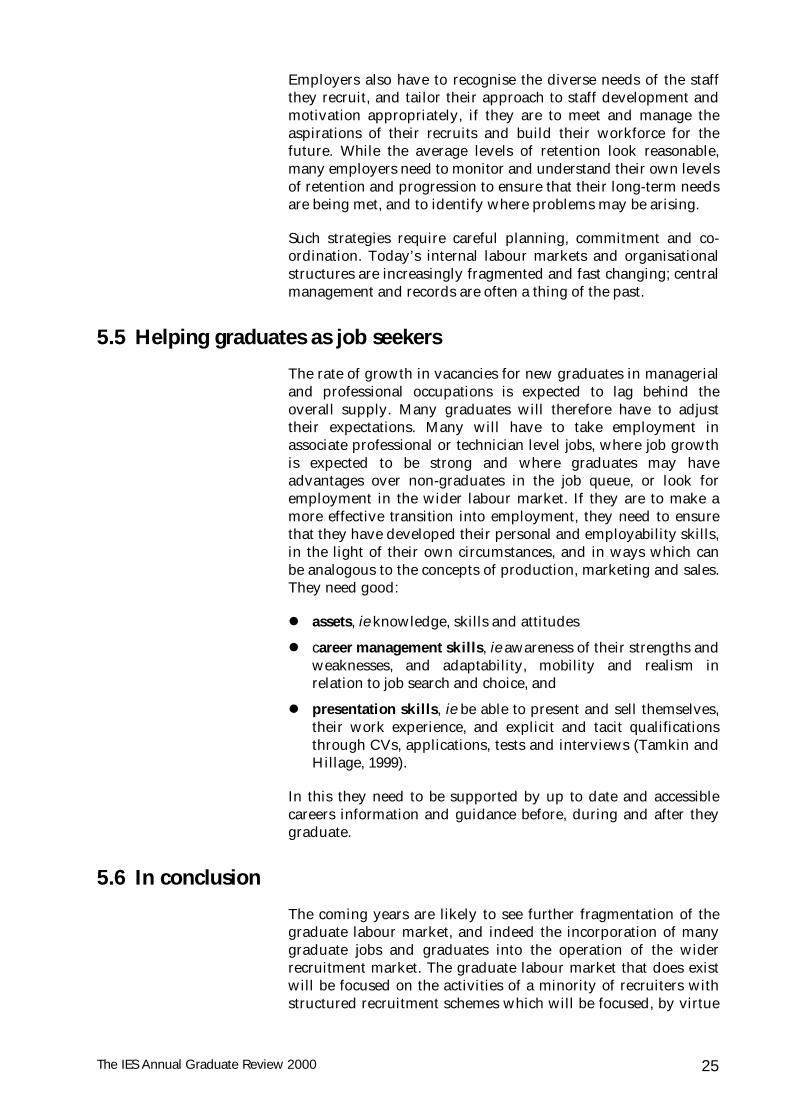
The rate of growth in vacancies for new graduates in managerialand professional occupations is expected to lag behind theoverall supply. Many graduates will therefore have to adjusttheir expectations. Many will have to take employment inassociate professional or technician level jobs, where job growthis expected to be strong and where graduates may haveadvantages over non-graduates in the job queue, or look foremployment in the wider labour market. If they are to make amore effective transition into employment, they need to ensurethat they have developed their personal and employability skills,in the light of their own circumstances, and in ways which canbe analogous to the concepts of production, marketing and sales.They need good:
! assets, ie knowledge, skills and attitudes
! career management skills, ie awareness of their strengths andweaknesses, and adaptability, mobility and realism inrelation to job search and choice, and
! presentation skills, ie be able to present and sell themselves,their work experience, and explicit and tacit qualificationsthrough CVs, applications, tests and interviews (Tamkin andHillage, 1999).
In this they need to be supported by up to date and accessiblecareers information and guidance before, during and after theygraduate.
5.6 In conclusion
The coming years are likely to see further fragmentation of thegraduate labour market, and indeed the incorporation of manygraduate jobs and graduates into the operation of the widerrecruitment market. The graduate labour market that does existwill be focused on the activities of a minority of recruiters withstructured recruitment schemes which will be focused, by virtue
The Institute for Employment Studies26
of numbers and the qualities sought, on a small minority ofgraduates.
To talk of a ‘typical’ graduate/graduate job/graduate recruitmentscheme/graduate starting salary or graduate career would be tomislead. For most recruiters and most graduates, the transitionfrom higher education into employment will take place withinthe context of broader labour market developments. For theindividual, the possession of a degree or equivalent qualificationis not a sufficient indicator of competence for particular jobs andcareers. While it will be largely beneficial to job seekers, it willnot be a passport to a good job.
The IES Annual Graduate Review 2000 27
FIGURES
The Institute for Employment Studies28
Figure 2.1: Employees by industrial sector in Great Britain, 1960 to 1999
���������������������������� Non-white Total numbers
PCAS and UCCA data UCAS data
Source: PCAS, UCCA and UCAS annual reports and statistical supplements (various years and tables)
The Institute for Employment Studies36
Figure 3.9: The most important factors of importance for deciding where to apply
Student group Cluster of most important factors offered (in descending order)
Young (under 21 years) The right subject, overall image, social life, teaching reputation, employmentprospects, entry qualifications
Older mature (25 yrs+) The right subject, attitude to mature students, teaching reputation, academicsupport facilities, distance from home
Vocationally qualified/access The right subject, teaching reputation, academic support facilities,employment prospects
Black The right subject, teaching reputation, academic support facilities,employment prospects, overall image, attitude to ethnic minorities, location,entry qualifications
Asian The right subject, employment prospects, teaching reputation, entryrequirements, academic support facilities, distance from home
Scottish domiciled The right subject, employment prospects, teaching reputation, image, entryrequirements, academic support facilities, location
Source: Connor et al., 1999
Figure 3.10: Improving student choice, by improving information on:
Subject choice; eg entry requirements; acceptability for professional qualifications; relevance to postgraduatestudy, employment and life after graduation
Course structure; eg formal teaching, self study, work experience etc.
Course quality; eg teaching, staff, library etc.
The university/college and its environment; eg location and nearness to home, size, culture, course mix,student mix, type of campus, accommodation available, sport and social facilities, student support,security etc.
Potential contribution to fees, extra course costs, accommodation and living expenses in different locations
Potential sources of income, including loans, parents, the availability of student employment, and help withbudgeting
The longer-term experiences of those graduating from different courses, and longer-term employmentprospects for different types of graduates
Source: IES
The IES Annual Graduate Review 2000 37
Figure 3.11: First degree output numbers by subject, 1997/98
Figure 4.13: First destinations of first degree graduates, 1998
Further study/research
37,33819.1%
UKemployment
117,39359.9%
Overseasemployment
3,7511.9%
Known selfemployment
3,0191.5%
Seekingemployment,study, training
12,7466.5%
Not available
8,5594.4%
Further study/research
37,33819.1%
Total with knowndestinations
195,910100%
Unemployed*
11,1935.7%
Other seeking
1,5530.8%
Managers &administrators
19,66610.0%
Professionaloccupations
35,01517.9%
Associatedprofessional &
technical24,56812.5%
Other types ofoccupations
38,14419.5%
* This is not the same as the ILO definition of unemployment used in Figures 4.11 and 4.12
Source: HESA (1999a) Figures 1b and 4f
The Institute for Employment Studies44
Figure 4.14: Unemployment and Jobsearch among new graduates, 1993 to 1999
0%
5%
10%
15%
20%
25%
30%
1993 1994 1995 1996 1997 1998 1999
% in employment looking for a different job % ILO unemployment
Source: IES/Labour Force Survey
The IES Annual Graduate Review 2000 45
Bibliography and Further Reading
AGCAS statistics sub-committee (1994 and previous), First Destinationsof Students from the New Universities (or Polytechnics) Qualifying in1993, CSU, Manchester
Bevan S, Barber L, Robinson D (1997), Keeping the Best: A Practical Guideto Retaining Key Employees, IES Report 337
BSL (1998), Occupations in the future — Tomorrow’s Graduates, BusinessStrategies Ltd
Connor H, Pearson R, Court G, Jagger N (1996a), University Challenge:Student Choices in the 21st Century, IES Report 306
Connor H, Pollard E (1996b), What Do Graduates Really Do?, IES Report308
Connor H, La Valle I, Pollard E, Millmore B (1997), What Do Graduatesdo Next?, IES Report 343
Connor H, Burton R, Pollard E, Regan J, Pearson R (1999), Making theRight Choice: How Students Choose Universities and Colleges, CVCP
CSU (1999), The Graduate Market Trends Salary and Vacancy Survey,Central services Unit (CSU)
Cubie A (1999), Student Finance: Fairness for the Future, Scottish Executive
CVCP (1998), From Elitism to Inclusion: Good Practice in Widening Accessto Higher Education, The Committee of Vice-Chancellors andPrincipals of the Universities
Dearing R, et al. (1997), Higher Education in a Learning Society, HMSO
Dench S (1998), Keeping IT Together: Skills for Information Technologists,IES Report 346
DfEE (1974), Employment Prospects for the Highly Qualified, HMSO
DfEE (1990), Highly Qualified people: Supply and Demand, HMSO
DfEE (1998c), Statistics of Education: Public Examinations GCSE/GNVQ,and GCE/AGNVQ in England 1997, HMSO
Elias P, Purcell K, Pitcher J, Simm C (1999), Working Out? Graduates’Early Experiences of the Labour Market, Higher Education CareersService Unit
The Institute for Employment Studies46
Guardian/NOP (1998), ‘Graduate Survey’, The Guardian, 24 November
Harvey L, Moon S, Geall V (1998), Work Experience: ExpandingOpportunities for Undergraduates, Centre for Research into Quality,Birmingham
HEFCE (1998), Widening Participation in Higher Education: FundingProposals, Consultation Paper 98/39, Higher Education FundingCouncil for England
HESA (1999, annual), First Destinations of Students Leaving HigherEducation Institutions 1997/8, Higher Education Statistics Agency
HESA (1999, annual), Higher Education Statistics for the UK, HigherEducation Statistics Agency
HESA (1999, annual), Students in Higher Education Institutions 1997/98,Higher Education Statistics Agency
Huws U (2000), EMERGENCE, a major three year international study of thelocation of information jobs, Institute for Employment Studies,forthcoming
IDS Management Pay Review (1999), Pay and Progression for Graduates1998/99, Research File 49, Incomes Data Services
IER (1999), Review of the Economy and Employment, Labour MarketAssessment, Institute for Employment Research, Warwick
Jagger N, Blanden J, Regan J (2000a, and annual), Graduate Salaries andVacancies, 2000, Association of Graduate Recruiters (AGR)
Jagger N, Aston J (2000b), Nurturing Conservators: the Early Career Pathsof Conservation Graduates, IES Report 362
Jagger N, Aston J (2000c), Skills for a Competitive Future: A survey for thePharmaceutical National Training Organisation, Institute forEmployment Studies, forthcoming
La Valle I, O’Regan S, Jackson C (2000), The Art of Getting Started:Graduate skills in a fragmented labour market, IES Report 364
Mason (1999), The Labour Market for Engineering, Science and ITGraduates: Are There Mismatches Between Supply and Demand? DfEEResearch Report RR112
Meager N (1998), ‘Analysis of Self-employment’, SYSDEM, Winter1998, EC
Nove A, Snape D, Chetwynd M (1997), Advancing by Degrees: a Study ofGraduate Recruitment and Skills Utilisation, DfEE Research ReportRR33
OECD (1998), Economic Outlook, OECD, Paris
OECD (1999), Education at a Glance, OECD Indicators: 1998, OECD
ONS (1998), Labour Force Survey, Stationery Office
The IES Annual Graduate Review 2000 47
Parsons D (1986), Graduate Recruitment and Retention, IES Report 107
PCAS (1993 and previous), Annual Reports and Statistical Supplements,Polytechnics Central Admissions System
Pearson R (1976), Qualified Manpower in Employment, Institute forEmployment Studies
Pearson R (1982), Graduate Supply and Availability, IES Report 114
Pearson R, Pike G, Gordon A, Weyman C (1989), How Many Graduatesin the 21st Century?, IES Report 177
Pearson R (1997a), As the Costs Rise, So Does the Need for Students to HaveBetter Information, House of Commons Education & EmploymentCommittee, HMSO
Pearson R, Perryman S, Connor H, Jagger N, La Valle I (1997b), The IESAnnual Graduate Review, 1997-1998: the Fragmenting Graduate Market,IES Report 340
Pearson R, Perryman S, Connor H, Jagger N, Aston J (1999a), The IESAnnual Graduate Review 1998-1999: the Key Facts, IES Report 354
Pearson R, Aston J, Jagger N, (1999b), Science Skills Issues, Skills TaskForce Research Paper 17, DfEE
Pearson R, Jagger N, Connor H et al. (2000, forthcoming), The Adequacyof Education Systems Relative to R&D Employment Needs in the EU,European Commission
Purcell K, Hogarth T (1999a), Graduate Opportunities, Social Class andAge: Employers’ recruitment strategies in the new graduate labourmarket, Institute for Employment Research, University of Warwick
Robbins (1963), Higher Education: Report of the committee appointed by thePrime Minister under the chairmanship of Lord Robbins, 1961-1963,Cmnd 2154, HMSO
Sturgess J, Guest D (1999) Should I Stay or Should I Go? Association ofGraduate Recruiters (AGR)
Swan (1968), The Flow into Employment of Scientists, Engineers andTechnologists, HMSO
Tackey N D, Perryman S (1999), Graduates Mean Business, IES Report 357
Tamkin P, Hillage J (1999), Employability and Employers: the Missing Pieceof the Jigsaw, IES Report 361
UCAS (1999, annual), Annual Reports and Statistical Tables 1998 entry,Universities and Colleges Admissions Service
University Grants Committee (1967), First Employment of UniversityGraduates 1965/66, HMSO
USR (1995 and previous), University Statistics 1993-4: First Destinationsof University Graduates, UCAS (Universities Statistical RecordPublications)
The Institute for Employment Studies48
Sources of Information
Association of Graduate Careers Advisory Services (AGCAS)President: Martin ThorneCareers Advisory ServicesUniversity of NottinghamCherry Tree Buildings (E)University ParkNottinghamNG7 2RDTel: 0115 951 3671www.agcas.csu.man.ac.uk
Association of Graduate Careers Advisory Services (AGCAS)Secretary: Sheila CouttsBrunel UniversityUxbridgeMiddlesexUB8 3PHTel: 01895 274000
Association of Graduate Recruiters (AGR)Chief Executive: Carl GilleardThe Innovation CentreWarwick Technology ParkGallows HillWarwickSV34 6UWTel: 01926 623236www.agr.org.uk
Edexcel Foundation(formerly BTEC and University of London Examinations Board)Customer Enquiries UnitStewart House32 Russell SquareLondon WC1B 5DNTel: 020 7393 4444www.edexcel.org.uk
Central Services Unit (CSU)Prospects HouseBooth Street EastManchesterM13 9EPTel: 0161 277 5200www.prospects.csu.ac.uk
The IES Annual Graduate Review 2000 49
Committee of Vice Chancellors and Principals (CVCP)20 Tavistock SquareLondonWC1H 9HQTel: 020 7387 9231www.cvcp.ac.uk
Department for Education and Employment (DfEE)Sanctuary BuildingsGreat Smith StreetLondonSW1P 3BTTel: 020 7925 5000www.dfee.gov.uk
Department of Education (Northern Ireland)Rathgael House43 Balloo RoadBangorCounty DownBT19 7PRTel: 01247 279000www.deni.gov.uk
Further Education Funding Council (FEFC)Cheylesmore HouseQuinton RoadCoventryCV1 2WTTel: 01203 863000www.fefc.ac.uk
Higher Education Funding Council for England (HEFCE)Northavon HouseColdharbour LaneBristolBS16 1QDTel: 0117 931 7317www.hefce.ac.uk
Higher Education Statistics Agency (HESA)18 Royal CrescentCheltenhamGloucestershireGL50 3DATel: 01242 255577www.hesa.ac.uk
The Institute for Employment Studies (IES)Mantell BuildingFalmerBrightonBN1 9RFTel: 01273 686751www.employment-studies.co.uk
Universities and Colleges Admissions Service (UCAS)Fulton HouseJessop Avenue (off St James Square)CheltenhamGloucestershireGL50 3SHTel: 01242 222444www.ucas.ac.uk