114
AGR:/:CULTURAL, OF 'J'H$ jJN,ITED -np.; , I· F . Economic' Research Se(v'ice. APR 75

rATUs/io~E):GN AGR:/:CULTURAL, 'J'RAD~ OF 'J'H$ jJN,ITED STATE<~, _;l,~.75 APRI~_. W,ashin9to~, -np.; ,
I·F .~SDA/FATUS Economic' Research Se(v'ice. APR 75
I.0 ~~ IIIII 2.8 \\\~ 2.5
~ ~F2 .2 11111 ~
B.1.l I~ w.a:: 11\4.0 0
1111\ 'I. ... Il_;.,:; •.8 \
\\\\\~ \\\\\~ IIIII 1.6
Agricultural Exports Under Government - Financed Programs in 1974
UoS. -Mexican Agricultural Trade Again Sets New Records
U.S. -USSR Agricultural Trade, 1972 - 74
International Commodity Prices Continued High in 1974
Trade Statistics, July - February
TRI-AGENCY REAfJlNG RoOM
APR 28 1975
500 12th St . Washington" DSWc' Room 505
, . , 20250 .
ECONOMIC RESEARCH SERVICE • U.S. DEPARTMENT OF AGRICULTURE
CONTENTS
Special in this issue:
Agricultural Exports Under Government-Financed Programs in 1974 •.•••• 5
U.S.-Mexican Agricultural Trade Again Sets New Records .••••••..••••.• 33
U.S.-USSR Agricultural Trade, 1972-74 ••••••• II ••••••••••••••• 0 •••••••• 42
International Commodity Prices Continued High in 1974 ...••.•••.•..••• 44
Export Highlights, July-February •••••••.••••...•••....••••..••.....•••• 55 "t
Import Highl}.ghts» -.Ju1y-February •••••••••.••...•.••.•.••.....•.•••••••• 90
U.S. agricultural trade data for July-February: U.S. exports: Quantity and value by commodity .....•••...•••.•••.•••• 66 U.S. imports: Quantity and value by commodity ••..•.•......••...••••. 98 U.S. exports and imports: Value by country ..•..•..••••...••.•.••••.. 103
Quantity indexes, by commodity group, July-February: Exports . & •••••••••••••••••••• .j •••••••••••••••••••••• II •••••• It • • • • • • • •• ll} 7 Imports .................... ~ ..... II •••••••••••••••••••••• 0. • • • • • • • • • •• 108
Explanatory note ....................................................... 109
Principal Coordinators Robert L. Tontz Dewain H. Rahe Thomas A. Warden
(202) 447-8474
Statistics Program Area Foreign Demand and Competition Division
Economic Research Service
Washington, D.C. 20250
-2-
E . ,

FOREIGNAGRICULTURALTRADEOf THE UNITED STATES
!18iieiiir8Biiillli~ll~rlli.liiii!i ssseooeoieeasseeaeaeaoaaerrlisreSiSiill.remDigesf
eeee!!SSaeSII!eaes!seaSS!!!2SeeeaeeesaascceessssIC2SE2!SaS2eaE~Eae$ea!S!!eee8••AgricUltural Exports ~ Government-Financed Programs' .!!!. 1974 (see.E..:.. D. u.s. agricultural exports under specified Government-financed programs dropped 8 percent incalendar year 1974 to $797 million, accounting for only 4 percent of all U.S. farm exports. Farm shipments under P.L. 480 edged up 1 percent to $760 million, largely as aresult of a strong advance in shipments under Govemment-to-Govemment (world food)and voluntary relief programs. Shipments under Title I long-term dollar credit saleswere down 10 percent, or $54 million, and exports under the Mutual Security (AID) program in 1974 amounted to only one-third of the 1973 level.
'Ie 'Ie * * * ~-Mexi.can Agricultural Trade Again.~ New Records (see.E..:.. 33). United StatesMexican trade continued its strong upward trand during 1974, reflecting rising Mexicanfood deficits and a general increase in price levels. U.S. agricultural exports toMexico were more than double the 1973 record, reaching $863 million, and U.S. impDrtsfrom Mexico were up slightly from the 1973 peak to $767 million.
* * * * 'Ie
U.S.-USSR Agricultural~, 1972-74 (see.E.:.. ~. U.S. agricultural exports to theUSSR in calendar 1974 dropped by two-thirds to $300 million, consisting mainly of wheatand corn. The level of imports, however, nearly doubled, reaching $8.5 million.
* * * * ok
Inte'mationsl Commodity Prices Continued High 1:!!.1~;r4 (see .E.:.. 44 ). The 1974 Dow Jonescommodity spot price index was 40 pe~cent higher than the 1973 average. Yet, recentdevelopments suggest that the rising world price trends which began in 1972 may haveended with 1974. Soybeans and soybean meal, cotton, and imported cow meat experiencedsharp downturns in 1974, folloWing 1973 increases. Wheat, corn, sorghum, rice, coffee,sugar, cocoa bean, and rubber prices continued their upsurge into 1974, reaching a1lti~ highs, but by year's end had also started to weaken.
'Ie 'Ie * * *
-3
.-~-..;..------.-..•. - .... "'---.-~-~------~--,...~...""'....-""-~
hl:.. Agricultural Export Val~ Gains 10 Percent in July-February (see l?:.. ~. Farm product exports in July-February 1974/75 totaled more than $15 billion, compare~ with $13.7 billion a year earlier. Higher prices accounted for most of the gaitl, as volume declined 15 percent for major items. February farm product exports amounted to $1.92 billion, a decline from the January record high, but about the same as February 1974. Exports to Canada, MeXico, Western Europe, West and South Asia, Africa, Oceania, Central America, and the Caribbean increased.
* * * * * Agricultural Import ~ QF. 10 Percen.t in July-February, Volume Down (see l?:.. 90). U.S. agricultural imports for the first 8 months of fiscal 1975 totaled $6.55 billion, 10 percent more than the same months a year earlier. However, overall volume was down. February's monthly value of $694 million was the lowest since Se~tember 1973. Competitive farm product imports accounted for all of the July-February value increase.
-4-
I f I t
---'--'----.~
•SPECIAL In this •Issue
il@JE8HUSUESU IiUjjUnHOil iBuuueSHi nun in8eiUil!i!iUU&9jili nans
AGRICULTURAL EXPORTS UNDER GOVERNMENT-FINANCED PROGRAMS IN 1974
by
M. Louise Perkins ~/
U.S. agricultural exports under Government-financed programs in calendar year 1974 totaled $797 million, down 8 percent from 1973. Government-financed exports accounted for 4 percent of all agricultural exports--the lowest share since the inception of Government-financed programs. In 1973, Government-financed exports accounted for 5 percent of the agricultural total, but total farm shipments in 1973 and 1974 valued at $18 billion and $22 billion, respectively, were substantially above the $5.7-bi11ion average during 1955-19'72. '
While the vast bulk of commercial farm exports are unassisted commercial transactions, the U.S. Government provides various forms of assistance to a small portion of commercial exports. Included in this group are exports that have received payment assistance, exports bartered for overseas procurement for U.S. agencies, and exports under shortterm credits and guarantees issued by the ece and the Export-Import Bank. Exports under barter contracts totaled $80 million in 1974, compared with $874 million in 1973. Exports under the CCC credit sales program, valued at $182 million, amounted to onefifth of last year's sales. The value of shipments under Export-Import Bank loans was unchanged from the $79-million level of 1973.
The remainder of this article conce+ns noncommercial exports financed under Government programs, which include shipments under P.L. 480 and under Mutual Security (AID) programs. These Government-financed export~va1ued at $797 million were distributed primarily under the P.L. 480 program. Exports under the auspices of AID dropped to $37 million in 1974 from $113 million in 1973, when they had accounted for 13 percent of all Government-financed exports.
The decline in U.S. food aid under Government-financed programs in 1974 stems from the fact that authorization to export U.S. agricultural commodities under P.L. 480 depends on the availability criteria established in Section 401 of the P.L. 480 act. To assure adequate food supplies for domestic consumption, announcements of large volumes of U.S. food aid shipments began only in late 1974 after the unfavorable effects of the year's poor growing weather on crops could be evaluated. Thus, late programming in 1974 is reflected in the low level of food aid shipped. '
~/ Special acknowledgements are due Louise Stanton and Linda C. Myers for the compilation and statistical analysis of data in this article.
-5
President Ford, in his budget message submitted to Congress on February 3, 1975, revealed that the Food for Peace program would be increased for fiscal year 1975. The new figures show $1.47 billion for the purchase of commodities, compared to $851 million in 1974, an increase of more than $600 million. Moreover, the President called·
. for $679 million for programs aimed at improving and expanding food production in the developing countries.
Agricultural exports under P.L. 480 edged up about 1 percent to $760 million in 1974, with the usual three-fifths share (by value) moving under the dollar-credit sales program. Dollar-c~edit sales of farm products valued at $488 million in 1974 were $54 million below last year's level and $172 million below the 1972 peak" Major recipients under the dollar-credit sales program were South Vietnam, Cambodia (Khmer Republic), Bangladesh, Pakistan, and Egypt. In 1974, combined shipments to these countries accounted for more than nine-tenths of all dollar-credit sales. These same countries received slightly more than half of all dollar-credit sales a year earlier. Wheat, rice, and substantially smaller amounts of soybean oil, cotton, and tobacco accounted for nearly all dollar-credit sales in 1~74. No shipments moved under the Local Currency Program in 1974. Sales for local currencies, formally authorized under Title I, P.L. 480, were discontinued on December 31, 1971. But shipments to fulfill existing contracts continued through 1973.
In 1974, the value of farm products shipped under Title II of P.L. 480 rose 30 percent to $272 million, reaching a record sha~e of all Government-financed exports. Donations under Government-to-government (world food) programs rose 12 percent to $132 million. Most of the increase in Title II shipments, however, was due to a 54-percent gain in donations througn Voluntary Relief Agencies. Voluntary Relief donations advanced $49 million to $140 million in 1974.
Better than three-fifths of all Voluntary Relief donations went to India, Morocco, the Philippines, Colombia, and Egypt. The bulk of these donations was concentrated in wheat and wheat products, blended food pr.oducts, and soybean oil. With the exception of grain sorghums, the commodity composition of Government-to-government donations was similar to that uf Voluntary Relief exports. But the distribution of these farm products was more widespread. Mali and Niger were the largest recipients of farm shipments under Government-to-qovernment programs in 1974.
AID shipped $37 million worth of farm products in 1974, mainly to South Korea, Indonesia, Pakistan, Morocco, India, and South Vietnam. Wheat, corn, grain sorghums, and inedible tallow made up about three-fourths of all AID shipments. In 1973, rice valued at $31 million was included among the principal commodities exported through AID. Rice exported under the AID program in 1974 totaled only $34,000. Wheat shipments under AID were also down, to $5 million in 1974 from $40 million a year earlier.
The direction of flow of U.S. food aid in 1974 was governed by recent U.S. policy with respect to countries most seriously affected by food shortages. The United Nations designated thirty-two countries as "Most Seriously Affected" by the current economic crisis. These were countries without the internal food production capability or the foreign exchange availability to secure food to meet their immediate ~ood requirements. The Congress called upon the President and Secretary of State to take several steps to mobilize appropriate resources to meet the food emergency. Included in these actions, the Congress directed that during the fiscal year ending June 30, 1975, not more than 30 percent of concessional food aid should be allocated to countries other than those which were most seriously affected by current food shortages, unless the President demonstrated to appropriate Committees of the Congress that the use of such food assistance was solely for humanitarian food purposes.
-6
" ........_-_._--
Wheat and wheat products--'l'otal U. S. wheat and wheat product exports valued at $4 .6 billion in 1974 registered aID-percent increase over the previous year's record. But wheat and wheat product eA~orts under Government-financed programs dropped sharply to $218 million from $298 million in 1973. Most of the decline was due to a 50-percent reduction in dollar-credit sales of wheat. Wheat shipments under the AID programs were also sharply reduced. Title II, P.L. 480 donations of wheat and wheat products, valued at $78 million in 1973, rcae 72 percent to$l34 million in 1974. While donations of ,all commodities in this group advanced in 1974, the majo~ part of the increase resulted. from substantially larger donation3 of wheat flour in 1974. Major country destinations in 1974 were India, Bangladesh, South Vietnam, Morocco, Indonesia, and Egypt.
Feed grains and products--The United States exported $4.7 billion worth of feed grains and products in 1974, compared with $3.6 billion a year earlier. The growth ih commercial sales, however, accounted for more than the growth in total exports as feed grains and products shipped undGr Government-financed programs fell 23 percent to $77 million. Feed grain donations under Title II almos't dOUbled the 1973 levels ~. and shipments under the AID program totaled some $12 million, against no e~~orts in 1973. These increases, however. were insufficient to offset the massive decline in dollarcredit sales of feed grains in 1974.
Government program shipments of grain sorghums valued at $46 million in 1974 were virtually unchanged from the year-earlier level. The value of Government-financed corn ~xports, on the other hand, declined from $47 million in 1973 to $21 million in 1974. Major outlets for Government program s4ipments of grain sorghums in 1974 included Mali, Niger. Pakistan, South Korea, Chad, and Mauritania. Better than three-fourths of the Government-financed corn went to Indonesia, Ethiopia, Guinea, South Korea, Tanzania, and South Vietnam in 1974.
Rice--Government program shipments of rice in 1974 rose 36 percent to $288 million and ~unted for slightly more than one-third of all' U.S. rice exports. All rice shipments under P.L. 480 were, dollar-cr~dit sales and went to Cambodia and South Vietnam. AID supplied Cambodia with rice valued at $34,000 in 1974.
Blended 'food products--In 1974, Government program exports of corn-soya-milk and wheat-soya-flour totaled $43 million against $59 million a year earlier. Nearly all of the decline in shipments of these blended food products was due to a sharp decline in corn-soya-milk. With the exception of $519,000 in dollar-credit sales to Jamaica, all blended food products moved under Title II donations in 1974.
Cotton--Exports of cotton under Government programs totaled $30 million in 1974 against $82 million a year earlier. A doubling in the unit price of cotton between 1973 and 1974 is very likely responsible for part of the decline in the value of Governmentfinanced shipments. In 1973, Government-financed cotton moved at $168 per running bale, but in 1974 the export unit price was $346. All cotton exports in 1974 moved under the dollar-credit program to South Vietnam ru~J Indonesia.
Tobacco--Exports of tobacco under Government programs totaled $37 million in 1974 against $25 million a year earlier. Although the volume of tobacco exported increased nearly one-third, the increase reflected a much higher unit value in 1974. Tobacco exports, continuing to move heavily under the dollar-credit sales program, went to South Vietnam, Egypt, Thailand, Cambodia, and the Philippines. Israel received about $322,000 worth of tobacco under the AID program.
-7
Oilseeds and products--Government program shipments of oilseeds and products, mainly30ybean oil, rose 19 percent to $76 million in 1974. Soybean oil, about equallydistributed under dollar-credit sales and Title II donations, amounted to $74 millionin 1974 against $61 million a year earlier. Higher prices accounted for all of thevalue gain; volume was down about one-third. Three-fifths of all soybean oil shippedunder dollar-credit sales went to Pakistan. Other recipients of soybean oil underdollar-credit sales include TUnisia, South Vietnam, and Bangladesh, each receivingabout $4 million worth of soybean oil, and Israel and Cambodia. Widespread distribution of this commodity occurred under the Voluntary Relief and Government-to-Governmentprograms. No soybean oil was shipped under the AID program in 1974.
Dairy pronucts--In 1974, total exports of dairy products rose 27 percent to $76 million,but commercial shipments accounted for all of this value gain. Government programshipments of dairy products at $3 million in 1974 amounted to three-fifths of theprevious year's level. Shipments of dairy products in 1974 moved under the AID programand included infant dietary supplements and lactose destined for South Vietnam andCambodia.
Animals and animal products, except dairy products--Government program shipments ofanimals and animal products, continuing to move mainly under the AID program, totaled .. 1$14 million in 1974 compared with $18 million in the previous year. Inedible tallowvalued at $11 million in 1974 accounted for the bulk of these shipments. In order ofimportance, AID shipments of inedible tallow went to Pakistan, India, Morocco, Ghana,and Cambodia.
Fruits and vegetables and preparations--In 1974, ~.S. exports of fruits and vegetablesrose 18 percent to $1.1 million, but Government program shipments of this commoditygroup were negligible. Fruits and vegetables shipped under Government programsamounted to about $400,000 in 1973 and 1972.
Exports Under Barter Contracts and Credit Sales
Overseas procurement barter transactions in 1974 totaled $80 million, compared with$874 million a year earlier. Barter transactions included five elibible commoditiesin contrast to 13 a year earlier. Cotton bartered for overseas procurement, valuedat $72 million, accounted for 90 percent of all 1974 barter transactions. Tobacco,worth $7 million, ranked second. Small amounts of corn, grease, and inedible tallowmade up the remainder. Major barter transactions were made with Japan, Taiwan,Hong Kong, West Germany, Italy, and Thailand. Barter transactions with these countries consisted of cotton exclusively, except in Thailand, where tobacco was the onlycommodity involved. '
Exports under credit-sales programs--Total credit sales of U.S. farm products totaled$262 million in 1974 compared with $993 million in 1973. All of the decline was dueto a $73l-million drop in CCC credit sales.
However, effective December 3. 1974, the list of commodities eligible for exportfinancing under the CCC Export Credit Sales Program as announced November 29, 1974,was amended to include dry edible beans for 6 to 12 months of financing. The amendedlist of eligible commodities includes beef and dairy breeding cattle, breeding swine,cotton, eggs (dried, frozen, and canned), canned and frozen poultry, milled and brownrice, tallow, tobacco, and wheat. The amendment made feed grain (barley, corn, grainsorghums, oats, and rye) ineligible for new financing.
-8

In 1974, wheat, rice, barley, corn, grain sorghums, tobacco. and cotton worth $1.82 million were exported under CCC credit sales programs and accounted fOr more than two-thirds of all credit sales. CCC credit sales of wheat went mainly to Pakistan, Chile, and Peru. The United Kingdom took nearly three-fifths of our tobacco exported under CCC credit sales. Credit sales of U.S. corn went primarily to the USSR, Romania, and Chile. The Republic of Korea took more than three-fourths of the cotton, while barley moved exclusively to Romania. I Transactions under Export-Import Bank loans and medium-term guarantees amounted to $79 million in 1974, virtually unchanged from the year-earlier level. Cotton worth $76 million moved to Japan, down about $3 million from the 1973 level, but this decrease was offset by some $3 million worth of tobacco exported to Ireland.
I I I ! f I
-9

~~~;.;.c;::::~-'l'.-""-:'~=~~~~_~ ____ '_._0_f I 1I{
Table 1 .-~gricultural exports out~ide Government-financed programs or commercial exports under barter contracts for overseas procurement and credit sales programs,
value, calendar years 1955 through 1974 and July-December 1954 1 Overseas Export-Import: Total under
Year procurement Bank loans : f overseasbarter for Iand eee credit prOCUl:ement iU.S.
Imedium~term Otherbarter and Totalagencies 11 sales IIguarantees ll: credit sales cOmmercial commercial
rOQ:rams
I-~ Million dollars -1954 July-December •••••••••••••••••••••••••••••••• 1955 •••••••••••••••••••••••••.•.••.•••••••••••••• : 31 f 1956 ••••••••••••.•.•••••••••.••.••••••••••••••••• : 44 31 1,273 1,304 1957 •••••••••••.••••.••••••••••••••••••.••••••••• : 77 44 2,037 2,0812
I791958 •••••••••••••••••••••••••••••••.••••.•••••••• : 127 13 2,380 2,459
1959 •••••••••••••••••••••••••••••••.••.•••••••••• : 137 28 140 2,830 2,9701651960 ••••••••••••••••••••••••••••••••.•••••••••••• : 40 14 2,457 2,622
1961 •••••.••••••••••••••••••.•.•••••••••.••••.••• : 32 6 54 2,693 2,747
1962 •••••••••••••••••••••••.••••.••••.••••••••••• : 42 38 3,333 3,3711963 •••••••••••••••••••••••••••••.••••••••••••••• : 83 64
68 3,541 j
26 3,473 i
37 1471964 •••••••••••••••••••••••••.•.•..•••••••••••••• : 77 3,408 f117 3,55580 231 I 1965 •••••••••••••••••••••••••••••.••••••••••••••• : 77 87 3,833 4,064..... 169 244 I
0, 1966 •••••••••••••••••••••••••••••.•••••••.••••••• : 78 119 4,460 4,704234 3661967 ............................................. : 101 387 4,514 4,880304 7221968 ••••••••••••••••••••••••••••••••••.•••••••••• : 71 155 530 4,806 5,528
I 1969 ••••••••••••••••••••••••.••••••.••••••.•.•••• : 282 74 111 4,587 5,117340 4671970 ••••••••••••••••••••••••••••••••••••••••••••• : 43 145 4,572 5,039587 5281971 ••••••••••••••••.•••••••••••.•••••••••••••••• : 84 301 4,387 4,915935 9721972 •••••••••••••••••••••••••••••••••••••••.••••• : 94 371 5,254 6,226889 1,400 5,2241973 ••••••••••••••••••••••••••••••••••••••••••••• : 63 566 6,624874 1,5181974 ••••••••••••••••.••••••••••••••••••••.••••••• : 79 913 6,730 8,248aO 1,866 14,946Z2 H!2 341 16,812
1955-74 and Ju1y- 20 !.l2 6 21.197
~r__. 4.811 1.533 3.607 9.951 108.053 118.004 Ship..nt. undor ...r •••• proour...nt h.rt.r rontr.rt••r••nthuri••d by tho CCC Ch'rt.r Art .nd .r•••••nt""y 'qniV"'nt tn du11'r ~
sales since they offset the dollar outflow for foreign purchases by U.S. agencies with a dollar inflow for agricultural commodities. f II Shipments under Export-Import Bank loans and guarantees and under the eee credit sales program are credits for relatively short periodsrepayable in dollars plus interest (covering the costs of the lending agency).
i
r ~
·'---·-~-'l"4~~.JZ:.• "',_''"~=~~~~~''JC,,~..,.,.~">''-~,,~~ " ~ -t

~;::::;iZL~~~~':"·~-r"~~"\'7"~'":+fi~=_.l~ ~f~~.::.:..:..~~I,~I<~~~~':i"'./"r.~~~'.'~~~i¢~__ J..'"'.:::n~~f"1'~~~:t":'i~~&~'?.iS7~,~~~'~~_~):>;:j;.
{; .. 6 ~ ff
Table 2.--U.S. agricultural exports: Specified Government-financed programs, commercial sales for dollars, and total; value by commodity group, calendar years 1973 and 1974
Exports under Government- Commerica1 sales Total agriculturalfinanced programs 11 for dollars 11 exportsCommodity
1973 1974 Change 1973 1974 Change 1973 1974 Change
Million dollars
Total ••••••••••••••••••••• ~ ••••••• : 867.2 797.5 69.7 16,813.3 21,196.2 +4,382.9 17,630.5 21,993.7 +4,313.2
Wheat and wheat products •••••••••• : 297.9 217.8 -80.1 3,902.5 4,415.7 +513.2 4,200.4 4,633.5. +433.1Feed grains and products •••••••••• : 100.5 76.6 -23.9 3,479.1 4,624.7 +1,145.6 1/3 0 579.6 1/4,701.3 +1,121.7Rice •••••.•• "••••.••••••••••••••.. : 210.8 287.8 +77.0 328.4 564.6 +236.2 539.2 852.4 +313.2Blended food prodUcts ••••••••••••• : 58.8 43.4 -15.4 29.8 1.4 -28.4 !t/88.6 44.8 -43.8Cotton, excluding linters ••••••••• : 81.6 30.5 -51.1 847.4 1,304.2 +456.8 929.0 1,334.7 +405.7Tobacco, unmanufactured ••••••••••• : 25.2 37.2 +12.0 688.7 848.8 +160.1 713.9 886.0 +172.1Oi1seeds and products ••••••••••••• : 63.7 75.5 +11.8 4,244.2 5,631.6 +1,387.4 4,307.9 5,707.1 +1,3%.2Dairy products •••••••••••••••••••• : 4.8 3.0 -1.8 55.6 72.7 +17.1 60.4 75.7 +15.3Animals and products, excluding dairy products ••••••••••••••••••• : 18.1 13.7 -4.4 1,505.8 1,684.2 +178.4 1,523.9 1,697.9 +174.0
Fruits and preparations ••••••••••• : .3 -0.3 534.4 596.1 +61.7 534.7 596.1 +61.4 I
372.8 472.9 +100.1 372.9 472.9 +100.0Vegetables and preparations ••••••• : .1 -0.1 ... Other •••.••••••••••••••••••••••••• : 5.4 12.0 +6.6 824.6 979.3 +154.7 830.0 991.3 +161.3... I
'. -- Thousand metric ~ --
Wheat and wheat products •••••••••• : 2,588 1,174 -1,414 36,187 25,067 -11,120 38,775 26,241 -12,534Feed grains and products •••••••••• : 1,192 665 -527 40,710 36,807 -3,903 41,902 37,472 -4,430Rice ..•••••••..•.•••••••••••••.•.. : 635 563 -72 993 1,160 +167 1,628 1,723 +95Blended food products ••••••••••••• : 206 148 -58 13 14 +1 219 162 -57Cotton •••••••••••••••••••••••••••• : 105 19 -86 1,090 1,105 +15 1,195 1,124 -71Tobacco, unmanufactured ••••••••••• : 10 13 +3 280 300 +20 290 313 +23
11 Includes sales for foreign currency, long-term dollar and convertible local currency credit sales, Government-to-government donations, and donations through voluntary relief agencies authorized by P.L. 480, and exports under Mutual Security (AID) programs authorized by P.L. 87-195.
11 "Exports outside specified Government-financed programs" or "Commerical sales" include, in addition to unassisted commercial transactions, shipments of some commodities with governmental assistance in the form of (1) barter transactions involving overseas procurement for U.S. agencies, which benefit the balance of payments and rely primarily on authority other than P.L. 480; (2) exte~sion of credits and credit guarantees for relatively short periods; (3) sales of Government-owned co~~dities at less than domestic market prices; and (4) export payments in cash.
1/ Total exports of feed grains and products, include the estimated value of donations of grain sorghums through voluntary relief agenciesunder P.L. 480, not separately reported by the Bureau of the Census: 1974, $0.9 million. il Total exports include those reported by Census plus Government-to-Government donations.
t :$fo'~~C' ~-., . __~_.__~_.... __._.J
I
1
~~~~"""'""='tMf:;'At'S" ...............".~__~ .. "..._ .. _~~~__ .....,~___ .
, ~ N,
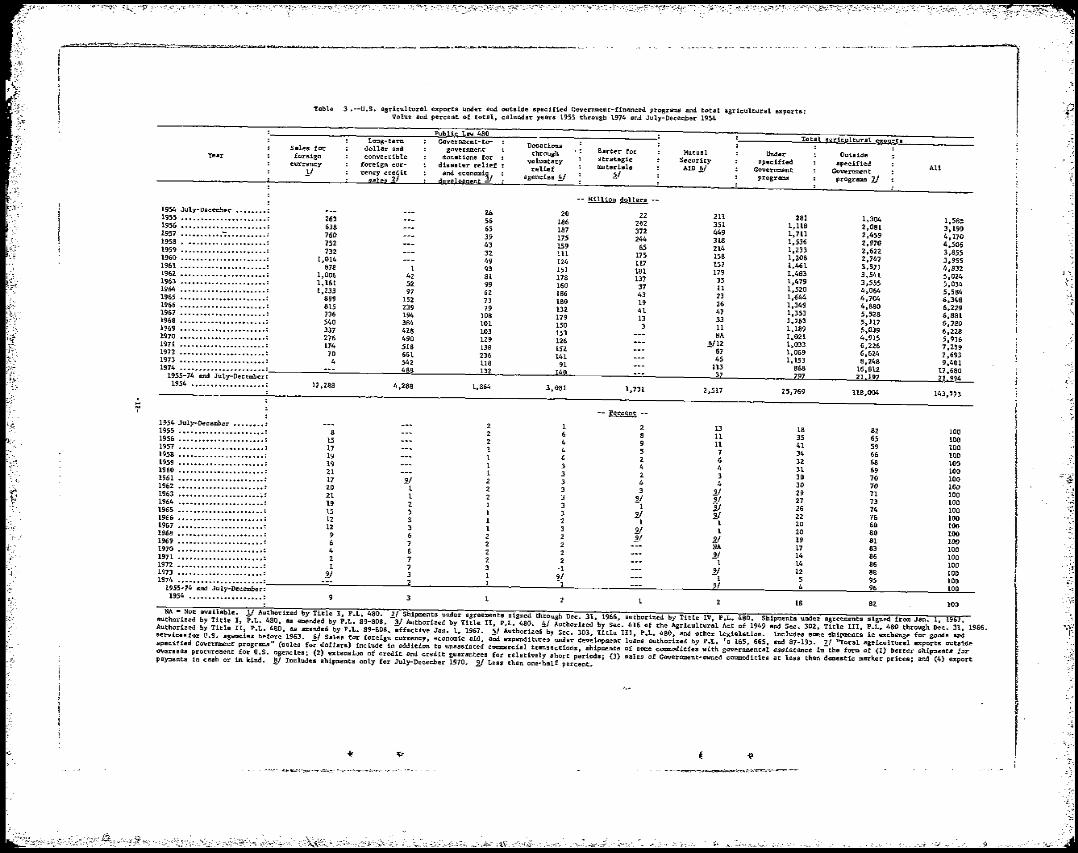
Table 3.--U.S. agricultural exports under and outside specified Covernment-financed p1;'ogr&ms and total agricultural expatts: Value and percent of total, calendar years 1955 through 1974 and July-December 1954
Public Law 480 ' -'T"'o"'ts"'l'-"s."'r'-<i=cult!lral exoortQLO:lg-term Government-to- Donations ______
Year Sales for foreign
currency 11
dolls,r snd conve.rtible
foreign curreney credit
aales 2/
government donations for
disaster relief and economi~1
develppment _
through voluntary relief
agencies !!.I
Barter for strategic materials
2.1
Mutual Security
AID §.I
Under ~pecified
GoV"ernment programs
specified Government
Outside
programs ]j All
-- 1::!!l!.!.2!!. dollars -1954 July-December •.••••••• 1955 •••••••••••••••••••••• : 1956 •••••••••••••••••••••• : 1957 •••••••••• :-: •••••••••• : 1958 ••••••••••••••••••••• : 1959 •••••••••••••••••••••• : 1960 •••••••••••••••••••••• : 1961 •••••••••••••••••••••• : 1962 •••••••••••••••••••••• : 1963 •••••••••••••••••••••• : 1964 •••••••••••••••••••••• : 1965 •••••••••••••••••••••• : 1966 •••••••••••••••••••••• : 1967 •••••••••••••••••••••• : 1968 ••••••• _.............. : 1969 •••••••••••••••••••••• : 1970 •••••••••••••••••••••• : 1971 •••••••••••••••••••••• : 1972 •••••••••••••••••••••• : 1973 •• '" ••••••••••••••••• : 1974 ...................... :
1955-74 and July-December: 1954 " ••••••••••••••••• :
263 638 760 752 732
1,014 878
1,006 1,161 1,233
899 815 736 540 337 276 174 70
4
12,288
1 42 52 97
152 239 194 384 428 490 518 661 542 488
4,288
28 56 65 39 43 32 49 93 81 99 62 73 79
108 101 103 129 136 236 118 132
1,864
20 186 187 175 159 III 124 151 178 160 186 180 132 179 150 153 126 15Z 141
91 l!d!
3,081
22 262 372 244
65 175 117 181 137 31 41 19 41 13 3
1,731
211 351 449 318 214 158 157 179 35 11 23 26 47 33 11 NA
Y12 87 45
113 3Z
2,517
281 1,118 1,711 1,536 1,233 1,208 1,461 1,483 1,479 1,520 1,644 1,349 1,353 1.263 1,189 1_021 1,033 1,069 1a153
868 Z2Z
25,769
1,304 2,081 2,459 2,970 2,622 2,747 3,371 3,541 3,555 4,064 4,704 4,880 5,528 5,117 5,039 4,915 6,226 6,624 8,248
16,812 21,192
118,004
1,585. 3,199 4,170 4,506 3,855 3,955 4_832 5,024 5,034 5,584 6,348 6,229 6,881 6,3EO 6,228 5,936 7,259 7,693 9,401
17 ,680 21,994
143,773
--~--
1954- July-Dec.ember ........... ; 2 13
6 81955 •••••••••••••••••••••• : 8 2
2 1 18 82 100111956 •••••••••••••••••••••• : 15 35 65 1002 4 9 11 411957 •••••••••••••••••••••• : 17 59 1001 4 5 71958 ••••••••••••••••• '" •• : 19 34 66 1001 4 21959 •••••••••••••••••••••• : 19 6 J2 68 1001 3 4 41960 •••••••••••••••••••••• : 21 31 69 1001 3 2 3 30
1962 •••••••••••••••••••••• : 20 -1 3 4 4 30 70 100 1951 •••••••••••••••••••••• : 17 9/ 2 70 100
31963 ••••••••••••••••••••• 0.: 21 1 2 3 2.1 29 71 100
1964 ••••••••••••••••• '" •• : 19 2 2 1
3 3
2.1 21 27 73 10011965 •••••••••••••••••••••• : 15 21 26 74 1003 1 31966 •••••••••••••••••••••• : 12 3 1 2 1
78 10021 21 22 1967 •••••••••••••••••••••• : 12 J 1 3
80 1001 20 1968 •••••••••••••••••••••• : 10021 1 20 809 6 1969 •••••••••••••••••••••• :
2 2 21 2/ 19 81 1006 7 2 2 NA 17 831970 •••••••••••••••• '" ••• : 1004 6 2 1971 •••••••••••••••••••••• :
2 21 14 86 1002 7 2 21972 •••••••••••••••••••••• : 86 1001 147 3 -I1973 •••••••••••••••••••••• : 2.1
1 3 1 21 12 88 100
1974 •••••••••••••••••••••• : 2 1 5 95 10021 1 1955-74 and July-December: 96 100
1 91 4 1954 ••••••••••••••••••• : J
18 82 100
NA" Not: available. 1.1 Authoriz-ed by Title I, P.i.-.---480.--11 Shipments under agreements signed through nee. 31, 1966, authorized by Title IV, P.L. 480. Shipments-under agreements signed ft'om J8n~67J authorized by Title I, P.L. 480, 88 attIended by P.L. 89-808. 21 Authorized by Title II. P.L. 480. !il Authorized by Sec. 416 of the Agricultural Act of 1949 and Sec. 302, Title III, P..L. 480 through Dec. 31, 1966. Authorized by Title II, PooL. 480, as emended by PooL. 89-808, effective Jan. 1, 1967. 2./ Authorized by Sec. 303, Title III, P.L. 480, and other legislation. InclUdes some shipments in exchange for goods and services for U.S. agencies before 1963. &..1 Sales for foreign currency, economic sid, and expenditures under development loans authorized by P ..L. 's 165, 665, and 87-195. 11 I'TQtal agricultural exports outside specified Goverrunent" programs" (sales for dollars) include in addition to unassisted commercial transactions, shipments of some commodities with governmental asaistance in the form of (0 barter- shipments far OVl!rseas procurement for U.S. agencies; (2) extensi!JD of credit and credit guarantees for relatively short periods; (3) sales of Government-owned commodities at less than domestic market pric.es; and (4) elI;port payments in cash or in kind. ~I Includes shipments only for July-December 1970. 2/ Less than one-half percent.
''-'
~ >p- { '<' . ~~--~~=-,~4t!:~'":';;:,'~·............ .,.."-·
l
~ '~".'~·--:: '': -rr~.l'" ~ .. ~ , ',. '"':-"."":';':;1 ;",~,-.", ',~~;:::.,,;-,w:;~[· ";, ')P"~,,,:,-,,,:··~:~e, ':'~~/:~.';'
~ JS t>
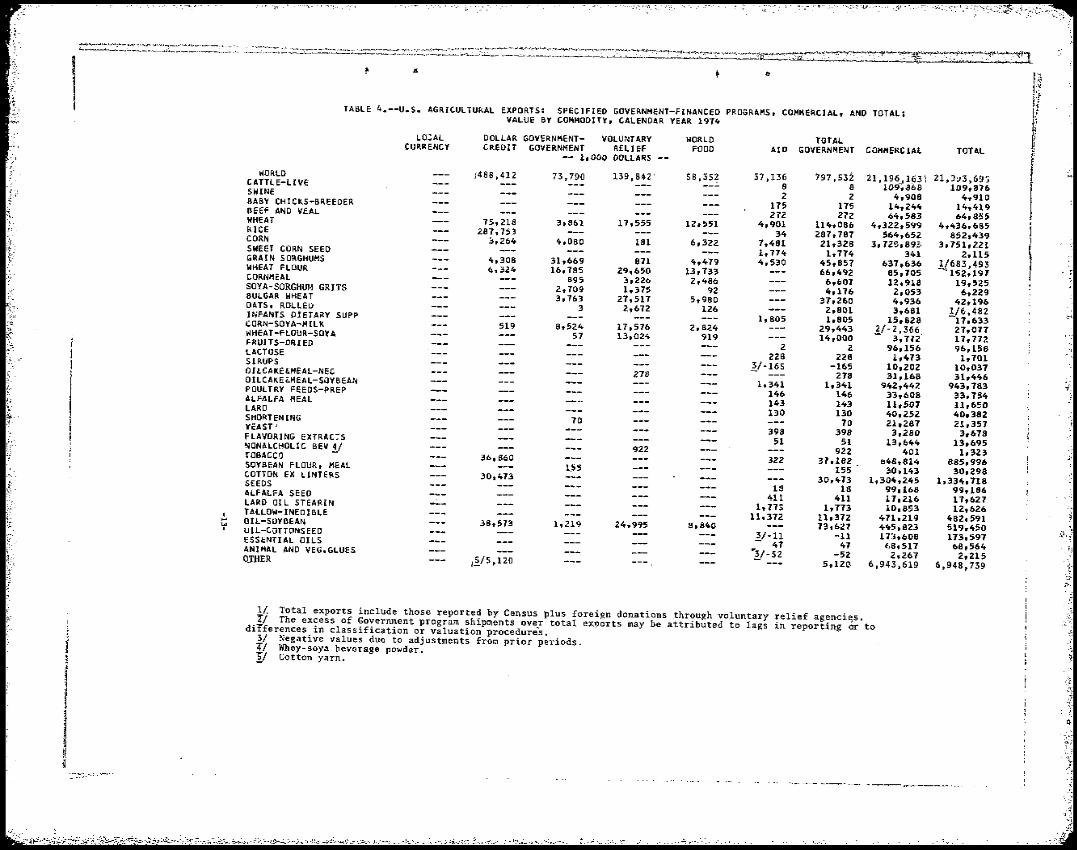
I TABLE 4.--U.S. AGRICULTURAL EXPORTS: SPECIFIED GOVERNMENT-FINANCED PROGRAMS, COMMERCIAL, AND TOTAL; VALUE BY COMMODITY, CALENDAR YEAR 1914
LO:AL DOLLAR GOVERNMENT- VOLUNTARY WORLD TOTALCURRENCY CREDIT GOVERNMENT RELIEF FOOD AID GOVERNMENT COMMERCIAL
-- 1,000 DOLLARS
WORLD {488,412 73,790 139,842\ 58,352 37,136 797,532 21,196~163\CATTLE-LIVE 8 8 109,868SWINE 2 2 4,908BABY CHICKS-BREEDER 115 115 14,244BEEF AND VEAL 272 272 64,583WHEAT 15,218 3,861 17,555 12,551 4,901 114,086 4,322,599RICE 281,153 34 281,781 564,652CORN :;J,264 4,080 181 6,322 1,481 21,328 3,72S,89E.SWEET CORN SEED 1,174 1,174 341GRAIN SORGHUMS 4,308 31,669 811 4,479 4,530 45,857 631,636WHEAT FLOUR 1>,324 16,785 29,650 13,133 66,492 85,705CORNMEAL 895 3,226 2,486 6,601 12,918SOYA-SORGHUM GRITS 2,709 1,375 92 4,176 2,053BULGAR WHEAT 3,763 21,517 5.980 31,260 4,936OATS, ROLlEIi 3 2,612 126 2,801 3,681INFANTS DIETARY SUPP 1,805 1,805 15,828CDRN-SOYA-MllK 519 8,524 17 ,576 2,824 29,443 2/-2,366WHEAT-FlOUR-SOYA 57 13,024 919 14,000 - 3,712"FRUITS-DRJ ED 2 2 96,156lACTOSE 228 228 1,413SIRUPS ~/-165 -165 10,202OILCAKE~HEAL-NEC 278 278 31.168OILCAKE~MEAL-SOYBEAN 1,341 1,341 942,44'?'POULTRY FEEDS-PREP 146 146 33,608ALFALFA HEAL 143 1103 11,507LARD 130 130 40,252SHORTENING 70 70 21,281YEAST' 398 398 3.280FLAVORING EXTRAC;S 51 51 13,644NONALCHOLIC BEV 4/ 922 922 401TOBAcca 36,860 322 31,182 a48,814SOYBEAN FLOUR, MEAL 1,55 155 30,143COTTON EX LINTERS 30,413 30,473 1,304,245SEEDS IS 18 99,168ALFALFA SEED 411 411 11,216LARD OIL STEARIN 1,71:; 1,113 10.8!:i3TALLOW-INEDIBLE .... I 11,312 11,312 471.219OIL-SOYBEAN 38,573 1,219 24,995
I 8,840 13,6Z1 445.823'" OIL-COTTONSEED 3/-11 -11 In,608ESSENTI AL OILS - 41 41 ~,8,517ANIMAL AND VEG.GLUES ~y-52 -52 2.261OJ'HER IY5,120 5,12(1. 6,943,619
11. Total exports include those reported by Census plUS foreign donations through voluntary relief agenci~s.~/ The excess of Government program shipments over total exuorts may be attributed to lags in reporting or to
l diFferences in classification or valuation procedures.
3/ Negative values due to adjustments from prior periods.4/ Whey-soya beverage powder.I/ Cotton yarn.
TOTAL
21,3£13,69:; l09,8U.
4,910 14,419 64,855
4,436,685 852,439
3,751,221 2,115
1/683,493 -'152,197
19,525 6,229
42,196 1/6,482 -11,633
21,017 11,172 96,158
1,101 10,031 31,4106
943.183 33.154 11,650 40,382 21,351 3,678
13,695 1,323
885,996 30,298
1,33..,118 99,186 11,621 12,626
482.591 519,450 173.591 68,564
2,215 6,948,739
, :~ " "
~~ i .:~
~;. '3
.;
',t;
u ;.::;>:!..~,-=,"~----
;:' •• <.,,;:1 .~,•.. , ;\~J~,i:::...._~\'''o·, :<,~",,:~",--., ""'~ ,~."-.'

I- ·~·--~l
I I,
TABLE 5.--U.S. AGRICULTURAL EXPORTS: SPECIFIED GOVERNMENT-FINANCED PROGRAMS. COMMERCIAL. AND TOTAL; QUANTIT~ BY COMMODITY, CALENDAR YEAR 1974
LOCAL DOLLAR GOVERNMENT- VOLUNTARY iWORLDCURRENCY TOTAL iCREDIT GOVERNMENT RELIEF FOOD AID GOVERNMENT COMMERCIAL-- THOUSAND UNITS TOTAL WORLD
CATTLE-LIVE NOSWINE NO
20~BABY CHICKS-BREEDER NO * * 204 BEEF AND VEAL * .* 16 16LB 146WHEAT 146 10,616 lQ,762au 16,Oll 533 533 50.063RICE 174 3,285 50,5962:,592CORN LB 1,239,855 10190 23,852 899,607 923,~59BU 981 1,291 179 1,240,034 2,563.892SWEET CORN SEEO LB 49 1,8~3 2,810 7,a04
3,803.9261,166,262GRAIN SORGHUMS 1.173,266BU 3,347WHEAT FLOUR CWT
1,575 10,268 303 1.538 1,749 3,347 362 3,709
CORI'.:MEAL 565 1,359 2,451 15.433 208,905 Y224,338CWT It!46 5,521 8,988'SOYA-SORGHUM GRITS 112 415 14.509LB 315 8.~_28ULGAR wHEA T 24,953 12,364 \850 1.667 2,509L8 38,167OATS, ROLLED 31,887 257,813 10,306' +8,473L8 61,188 350,888INFANTS OIETARY SUPP 26 23,013 1.101 41'.215 392.103LB 24,200 28,973CORN-SOYA-MILK 1/53,173LB 2,211WHEAT-FLOUR-SOYA LB
3,942 51,985 139,643 24.047 2,271 20,925 - 23.196
219,617 y-3~,236'FRUITS-DRIED LB 438 'H,942, 6,579 187.381 LACTOSE 131;315104,959 ' 26.356LB 3 .3SIRUPS 207.140 207.1~3LB 1,330 1,330 6.845
~..- -243 23,497 DILCAKEtMEAL-NEC STN 3/-243 8,175 OILCAKE&MEAL-SDYBEAN STN 1 23,254
1 91 ALFALFA MEAL
STN 6 6 5,355 5,361 POULTRY FEEDS-PREP 92
STN 1LARD 137 138LB 1 1 1SHORTENING 101 102L8 379222 379 161·.~96LB 222 52,333 52,555
YEAST 161.385 FLAVURING EXTRACTS GAl. 826 1126NONALCHOLIC 8EV,4/ GAL 8.839 9,6;;'~2TOBACCO - 248 2 1,489 1,491LB r29,193 248SOYBEAN FLOUR. MEAL 589LB 271 29~464
34i' 880 660,863COTTON Ex LINTERS 690,321RBA
SEEDS 88 880 290,955 2910835LB
I88ALFALFA SEED 5.082 5,170L8 11LARD OIL STEARIN 11 298,000 298.011LB ~-- 429
I TALLOW-INEOIBLE 429 15,209· -15..-638LB 1.058 7.058... OIL-SOYBEAN ~2,713 49,771 """ 01 L-COTTO/~S EED LB 65,921 22,679 2,~20,999I
LB 122,858 3,876 51.407 57,407 2.363,592 ESSENTIAL OILS 1,67+.1+7215,334 1,458,813NA
-,3/-48 -48 609,996 iANIMAL AND VEG.GLUES 609.9+8LB , '~-..-"I ~ :-.... ~ .
y-127 -127 4.213 4.086 I ~ ~ ~,
* Less tha~ 500.
1/ Total exports inclUde those reported by Census plus foreign donations through voluntary7/ The excess of Government program shipments over total exports may be attributed to lagsdifferences classification procedures. relief agencies.
in reporting or to!/3/ Negative
Whey-soyaquantity
beverageduepowder.
to adjustments from prior periods. ~ lJ
( w .. "%';-~·"""7-r::·,..t:: t '-':-:~'-""""''''<r-'!t7.r'"
"~'.'''''''''~t'='~.'tt:::::,:;::~~~~~.::<M''_~'_
__
:~'::'".,",~,,-j.-;"'-~ ,'- > '"" ..-:.-.' ~r:.~ ,r~ : ~~ :':?';~'f~~' ~;.: ./:' -'~'::~-'. :~:" ? ---r· ·t··"~)~~~!~.;..~"-;,~":,~,:r:.~:,:;",.·.:;,~·:·,I' '· ..~c >I; , ....""..{-. ':~-:".''1~.-~.~'"' ~'.;";'> .~""~-::L::'.~~t~;::~?"f"F :0:~'/r~~;,' "~.'.,:!,-•.:f' ;';::''',.:;l-<,,::t,~· ;r:? :'"1:b:::~·i''T;-i'.~:'
"l
.;;':-'j
.,~;
::::;::::::..~,:~;,e:'-
<. '--<'-~~ ='~'~_m= '~=<mm="<_·=-·~""=t""""'=="'",,=M" "'~O=== ,.""'"",,, , _J'
.<!,.';,,,.:", .....:...!.; .-"-' ,,::'1:

~.~cv-·:, ;'''':''.' :,~~~".';'/';>: ;,- "'~'i": ,(~'1" ...'~,y.,
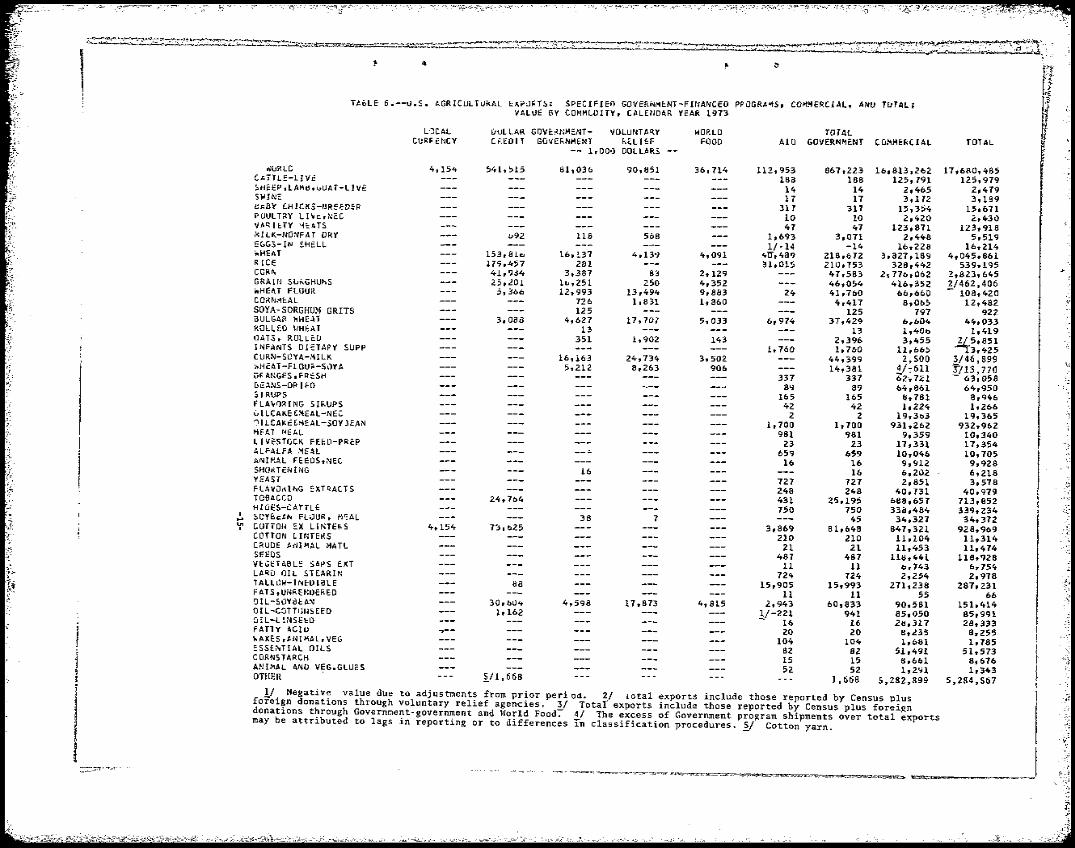
r----"" I TABtE ~--U.S. AGRICULTURAL EXPORTS: SPECIFIEO GOVERNMENT-FINANCED PROGRAMS, COMMERCIAL, i UUANTITY BY COMMODITY, CAlENOA~ YEAR 1973
LOCAL uOllAR GOVERNMENT- VOlUNT~RY WORLD TOTALCURRENCY C~EDIT GOYE~NMENT RELIEF FOOD AID GOVERNMENT COMMERCIAL TOUL-- THOUSAND UNITS WORl!') : ~
CATTLE-LIVE: NO 5HEfP.lAMij,~OAT-LIVE NO 273* * 273 ~SII'INE NO 1 1 203 204 bABY CHICKS-B~cEuER NO 17 17* * PCULTRY LIVE,NEC LB 248 248 11,609 I1,B57VMlfTY ME.4TS Ul 25 25 6,211 6,236M I LK-NOI.FAT DRY LR 121 121 281.759 281,8801,975 352 1,712EGGS-IN SHeLL DOl 5,956 9,995 7,740 17,735 '" ~
HH::AT BU 1/-7 -7 14,842 14,83550,351 5,715 l,4B9RICe 1,310 10";949 69,814LB 1,111,),20u 2,200 1,306,011 1,375,825 CO~N BU 20,035 747
28t.,800 1,399,200 2,194.510 3,593,7101,217 39GQAIN SORGHUMS BU 13,156 6,026 128 1,921 22,038 1,2B2,B35 1,304,873
WHF.AT fL'JUR CWT 934 21,23! 199,144 2/22.0,375 "'t
e'JRNMEAL CWT 2,129 2,038 1,605 4 6,710 9,907 =-. 16,617 c;:
105 309 331SOrA-sOR9~UM GRIts LB 1,300 745 1.764 2,509t3UlGAR WHEt,! LII 1,30049,!>55 63,854 229,084 63,012 13.96j 15,263POLLED WH~AT LB 198
115,300 520,805 60,527 581,332OATS. RulLED LB 198 7,931 8,1294,518 23,825 1,856INFANTS DIETARY SUPP LS 30,199 52,117 2/82,316COll.N-SOYA-"'llK LB 2,421 2,427 15,979 - 18,406108,379 194,614 24,991WHEAT-FLOUR-SOYA Lo 327,984 3_2,81\045,481 3/360,82473,244 7,B84uRANGES,FR':SH LB 126,609 ry-9,rs3 ~"3'/1l7,4563,370bEANS-DillED LB 3,370 018,152 --621,52:!"SliWPS LB 504 504 411,976 412,480FlAI/ORING SIRUPS LB 243 243 11,002 11,245OllCAKEGMEAL-NEC STN 72 n 2,060 2,132UILCAKE&MEAL-SOYBEAN STN 208 20B* * MEAT MeAL STN 8 8 4,1158 4,B66LIVESTOCK FEED-PREP STN 7 7 60 67ALFALFA M~AL STN * ... 49 49ANIMAL FEEDS,NEC STN 11 11 150 161SHORTENING lB 85 85114 * * YEAST LB 114 25,090 25,204FLAVORING tXTRACTS GAL 2,266 2.266 8,644 10,910TOBACCO lB 21,970 14 14 2,256 2,270
r HIDES-CATTLE NO 395 22,371 616,049 638,420... SOY~EAN FLOUR, "'EAL LB 40 40 17,4700-r 275 50 17,510
COTTuN EX lINTERS RBA 325 296,52232 422 296,847COrrON LINTERS RBA 30 484 5,011 5,495CF<UDE ANIIML MATl NA 6 6 310 316SEEliS --lB VFGFTABlE SAPS EXT LB 2,003 2,003 B6,176 8B,179LARD OIL STEARIN LB 137 137 8,243 6,3BOTALlm;-INEOIBLE LB 551 7,847 7,841 12,385 20,232FATS,UNRcNDEl(fO 155,506lB 156,057 ,,007,159 2,163,216OIL-SOYBEAN LB 122 122 434 556179,0'+3 21,654 85,116Oll-CuTTO;~SEEO LB 7,048
24,231 22;638 333,282 634,150 967,432OlL-lI NSEED LB .!.I-l,700 5,348 540,675 546,023FATTY ACID LB 76 76 212,536 212,614WAXES,ANIHAL,VEG lB 83 83 31,312 31,395ESS1:.NTUL OILS NA 173 173 2,2b2 2,435CORNSTARCH LB ANIMAL AND VEG.GLUES LB 123 123 69,098 69,221
127 121 3,519 3.6'>6 . ~ Less than 500_ 1/ Negative quantity due to adjustments from prior periods. 2/ Total exports include those reported
by Census plus foreign donations through voluntary relief agencies. 3/ Total exports include those reported by Census plus foreign donations through Government-government and World Food. -4/ The excess of Government program shipments over total exports may be attributed to lags in reporting or to differences-in classification procedures.
\I. 10 ~ '-~';;-·~';·-=~;"1!'",,:""·~"r"1·
~-~C;::'::""C~~---"'_'.N~
(;0 ',-J.,J.,;,:,t..\',~, "~ .• ;',....'.fi:"'.'.( ...'" ~;,., '.."; , , -.;'"

Tabl~ 8.--Barter: Shipments under contracts for overseas procurement for U.S. agencies, calendar years 1973 and 1974 ~/
ValueQuant~ty
COllIlllodity : Unit 1974 197419731973
Million dollars
Million Thousands Thousands .!!21l.!ru.
79.7 Tote.'! ....................... : --
874.0
49.021,878Wheat (60 lb.) .............. :Bu. 48.926,099Barley (48 lb.) ............. :do. 100.8453,878corn (56 lb.) ............... :do. 49.526,550Grain sorghums (56 lb.) ••••• :do. .196Oats ........................ :do. :J.I 75.16,179Rice ........................ :cwt. 1.1292Wheat flour ••••••••••••••••• Ido. 1.2 Tallow ...................... ILb. ?j435,955 6,002 51.6
73 1.718,314Grease •••••••••••••••••••••• :do. 6.8 Tobacco, unmanufactured ••••• :do. 119,381 5,928 144.4
302.4 71.73921,939Cotton •••••••••••••••••••••• :Rbale: 29.6193,552cottonseed oil •••••••••••••• :Lb. 19.8154,176Soybean oil ••••••••••••••••• :do•.. 1f Authorized by the Charter Act of the commodity Credit corporation and other 1egis1stion. ~/ Less than $50,000.J/ Excludes $2,000 to Guam in 1973 since shipments to U.S. Territories are not included in U.S. exportS.
Table 9.--U.S. credit sales of sgricu1tura1 commodities: value by commodity, calendar years 1973 and 1974 1/
Export-Import Bank Tota 1 creditCCC Creditloans and medium- salessales
commodity term guarantees 21 1973 19741973 19741973 1974
-- l:1ill1!m ~ - 992.7 261.5
913~3 182.179.4 79.4 it ......................... :Total
59.2 522.8 69.2522.8Wheat .................... : 10.110.1Barley ••••••••••••••••••• : 33.8168.2168.2 33.8Corn ...................... : 1.6 .91.6 .9Grain sorghums ••••••••••• : 4.94.9 10.910.9Rice ••••••••••••••••••••• : 14.914.9Wheat flour ............. -: 101.325.2 232.0152.679.4 76.1Cotton ••••••••••••• '" ••• : 41.33.3 12.1 38.0 12.1 Tobacco •••••••••••••••••• : 14.714.7Soybean oil •••••••••••••• : 5.05.0cottonseed oil ••••••••••• : 7.67.6Linseed oil •••••••••••••• : 1.51.5Tallow, inedible ••••••••• : 1.41.4Cattle, live ••••••••••••• :
1f Credits for relatively short periods repayable in dollars plus interest (covering the financing costs of the
lending agency).~ Includes disbursements by the ~port-Import Bank and disbursements by U.S. commercial banks under Export-Import Bank medium-term guarantees against political and/or financial risk.
-17
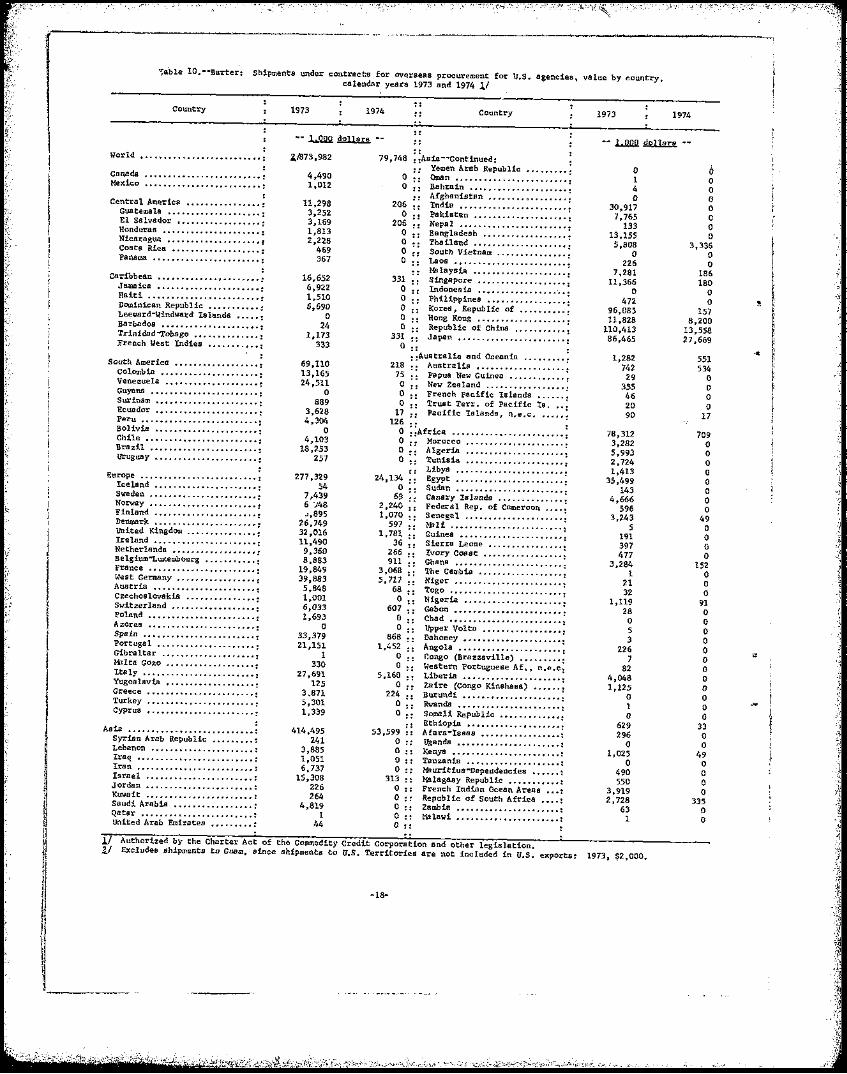
":ab1e 10.--Barter: Shipments under contracts for overseas procurement for U.S. agencies, value by country, calendar years 1973 snd 1974 11
country 1973 1974 Country 1973 1974
World •••. 1 •••••••••••••••••••••• :
Canada ......................... ; Mexico ............................................. :
Central America ................ ; Gua temsla .................... : E1 Salvador .................. : Honduras ..................... : Nicaragua .................... I Costa Rica ................... : Panams ....................... :
caribbean ...................... ; Jamaica ...................... : Haiti ........................ : Dominican Republic ••••••••••• : Leeward-Windward Islands ••••• : Barbados ..................... : Xdnidad-Tobago .............. : J1rench West Indies ........... :
South America ................. -: Colombia ..................... : Venezuela ........................................ : Guyana ....................... : Surinam ...................... : Ecuador ...................... : Peru ......................................... : Bolivia ...................... : Chile ........................ : Brazil ....................... : Uruguay ...................... :
Europe ................. ~ .............................. ; Iceland ...................... : Sweden ........................................... : Norway ....................... : Finland ...................... : Denmark ...................... : United Kingdom ............... : Ireland '" ................... : Netherlands .................. : Belgium"Luxembourg ••••••••••• : France .............................................. : West Germany ................. : Auatria ...................... : Czechoslovakia ............... : Switzerland .................. : Poland ....................... : Azores .............................................. : Spain ........................ : Portugal ..................... : Gibraltar .................... : MIlta Gozo ................... : Italy ........................ : Yugoslavia ................... : Greece ............................................. : Turkey ................................ : Cyprus .............................................. :
Asia ........................... ; Syrian Arab Republic ••••••••• : Lebanon ...................... : Iraq ......................... : Iran ......................... : Israel ....................... : Jordan ....................... : Kuwait ....................... : Saudi Arl\bia ................. : Qatar ........................ : United Arab Emirates ......... :
l1873,982
4,490 1,012
11,298 3,252 3,169 1,813 2,228
469 367
16,652 6,922 1,510 6,690
o 24
1,173 333
69,110 13,165 24,511
o 889
3,628 4,304
o 4,103
18,253 257
277 ,329 54
7,439 6 ')48 ~,895
26,749 32,016 11,490
9,360 8,883
19,849 39,883
5,848 1,001 6,033 1,693
o 33,379 21,151
1 330
27,691 125
3,871 5,301 1,339
414,495 241
3,885 1,051 6,737
15,308 226 264
4,819 1
44
79,748 : :Asia--Continued: : : Yemen Arab Republic ......... :
0 •• Oman ........................ : 0.. Bahrain ..................... :
206 o
206 o o o o
331 o o o o o
331 o
218 75 o o o
17 126
o o o o
24,134 o
69 2,240 1,070
597 1,781
36 266 911
3,068 5,717
68 o
607 o o
868 1,452
o o
• • Afghanistan ........ ,. ....... . •• India ....................... ; •• Pakistan .................... : •• Nepal ....................... . • • Bangladesh .................. : .. Thailand .................... ; .. South Vietnam ............... . .. Laos ........................ ; •• MIlaysia .................... : .. Singapore ................... :
Indoneaia ................... . : : Philippines ................. ; .. Korea, Republic of ......... .. • • Hong Kong ................... : •• Republic of China ........... : •• Japan ....................... :
: :Austra1ia and Oceania •.••••••• : Australia ................... .
: : Papua New Guinea ............ : .. New Zealand ................ ..
French Pscific Islands . • • Trust Xerr. of Pacific Is. • •• " Pacific Islands, n.e.c. •
;;Africa ........................ : · . Morocco # ~ ~ , " " , , " , •••• " •• " ••••
.. Algeria .................... .. •. Tunisia ..................... : •• Libya ....................... : •• Egypt ....................... . •• Sudan ....................... : .. Canary Islands ............. .. .• Federal Rep. of Cameroon .. Senegal ................ ".... ,
:: :~!e~'::::::::::::::::::::::: · . Sierra Leone ..... ".... ".... ,,_ • • Ivory Coast ................. ; •• Ghana ....................... : • • The Gambia .................. : •• Niger ....................... : •• Togo ........................ : :: Nigeria .................... .. •• Gabon ....................... . •• Chad ........................ ; .. Upper Volta ................. : •• Dahomey •• "••• "" •••••• " •••• ,,": :: Angola ..................... .. .. Congo (Brazzsville) ......... : ." Western Portuguese Af., n.e.c.
5,160 o
224 o o
., Liberia ..................... ;
.. Za ire (Congo Kinshass) ...... : •• Burundi ..................... : •• Rwanda ...................... : .. Somali Republic ............. : • • Ethiopia .................... :
53,599 .. Afars-Issas ................. : 0.. Uganda ...................... : 0 .. Kenya ....................... : o .. Tanzania." ....... " . ", ..•.... : o .. Mauritius-Dependencies •••••• :
313 •. MIlsgasy Republic ........... : o .. French Indian Ocean Areas ••• : 0.. Republic of South Africa .... : 0 .. Zambia ...................... : 0 .. MI1swi ...................... : o ..
o 1 4 o
30,917 7,765
133 13,155
5,808 o
226 7,281
11,366 o
472 96,085 11,828
110,413 86,465
1,282 742 29
355 46 20 90
78,312 3,282 5,993 2,724 1,413
35,499 143
4,666 596
3,243 5
191 397 477
3,284 1
21 32
1,119 28 o 5 3
226 7
82 4,048 1,125
o 1 o
629 296
o 1,025
o 490 550
3,919 2,728
63 1
o o o o o o o o
3,336 o o
186 180
o o
157 8,200
13,558 27,669
551 534
o o o o
17
709 o o o o o o o o
49 o o o o
152 o o o
91 o o o o o o o o o o o o
33 o o
49 o o o o
335 o o
...
11 Authorized by the Charter Act of the Commodity Credit Corporation and other legislation. 2.1 Excludes shipments to Guam, since shipments to U.S. Territories sre not included in U.S. expo>:ts: 1973, $2,000.
-18

••••••••••••••
••••••••••••••••
---
."~~-"'""",-,,,,-,,,.»..,,,,,,,..¢ __....__..i..._________
Table 11.--U.S. credit sales of agricultural commodities: Value by country, calendar years 1973 and 1974 11
Export-Import Bank loans CCC Total
and Credit credit Country medium-term sales sales
guarantees 1:.1 1973 1974 1973 1974 1973 1974
1,000 dollars
World . . . ............... . .. . ... . . ... . .. 79,405 79,439 913,299 182,084 992,704 261,523
Central America •••••••••••••••••••••• 2,863 840 2,863 840 Guatemala •••••••••••••••••••••••••• 1,140 1,140 Nicaragua ••••••••••••••••••••••••• : J,723 840 1,723 840,
Caribbean ••••••••••••••••••• * •••••••• 7,745 7,745 Jamaica ••• (I ••••••••••• 41 ••••••••••••
Dominican Republic , ••••••• , ••••••• : 7,061 7,061 Netherlands Antilles •••••••••••••• : 519 519'" French West Indies ••••••••••••••••• 165 165
South America •••••••••••••••••••••••• 75~184 41,931 75,184 41,931 C~lombia ••'•••••••••••••••••••••••• : Ecuador ••• '•••••••••••••••••••••••• : 211 211 Peru •••••••••••••••••••••••••••••• : 51,443 15,000 51,443 15,000 Bolivia .... ,.... ., •••••••••••••••••••• II
Chile •••••••••••••••••••••••••••••• 23,530 26,931 23,530 26,931 Brazil ••••••••••••••••• a •••••••••••II Uruguay •••.•••••••••••••••••••••••• :.
tl Europe ••••••••••••••••••••••••••••••• 3,292 546,578 62,982 546,578 66,274 Iceland •••••••••••••••••••••••••••• Sweden •••••••••••••••••••••••••••• : 89 89
ij Norway •••••••••••••• CI 3,803 603 3,803 603 Denmark ••••••••••••••••••••••••••• : United Kingdom ......................: 22,476 22,476
t Ireland ••••••• ' ••• 0 3,292 3,928 3,928 3,292 ~ Netherlands ••••••••••••••••••••••• : 1,519 1,519
I !, Belgium-Luxembourg ••••••••••••••••• 1,772 1,772 ~ France •••••••••••••••••••••••••••• : 845 845
West Germany •••••••••••••••••• ~ •••• Hungary ••••••••••••••••••••••••••• : 1,375 1,375
'f{
Poland ••••••••••••• ~ ••••••••••••• Q: S~7 , 358 2,221 57,358 2,221 USSR ••••••••• y •••••••••••••••••••• : l;11,533 20,000 411,533 20,000 Malta-Gozo •••••••••••••••••••••••• : 171 171 Yugoslavia •••••••••••••••••••••••• : 6,722 6,722
I....
Greece •••••••••••••••••••••••••••• : 31,300 31,300 Romania •••••••••••••••••••••••••••• 26,082 15,910 26,082 15,910 Cyprus ••••••••••••••• 0 ••••••••••••• 1,853 1,853
Asia •••• e ••••••••••••••••••••••••••• : 79,405 76,147 246,796 63,596 326,201 139,743 ~ Iran ••• ~ ••••••••••••••••••• ---" 30,149 30,149Q •••••• :t
I Israel •••••••••••••••••••••••••••• : Jordan •••••••••••••••••••••••••••• : 3,980 3,980 Saudi Arabia •••••••••••••••••••••• : Pakistan •••••••••••••••••••••••••• : 33,463 33,463 Sri Lanka (Ceylon) •••••••••••••••• : 14,894 14,894
I Thailand •••.••••••••••••••••••••••• : 16,928 3,451 16,928 3,451 Malaysia •••••••••••••••••••••••••• : 3,044 3,044 Philippines ••••••••••••••••••••••• : 38,183 3,973 38,183 3,973 Korea, Republic of ••••••••••••••••• 116,506 19,665 116,506 19,665
Continued-
-19

Table 11.--U.S. credit sales of agricultural commod1t1es: Value by country, calendar years 1973 and 1974 l/--Con.
Export-Import Bank loans cee Total
and Credit credit Country medium-term sales sales
guarantees y 1973 1974 1973 1974 1973 1974
1,000 dollars
Asia--Continued: Hong Kong ••••••••••••••••••••••••• : 1,754 1,754Republic of ehina ••••••••••••••••• : 163 163 Japan ••••••••••••••••••••••••••••• : 79,405 76,147 24,239 103,644 76,147 I , !
Australia and Oceania ••••••••••••••• : 2,614 2,614 tAustralia ••••••••••••••••••••••••• : 2,614 2,614
tAfrica •••••••••••••••• & ••• 0 ••••••••• : 34,133 10,121 34,133 10,121Morocco .•.•.•..•...•....•...•...... Algeria •••••••••• 0 •••••••••••••••• :
Tunisia ••••••••••••••••••••••••• 8.: Egypt •••••••••••••••••••••••••••••. 2,676 6,312 2,676 6,312Sudan ••••••••••••••••••••••••••••• : 12,602 12,602 I Ghana ••••••••••••••••••••• & ••••••• : 3,385 3,385Angola •••••••••••••••••••••••••••• : Zaire (Congo-Kinshasa) •••••••••••• : 6,030 6,030Republic of South Africa ••••••••••. 9,440 3,809 9,440 3,809
1/ Credits for relatively short periods repayable in dollars plus interest (covering the financing costs of the lending agency).
1/ Includes disbursements by the Export-Import Bank and disbursements by U.S. commerical banks ~under Export-Import Bank medIum-term guarantees against political and/or financial risk.
-20-·

Table 12;--Leading markets for U.S. agricultural exports, calendar years 1973 and 1974
: :Commercial Government-Country sales for : : Country financed
dollars 1/ · · ·.. exports
· · · .. .. : :Million Million: :dollars dollars· ·..1973: ::1973:
Japan .. .. .. .. .. .. .. .. .. .. .. .. .. .. .. .. .. .. .. ... 2,998 : : South Vietnam ................ : 156 Netherlands ••••••••••••• : 1,241 : : Korea, Rep. of .................. 96· West Germany •••..••..••. : 1,181 : : Indonesia ............................ 76· Canada .................................... : 1,034 : : Cambodia (Kbmer Rep.) .. 72· tJSSR ........................................ : 920 : : Bangladesh 60.......... II ............ :
Ita ly .................................... : 674 · Pakistan 53.. .................. C'I ...... : ·..United Kingdom •••••••••• : 616 : : Israel ................................ : 50 .Peoples' Rep. of China •• : 575 ·. India .. .. .. .. .. .. .. .. " ................... 45·.
Korea, Rep. of •......•.• : 539 : : Philippines ........................ 37· Spain ................... : 462 : : Portugal .............................. 21· · ·..1974: ::1974: Japan ...................... 3,479 : : South Vietnam " .................. 200 i· Netherlands •.••••••....• : 1,604 · Cambodia (Khmer Rep.) .. 172·.. · fwest Germany •••...•••..• : 1,589 ·. India 62.................... flo .............. ·. · Canada •••••••••••••••••• : 1,280 : : Bangladesh .......... " ..............· 38 I Mexico •...............•• : 863 · ·.. Pakistan ..............................· 34 !Ita ly ................... : 763 · Morocco ............................... 23·.. · Korea, Rep. of •••••••••• : 726 ·. Indonesia ............................ 23·. · Spain ................... : 711 · ·.. Egypt .................................. ·" 20 I United Kingdom •••••••••• : 655 : : Korea, Rep. of ................ : 17 ! Peoples' Rep. of China •• : 653 · Niger .. .................................. 14·.. · ·.· .
1/ Not adjusted for transshipments.
-21
·. ,,:'. ".:f"'~' .'<~ ,.---.,:~:~" ';'., '~:. -,'>" <. '"~~'~5~~'::"
•..•_ ..~_,d_"_","_.' ,_, ~.~ ••______ ~ ... _~ -<- -_.,- "\'~-~"-"'.--"-~'-",----_...-""
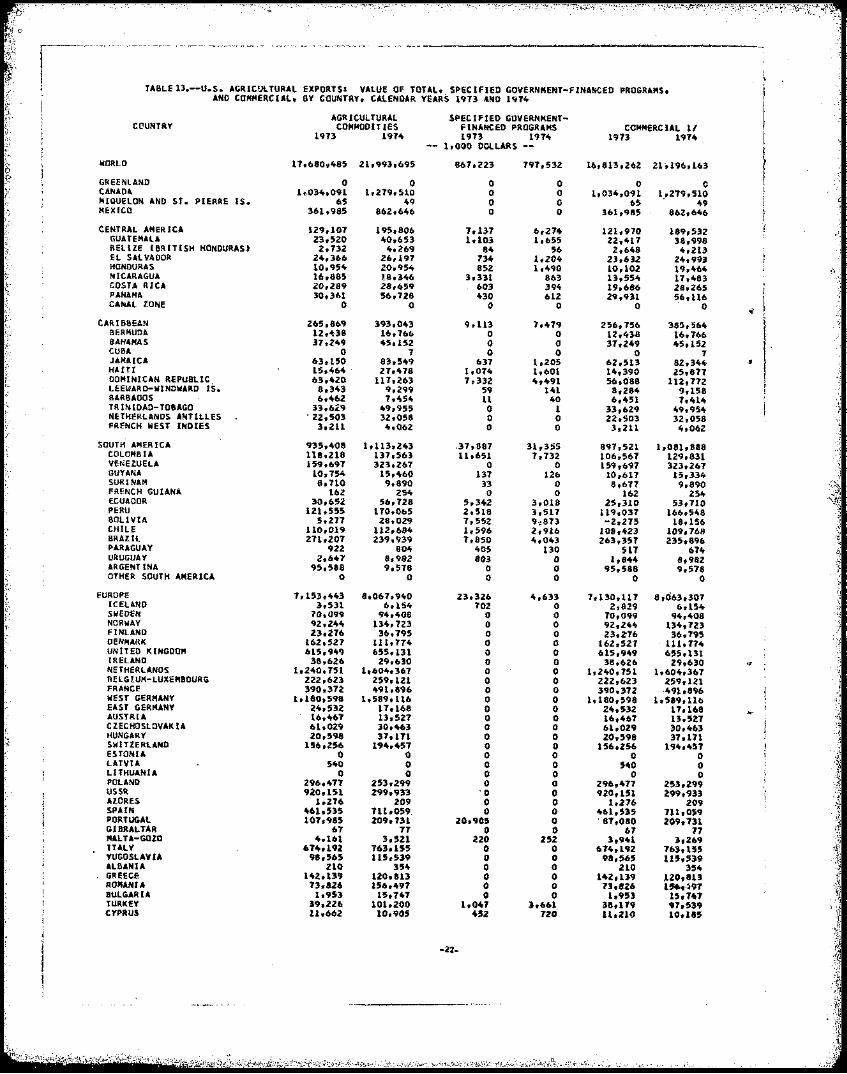
t1 TA8LE 13.--U.S. AGRICULTURAL EXPORTS: VALUE OF TOTAL, SPECIFIED GOVERNMENT-FINANCED PROGRAMS,
AND CO""'ERC lAl, 8Y COUNTRY, CALENDAR YEARS 1973 AND 1974 I AGRICULTURAL SPECIFIED GOVERNMENT-
C()UNTRY COMMODn IES fiNANCED PROGRA"S COMMERC IAL 11 I 1973 1974 1973 1974 1973 1974 I1,000 DOlLARS
WORLD 17.b80.485 21.993.b95 8b7.223 191.532 16.013,2b2 21;196,163
GREENLAND 0 0 0 0 0 0 ICANADA 10034.091 1,279.510 0 0 1,03.. ,091 1,,2'79,510 ! IHQUELON AND ST. PIERRE IS. 65 .. 9 0 0 65 49MEXICO 361,985 862,6"6 0 0 361,985 862,6"b
CENTRAL AMERICA 129,107 195,806 7.137 6,274 121,970 189,532GUATE"AU 23,520 40.653 1,103 1,655 22,417 38,998BELIZE (BRITISH HONDURAS. 2.132 4.269 84 5b 2,6"8 '0,213EL SALVAOOR 24.366 26,197 734 1,204 23,632 24,993HONDURAS 10.954 20.95'0 852 1,490 10,102 19,464NICARAGUA 16.885 18.346 3,331 863 13,554 17,483 ,COSTA RICA 20,289 28,459 603 394 19.486 28,265 jPANAMA 30,361 5b,128 430 612 29,931 56,116CANAL ZONE 0 0 0 0 0 0 Iif
ICARIBBEAN 265.8b9 393,0"3 9,113 7,479 256.156 385,56"BERMUDA 12,4,·38 16,766 0 0 12,438 16.766BAHAMAS 37.249 45,152 0 0 37,249 45,152CUBA 0 7 0 0 0JAMAlCA 63,150 83.549 637 1.205 62,513 82,3....
7 .. HAirl 15,464 . 27.1078 1,0710 1,601 110,390 25,817 IDOMINICAN REPU8LIC 63,420 117.263 7.332 4,"91 56,088 112,172 , LEEWARD-WINDWARD IS. 8.343 9,299 59 11tl 8,28" 9,158 !BARBADOS b ...62 7,10510 II .. 0 6,1051 7,414TRINIDAD-TOBAGO 33,6':9 109,955 0 1 33,629 49,9510NETHERLANDS ANTILLES ' 22,503 32,058 0 0 22,503 32,058FRENCH WEST INDIES 3,211 10.062 0 0 3.211 4,Ob2
SOUTH' AIIERICA 935,408 1,113.243 .37.B87 31,355 897,521 1,081,888COLOMBIA 118.218 137.5b3 11 .651 7,732 106,567 129.831VENEZUELA 159.691 323.267 0 0 159,697 323.267GUYANA 10.1510 15,1060 137 126 10.617 15,334SURINAM 8,710 9.890 33 0 8.b77 9,890FRENCH GUIANA 16l! 2510 0 0 162 25 .. ECUAOOR 30,652 56,128 5,342 3,018 25,310 53,710PERU 121,555 110.065 2.518 3,517 119,037 166.5.. 8 BOLIVIA 5.277 28.029 1.552 9.873 -2.275 18.156CHILE 110,019 112.684 1.596 2,916 108,423 109,748BRAZIL 271,207 239,939 7.850 ... 0",3 263,357 235,896PARAGUAY 922 8010 405 130 517 6710URUGUAY 2,641 8,982 803 0 1.S44 S,982ARGENTINA 95.588 9,578 0 0 95,588 9,578OTHER SOUTH A"ERICA 0 0 0 0 0 0
EUROPE 7,153.",43 8.067,940 23,326 ",.633 7.130,117 8.063.307ICELAND 3.531 6.1510 702 0 2,829 6.154SWEDEN 70,099 94...08 0 0 10,099 94.408NORWAY 92,2410 1310,723 0 0 92,244 134,723FINLAND 23.276 36,795 0 0 23,2'76 36.795OENMARK 162,527 111.1710 0 0 162,527 111.714UNITED KINGOOM 615.9",9 655.131 0 0 615.949 655,131IRELAND 38.62b 29,630 0 0 38.626 29,630 >I!NETHERLANOS 1.240.751 1.6010.367 0 0 1.240.751 1,60'0,367BELGIUM-LUXEMBOURG 222,623 259.121 0 0 222,623 259.121FRANCE 390.372 '091.896 0 0 390.372 ·1091.896WEST GERMANY 1.180.598 1,589.116 0 0 1.180,598 l,5B9.116EAST GERMANY 2'0.532 17,168 0 0 210.532 17.148'AUSTRIA 16.461 13,527 0 0 16,467 13,527CZECHOSLOVAKiA 61.029 30.1063 0 0 61,029 30,4b3;" HUNGARY 20.59B 37.171 0 0 20,598 37.171'.;~~ SWITZERLAND 156,256 1910.1057 0 0 156,256 19"_'057ESTONIA 0 0 0 0 0 0LATVIA 5",0 0 0 0 540 0LITHUANIA 0 0 0 0 0 0POLAND 296,,,17 253,299 0 0 296,471 253.299USSR 920.151 299.933 '0 0 920,151 299,933AZORES 1,276 209 0 0 1.276 209 SPAIN 1061,535 7H.059, 0 0 4bl.535 71 it059 PORTUGAL 101,985 209.731 20.905 0 ' 87,080 209,731GIBRALTAR 67 71 0 0 61 77MALTA-GOIO 4,161 3,521 220 252 3,941 3,269ITALY 674,192 763,155 0 0 674.192 763,155YUGOSLAVJA 98,565 U5.S39 0 0 98,565 115.539 ALBANIA 210 35 .. 0 0 210 354 GREECE 1102,139 120.813 0 0 142,139 .120,813ROHAHIA 73.826 156.497 0 0 73.826 1!S6.,~97BULGARIA 1,953 15.7.. 7 0 0 1.953 15,n7TURKEY 39.226 101.200 1,047 3,661 38.179 97,539CYPRUS 11.662 10.905 '''2 720 11.210 10,185
-22_

I i
I
:
I
I' ._._-.;-....
: ::~
i TABLE ll.--U.S. AGRICULTURAL EXPORTS: VALUE OF TOTAL, SPECIFIED GOVERNMENT-FINANCED PROGRAMS,
AHO COM"ERCIAl. BY COUNTRY. CALENDAR YEARS 1973 AND 197~--CQNTINUED ~:1
AGRICULTURAL SPECIFIED GOVERNMENT;~'~ COUNTRY COHHOOITIES FINANCED PROGRAMS COMMERCIAL 11. '<' 1973 1974 1973 1974 1973 1974
1.000 C·OLLARS ~ ASIA 6',451,9B4I: 8,242,297 688,787 591,256 5,7b9,195 7,b5i,041SYRIAN ARAB REPUBLIC 1,642 7.405 61 0 1,581 7,405LEBANON 29.760 70.348 676 4,06~ 29,084 66,2841J,1 IRAQ 32,362 114,842 105 O· 32,257 114,842IRAN 108,856 '534,195 7,835 0 101,021 534,195ISRAEL 193.529 256.642 50,597 2,019 142,932 254,623
f JORDAH 15,289 9,141 7,520 5,880 7,769 3~261il GAlA STRIP 0 37 568 1.814 -568 -1,717J KUWAIT 8,703 21.310 0 0 8,703 21,310r SAUDI ARABIA 65,545 110,020 0 0 65,5ft5 110,028f;~ QATAR 390 1.599 0 0 390 1,599
fJ ARABIA PEN. STATES.NEC-XX 0 0 0 0 0 0 UNITED ARAB EMIRATES 3,516 6,051 0 0 3,576 6,051r. YEMEN ARAB REPUBLIC 5,617 b,183 1,073 3,553 4,51010 2.630 YEMEN IADENI 2.067 8.568 0 0 Z,Ob7 8,568ti 1,351 312 0 0 1,351 312
1 .~ OMAN
BAHRAIN 1,868 3,701 0 0 1,868 3,701AFGHANISTAN 1,279 908 6,502 622 -5,223 286INDIA 333,241 454,843 45,327 61,804 :287,914 393,039
:;,: PAKISTAN 114,265 158,528 53,209 33,835 61,056 124.693 i NEPAL 621 4:25 2,247 257 -1,626 168• BANGLADESH 96,794 207,5:29 5'h677 37,181 37,117 169,748l' SRI LANKA (CEYlON' 18,160 10,032 3,tH 7,607 1~,293 2.425r BURMA ~3 56 0 0 103 56{ THAILAND 61,112 81,6:29 5,933 6,650 55,179 1~,979
NORTH VIETNAM 0 0 0 0 0 0! SOUTH VIETNAM 150.353 221,484 155,955 199,558 -5,602 21,926; LAOS 3,627 2,541 2,702 1,536 925 1,0051j KHIlER REPUOLIC (cAMBODIU 62,312 111,285 72,396 111,755 -10,024 -60.470
MALAYSIA 20,905 36,383 307 39 20,598 36,344" SINGAPORE 57.354 43,297 27 36 57,321 43,259INDONESIA 188,838 101,150 75,663 22,887 113,175 78,263P
Ito',
tf PHILIPPINES 117,200 ~73,127 36, 56ft 12,881 80,716 160,246MACAO 51 5 45 0 6 5
" j; SOUTHERN-SE. ASIA. NEC 72 153 0 0 72 153 ,..
[,,. PEOPLES REP. OF CHINA 5H,984 652.559 0 0 5110,984 652,559 ~]~,
MONGOLIA 0 0 0 0 0 0 ,!,
f NORTH KOREA 0 0 0 0 0 0 ?
f; KOREA, REPUBLIC OF 635.129 742,615 95,777 , 16,676 539.352 725,939 J
HONG KONG 147,084 184,576 0 0 ,147,064 184,576 "1;l: REPU8llC OF '~INA 101J6,135 429,9010 '0,154 0 401.981 429,904 " JAPAN 2,997,128 3,478,906 0 0 2,997,728 ::1,478.906 ".-}t
)f;
.. , AUSfRALIA AND OCEANIA 83,036 149,1067 211 0 82,825 149,467 !"~£' j AUSTRALIA ".54,611 10~, 121 0 0 54,611 104,121 .~~;' PAPUA NEW GUINE~ 226 319 0 0 226 319 ',: NEW ZEALAND 16,287 26,518 0 0 16,287 26,518 ~ *:: ,I WESTERN SAMOA 271 568 0 0 271 568 ,~ :~
IIRJT ISH PACIFIC IS. 70 111 59 0 11 III,~~{' f '.FI':EHtH PACIFIC IS. 10,887 7,155 0 0 4,887 7,155 ~;; TRUST TERR. OF PAC. IS. 6,107 9,350 0 0 6,107 9,350 -; , OT~ER PACIFIC Is.,HEe 577 1,325 152 0 1025 1,325 { ...
AFR~CA 582,645 1,136,149 76,l15 136,281 50b,530 1,001,868i MOROCCO 78,526 124,812 14,595 23.201 63,931 101,6111 ALGERIA 71,240 110,494 0 987 71,240 169,507TUNISIA 27,353 48,547 12,712 9,548 14,641 38,999LIBYA 6.433 26,02~ 0 0 6,433 26,024
~ EGYPT 122,969 3'02,956 903 20,336 122,Ob6 322,620SUDAN 27,243 18,!55 3,304 4,022 23,939 14,133
~ , CANARY ISLANOS 11,298 18,741 0 0 ll.298 1..8,7101 ), > SPANISH AFRICA. NEC 7 0 0 0 7 ,0E EQUATORIAL GUINEA 0 0 0 0 0 0 J"',
~', MAURITANIA "10' 3.145 2,985 5,398 -2.691 -2,253 /, FEDERAL REP. OF CAMEROON 2,662 3,199 13 542 2,589 3.257
[t;;' t\ SENEGAL 14,9106 19.140 .. ,946 2.691 10.000 16.4109
MALI 4,274 12,769 4,857 11.7107 -583 1,022GUINEA 5.837 7,903 10,939 5,4010 698 2,1099SIERRA LEONE 6.848 12.516 661 1,071 6,187 11,445IVORY COAST 2.298 3,873 390 •• 1';057 1,908 2,816GHANA 24,185 20,095 3,344 2,059 20,8101 18,031>THE GAMBIA 1,1111 7B2 1,025 786 156 -10
I i NIGER 6,198 22,16B 6,262 13,95,1 -64 8.817
T.OGO 1.557 1.~9~ 817 8104 740 650 NIGERIA 40.853 112.27'0 631 2.392 100,222 79,882CENTRAL AFRICAN REPUBLIC 53 199 28 144 25 55 GABON 221 ~47 510 101,8 173 399 CHAO 522 3.198 591 4,OfT -69 -879 BRITISH WEST,AFRICA 0 0 0 0 0 0,~ MADEIRA ISLANDS 653 0 0 0 653 0 lJIIPER YOLTA 3.511 6,121 4.089 4.3<\01 -518 a,786
I ~
-23
,
~ 1" "'~'-""'--"-----~""-~-'--"--"-~ ,. ..~--....,......-
I
I
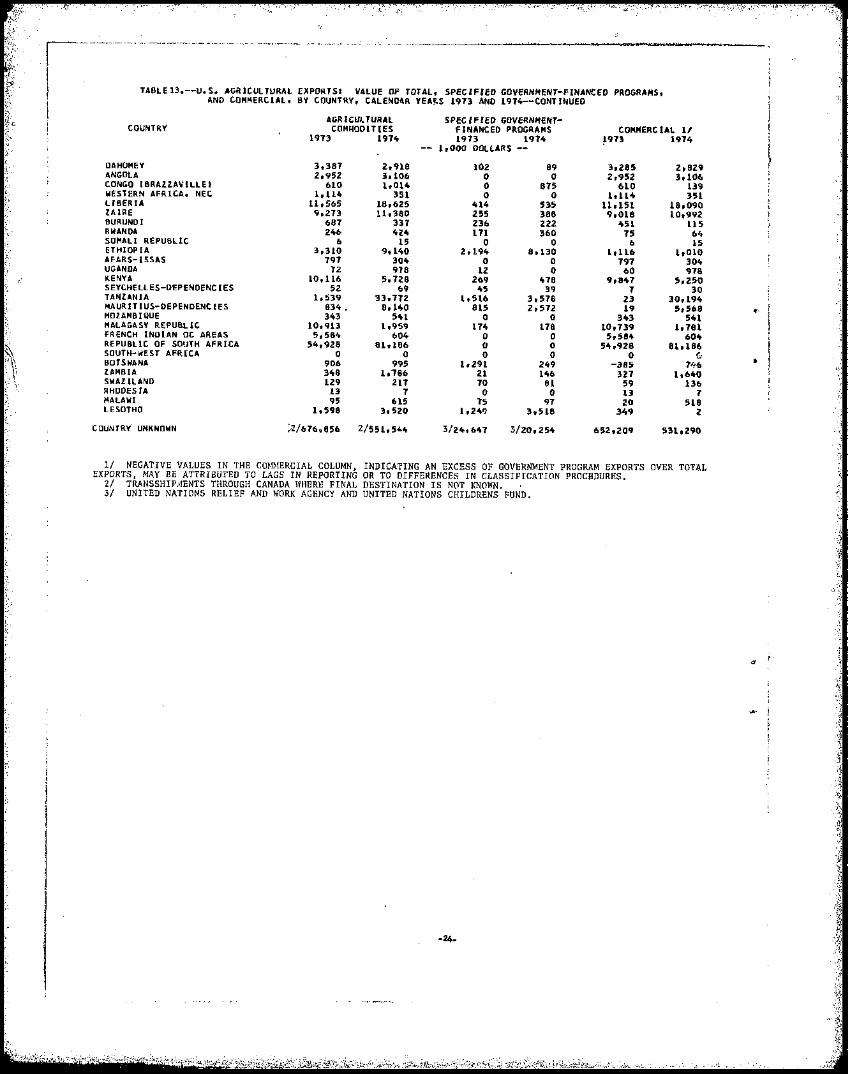
TABLE13.--U.S. AGRICULTURAL EXPORTS' VALUE OF TOTAL. SPECIFIED GOVERNMENT-FINANCED PROGRAMS. ANO COMMERCIAL. BY COUNTRY. CAlEND4R YEA~S 1973 ANO 1914--CONTINUED r
AGRICULTURAL SPECIFIED GOVERNHENT-COUNTRY COMHOOlT IES FINANCED PROGRAMS COMMERCIAL 1/ t1913 1914 1913 1914 ~913 1914
1.000 DOLLARS
~DAHCiMEY ANGOLA CONGO (BRAZZAVILlEI WESTERN AFRICA. NEt UBERIA ZAIRE BURUNDI RWANDA SOMALl REPU8L1C ETHIOPIA AFARS-ISSAS UGANDA KENYA SEYCHELLES-DEPENDENCIES TANZANIA MAURITIUS-DEPENDENCIES MOZAMBIQUE MALAGASY REPUBLIC FRENCH INDIAN OC AREAS REPUBLIC OF SOUTH AFRICA SOUTH-WEST AFRrtA BOTSWANA ZAMBIA SWAZILAND RHOOESIA MALAWI LESOTHO
3.381 2,952
610 1.114
11.565 9.213
681 241.
6 3.310
191 12
10.116 52
1.539 834. 343
10,913 5,584
54.928 0
906 34B 129
13 95
1.598
2.918 3.106 1.014
351 18.625 11.380
3H 'olio
15 9,140
304 976
5.128 69
33.112 B.lltO
541 1.959
604 81.186
° 995 1,'186
217 7
615 3.5l0
102 0
° 0 414 255 236 111
0 2.194
° 12 269
45 1.516
815 0
171, 0 0 0
1,291 21 10
0 75
1.249
89 0
815
° 535 38B 222 360
° 8,130 0 0
418 39
3,518 2.512
° 178 0
° 0 249 146
81 0
91 3,518
3,285 2,952
610 1.114
11.151 9,018
1t51 15
6 1,116
191 60
9,841 1
23 19
343 10,139 5,584
54,92B 0
-385 327
59 13 20
349
2,829 3,106
139 351
18,090 10,992
115 64 15
1,010 304 918
5,250 30
30,194 5,568
541 1,181
604 81,186
(;,
746 1.640
136 1
518 l
~.
,.
),
COUNTRY UNKNOWN ;'2/616.856 2/551,544 3/24.641 3/20,254 652,209 531,290
1/ NEGATIVE VALUES IN THE COMMERCIAL COLUMN, EXPORTS, MAY BE ATTRIBUTED TO LAGS IN REPORTING
2/ TRANSSHIP.'IENTS THROUGH CANADA WHERE FINAL 3/ UNITED NATIONS RELIEF AND WORK AGENCY AND
INDICATING AN EXCESS OF GOVERNMENT PROGRAM EXPORTS OR TO DIFFERENCES IN CLASSIFICATION PROCEDURES. DESTINATION IS NOT KNOWN. UNITED NATIONS CHILDRENS FUND.
OVER TOTAL
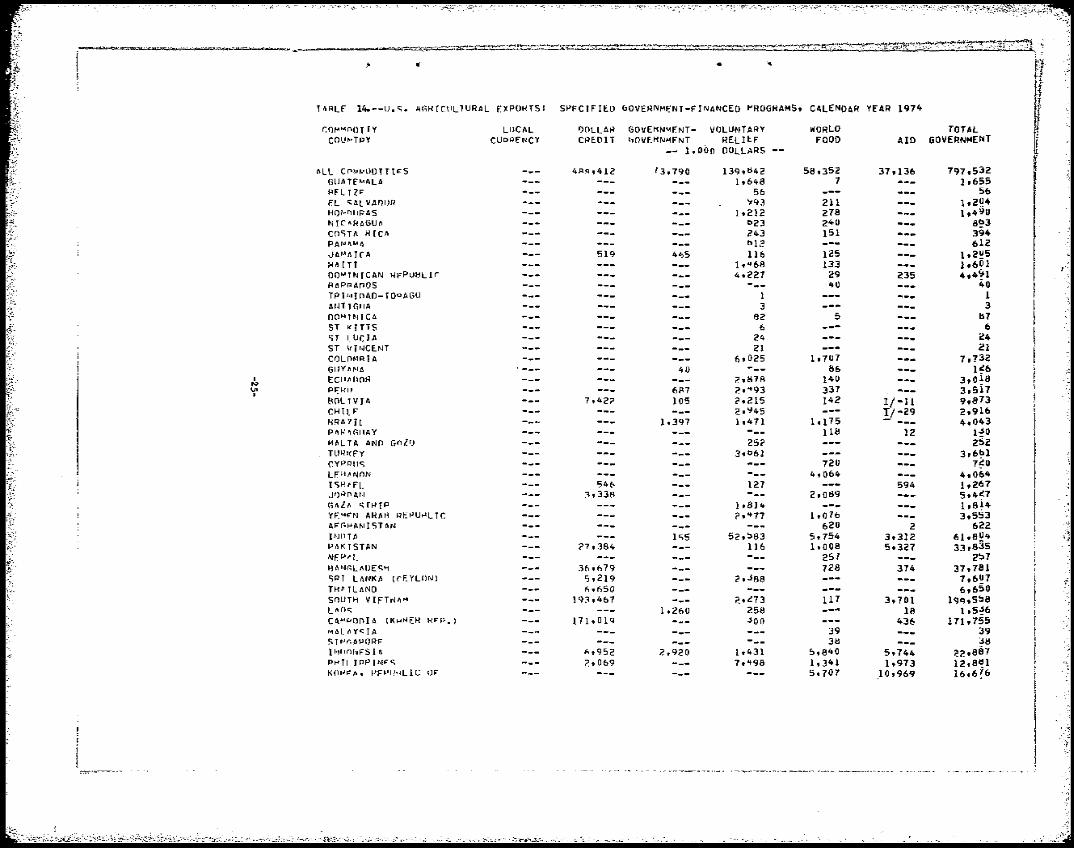
TARLf 14.--lJ.c;. A(;flIrliLTURAL DPOtHS: SPFCJFI~D 60VERN"~NT-FINANCED PHOGNAMS. C4LENDAR YE4R 1974
r.Ot-'''''(l(lT TY LOCAL OOLLAR GOVEHN'!FNT- VOLUNTARY WORLD TOTAL COU"TpY CUPPfNCY CREDIT bOVEHNolF.NT HEUI:.F FOOD AID GOVERNMENT
-- 1.000 DOLLARS
ALL CN'"UDT Ttl'S 4RI'I.412 '3.790 13'h tl 42 58.352 37.136 797.532 GlJATf"'ALA 1 .648 7 1,655 f:lFLTZI' 56 56 EL C;Al VAf)IJR '193 211 1.2~'" HOM'lI,II"IlS 1 .212 278 1.49 0 NIC-RAGUA 023 240 8~3 CO"iTIl RICII 243 151 394 PA~lh"A bli? 612 JAI'IAJCA 519 445 116 125 lt2!!5 Hh ITT 1.'+68 133 1.6~1 DOMTNTCAN HFPU~Llr 4.227 29 235 4.4'!1 RAPPAnOS --- 40 40 TP J'" I nAD- TO"AGU 1 1 AI-iTTClIIA 3 ~ nO"TNTCA 82 5 tl7 5T i<J TIS 6 6 '" I,UCIA 24 24 ST 1/ I '.ICENT 21 21 COLMIRIA 1\.025 1.707 7,732 GIlYnNA 40 --- tl6 1~6
...,I ECII.nnR --- ?.B7R 140 3.0~8 PFOHl I 6R7 ?.'+93 337 3.517'" I BOLTVIA 7.42? 105 <,.215 142 1/-11 9.873 CH lI. F c.>;4S !/-29 2.916 HRA7It. 1.397 10471 1,175 4.043 PAf,'~GIIAY --- Uti 12 l~O MALTA ANn Clnll) 25<' 252 TllPI(FY 3'°61 3,6~1 CYPRIl<; 720 7~0 LF.H~NnN --- 4.064 4.064 1<;P..FI. "46 127 594 1.267 JOPf"lAt.1 ~.33A --- 2,0t!9 5.4~7 GAlA C;THTP }.814 1.8~4 Y~~I'N AHAH pE~U~LTC 2.'+77 1.076 3.553 AFGHANISTAN 620 2 622 PlIlT" 1,5 5(!.!>83 5.754 3.312 61fB~'+ PAKTSTAN 27.384 116 10008 5,327 33.835 NF.P'L --- 251 2!:>7 fl~"GLADESI-j 3f>.f>79 728 374 37.781 \ SPT LANKA (rE YLfIl~) <;.219 ;:>.j88 7,6~7 \ TH~TLAND /',./',50 6.650 S()lJTH VIFTI~A"" 19~.467 2.~73 117 3.701 19<1.5:'8 !LAOe; 1.260 258 18 lt5~6 C~Mr..()nIA (KHMEH HFP.) 171.01'1 .jOO 436 171,755 MAtAY<:JA 39 39
-- IS T "r:/lPORI' - 31:1 ~tI
I Hllnr,FS In 1'..952 2.920 1.431 :..840 5.744 22.887 IPHTI JPPIMFS 7..009 7,'+98 1.341 1.973 12.8~1 !K(1I11' A. f'F"'}!<L I C 1)1' 5.707 10.969 16.6!6
,3

, - ".,: •.,. :~ j, '" : •• , -~. JL':.,"'·' :_-~ ~.-'" "1 i-~,:,\,":~;- .<~...!;-;;~;,:•• ~... (. -'_y<i~'
:::::::
r-·-----~ '-----.-~----,...~-----,--,.--...- .....--... , . ----------~------------~.~
7 .. HLF 14.-_".<.:. ~:;"rClIlTuk'\L ~XPORTS: SPfr.rFrEO GUVER""'ENT-FI'HNCED t'ROGRAMS,
r.o'··'nnr TY l nCAL Dnl I AH bOVEHN~ENT_ VOLUNTARYCfUI""T:JY CUIWFr~cY CPEDIT GnV~HNMENT R~LI~F
-- 1.OUo DOLLARS
~Jo~nA~; ~~~T H4N~ 15? 400
JnIJ"a~· F4~T H'\I~~
"'rr"0rrll !.3IJh 16 • .:l14 t.l ""'I-; T1\ TI'" TO:; 1 6 4./61 I ,,,q2 ],':>13F"f1V~T 14.;>4<1 <;.927~I/I"~,
?6'.13""J Jl.' I T A rl t ,'! b21 503<;6kFP. 0F r.~F"llllJ
1/\4 82C;r:"·F~"'·L ! olCJ2
111,548r.l \1 T "90 (";11 I t.f:. " 4.043 1,011>STFrJPn LF""J~ --
993TV":JY CI)~'>T f;Hn"ll, --
1.673 1,,[(. "4 .l?l !)O THF (,td-1f-1r/\
12,372TII:"n 562I\lTI .. ~I"T Il
~F0TRnL 6~HIC4N ~c~ ---I f:jl\..-I,·,/'I
en 3,600
'" I CH,'1f) ---IJPP.P 1/01. f ~
;>.495 IoU,5f)"t"'IH"r.Y 48
I,J".'" Tq rn,,'r.n (HI>'\171\V 11 L~)
t!.757nT"~ 3~1l~11'''II'''lp I
1/ 01" ~ tr, (\ --FTriT(lPIn 360
6.472 SF rrHrLl 1'<.
K,f\IVI\ 47A
39 10420
1~'7M-IA
'·'1Il ", rT IIJ<:,-nl'r-t:i'''f. "C II- <; 1.409MM ~r.nSY "F~'U<iL r~ 178
I AI·II T.'" 5-,10711 ANn --~nTc.~'.\I,..rIolA
Mnl"'-T 1F'''''HIt) --1JroIl"'I,,, 1.624
1t1.2"b 4.<)h8
r/'drF~ ~--
!/ Negative values due to adjustments from prior periods.
CALENDAR
WORLD FOOl)
!:>3 1.10!:>
9/:j7 1.589
1blJ 708
.. C 296
1.009 1,199
345 18
1,057 330 4 I!:>
1.579 2/:j2
2.392 144 148 471 71J1
41 875 26U
222
l.b!>!!
2ol!:>H 10163
249 146 IH 91
1.894
YEAR 1974 --CONTINUED
TOTAL AID GOVERNMENT
7&2 4t13
4.386 23.201 91:17
37 9,5"8 20.33& 4.0~2 S.3~8
542 2.691
11.747 5.40" 1,071 1.0:17
56 ... 059 78&
13.9!)1 844 .~
2,392 144 14/:1
4.077 0": 4.341
89 875 5.35 388 222 360
B,lJO 478
39 3.511:1 2.5(2
1;1:1 249 146
81 '17
3,518 1'5.286 4.966
(t
"e ~ ".'.....~----~,~""""~~~,...,....--<~.....
~: '~~;::,;;it-~:. :'::0" "'~".' -.:. _.'·-:.",i "~;~.~·i~·.:;-.rt';'i:',:·,':".~;;).f:'!~·,~:•.·~;:~ ,;'. "~'~"(1 ·:n ~,'.'
I
------
--- ---
---
------
I~==·~-~--~==
J
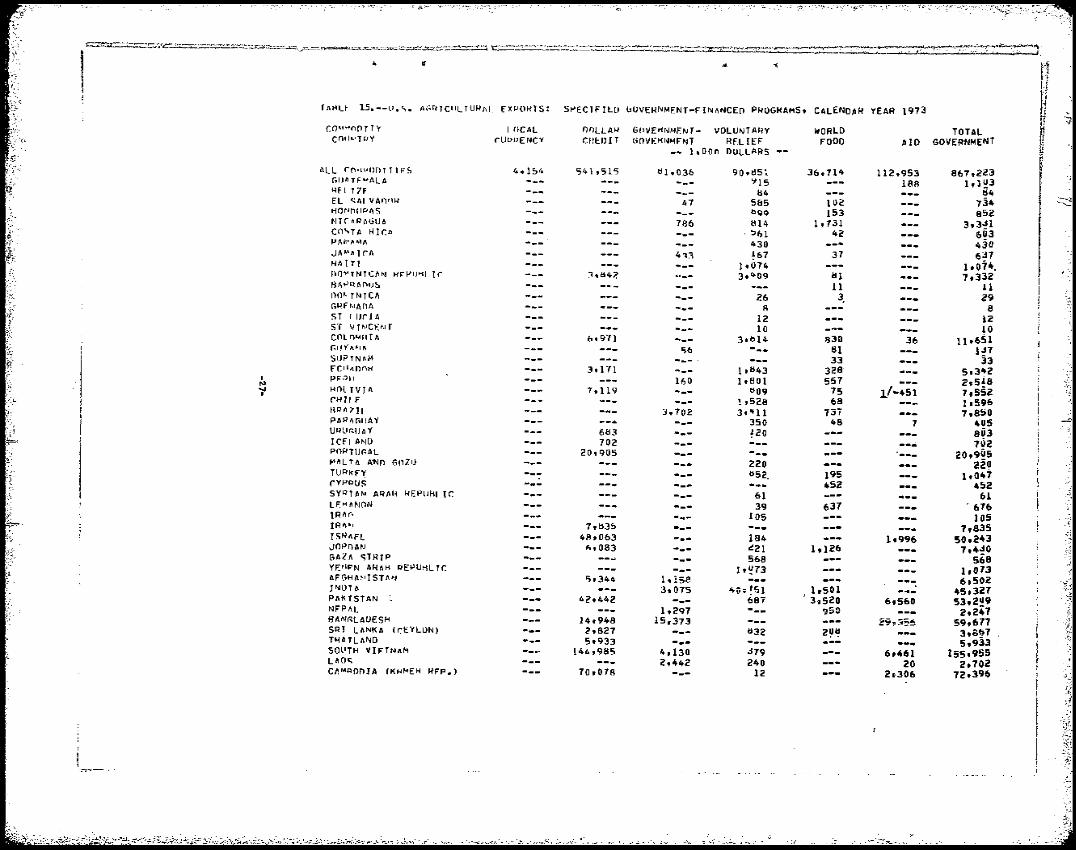
TM-ILt 15.--1I.<,. 1\(~rlTCIIlTU~/\L fXP(1HTS:
CO""OOTTY I nCAl COII"TRY rUPIJENCY
,\ II rn'I"OI)f r T" 5 r.lJ h TF"AlA
4.1 !O/,
HF l T 7F fl <;/11 VAI)IIH HOf'tl11PII$ NICAPAGUA cn<'TA Rtr.A p J1f"~ .,~
JIIM~Trl\
H~ I TI IH1"TNTCHI H.I-'IJ>1L \r' BIlJo'I1Af'I)S nnl. HITCII r.HF"'AnA STIlJrlA S'f IITMc!: ... r COLnMllrA (;Uy ~~I~
StJPTN~M Fell_not<
I N
PF;II ,
"i' Hf)lTVJA CHI! F flP~71t.
PAR~(;ljAY
UPlIr.UAY IeFI jI~IO P,WTlJr.AL "'Ill T II A1'Jn GnlO TURkFY rYPPUS SYPTA~' AIlM~ HEPllHI Ir. IF:'HNON tRM) IRM. rSHAFl JOPI)AI\I GAlA o;TRTP YEM.N AHIIH PEPU~lTC AFGHA~I I ST I\>~ J"IO Ttl PAK TSTAN !.
NFPIIL 811NRLAOESH SRI LIINKA (~EYLON) THAILAND SOLITH IIIFTNIIM
uo" CI\M~nnJA (KHMEH RFP.)
SJo'ECTFH.ll
f)f)lLAil CHI:OIT
54\,515
~.tl47.
6.9"11
3.1n
1,119
6/j3 702
20.Q05
7,tl3!> 41lt 063 ",083
<;,344
42,442
14.948 2.827 5,933
144.985
70,078
. <
bUVEHNMENT-FIN~NCEn P~UGHAMS, CAlENOAR
G(lVErll~MF:NT- VOlU'NTAflY WORLD (HlVEt<I~MFNT RF.LIEF FOOD
-- 1.Don nUllARS
tl1.Q36 90.tlS. 36.714 ':115
1:14 47 585 102
bqQ 153 786 814 !t731
. ::'1',1 42 430
4~:! ~67 37 ),074
0:,_ 3. 4 09 III 11
3.--- 26 A
12 10 --- 3,bU 830
56 --- 81 33
1,1143 328 160 1,801 557
d09 15--- ! .528 68 3.702 3. 4 11 137
350 48 ~20
--- 220 1:152. 195
452 --- 61 39 637 --- lOS
--- 184 o:!21 1.126
~--
--- 568 lt~73
1.1'58 3.075 4{);151 ,1,501
687 3~520 1.2Q7 --- ~;ie
---15,373
1:132 2~~
4.130 0$79 2.442 240
12
YEAR 1973
AIO
112.953 188
36
11"451
7
--..
1,996
6,560
2~t<~5~
6.461 20
2~306
TOTAL GOVERNMENT
867.223 ltl U3
ti4 734 852
3.30$1 603 430 6~7
1,014. 1.332
11 29
8 12 10
11 ,651 10$7 33
5.3"2 205£8 7,552 1,596 7,850
405 aUJ 702
20,9U5 220
1,047 452
61 . 676
105 1,835
5~lt243 1,40$0
568 1,013 6,502
45.321 53,2~9
2.247 59,677
3,Gb7 5,933
155,955 2.102
12.396

~., '~-.---~""",~",,-,-,~--,,-_ '~_~'~""""J..l"""'''~""""""""",,,,,,,,,,,,
I N co,
___,,,,,,,-_,~_~,_
TM<lf 15. __11.'-'_ A(.HTClIl1UkAL F)<I-'OHT5: SPfCl~IEn bUVENNMENT-FINANCEn PROGHAMS. CALENDAR rO''''fl" TTy I neAL nOLI Ak GOVF."N~ENT- VOLUNTARY WORLD('0(("11<'1' rlHJPf ~'CY C>I£nIT GOVFKNMENT ~ELI~F FOOD
-- 1.00n DOLLARS '~dl ~y~ IA
120 173 14SI"'t::APOkF 5 22 r IVn"Nf ~ I • <;?2.3Q ltCt91 3,460PHil IPI-'T~I~C:; 1 1 ,462 1.034 4,416Mnr,n 1.921
1<(l~'FI),. f{PJl.I'IL 1<: I)F --- 45 ~"'ol42 621 5.206RFf"I"l Ie lIF Crll',n ... 1!J4
,In''''M' 'IF,> r n .\~< -.- --
354dIlIJI\Al\' Eft!"T nl\N~
90FrciT 152
1>11. S(llU"u'~ I., 0 --'39M!l>lflrrO <;.531 -.- 6.356 119111"TS14 <;.644 2,198 lt579 343.I;'(PT ._ -.- b7l 232SlIP'., ?21? 584 508Ml~IIQTTl\I\.JT/i
2.105 413 832RFP. nF r./P.,r:;-<l)lJ', 65 8SF'·'Fr.~l 3,783 !l61 602,. hL 1
3.825 168 864(;lIT"'F'/\ 4. -24 231l -- 17SJf-Pfl~ L"lI'JF 546 115IV"tJ'" cnA'-T
GHflt,lll --- 3901,73u 736 293THF (;oMHr'
3 ell 57~IJ r_< p 577 5,273 --- 989To',n
614 203'" 1'-FP 1 1\ --- 631rF"TI'lAl nFf<TLIIN '1fD Rn.pnM 28
54CHon --up..,,,,,, VOL I A 358 233
3.lu8 372flAt"n,,;.,( 60':1 23 79l 1""1-1 IA 328 86lnT"F
I1llfJ"~rn 1 97 158 lOS 131l-1~~,;'ln" i7lf;TI" T(WI 4
6'51 24IH~ltf\ln(l 10519 KF"'vn --- 12
269<,FVrHf-LLF'45TM"7A~ll A
1,146 370MJlLID 1 T I IJ<;-I>I. f't'.l'JlJfn,C rFe: 494 321
~()T ,I"",. hit. 91 83 7M'''T A
"AI.~GAS,( fJFIlU'iLIC
1.291 21
MAl r.'.o I --- 10C:;WJl71i /I'm
31 44l"t;(1TI-'O 11",11-1','/1 1>75 574
7,665UNICEF --16,982
II Negative value due to adjustments from prior periods.
'( t\ lIr, ""',
"~·""'~·---""""""""'~.·v~~~",,~_.....-'-'''''--~ '......,"'-"~..~
----l YEAR 1973--CONTINUED !
TOTAL AID GOVERNMENT
301 27
18.873 75.663 17.731 36.5"b4
;'5 23.81J~ 95.1'77
4.154 3!)4
90 152 59
2.529 1,.,595 2.948 12.712
903 3.3U4 2.985
'3 4,946 4,857 r 4.939
661 I
39U 585 3,344
1,0CS 6.262
817 631
28 54
591 4.01$9
102 414 255 236 171
2,194i2
269 45
1.5i6 a!5 114
1.291 21 10
. 15
1,249 7,665
16,982
J
.,j
I
I • , ~
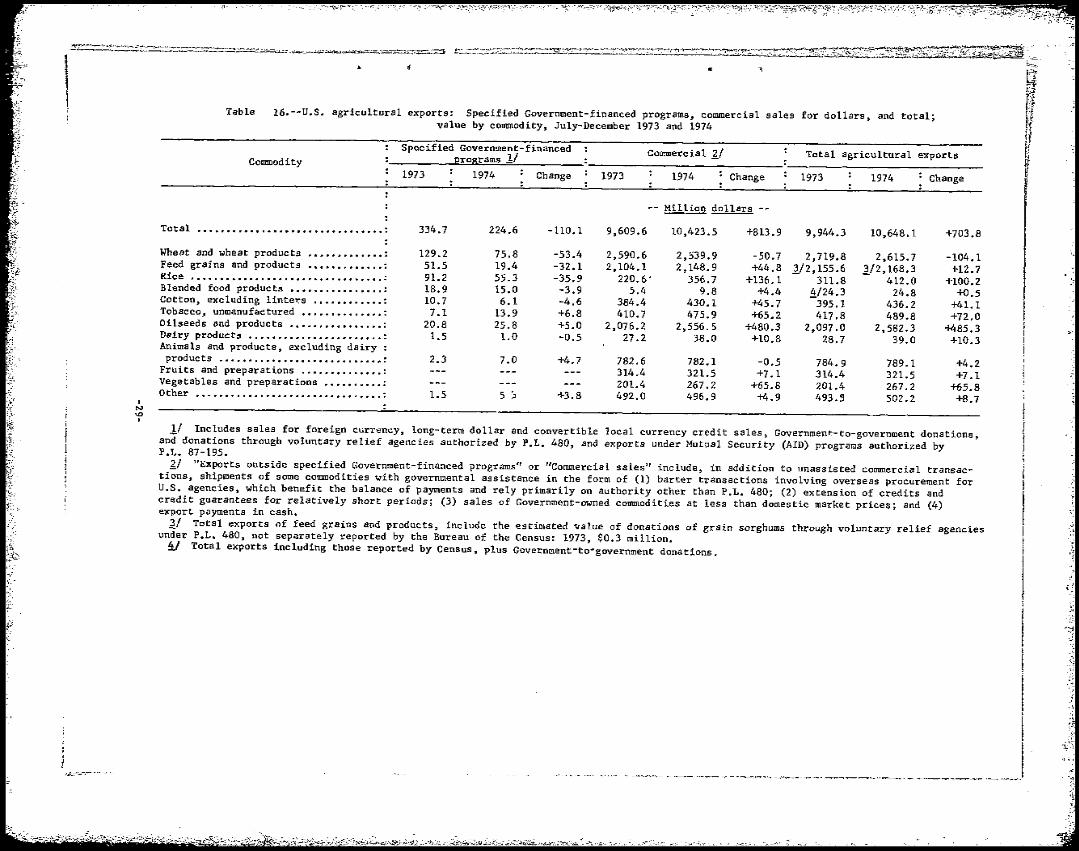
Table l6.--U.S. agricultural exports: Specified Government-financed programs, commercial sales for dollars, and total; value by commodity, July-December 1973 and 1974
Specified Government-financed Commercial 11 Total agricultural exportsCommodity programs 11
1973 1974 Change 1973 1974 Change 1973 1974 Change
Million dollars
Total ................................... : 334.7 224.6 -110.1 9,609.6 10,423.5 +813.9 9,944.3 10,648.1 +703.8
Wheat and wheat products ••••••••••••• : 129.2 75.8 -53.4 2,590.6 2,539.9 -50.7 2,719.8 2,615.7 -104.1Feed grains and products ••••••••••••• : 51.5 19.4 -32.1 2,104.1 2,148.9 +44.8 1/2,155.6 112,168.3 +12.7Rice ••••••••••••••••••••••••••••••••• : 91.2 55.3 -35.9 220.6" 356.7 +136.1 311.8 412.0 +100.2Blended food products •••••••••••••••• : 18.9 15.0 -3.9 5.4 9.8 +4.4 4/24.3 24.8 +0.5Cotton, excluding 1inte~s •••••••••••• : 10.7 6.1 -4.6 384.4 430.1 +45.7 -395.1 436.2 +41.1Tobacco, unmanufactured •••••••••••••• : 7.1 13.9 +6.8 410.7 475.9 +65.2 417.8 489.8 +72.0Oilseeds and products •••••••••••••••• : 20.8 25.8 +5.0 2,076.2 2,556.5 +480.3 2,097.0 2,582.3 +485.3Dairy products ••••••••••••••••••••••• : 1.5 1.0 -0.5 27.2 38.0 +10.8 28.7 39.0 +10.3Animals and products, excluding dairy: products ............................. : 2.3 7.0 +4.7 782.6 782.1 -0.5 784.9 789.1 +4.2
Fruits and preparations •••••••••••••• : 314.4 321.5 +7.1 314.4 321.5 +7.1Vegetables and preparations •••••••••• : 201.4 267.2 +65.8 201.4 267.2 +65.8Other •••••••••••••••••••••••••••••••• : 1.5 5.;' +3.8 492.0 496.9 +4.9I 493.5 502.2 +8.7
N
I '" 11 Includes sales for foreign currency, long-term dollar and convertible local currency credit sales, Government-to-government donations,
and donations through voluntary relief agencies authorized by P.L. 480, and exports under Mutual Security (AID) programs authorized byP.L. 87-195.
11 "Exports outside specified Government-financed programs" or "Commercial sales" include, in addition to unassisted commercial transactions, shipments of some commodities with governmental assistance in the form of (1) barter transactions involving overseas procurement for U.S. agencies, which benefit the balance of payments and rely primarily on authority other than P.L. 480; (2) extension of credits and credit guarantees for relatively short periods; (3) sales of Government-owned commodities at less than domestic market prices; and (4) export payments in cash.
11 Total exports of feed grains and ~roducts, include the estimated value of donations of grain sorghums through voluntary relief agencies under P.L. 480, not separately .eported by the Bureau of the Census: 1973, ~0.3 million. i! Total exports including those reported by Census, plus Government-to-government donations.
C~CC C~c_CC~_C~~ ~J__ ____c _______/",:-::~-,...-.".,,~,
\,.:
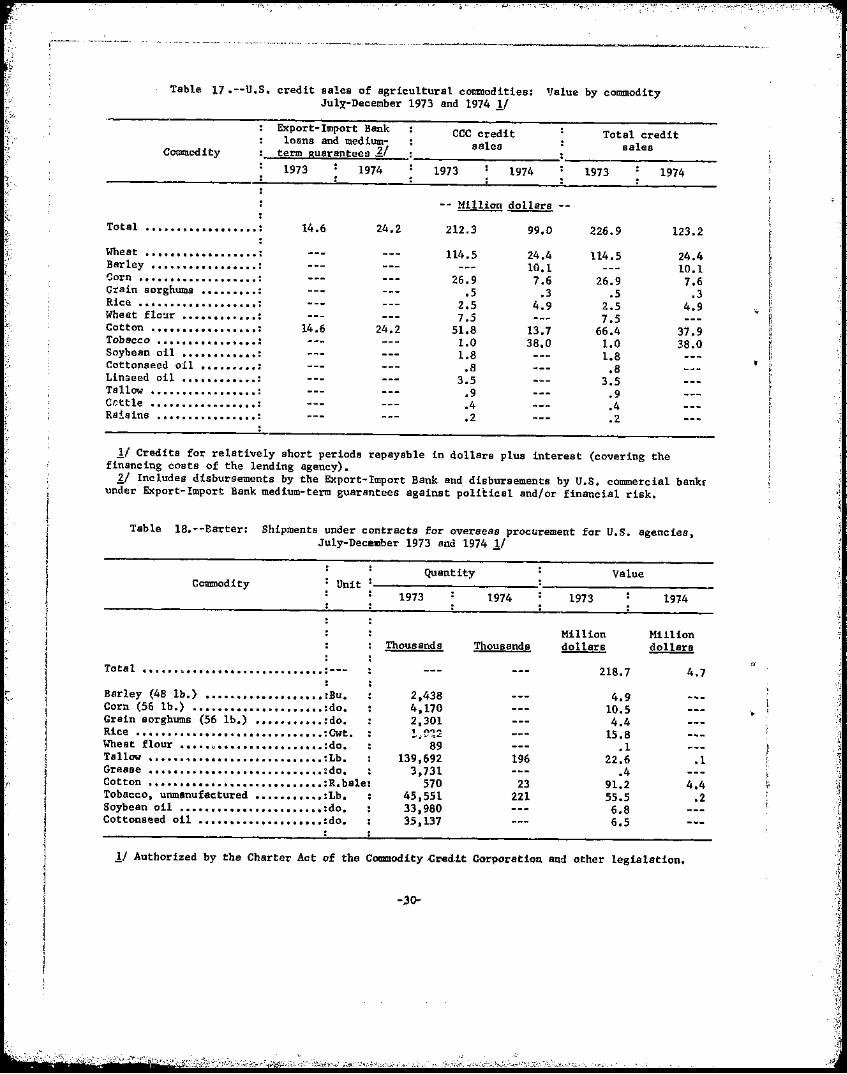
••••••••••••••
"
Table 17.--U.S. credit sales of agricultural commodities: Value by commodity Jul~-December 1973 and 1974 1/
Export-Import Bank CCC credit Total creditloans and medium sdes sales
Commodity term guarantees 1/ 1973 1974 1973 1974 1973 1974
Million dollars
Total 14.6 24.2 212.3 99.0 226.9
Wheat ••••••••••••••••••• 114.5 24.4 114.5 Barley .••..•••••••••••. : 10.1 ~orn ••••••••••••••••••• : 26.9 7.6 26.9 Grain sorghums ••••••••• : .5 .3 .5
41 •• :Rice .••.••.•.•••.••• 2.5 4.9 2.5 Wheat flo~r •••••••• ~~ •• : 7.5 7.5 Cotton ••••••••••••.•••• : 14.6 24.2 51.8 13.7 66.4 Tobacco •••••••••••• ~ ••• : 1.0 38.0 1.0 Soybean oil •••••••••••• : 1.8 1.8 Cottonseed oil ••••••••• : .8 .8 Linseed oil •••••••••••• : 3.5 3.5 Tallow •••.••••• ~ ••••••• : .9 .9 Cottle •••••••••• ~ •••••• : .4 .4 Raisins .2 .2
1/ Credits for relatively short periods repayable in dollars plus interest (covering the financing costs of the lending agency).
1/ Includes disbursements by the Export-Import Bank and disbursements by U.S. commercial under Export-Import Bank medium-term guarantees against political and/or financial risk.
Table l8.--Earter: Shipments under contracts for overseas procurement for U.S. agencies, July-December 1973 and 1974 1/
Quantity Value Commodity Unit
1973 1974 1973 1914
Million M11lion Thousarids Thoussnds dollars dollars
" Total •••••• ~ •••••••••••••••••••••• :--- 218.7 4.7
Barley (48 lb.) ••••••••••••••••••• :Bu. 2,438 4.9 Corn (56 lb.) •••••••••••••••••.••• :do. 4,170 10.5 .. Grain sorghums (56 lb.) ••••••••••• :do. 2,301 4.4
1 n", ....Rice ..•.••..•••••••••••.•.••••.••. :Cwt. 15.8;,.~v~.;
Wheat flour ••.•• t••• " :do. 89 .1 Tallow ....... ., •••••• "•••••••••••••• :Lb. 139,692 196 22.6 .1 Grease ••••••••••••• flo •••••••••••• ". ~do. 3,731 .4 Cotton 1I ••••••••••••••••••••••••••• :R.bale: 570 23 91.2 4.4 h
'1
Tobacco, unmanufactured ••••••••••• :Lb. 45,551 221 55.5 .2 Soybean oil ••••••••••••••••••••• ~.:do. 33,980 6.8 Cottonseed oil •••••••••••••••••• II.:do. 35,137 6.5
11 Authorized by the Charter Act of the Commodity.Cred.it Corporation and ather legislation.
-.30

Title I Title II donations
Long- term - Government- World Voluntary Commodity Unit Local currency dollar credit to- food relief
sales government program agencies
1973 1974 1973 1974 1973 1974 1973 1974 1973 1974
Thousands
Cattle, live ............. :No. Breeding chicks •••••••••• :do. Milk, nonfat dry ••••••••• :Lb. Wheal: (60 lb.) ••••••••••• :Bu. 17 ,383 8,267 199 453 184 797 8 786 Rice, milled ••••••••••••• :ewt. 3,824 2,871 Corn (56 lb.) •••••••••••• :Bu. 5,595 569 1,022 282 515 843 31 Grain sorghUlr'B (56 lb.) •• :do. 7,323 3,856 2,45S 799 373 128 Wheat flour •••••••••••••• : ewt. 94 121 484 118 270 374 435 637 Cornmeal "4O .'..... ,. .................. ,. :do. 58 18 169 115 63 131 Bulgur wheat ••••••••••••• , Lb. 2,808 7,388 21,122 50,562 94, 012 107,459 Oatmeal and rolled oats •• :do. 748 554 3,213 13,531 Infants' dietary supplement ................. ,. ••••• :do.
Corn-soya-milk ••••••••••• :do. 29,307 27,416 17,196 6,463 48,343 43,330 Wheat-soya-blend ••••••••• :do. 3,392 3,485 1,589 23,390 27,758 Soybean oil cake and meal :S.ton Feeds and fodders •••••••• :---Tallow, inedible ••••••••• :Lb. Tobacco, urunanufactured ,." :do. 6,087 10,646 Cattle hide. • •••••••••••• :No. Cotton ••••••••••••••••••• :R.ba1e: 11 62 19 Soybean oil .............. :Lb • 45,055 23,900 7,471 904 7,241 8,594 29,348 24,351
.... • Nonalcoholic beverages ••• :Gallon: 237'". Grain sorghums grits ..... :Lb • 20,084 5,479
-- .!:!lli!!!!l ~ -
"Total ................................. : ]/ 213.7 126.7 25.8 20.8 14.6 22.3 31.5 44.5
Cattle, 1;.-tve ........................................ ! Bre~ding chicks ......... _................ : Milk, nonfat dry ................ : Wheat (60 lb.) .................. : 66.5 38.3 .6 2.2 1.0 3.4 ]/ 3.6 Rice, milled ............................. : 89.0 55.3 Corn (56 lb.) .................... : 15.6 2.0 3.0 1.0 1.6 3.0 .1 Grain sorghums (56 lb.) ........... 15.1 11.5 8.3 1.9 1.1 .3 Wheat flour ............... _.............. : .6 1.1 3.1 1.2 1.9 3.8 3.5 6.6 Cornmeal ............................. " ....... : .4 .1 1.1 1.0 .6 1.1 Bulgur wheat ................................ : .2 .7 2.3 4.8 8.6 10.1 Oatmeal and rolled oats ....... ~ ........ : .1 .1 .3 1.6 Infants' dietary supplement, .......... : Corn-soya"'milk ............. _ .................. : 4.8 4.7 2.5 .9 7.6 5.7 Wheat"'soya"'blend ........ f\ ................ : .4 .4 .2 3.2 3.5 Soybean cd1 cake and meal ............. : .1 Feeds and fodders ...................... : Tallow, inedible ................ : Tobacco, unmanufactured ............ : 7.1 13.9 Cattle hides .................... : Cotton .................................. : 11 10.7 6.1 Soybean ............................. : 9.0 10.0 1.7 .4 1.8 4.0 7.4 10.6 Nonalcoholic beverages •••••••••• : .9 Grain sorghum grits ............. : 2.2 .6 Other ...................... _.............. : .1 .1
--y L'!ss than 500. 1:.1 Reported in valUe only. 17 Less than $50,000.
AID
1973
11 70
2,064 11,065
147
1,867
1,115
4 1.1
10,994 8
10
49.1
.1
.1
.7 40.7 2.2
.2
.8
.9
.3 1.9 11 .2
1.0
1974
11 97
2
1,225
3 1/
33,801
10.3
]/ .1
11
1.0
.7
.1 6.9
1.5
~pecif1ed
Governmentfinanced progrBlDs
1973 1974
11 11 70 97
2,064 28,839 10,303 3,971 2,873 7,132 1,725
12,106 2,832 1,283 1,250
290 264 119,809 165,409
3,!161 14,085
1,115 1,225 94,846 77,209 30,237 29,347
4 3 1.1 11
10,994 33,801 6,095 10,646
10 62 19
89,115 57,749 237
25,563
334.7 224.6
.1 11
.1 .1
.7 lOB.8 47.5 91.2 55.3 20.2 6.1 28.8 9.4 9.1 12.7 2.1 2.2
11.3 15.6 .4 1.7 .8 1.0
14.9 11.3 4.0 3.7
.9 .8
.3 .1 1.9 6.9 7.1 13.9
.2 10.7 6.1 19.9 25.0
.9 2.8
1.2 1.5
,:::::::,.,~~",.-"-
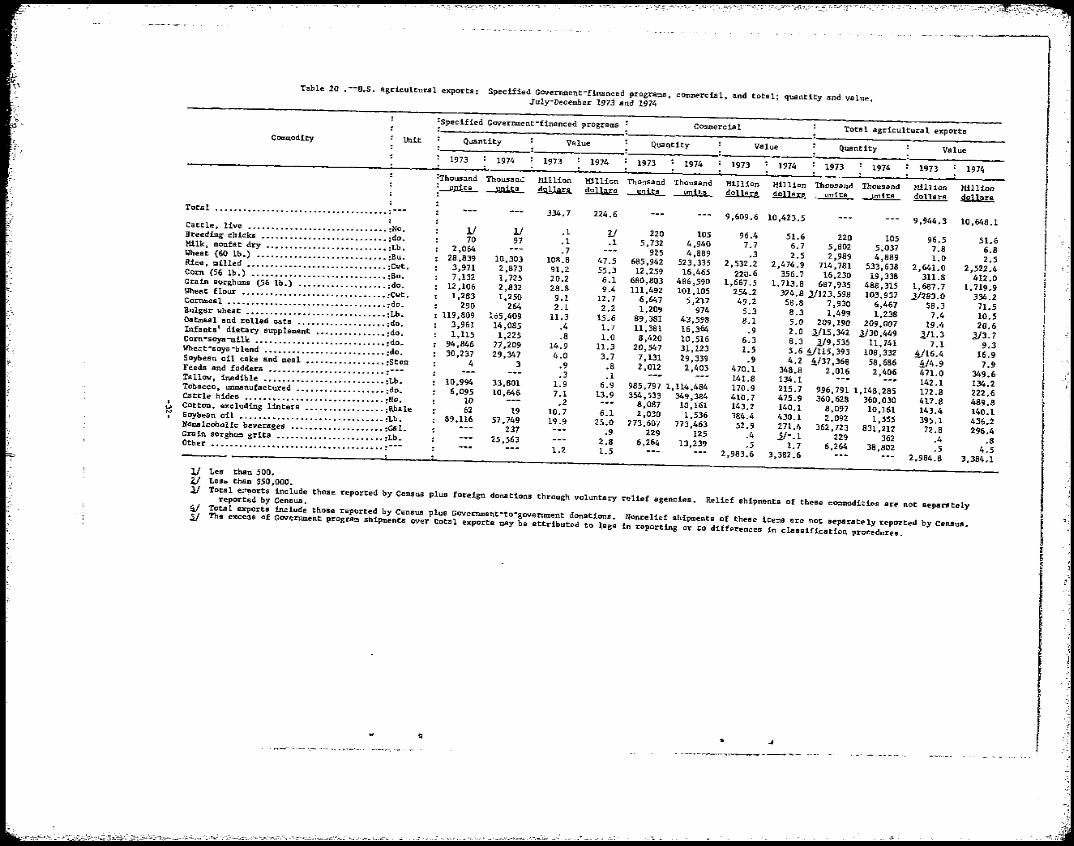
-- "-~~-.------,
'table 20 • --U.S. agricultural exports: Specified GOVernment-financed programs, commercial, and totsl; quantity and value,
July-Decetnber 1973 Bnd 1974
~Specified Gmrerrunent-financed programs Commercial 'total agricultural exportsCommodity Unit Q.JBntity Value Quantity Value Quantity Value
1973 1974 1973 1974 1973 1974 1973 1974 1973 1974 1973 1974 ''thousand ThousanC: Million Hillion 'thousand Thousand Million Million ThousBnd Thousand HillioR,:~ -J!!!!.!a. dollars dollars Hillion-J!!!!.!a. -J!!!!.!a. dollars ~ -.!!!!.ll.!.... ~ dollars dollars
Totd ..................................... : ___ 334.7 224.6 9,609.6 10,423.5 9,944.3 10,648.1Cattle. live ...........•.................. :No. 1.1 l.I .1 ?j 220Breeding chicks ........................... :do. 105 96.4 51.6 no10 97 .1 105 96.5 51.6.1 5,732 4,940Hilk, nonfat dry .......................... :Lb. 2,064 7.7 6.7 5,802 5,037 7.8 6.8Wheat (60 lb.) ............................ :Bu. .7 925 4,889 .3 2.5 2,98928,839 la,303 10R.8 4,889 1.0 2.5Rice, milled .............................. :Cwt. 47.5 685,942 523,335 2,532.2 2,474.9 714,781 533,6383,971 2,873 91.2 55.3 2,641.0 2,522.412,259 16,465Com (56 lb.) ............................. :Bu. 223.6 356.77,132 1,725 20.2 16,230 19,338 311.8 412.06.1 680,803 486,590 1,661.5Grain" sorghums (56 lb.) ................... :do. 12,106 1,713.8 687,935 488,315 1,687.72,832 28.8 1,719.99.4 111,492 101,105Wheat flour ............................... :Cwt. 1,283 1,250 9.1 12.7
254.2 324.8 2'123,598 103,937 1/283.0 334.26,647 5,217Cornmeal .................................. :do. 49.2 58.8 7,930 6,467290 264 2.1 2.2 58.3 71.51,209 974Bulgar "heat .............................. :Lb. 5.3 8.3119,809 ~o5,409 1,499 1,238 7.4 10.511.3 15.6 89,381Oatmes1 and rolled oats ................... :do. 3,961 14,085 .4 43,598 8.1 5.0 209,190 209,007 19.4 20.61.7 11,381 16,364Infants' dietary supplement ............... :do. 1,115 1,225 .9 2.0 2'15,342 1130,449 111.3.8 113.7Com-soya-milk ............................ :do. 1.0 8,420 10,516 6.3 8.3 119,535 11,74194,846 77,209 14.9 11.3 7.1 9.320,547 31,123Whe<:t-soya-blend •••••••••••••••••••••••••• :do. 1.5 5.6 !/U5,39330,237 29,347 108,332 !/l6.4 16.94.0 3.7Soybean oil cake and meal ................. :Ston 4 3 .9
7,131 29,339 .9 4.2 !i/37,368 58,686 !tI4.9 7.9Feeds and foddera ......................... : ___ .8 2,012 2,403 470.1 348.8 2,016 2,406 471.0.3 .1 349.6 -~;,Tallow, inedible .......................... :Lb. 141.8 134.110,994 33,801 1.9 6.9 142.1 134.2985,7971,114,484Tobacco, unmanufactured ......................... :do. 170.9 215.76,095 996,791 1,148.28510,646 7.1 172.8 22:l.6cattle hides .............................. ~No. 13.9 354,533 349,384 410.7, 475.9 360,628 360,03010 .2 417.8 489.8.... Cotton, excluding linters ••••••••••••••••• :Rbale 62 8,087 10,161 143.2 140.1 8,097 10,161, 19 10.7 6.1 2,030 1,536 384.4
143.4 140.1'" Soybean oil ............................... :Lb. 89,116 57,749 19.9 25.0 430.1 2,092 1,555 395.1 436.2273,607 773,463Nona lcoholic beverages •••••••••••••••••••• :Ga1. 52.9 271.4 362,723237 831,212 72.8.9 296.4229 125Grain sorghum grits ....................... :Lb. .4 .il-.l 229 36225,563 .4Other ..................................... , ___ 2.8 6,264 13,239 .8.5 1.1 6,264 38,8021.2 1.5 .5 4.52,983.6 3,382.6 2,984.8 3,384.1
11 Les than 500. V LeSb than $50,000.
,!1I Total ""ports include those reported by Censua plus foreign donations through VOluntary relief agencies. Relief shipments of these commodities are not separatelyrepOT.ted by Census.
if 'rotal exports include those reported by Census plus Gmrernment-to-gmremment donatiOnS. Nonrelief shipmenta of these items are not separstely reported by Cenaus. Sf The exce3B of Gmrernment program shipments over total exports may be attributed to lags in reporting or to differences in classification procedures.
-,{
1I ~
,~U"c:·;.;..:~~"""""'1.!"'c::::,'t<.:::~ "':~ -I- -~ •

.i
" "SPECIAL In this Issue
.18! 111111'11111111 lilal. 1IIIIIItl'II III 111111111111111111111.1111111.11 ••
U.S.-MEXICAN AGRICULTURAL TRADE AGAIN SETS NEW RECORDS
by
John E. Link
United States-Mexican agricultural trade continued its strong upward trend during 1974, reflecting rising Mexican food deficits and a general increase in price levels. U.S. agricultural exports to Mexico more than doubled the 1973 record and reached $863 million. U.S. agricultural imports from Mexico were up slightly from the 1973 peak and totaled $767 million.
Agricultural products advanced from 12 to 18 percent of total U.S. exports to Mexico, which rose 68 percent to $4.8 billion in 1974. In contrast, agriculture's share declined from about 33 percent to 23 percent of total U.S. imports from Mexico, which increased nearly 50 percent to $3.3 billion.
In 1970-72, the United States accounted for two-thirds of total Mexican imports. While this is.substantial, the U.S. share has actually declined about 10 percent from the mid-1960's as a result of Mexican diversification efforts. However, the U.S. is still an expanding market for Mexican goods. In 1963-65, the U.S. imported about 60 p~rcent of total Mexican exports and by 1970-72 this had increased to 88 percent. 1/ Or the agricultural side, the United States has increesed its share of both Mexican imports and exports. From 1963-65 to 1970-72, U.S. farm products increased from 60 to 66 percent of total Mexican agricultural imports. In the same period, the U.S. share of total Mexican agricultural exports went from one-half to nearly three-fourths.
In 1974, for the first time in recent years, the balance of U.S. agricultural trade with Mexico favored the United States (figure 1). Traditionally, the United States has had a favorable total balance of trade with Mexico which has nearly alw~ys been offset by U.S. tourist expenditures and investment flows to Mexico.
Maintaining food supplies and building up stocks expanded imports as prices continued to advance in 1974. The growing consumption of wheat products in Mexico pushed exports of U.S. wheat to a new record of over 1.01 million metric tons valued at $181 million in 1974.
1/ Based on U.S. trade statistics for U.S. imports from Mexico and Mexican trade data for Mexican exports to the United States.
-33
I

U.S. exports of corn, a basic food staple in Mexico, soared to 1.39 million tons valued at $194 million in 1974. This reflects a 67-percent increase in volume and about an 80-percent increase in price. Grain sorghum shipments also reached a record level of 451,000 tons valued at $55'.3 million. Grain sorghum is the primary feed grain used in Mexico, used mainly for poult~ and swine. A shortage of malting barley and increasing demand for beer pushed O.S; exports of barley to 180,000 tons valued at $26.2 million, up sharply from 56,000 tons in 1973 and the 1970-72 average of 4,000 tons.
As a result of anticipated lower soybean production in Mexico during 1974, U.S. exports of soybeans jumped to 337,000 tons valued at $81.6 million. up from 81,000 tons in 1973. Cottonseed exports were also higher. Soybean meal exports were down, but cottonseed meal exports were higher. Soybean oil exports were higher. offsetting a drop in cottonseed oil exports.
Most other U.S. farm exports to Mexico were higher. Exports of potatoes and dried beans were 30.4 million pounds and 113.7 million pounds, respectively, valued at $1.5 and $30.9 million. · I Mexico is placing more emphaSis on agricultural production but the 1975 crop will depend more on weather conditions than gove~tment policy. Because of a killing frost . I,which hit parts of Mexico in mid-September 1974, continued heavy imports of basic grains are expected throughou~ most of 1975. [
I Mexico is one of the main suppliers of U.S. agricultural imports, and accounted for 7.5 percent of the U.S. total in 1974, compared with 8.8 percent in 1973. The overall picture for farm imports from Mexico was mixed in 1974. Imports of live animals and animal prodUcts were generally lower as U.S. consumer demand weakened and U.S. live animal prices declined.
Fresh vegetable imports were down nearly 40 percent as a result of lower volume and lower prices for many items. Cucumbers were down 37 percent; onions, 23 percent; Bnd peppers and tomatoes, 44 percent. Tomatoes, the largest item in this group, were valued at $64.~ million as volume dropped from 749 million pounds in 1973 to 591 million pounds in 1974. Mexico is the main supplier of U.S. fresh vegetable imports.
Imports of fruits and preparations advanced moderately in 1974. The two main items, frozen strawberries and fresh cantaloupes, were valued at $25.2 million and $11.5 million, respectively•. The quantity of frozen strawberries was up slightly and with higher prices, total value increased about 9 percent above 1973.
Sugar imports from Mexico in 1974 of 1.07 billion pounds, wer~ down about 15 percent from 1973. Higher sugar prices, however, just about doubled total value to $229.2 ·V I
million. Slightly higher coffee prices failed to offset the decline in the quantity i imported, reducing the value of U.S. imports from Mexico 13 percent to $107.1 million. I
\.. f'
-34

U.S.-MEXICAN TRADE MIL. DOL.--------t----'-----.:....:..-.---r----__----, 8,000 6,000
4,000
40
20
10~~~~~~~~~~~~~~~~~~~~
1960 1966 1972 1978 LOGARITHMIC SCALE
USDA NEG. ERS 1021 - 75131
Figure 1
-35

'~-.;.-"o;' ;-.:.f,---" "'-:;;..;'~,
-~..,,-~~.~........~......--"".""-~-_""... ..."~.o:__' ____·~'-'_·___-""'~-'--____ '~ __'_~'_-'N
I
:::: ,
Table 21.--U.S. agricultural exports to Mexico: Quantity and value by commodity, calendar years 1965-74
Year Wheat,
urunilled, excluding re1iei'
Barley, unmilled
Corn, unmilled, exc.:
seed, exc.
Grain Soybean Soybean sorghum, S b 1'lollror·1 oil
UIIIIdlled, oy eans meal, cake and
1965 .............................. 81 1966 .............................. 24 1967 .............................. 120 1968 .............................. 2,417 1969 .............................. 2,600 1970 .............................. 4,808 1971 .............................. 199,693 1972 .............................. ,gj624,618 1973 .............................. 700,935 1974 .............................. 1,013,669
1965 1966 1967 1968 1969
.................................
..................................... 1970 .............................. . 19'71 .............................. : 19'72 1973 1974
................................
......................... .a ........ ..
1965 ............................. . 1966 ............................. . 1967 ............................ .. 1968 ............................ .. 1969 ............................. . 1970 ............................. . 1971 ............................. . 1972 ............................. . 1973 ............................. . 1974 ............................. .
1965 ............................ .. 1966 ............................. .. 1967 ............................. . 1968 ............................. .
6 2 8
144 159 296
12,8ll '2/41,679 - 72,783
181,521
cottonseed
1,265 879
1,249 1,055 4,257
17,120 30,414
337 7,191
38,204
291 237 .428 352
95,209 38,151 4,818 3,369 3,090 2,160 4,1185 5,363
56,128 180,272
7,469 3,0113
445 262 203 147 268 327
5,320 26,202
cottonseed oil cake and meal
o 18
263 220 442
1,764 16,483
82 14,515 29,938
o 1
21 17
reliei' exc. seed non-dei'atted: meal
14,995 10,4q8 14,1120 18,706 41,774
1191,509 16,001
186,708 828,1121
1,386,027
-- Metric tons -----'y'50,214 y45,771 y21,~20 1/89,591
7,744 20,771 12,176
241,584 18,237
450,901
11,768 650
7,0114 8,883
24,217 138,311 55,280 17,939 81,456
336,792
NA NA NA NA 1
48 771
9,908 59,368 32,967
--.1,000 ~,~ __
976 625 868
1,4692,996
32,153 1,252
12,691 78,556
194,148
Cottonseedoil
20,648 5,302
10 13
1,272 15,795
38 3
26,139 6,745
2,5902,212 1,003 4,596
425 1,131
743 13,873 1,062
55,278
Lard
484 71
892 1,019 2,726
14,629 6,604 2,06l
l7,185 81,597
-- Metric ~ -
5,058 6,936 7,098
10,804 15,970 20,180 11,807 .ll,932 18,846 23,293
-- l,ooO ~, ~.
6,241 1,578
3 4
1,510 2,234 1,850 2,276
NA NA NA NA 1
19 72
1,350 16,358 7,145
Tallow, inedible
394 1,265 1,447 3,776
17,815 30,842 l5,9292,lCii
17,026 20,422
83 229 224 562
26,523 18,297 14,354 1,963
830 4,104
113,308 49,294 29,030 24,494
2,500 1,987 1,545
233 86
372 12,063 5,7ll 7,};56 4,285
catt1e hides,
whole 3/
1,181 775
1,512 1,795 1,679 1,9962,125 1,7031,964 2,479
8,163 7,714
12,316 13,143
Soybean oil
1,034 ll5 37
5,162 3,130 7,132
171 96
20,1116 87,190
303 33 13
1,218 753
2,124 49 27
6,430 53,374
Beans, dTied, excluding
seed
1,194 5,282 5,377 6,787 7,360
17,7898,804 4,544 9,828
51,586
252 982
1,053 1,357
Continued -
,.
.~
~ ~ ..
';-~t4""".i":';c;.;:·~i~~~f';~.;'i';':,:v:?{.:.$'~,..:::"'\t~;..~~;:;<~ ~..,\ir.ki-':-:.;·"·"',;'¥""":",,;,.."'.'~~¥1t .r""~~l·~l;~>.P~_. \,,;'::-:...;=~;:", ..,.~".~i:,.~~...;.>~~t.~~" ,..._~,,;~ .~'~ , .. 2.-.c' _< ,:. ~:'>, '", ,,-',
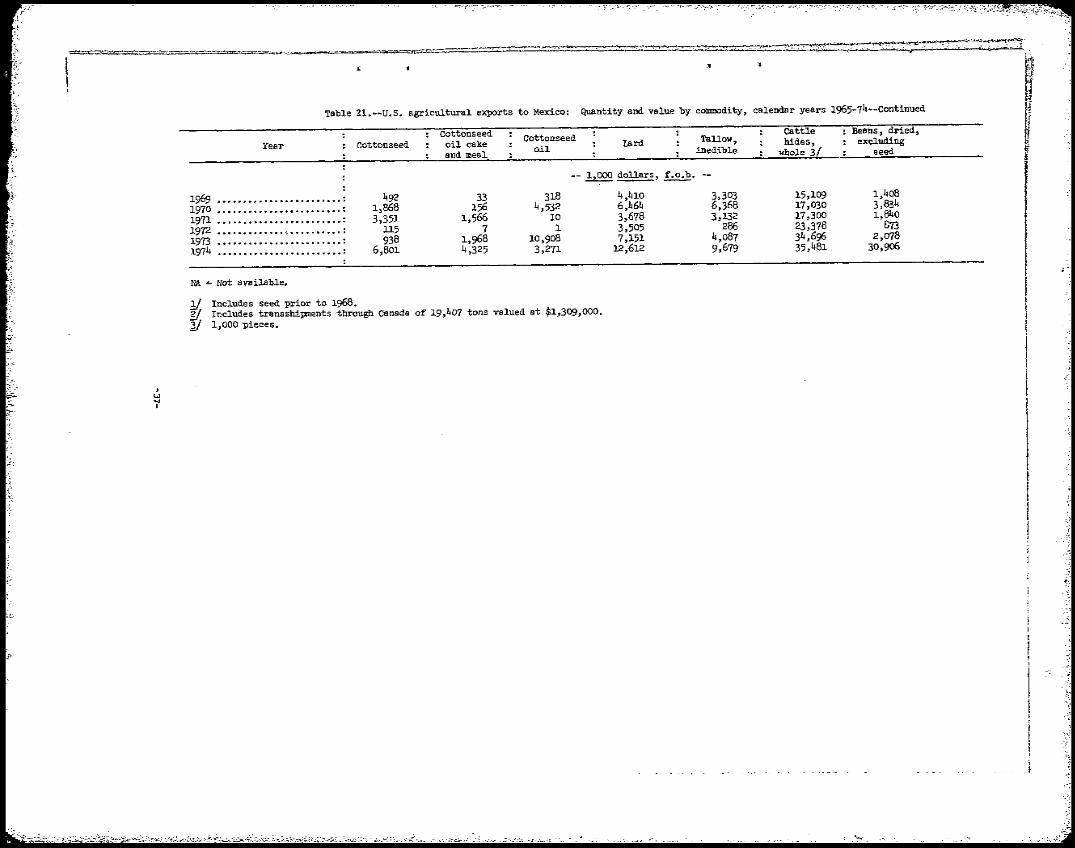
.( :t ..
Table 21.--U.S. agricultural exports to Mexico: Quantity and value by commodity, calendar years 1965-74--continued
cottonseed C tt d Cattle Beans, dried, Year Cottonseed oil cake 0 'lonsee Lard Tallow, hides, excluding
and meal oJ. inedible whole 3/ seed
-- 1,000 ~,~.
318 4,410 3,303 15,109 1,4081969 492 33 1970 1,868 156 4,532 6,464 6,368 17,030 3,834
1971 3,351 1,566 10 3,678 3,132 17,300 1,840 ll5 7 1 3,505 286 23,378 8731972
1,968 10,908 7,151 4,087 34,696 2,0781973 938 6,801 4,325 3,271 12,612 9,679 35,481 30,9061.974
NA = Not available.
1I Includes seed prior to 1968.E!. Includes transshd.pments through Canada of 19,407 tons valued at $1,309,000.JI 1,000 ~ieces •
....• .... I
I ·1 , I !
I
I I I
J
~,
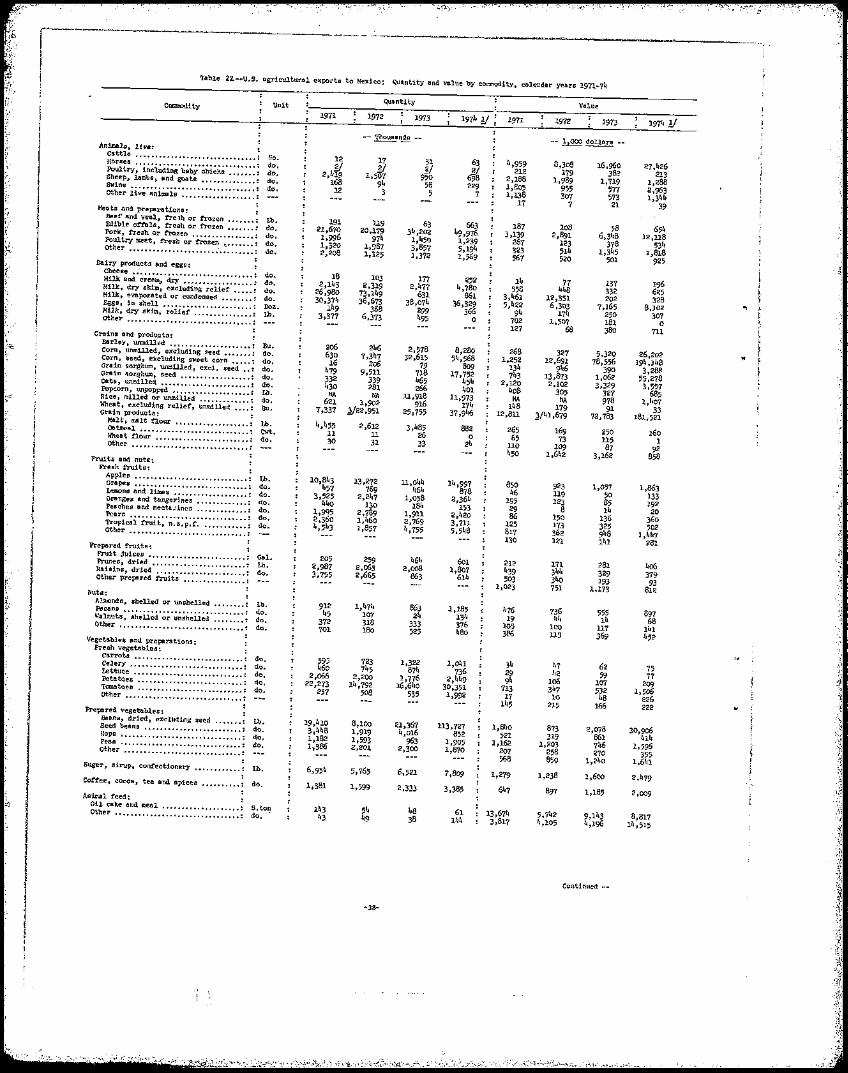
Table 22.--U.S. agricultursl exports to Mexico: Quantity and value by cormnodity, calendar years 1971"7~
Value
1972 1973
--hQQQ~ --
QuantityCCIID11O\litr Unit
1971 1972 1973
AnimBlsl live: : cattle .•.•••.•..•.••....••.•.... "•... : No, 12 31 PoultryJ including Daby chicks '" ~ ~ •• : do, Y ~/ 2/ Horses .••.•••..•.......•.•...•.. ~ ..•. : do. 63
2,419Sheep, lambs) Bnd goats............... d'o. 168 950 698
Swine ••.•••••••••.• do. 58 2290 ••••••••••••••••• : 12otber live animals ................... : 5 7
MeDts and preparations: : Beef' end veal, tre.lh or f'razen ••..•.. : tb. Edible ottals, fresh or :f'rozen ....... : do. 191 U9 63
21,6'10 20,179 34,202Pork, fresh Or fl"ozen •....•...•.••... : do. 1,996Poultry mee.t, f'resh or frozen do, 974 1,450'0 •••••• • l.,320 1,987 3,857other •.•..•.•..•...••............•.••
0
: do. 2,2oB 1,125 1,372 Dairy products tlnd eggs: :
Cheese .;...................... _............ : do. Milk and cream., dry ........................ : do. 25218 103 177
2,143 2,319 2,477Milk, dry ski'l'll., excluding relief ..••. : do. 4,78026,980 73,149Milk, evaporated or condensed ........... do. 631 86130,374 36,673 38,074Eggs, in shell ............................... : Doz. ~6,329149 368Milk, dry skim, reliet' ................ 0 .. : Lb. 299 3663,377 6,373 495other ................................ : o
Grains Blld products: Barley, unm.1lled .... 0 ....... 00 ............. : Bu. Corn, Unmilled, excluding seed do. 206 246 2,578 8,280 Corn, seed, excluding sweet corn ••... : do. 630 7,347 32,615 54,56816 206Grain $orghum, unmilled, exc1. seed •. : do. 79 809 Grain l\orehum, seed ..... 0 do. 17,752479 9,511 718
............... : 332 339 465Oats, unmilled .....•..•••.• o do. 454...... eo ••• : 430 281 266 401 Rice, milled or unmilled ............... : do .. NA NA 11,918 11,973 Wheat, excluding relief, urunilled ...... : Bu. 174
Popcorn, unpopped .... 0 ......................... : Lb. 621 1,902 916
Grain product!]: 7,337 ~22,951 25,755 37,946 Malt, malt tlour .•...• tb,0 ............... : ~,455 2,612 3,485 882Oatmeal ............ ~ ............ 0 ......... Cwt.: 11 11 26Wheat flour .• 0 do. o ...................... : 30 31 2433other .......................... :00 ......
Fruits Bnd nut£:: Fresh fruits: :
Apples ............................. : Lb. 10,843 13,272 ll,044Grapes •• 0 ....................... 0 ..... 0: do. 14,997 Lemons Bnd limes ............... 0 ....... do. 878457 769 464
3,525 2,247 1,058Oranges and tangerineo ............... : :
do. 440 2,364 'Peaches and necu ..'ines ................ : do. 153130 184
1,995 2,789 1,911Pears ............................. ".... : do. 2,4202,360 1,460Tropical f'ruit, n.s.p.f.•.....•.... : do. 2,769 3,711 other ................. :
4,543 1,857 1,,755 5,5480 ...............
Prepared i'rJ.its: Fruit juices ......................... : Gal. 205 259 461,Prunes, dried .•• , .. 0 Lb. 601••••••••••••••••• : 2,987 2,063 2,008Raisins, dried ......................... do. 1,807
3,755 2,665 863other prepared fruits ................... : 614
Nuts: AJ.xmds, shelled or unshelled .......... Lb. 9121'ecans .................................. : do. 863 1,185
45 24Walnuts, shelled or uhshelled ......... : do. 13"372Other .................... , .. do. 333 3760 .............. : 701 525 480 Vegetables and preperations:
Fresh vegetables: : Carrots .............................. : do. 59;; 723 1,322 1,041Celery ..•. e ' •••••••••••••• o ....... 0 • : do. 460 745 874Lettuce ................................ : do. 7362,066 2,200 1,776Potatoes .. : do. 2,4490 ........................... 22,273 14,792 16,640Tomatoes .................... *" *' ....... : do. 30,35l.
257 508other •..•..••.•... ~ ................. : 535 1,992
Prepared vegetables: : Beans j dried t excluding seed ........ 0: Lb. 19,410 8,100Seed beans ." .•.•..•••....•....•••.. : do. 21,367 113,7273,448 1,919Hops .... ,. ............................ : do. 4,016 8521,182 1,593PeBs ................. ~ •••••••••••••• : do. 963 1,9051,386 2,201 2,300Other .............................. : 1,870
Sugar, sirup, confectionery ............... : Lb. 6,521 7,809
Coffee, cocoa, tee and. spices ............ : do. 2,333 3,385
Animal feed: Oil cake and mea! .....•.••.•......•.. : S .. ton 143 48other .•.•• o ............ 0., 0., 0 •••••••• : do•. 6143 38 144
-38
1971
4,959 212
2,188 1,805 1,138
17
187 3,139
267 323 567
14 558
3,461 5.422
94 702 127
268 1,252
134 743
2,120 40B
NA 148
12,8ll
265 65
110 450
850 46
195 29 86
125 817 130
212 439 503
1,023
476 19
1.05 386
31, 29 94
713 17
145
l,8!10 521
1,162 207 568
1,279
647
13,674 3,817
197~ Y
27,426 213
1,288 2,963 1,344
39
654 12,ll8
534 1,818
925
196 625 328
8,102 307
o 711
26,202 194,148
3,288 55,278 3,557
685 1,407
33 181,521
160 1
92 858
1,863 133 192
20 360 502
1,447 281
406 379
93 812
897 68
141 452
75 77
209 1.506
226 222
30,906 414
1,596 355
1,641
2,479
8,817 14,515
O,3oB 179
1,989 955 307
7
loB 2,891
123 514 520
77 448
12,351 6,303
174 .1,507
6B
327 12,691
946 13,873
2,102 305
Nt. 179
1/41 ,679
169 73
109 1,642
923 119 123
8 150 173 362 121
171 344 340 751
736 41,
100 ll5
117 1'2
106 347 10
215
873 319
1,203 258 85Q
1,238
897
5,742 /',105
16,960 382
1,719 577 573 21
58 6,348
378 1,345
501
137 332 202
7,165 250 181 380
5.320 78,556
390 1,062 3,329
327 978 91
72,783
250 115 87
3,162
1,057 50 85 14
136 325 q48 i41
281 329 193
1,173
555 11,
ll7 369
62 59
107 532 48
166
2,078 861 746 270
1,240
1,600
1,185
Continued -
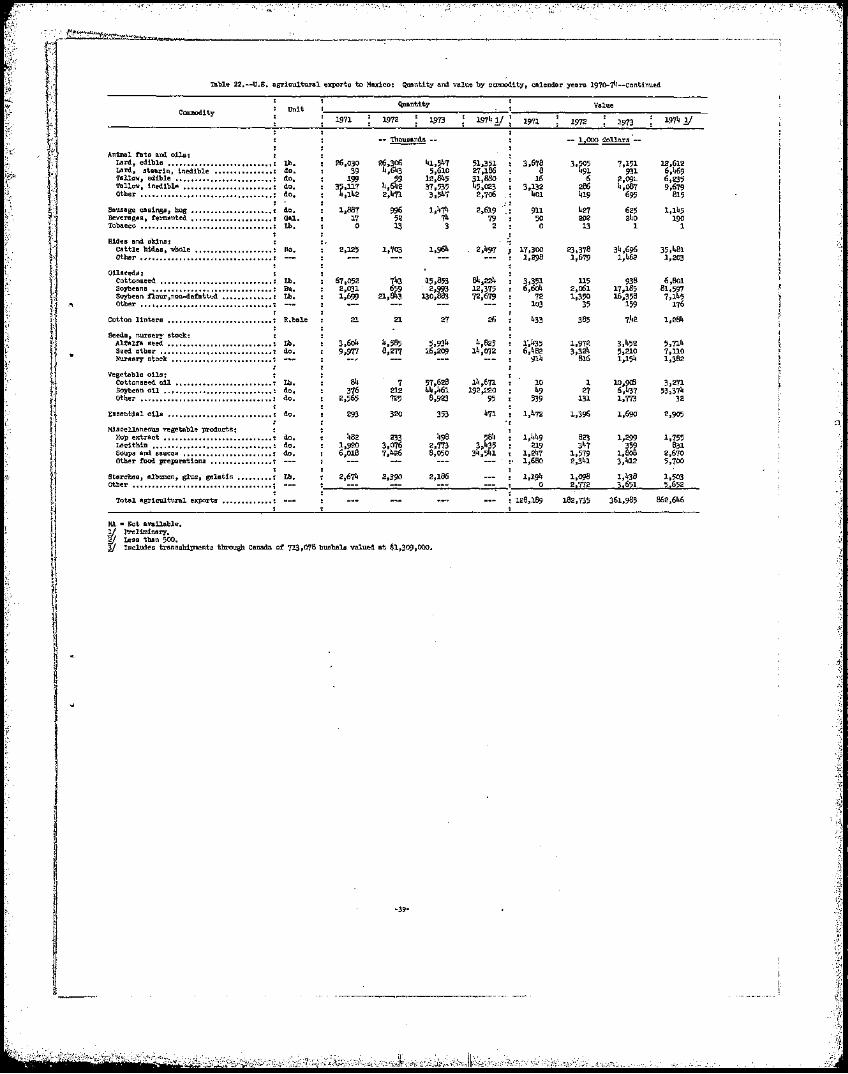
'~.'.;•.'~' o~:."""=·,.T=.~~·'(\j;li",,","_"""''''M_--"-___:;;''''''_....".'!-~~~""""'; .•__~__
;~: Table 22.--U.B. agricUltural exports to lIexico, Quantity ond value by C~1ty, cslendar yeors 197o-~--continued
c' __________________~--~~------------------~---------------------Quantity ValUe
,~., CClIIlI1lOdity Unit 1971 1972 1973 1971 1972 1973 1974 Y
-.. ~- ... .... hQQQ~ .....
Animal hts and olla, Lard, edible ••••••••••••••••••••••••••• Ul. 26,030 26,306 41,547 51,351 3,678 7.151 12,6123.~05 Lard, steer1n, inedible ...••••.•.••.•• do. 39 4,643 5,610 27,186 8 91 931 6,469 Tallow, edible ••••••••••••••••••••••••• do. 199 59 12,645 31,880 16 6 2,091:. 6.235 Tallow, inedible ••••••••••••••••••••••• do. 35,117 4,642 37,535 45,023 3,132 286 4,087 9,679 otber •••••••••••••••••••••••••••••••••• do. 4,142 2,471 3,547 2,706 401 419 695 815
Sausage casings, hog ••••••••••••••••••••• do. 1,887 996 1,474 2.619 911 427 625 1,145 Beverages, fermented •••••....••••.••••••• 011. 17 52 74 79 50 202 240 190 Tobacco •••••••••••••••••••••••••••••••••• Ul. 0 13 3 2 0 13 1 1
Hides and a'ld.ns: ,. Cattle bides, ",hole ......••.....•••...• No. 2,125 1,703 1,964 17,300 23,378 34,696 35,481 other ................................. . 1,298 1,679 1,462 1,203
OUseeds: cottonseed •.......••..••... , .....•..... Ul. 67,052 743 <15,853 3,351 115 938 6,801 Soybeans •••••••••••••• ~ I ............... . Bu. 2.031 2,993 6,604 2,061 17,185 81,5fsSoybean tlour,non-detntt.r;d .............. . Ul. 1,699 21,ru:9
3 130,883 72 1,350 16,358 7,15 Other •.. 4 ••••••••••••• 0 •••••••••••••••• 103 35 159 176
Cotton linters ........................... . 21 21 27 433 385 7.42 1,264
Seeds, nurser:' stock: AltaJ.1'a seed; ..........'. _......... ~ ....... . Ul. 3,604 4,565 5,934 4,825 1~435 1,972 3,452 5,714 Seed other ............. , ................. . do. 9,977 8,277 16,209 14,0'/2 6,482 3,324 5,210 7,110 NuJ:-ser;y stock .......... , ................. . ~14 81G 1,154 1,382
Vegetable oUs: cottonseed oil • _.••••••••••••••• , •••••• Ul. 64 7 57,628 14,E'71 10 1 10,~ 3,271 Soybean oU •.•• , ••••••••••••••••••••••• do. 376 212 44,461 192,~!20 49 27 6, 37 53,374 otber ••••••••••••••••••.••••••••••••••• do. 2,565 725 8,923 95 539 131 1,773 32
Essential oUs •..•••.••••••.••.•••••••••• do. 293 320 353 471 1,472 1,396 1,690 2,905
Miscellaneous Yegetable products: Hop extract ...•.••.••.........•..•••••. do. 482 233 496 564 1,449 823 1,299 1,755 Lecitbin •••.••••••••••••••••••••••••••• do. 1,920 3,076 2,773 3.435 219 347 359 831 Soups and sauccs ••••.•••••.••••..••.••• do. 6,018 7,4r-6 8,050 34,541 1,247 1,579 1,808 2,670 other food preparetions .••••••..••.•••• 1,680 2,341 3,412 5,700
starches, albumen, glue, gelatin .•.•....• Ul. 2,674 2,390 2,186 l,19~ 1,098 1,438 1.503 other •••.••••.••••.••••••••••••••.••••••• 0 2,772 3,651 5,652
Tote1 agricultura1 export. 128,189 182,735 361,985 862,646
NA so Not available. y. Prel:1m1nsI7.Y. Les. than 500. 'fJ Include. tren.sbipoent. tbrougb Canada ot: 713,078 bushal. valUed at $1,309,000.
;
i -39
1
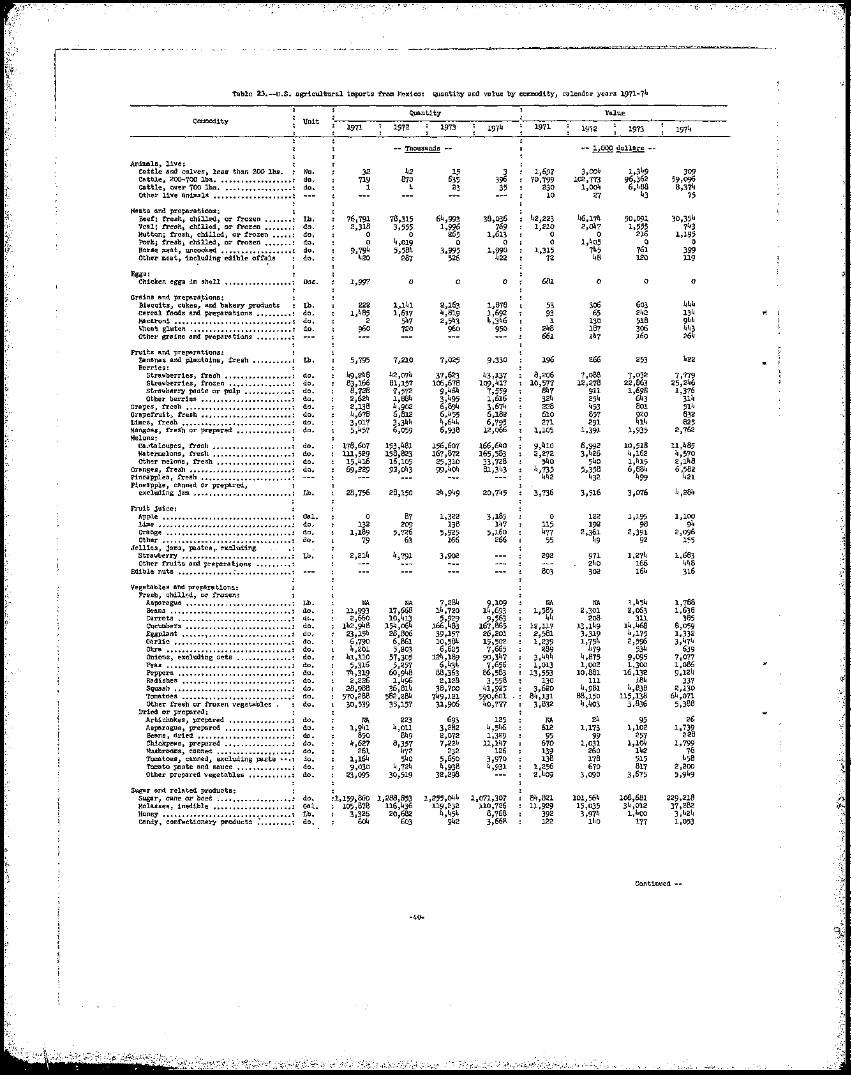
I~----"
I Ta,ble 23 ..... U.S. agricultural imports !'rom Mexico: QU3ntit~{' and value by commodityj calendar years 1971-7~
Quantity Value I Commodity Unit
1971 1972 1973 1974 1971 1972 1973 1974
..-~-- "-bQQQ~--
Animals) 11ve: cattle and calves, less than 200 Ibs. No. 32 42 15 3 1,697 3,004 1,349 309 Cattle, 200...700 lbn .•••••••.••• ,...... do. 71~ 870 635 396 70,799 102,773 96,362 59,096 cattle, over 700 lbo .........•.•.... o. do. 1 4 23 35 230 1,004 6,488 8,374 other 11ve animals •.••.• ~ •••••.••....• 10 27 43 75
Meats and preparations: Beet; fresh, chilled, or frozen ...•... Lb. 76,791 78,315 64,993 38,036 42,223 46,174 50,09l. 30,354 Veal! .fresh, chilled, or frozen .....•. do. 2,318 3,555 1,996 769 1,210 2,047 1,555 743 Mutton j fresh J chilled, at' frozen ..••. do. o o 265 1,613 o o 216 1,195 Pork; fresh, chilled, or !"razen ••..•.• do. o 4,019 o 1,405 o o Horse meat, uncooked •••••••.•.•••••.•• do. 9,794 5,584 3,995° 1,990° 1,315 745 761 399 other meat, including edible of'1'a,ls do. 420 287 526 422 72 48 120 119
Eggs: Chicken eggs in sh~ll ••••••••••••••••• Do:;. 1,997 o 681 o o o° °
Grains and prepara.tions: Biscuits, cllkes, and bakery products Lb. 222 1,141 2,163 1,878 53 306 603 Cereal foods and pt'eparat1ons ••....••• do. 1,485 1,617 4,819 1,692 93 65 242 ;Ii.
Macaroni .•••.•••.•.•...•..•..••.•...•• do. 2 547 2,543 4,346 1 130 518 Wheat gluten .•..•••.•••.•.•....•...••• do. 960 720 960 950 248 187 306 other grains and -preparations ........ . 661 147 160
Fruits and preparations: Bananas and plantains, t'resh •.. ,. •••••• Lb. 5,795 7,210 7,025 9,330 266 253 422 Berries: .
Strs'Ioiberries, fresh ..•.•.•..•..•..•• do. 49,248 42,074 37,623 43,137 8,206 7,088 7,032 7,779 Strawberries, frozen •.••••....••..•• do. 83,166 81,157 106,678 109,417 10,577 12,278 22,863 25,246 Strawberry paste or pulp •.•••••.•••• do. 8,128 'rt.512 9,464 7,559 847 911 1,698 1,376 Other berries ...... 4 •••••••••••••••••• do. 2,624 1,884 3,495 1,616 324 254 643 314
Grapes, fiesh ................................ . do. 2,138 4,902 6,894 3,674 228 453 801 514 Grapef'ruit, f"resh ...... ,.,. ... ,. .. ,. ....... ,.,. .... .. do. 4,678 6,812 6,455 6,182 610 657 920 832 Limes, fl'esh ................... 0 .0 ••• 0 ....... .. do. 3,017 3,344 4,644 6,795 271 291 414 625 Mangoes J fresh or prepared ............... . do. 5,457 6,059 6,938 12,066 1,105 1,391 1,935 2,762 Melons:
Ca.~t810upes, i'resh .................... . do. 178,607 153,481 156,607 166,640 9,1110 6,992 10,516 11,485 Watermelons, fresh ..................... . do. lll,529 158,823 167,872 165,583 2,272 3,426 4,162 4,570 other melons, fresh ..................... . do. 15,416 16,105 25,310 33,728 540 540 1,415 2,148
Oranges, i'resh ..................................... .. do. 69,229 92,043 99,404 81,343 4,735 5,358 6,884 6,562 Pineapples, fresh .......................... . 442 432 499 421 Pineapple, cnnned or prepared,
excluding jam ......... o .................... . Lb. 28,756 28,150 3,736 3,516 3,076 4,284
Fruit juice: Apple ................................ . Gal. 87 1,322 3,185 122 1,195 1,100 IJJne .................................. do. 132° 209 138 147 115° 192 98 94 Orange ...... ~ ......... . do. 1,189 5,726 5,925 5,160 477 2,361 2,391 2,0960 ....................
other ................................ . do. 79 63 166 266 55 49 92 1~5 Jellies, jams, pastes,. ex~uding
Strawberry ............... 0 ......... 0 .... . Lb, 2,214 4,791 3,902 292 971 1,274 1,683 Other fruits aoo preparations ......... . 240 166 448
Edible nuts ......•....... : ...... ~ ...•..• 803 302 164 316
Vegetables and preparations: Fresh, chilled, or hozen:
Anparagus ............ , ................. . Lb. Nt. Nt. 7,284 9,109 llA NA 1,454 1,788 Besns .................................... . do. 11,993 17,668 14,720 14,693 2,301 2,063 1,6361,5~ZCarrots ................................ . 2,660 10,413 5,929 9,563 208 311 385 Cllcumbera ............................ . do. 142,948 154,064 166,483 167,865 12,117 13 ,149 14,468 8,059 Eggplant ....... , ..................... . do. 23,154 28,806 39,157 26,201 2,581 3,319 4,175 1,332 Ge.rlic •••...•.•...•.•..••....••....• do. 6,790 6,861 10,584 15,502 1,239 1,754 2,596 3,474 Oitra ............................... . do. 4,201 5,203 6,625 7,665 289 479 534 639 onions, excluding sets ................ . do. 41,110 57,305 124,189 9C,347 3,444 4,875 9,095 7,077 Peas ................................ . do. 5,316 5,257 6,434 7,656 1,013 1,002 1,300 1,086 Peppers .0' .0 ...... 0 ..................... . do. 74,319 60,948 88,363 86,583 13,553 10,881 16,132 9,124 IUtdishes ................................. .. do. 2,226 1,496 2,128 3,558 130 111 l84 337 Squash •••••••••••••••••••••••••••••• do. 28,988 36,814 38,700 41,925 3,620 4,981 4,838 2,130
0Tomatoes .............................. ... do. 570,288 582,284 749,121 590,601 84,131 88,150 115,138 64,071 other fresh or 1'rozen vegetables .. do. 30,539 35,157 31,906 40,777 3,832 11,403 3,836 5,388
Dried or prepared: Artichokes, pre:pared .......... 0""".' .. . do. Nt. 223 693 125 Nt. 24 95 26 Asparagus, prepared ................. .. do. 1,941 4,011 3,282 4,546 612 1,173 1,102 1,739 Beans, dried ............................ .. <lo. 850 849 2,072 1,329 95 99 257 228
0Chickpeas, prepared ................. .. do. 4,627 8,357 7,224 11,147 670 1,031 1,104 1,799 Mushrooms, canned ...................... . do. 261 472 232 126 139 260 142 78 Tomatoes, canned, excluding paste ... .. Jo. 1,164 540 5,650 3,970 138 178 515 458 Tomato paste and sBu,ce ................ . do. 9,030 4,724 1,,936 4,931 1,256 670 617 2,200 Other prepared vegetables ............. . do. 23,095 30,519 32,298 2,409 3,090 3,675 5,949
Sugar and related products: Sugar, cane or beet ...................... .. do. ;1,159,860 1,288,853 1,255,0Ii4 1,071,)07 84,821 101,564 108,661 229,218 Molasses, inedible ........................ . Gal. : 105,878 116,436 119,232 110,726 11,929 15,035 34,012 37,282 Honey .................................. . Lb. 20,682 4,454 8,768 392 3,974 1,400 3,1,24 candy, confectionery products : ........ . do. 603 942 3,66R 122 140 177 1,053
3,~
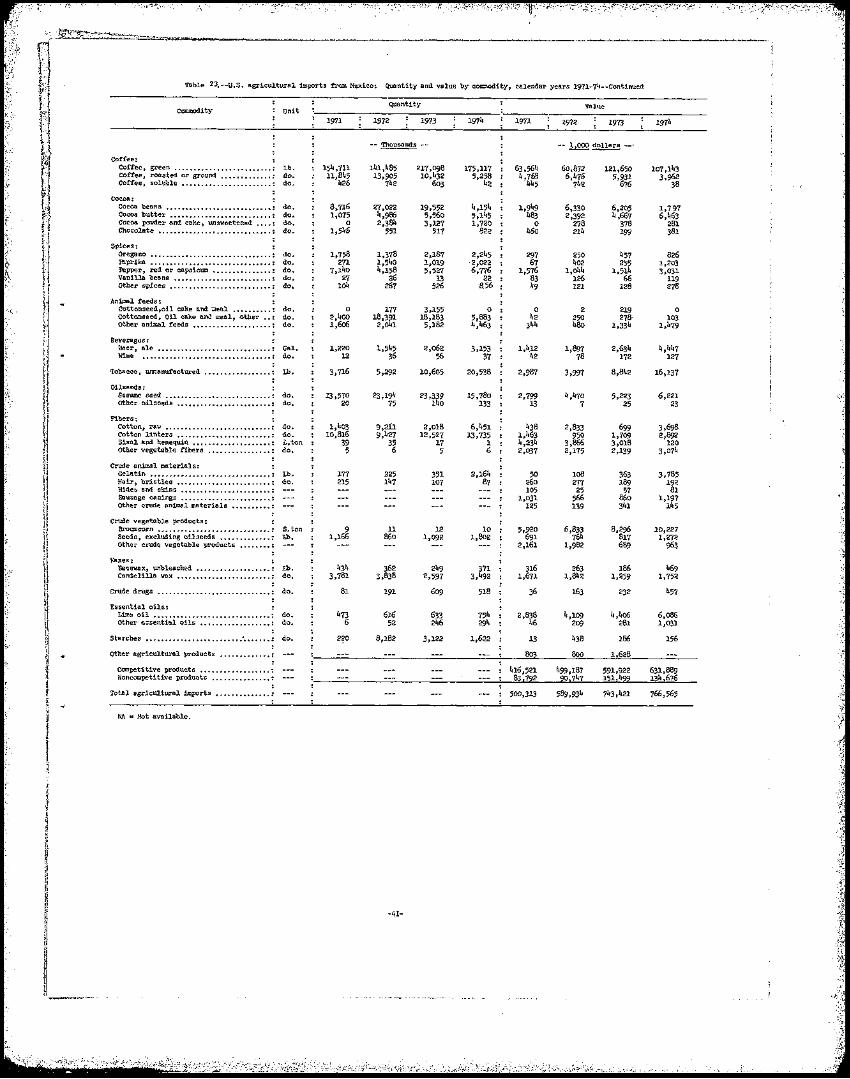
••••••••••••••••••••
~ I j
Table 23.--U.S. agricultural-imports from Mexico: Q;uantity and 'Value by commadity, calendsI' years 1971-74--continued
Commodity
Coffee: Coffee, green ........................ . Cartee, roasted or ground ............ . Coffee, soluble ..••...................
Cocoa: Cocoa beans ••••••••••••••••••••••••••• Cocoa butter •.•••..••....•.•.•..••...• Cocoa p:M1er and cake J unsweetened .•.. Chocolate •....... 0
Spices: Oregano ••..••••••..••..•••.•...••••••• IIlprika ••••••••••••••••••••••••••••••• Pepper, red or capaiCUIll ••••••••••••••• Vanilla beans •.......•........••.•.... Other spices ••......•........•......••
Animal feeds: Cottonseed,oil cake atxl ;ileal ...•...... cotto.."1seed, OU cake aoo. meal, other .. O~ber animal feeds .................... .
Beverages: Beer, ale ............................. . Wine ....•...........•......•....•...•
Tobacco t unmanufac.tured ...........•....•
Oilseeds: Sesame seed. ........................... . other oilseedB .....•.......•..........
Fibers: Cotton, raw ............................ . Cotton linters .........•. L ••••••••••••
Sisal and henequin ................... .. other vegetable fibers ........•...... ~
Crude animal materials: Gelatin .................................... . Hail:-, bristles ••••.............•.....• Hides and skins ....................... .. SOusage casings ....................... .. other crude animal materials ....•....•
Crude vegetable produc.ts: Broomcorn •••••••••.•••••.•.••••••.•••. Seeds t excluding oilseed:; ............ .. Other crude vegettab1e products
waxes: Be~swax, Wlbleached ....••.......••.... Candelilla wax •• ~ •••••••••••••••••••••
Crude drugs •••••••••••••••••••••••••••••
EssenUal oils: Lime oil, .•...•...........•..•.....••.. Other e3sential. oils .................•
starches ......................•• / •.....•
Other agricUl.tural :prooucts ........•....
Competitive products ...........•...... Noncompetitive products ..............•
Total agricul.t1U'sl jmports
NA = Not available.
unit
Lb. do. do.
do. do. do. do.
do. do. do. do. do.
do. do. do.
Gal. do.
Lb.
do. do.
do. do. i..ton do.
Lb. do.
S.ton Lb.
Lb. do.
do.
do. do.
do.
1971
l54,71l. 11,845
426
8,716 1,075
0 1,546
1,758 271
7,140 27
104
0 2,400 1,606
1,220 l2
3,716
13,570 20
1,403 10,816
39 5
177 215
9 1,166
434 3,781
81
473 6
2?0
Quantity Value
1972 1973 1974 1971 1972 1973 197~
--!h~ - --b£QQ~ "-'
141,485 13,905
742
217,098 10,432
603
175,117 5,258
42
63,561, 4,768
445
60,872 6,476
742
121,650 5,931
676
107,143 3,962
38
27,022 4,986 2,384
551
19,552 5,560 3,127
517
4,154 5,145 1,720
822
1,949 483
0 460
6,330 2,392
278 214
6,205 4,667
378 199
1,797 6,463
281 381
1,378 1,540 4,158
26 267
2,187 1,019 5,527
13 526
2,245 '2,022 6,776
22 8,56
297 67
1,576 83 49
250 402
1,044 126 121
457 255
1,514 66
128
826 1,203 3,03!.
119 278
177 18,391
2,041
3,155 18,183
5,182
0 5,883 4,463
0 42
344
2 250 480
219 278~
1,334
0 103
1,479
1,545 36
2,062 56
3,153 37
1,4.l2 42
1,897 78
2,634 172
4,447 127
5,292 10,605 20,538 2,987 3,997 8,842 16,137
23,194 75
23,339 140
15,780 133
2,799 13
4,470 7
5,223 25
6,221 23
'cl:,
9,2il 9,427
35 6
2,018 12,527
17 5
6,451 13,735
1 6
438 1,463 4,234 2,037
2,833 950
3,866 2,175
699 1,709 3,018 2,139
3,698 2,892
120 3,074
"
\ 225 147
351 107
2,164 87
50 260 105
1,031 125
108 277 25
566 139
363 189
57 860 341
3,785 192
81 1,197
145
11 860
12 1,092
10 1,802
5,920 691
2,161
6,833 764
1,982
8,p.96 817 689
10,227 1,272
963
362 3,838
249 2,597
371 3,492
316 1,671
263 1,842
186 1,259
469 1,752
191 609 518 36 163 232 457
616 52
633 246
754 294
2,838 46
4,109 209
4,406 281
6,086 1,031
8,182 3,122 1,622 13 438 186 156
803 800 1,628
416,521 83,722
499,187 22,747
591,922 151 ,422
631,889 134,676
500,313 589,934 743,421 766,565
I
!
i
I
i
I !
I I
I !
i
1
I
i
• •
"
.~
SPECIAL .n this .ssue
ili!l i3 eo 2 : aa as : 82 3 2 2 ili3: [j s n e 81!! ii i j sa iii it lIB eEIi eii JUII Ii ii a a I!I nUl II i! .. I II 11111 :; III II
U.S.-USSR AGRICULTURAL TRADE, 1972-74
by
~Linda A. Bernstein ,
· ,
· •Exports
U.S. agricultural exports to the USSR (excluding transshipments through Canada) grew from $430 million in 1972 to a peak of $921 million in 1973, but then dropped to $300 million last year. Wheat and corn were overwhelmingly the most important commodities exported. Nearly one-fourth of all U.S. wheat exports in. 1973, and 13 percent in 1972, were shipped to the USSR.
Table 24.--u.s. exports of wheat and corn to the USSR, 1972-74
Year Wheat Corn
Metric tons
1972 2.7 3.1 1973 8.7 4.2 1974 1.1 2.0
Soybeans were the next most important U.S.
Total grain value
Million dollars ~
364 "',
836 277
• export to the USSR in 1972 and 1973. In
1972, 392,000 tons of soybeans valued at $53 million were shipped to the USSR. This .•
trade increased to 482,000 tons valued at $72 million in 1973. But none were exported in 1974, and no purchases have been made for delivery in 1975. The 1972/73 soybean purchase was an unusual occurrence, and does not represent the historical pattern, although the USSR is a probable future market for substmltia1 sales of soybeans. In 1974, agricultural commodities accounted for 49 percent of total U.S. exports to the USSR, as opposed to 77 percent in 1973.
,I
~
-42

In addition to grains, U.S. agricultural exports to the USSR also included sheep and cattle hides, almonds, hope;1 and lemons in 1974. These commodities, which had amounted to $5.8 million in 1973, reached $20.7 million in 1974. The United States exported linseed oil to the USSR valued at $5.6 million in 191-, but none in 1974.
Prior to 1972, U.S. agricultural exports to the USSR were relatively small and consisted primarily of cattle hides. The principal exception was the grain purchase following the 1963 Soviet crop failure, which pushed U.S. agricultural exports to the USSR in 1964 to $137 million;
U.S.-Soviet agricultural trade in 1973 was unrepresentative because it reflected the impact of the poor 1972 grain crop in the USSR, and the resultant large wheat purchases from other countries. Nevertheless, the Soviets are expected to continue to import substantial quantities of U.S. grain, especially feed grains. During the feed grain marketing years, 1971/72-1974/75, 11 u.s. feed grain exports to the USSR averaged 3.2 million tons, ranging from 1.1 to 4.7 million tons.
Imports
The United States imported $3.8 million worth of agricultural commodities from the USSR in 1972; $4.7 million worth in 1973; and $8.5 million in 1974, consisting primarily of furslins. These agricultural commodities represented less than 5 percent of total U.S. imports from the Soviet Union.
11 Including a forecast of the balance of the current marketing year.
-43

I SPECIAL in this •Issue "
11'1111111111.'1 Iii! 1'111111 1II1IIIIII II Ili.llllllllllll. 1111 •••••• 11 ••••
INTERNATIONAL COMMODITY PRICES CONTINUED HIGH IN 1974
by
H. Christine Col:ins
The rising trend in international <lgr.'· 'lltural commodity prices that began in late 1972 continued into 1974, when the Dow Joned commodity spot price index increased an average of 40 percent from 1973. Yet, recent developments suggest that the 1974 price rallyhas ended.
Prices of soybeans and soybean meal, cotton, and imported cow meat took sharp downturns in 1974, following increases in 1973. Wheat, corn, sorghum, rice, coffee, sugar, cocoa bean, and rubber prices continued their upsurge, reaching all-time highs, but by year'send also had started to weaken.
The quantity of U.S. agricultural exports declined 10 percent from 1973 to 1974, w:l.th smaller shipments of wheat, wheat flour, corn, cot~on, and whole cattle hides. Smaller exports to the USSR caused most of the volume loss.
High 1974 prices have dampened U.S. export demand. Moreover, many foreign customers, including Japan and Western Europe, faced serious economic difficulties brought on by the oil crisis. The triple threat of high international agricultural prices, high oil prices. and decl~ning real GNP's may have sheared the buying power of our chief trading partners by the end of the year. Meanwhile, adverse weather cut U.S. grain harvests in the fall, limiting the amount of grain available for selling abroad.
Specific commodity development are as follows:
The f.o.b. vessel, Gulf ports price for U.S. No.2 Hard Winter Wheat climbed 20 percent to average $167 a ton in 1974.
In early 1974, U.S. wheat stocks were low since U.S. wheat exports were just coming down from the frantic pace of July-December 1973. In mid-1974, the U.S. harvested a 49-million ton wheat harvest--a record crop, but of a lesser magnitude than had emrlier been anticipated. Thus, supplies for fiscal 1975 again appeared to be insufficient to meet export and domestic needs without further depleting stocks.
-44
'.
~
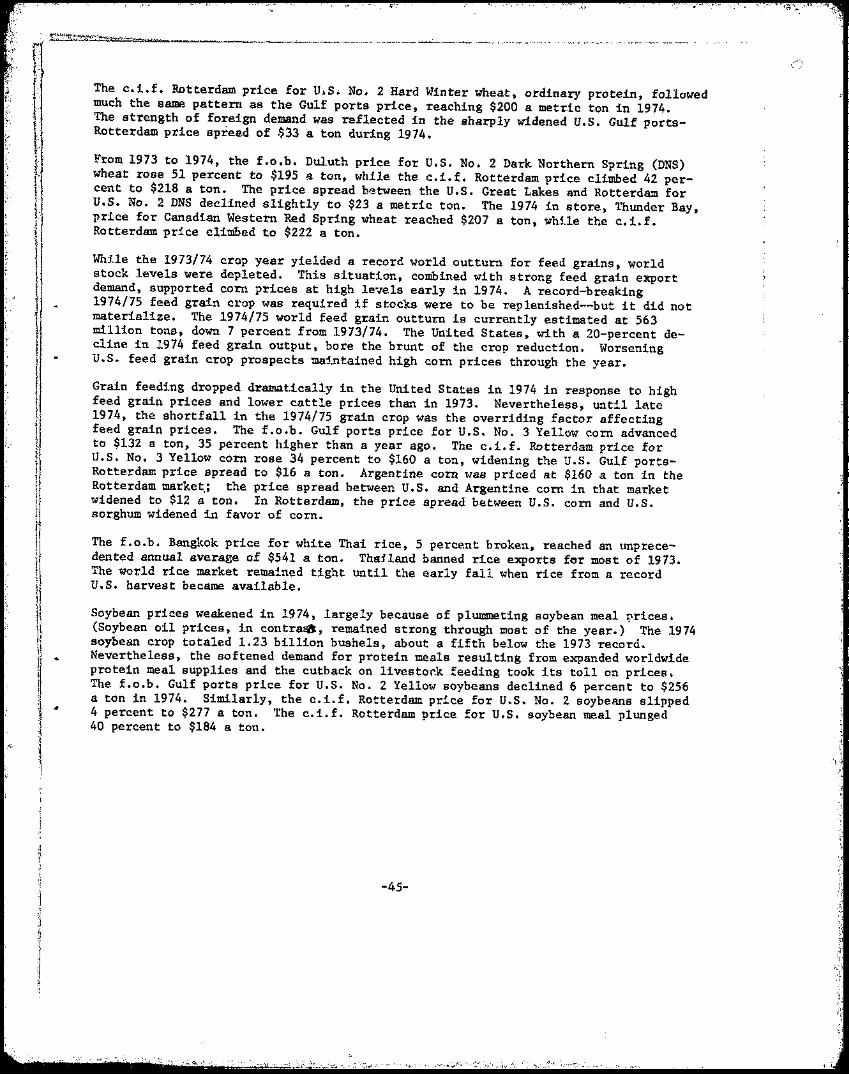
~ ~~t;::~P:~h!~~;'~O~~;;~~ =!:~:~n;$~;O-;~~~~-~t~!~i~:~:~d•....,.. The strength of foreign demand was reflected in the sharply widened U.S. Gulf ports•.' Rotterdam price spread of $33 a ton during 1974.
j From 1973 to 1974, the f.o.b. Duluth price for U.S. No. 2 Dark Northern Spring (DNS)r wheat rose 51 percent to $195 :'1 ton, while the c.L£. Rotterdam price climbed 42 pert cent to $218 a ton. The price spread between the U.S. Great Lakes and Rotterdam for It U.S. No. 2 DNS declined slightly to $23 a metric ton. The 1974 in store, Thunder Bay, ~'j price for Canadian Western Red Spring wheat reached $207 a ton, while the c.1. f. ~·••.' Rotterdam price climbed to $222 a ton.
. While the 1973/74 crop year Yielded a record world outturn for feed grains, worldl stock levels were depleted. This situation, combined with strong feed grain export ~ demand, supported corn prices at high 1e~e1s early in 1974. A record-breaking f 1974/75 feed grain crop was required if stocks were to be rep1enished--but it did not '1· materialize. The 1974/75 world feed grain outturn is currently estimated at 563 t million tons, down 7 percent from 1973/74. The United States, with a 20-percent del cline in 1974 feed grain output, bore the brunt of the crop reduction. Worsening I U.S. feed grain crop prospects ma:tntained high corn prices through the year.
I;. Grain feeding dropped dramat:ically in the United States in 1974 in response to high , feed grain prices and lower cattle prices than in 1973. Nevertheless, until late
1974, the shortfall in the 1974/75 grain crop was the overriding factor affectingI '
feed grain prices. The f. o.b. Gulf ports price for U. S. No. 3 Yellow com advancedt to $132 a ton, 35 percent higher than a year ago. The c.i.f. Rotterdam price for U.S. No. 3 Yellow corn rose 34 percent to $160 a ton, widening the U.S. Gulf ports-
II' Rotterdam price spread to $16 a ton. Argentine corn was priced at $160 a ton in the Rotterdam market,; the price spread between U.S. and Argentine com in that market
I widened to $12 a ton. In Rotterdam, the price spread between U.S. com and U.S. I sorghum widened in favor of com.
The f.o.b. Bangkok price for white Thai rice, 5 percent broken, reached an unprecedented annual average of $541 a ton. Thailand banned rice exports for most of 1973. The world rice market remained tight until the early fali when rice from a record U.S. harvest became available.
Soybean prices weakened in 1974, largely because of plummeting soybean meal ~rices. (Soybean oil prices, in contra~, remained strong through most of the year.) The 1974 soybean crop totaled 1.23 billion bushels, about a fifth below the 1973 record. Nevertheless, the softened demand for protein meals resulting from expanded worldwide protein meal supplies and the cutback on livestor.k feeding took its toll on prices. The f.o.b. Gulf ports price for U.S. No.2 Yellow soybeans declined 6 percent to $256 a ton in 1974. Similarly, the c.i.f. Rotterdam price for U.S. No.2 soybeans slipped 4 percent to $277 a ton. The c.i.f. Rotterdam price for U.S. soybean meal plunged 40 percent to $184 a ton.
-45
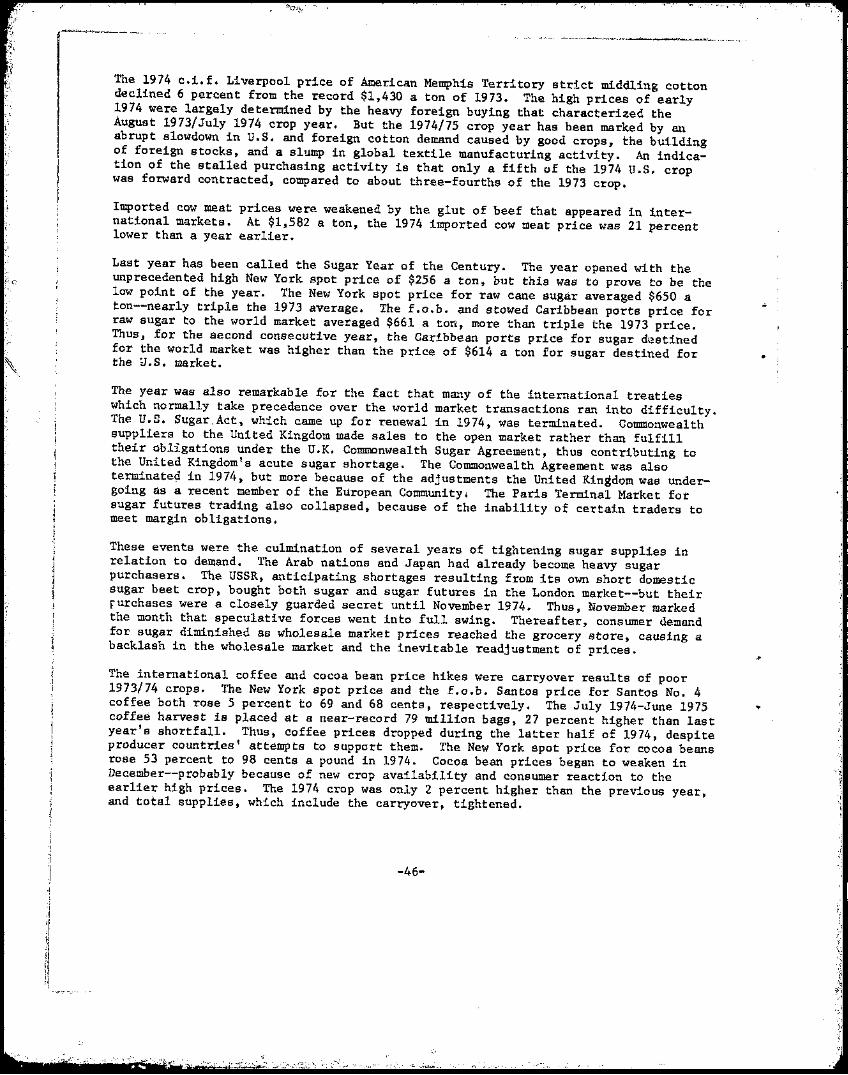
.'~.',. '0
('
The 1974 c.i.f. Liverpool price of American Memphis Territory strict middling cotton declined 6 percent from the record $1,430 a ton of 1973. The high prices of early 1974 were largely determined by the heavy foreign buying that characterized the August 1973/July 1974 crop year. But the 1974/75 crop year has been marked by an abrupt slowdown in U.S. and foreign cotton demand caused by good crops, the building of foreign stocks, and a slump in global textile manufacturing activity. An indication of the stalled purchasing activity is that only a fifth of the 1974 U.S. crop was forward contracted, compared to about three-fourths of the 1973 crop.
Imported cow meat prices were weakened by the glut of beef that appeared in international markets. At $1,582 a ton, the 1974 imported cow meat price was 21 percent lower than a year earlier.
Last year has been called the Sugar Year of the Century. The year opened with the unprecedented high New York spot price of $256 a ton, but this was to prove to be the low point of the year. The New York spot price for raw cane sugar averaged $650 a ton--near1y triple the 1973 average. The f.o.b. and stowed Caribbean ports price for raw sugar to the world market averaged $661 a ton, more than triple the 1973 price. Thus, for the second consecutive year, the Caribbean ports price for sugar d\~stined for the world market was higher than the price of $614 a ton for sugar destined for the U.S. market.
The year was also remarkable for the fact that many of the international treaties which normally take precedence over the world market transactions ran into difficulty. The U.S. Sugar.Act, which came up for renewal in 1974, was terminated. Commonwealth suppliers to the United Kingdom made sales to the open market rather than fulfill their obligations under the U.K. Commonwealth Sugar Agreement, thus contributing to the United Kingdom's acute sugar shortage. The Commonwealth Agreement was also terminate9 in 1974, but more because of the adjustments the United Kingdom was undergoing as a recent member of the European Community. The Paris Terminal Market for sugar futures trading also collapsed, because of the inability of certain traders to meet margin obligations.
These events were the culmination of several years of tightening sugar supplies in relation to demand. The Arab nations and Japan had already become heavy sugar purchasers. The USSR, anticipating shortages resulting from its own short domestic sugar beet crop, bought both sugar and sugar futures in the London market--but their yurchases were a closely guarded secret until November 1974. Thus, November marked the month that speculative forces went into full swing. Thereafter, consumer demand for sugar diminished as wholesale market prices reached the grocery store, causing a backlash in the wholesale market and the inevitable readjustment of prices.
The international coffee and cocoa bean price hikes were carryover results of poor 1973/74 crops. The New York spot price and the f.o.b. Santos price for Santos No. 4 coffee both rose 5 percent to 69 and 68 cents, respectively. The July 1974-June 1975 coffee harvest is placed at a near-record 79 million bags, 27 percent higher than last year's shortfall. Thus; coffee prices dropped during the latter half of 1974, despite producer countries' attempts to support them. The New York spot price for cocoa beans rose 53 percent to 98 cents a pound in 1974. Cocoa bean prices began to weaken in December--probably because of new crop availability and consumer reaction to the earlier high prices. The 1974 crop was only 2 percent higher than the previous year, and total supplies, which include the carryover, tightened.
-46
, I
..
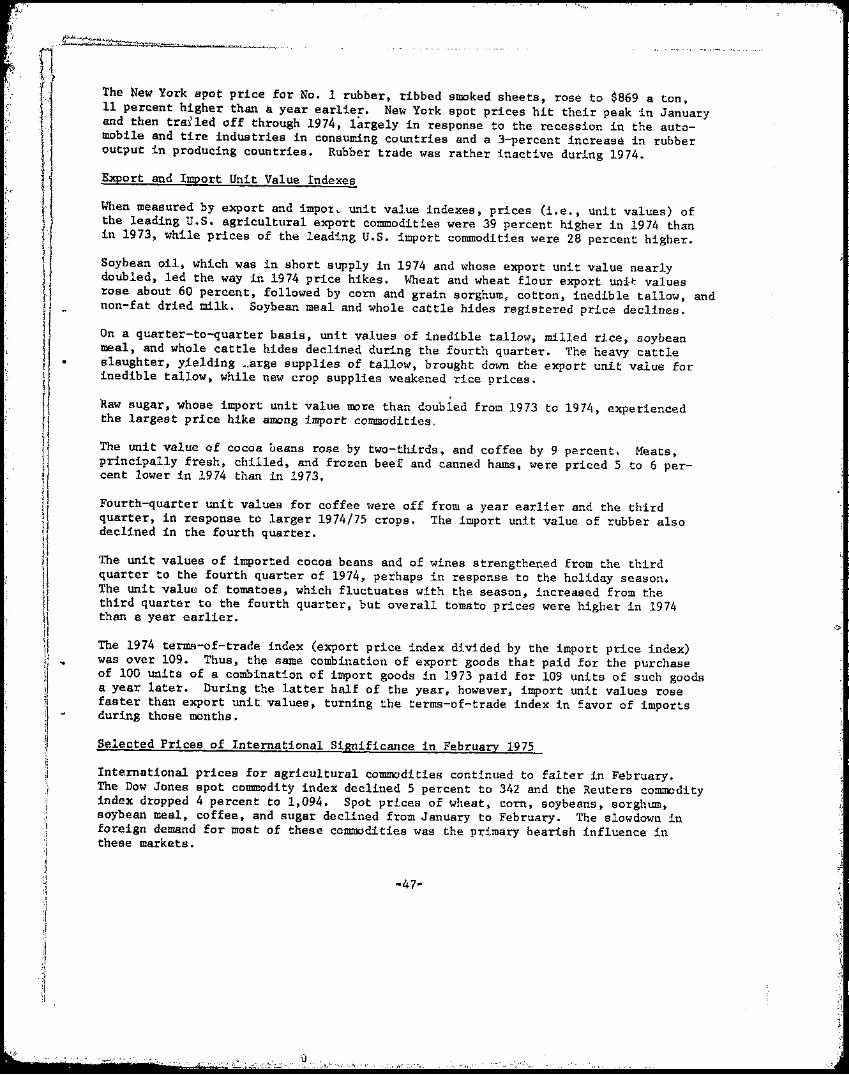
q.~----.- .. ".",',',',1 The New York spot price for No. 1 rubber, ribbed smoked sheets, rose to $869 a ton,
11 percent higher than a year earlier. New York spot prices hit their peak in January ,'I and then tra~,led off through 1974, largely in response to the recession in the auto"'11,':,' mobile and tire industries in consuming countries and a 3-percent increase in rubber
output in producing countries. Rubber trade was rather inactive during 1974.
'r Export and Import Unit Value Indexes
l' When measured by export and impoz., unit value indexes, prices (Le., unit values) of
t the leading U.S. agricultural export commodities were 39 percent higher in 1974 than in 1973, while prices of the leading U.S. import commodities were 28 percent higher.
! Soybean oil, which was in short supply in 1974 and whose eXport unit value nearly doubled, led the way in 1974 price hikes. Wheat and wheat flour export unit:, values
I' rose about 60 percent, followed by corn and grain sorghum, cotton, inedible tallow, and non-fat dried milk. Soybean meal and Whole cattle hides registered price declines.I
f "
On a quarter-to-quarter basis, unit values of inedible tallow, milled rice, soybean meal, and whole cattle hides declined during the fourth quarter. The heavy cattle slaughter, yielding .,arge supplies of tallow, brought down the export unit value for
I inedible tallow; while new crop supplies weakened rice prices.
I Raw sugar, whose import unit value more than doubled from 1973 to 1974, experienced the largest price hike among import commodities,
r The unit value of cocoa beans rose by two-thirds, and coffee by 9 percent. Meats, principally fresh, chilled, and frozen beef and canned hams, were priced 5 to 6 percent lower in 1974 than in 1973.
Ij Fourth-quarter unit values for coffee ~-lere off from a year earlier and the third
I' II quarter, in response to larger 1974/75 crops. The import unit, value of rubber also
declined in the fourth quarter.
f The unit values of imported cocoa beans and of wines strengthened from the third , quarter to the fourth quarter of 1974, perhaps in response to the holiday season. The unit value of tomatoes, which fluctuates with the season, increased from the
1 third quarter to the fourth quarter, but overall tomato prices were higher in 19741
II than a year earlier.
The 1974 terms-of-trade index (export price index divided by the import price index)It was over 109. Thus, the same combination of eXport goods that paid for the purchase
I: 11(, of 100 units of a combination of import goods in 1973 paid for 109 units of such goods !1 a year later. During the latter half of the year, however, import unit values rose
faster than export unit values, turning the terms-of-trade index in favor of imports during those months.
I I Selected Prices of International Significance in February 1975 It 1"
;1 International prices for agricultUral commodities continued to falter in February.l!
The Dow Jones spot commodity index declined 5 percent to 342 and the Reuters commodity index dropped 4 percent to 1,094. spot prices of wheat, corn, soybeans, sorghum, soybean meal, coffee, and sugar declined from January to February. The slowdown in foreign demand for most of these commodities was the primary bearish influence in these markets.

The f.o.b. vessel, Gulf ports, the c.i.f. Rotterdam, and U.K. ports prices all weakened in February because of the sluggishness in international trade. A market review by a leading West German trading house reported that world wheat output in 1975 could almost reach the record 1973 levels. February ended with China cancelling a number of additional orders fo~:_-wheat from the 1975 U. S. crop. These factors overrode the influence of Brazilian, Japanese, and Indian wheat purchases that occurred in late February.
While the f.o.b. vessei, Gulf ports price for u.s. No. 2 Hard Winter wheat, ordinary protein, fell 6 percent to $155 a ton, the c.i.f. Rotterdam price for the Same market class was only $158 a ton.
Corn and grain sorghum prices declined nearly as sharply. The f.o.b. vessel, Gulf ports price of U.S. No. 3 Yellow conl declined 4 percent to $125 a ton. Because activity in West Europe was generally sluggish, feed grain import prices at Rotterdam and the U.K. faltered even more.
The glut in West European soybean meal supplies continued to drag down soybean meal and soybean p~ices. Moreover, the United States is currently facing stiff competition from Brazil in the supply of oilseed products to Western Europe. The c.i.f. Rotterdam price of U.S. soybean meal dropped 9 perceilt to $140 a ton in February. Rotterdam prices of U.S. No. 2 Yellow soybeans slid to $218 and $231 a ton. respectively.
The February f.o.b. Bangkok price for Thai rice strengthened slightly to $404 a ton, the first turnaround in 6 months. The c.Lf. Liverpool price for U.S. strict middling cotton rose 6 percent, the first strengthening of the cotton price in 7 months.
Prices for the principal U.S. agricultural import commodities were mixed. The f.o.b. U.S. port of entry price for imported cornmeal rose slightly to 52 cents a pound-the first price rally in 7 months. The New York spot price for cocoa beans from Accra alSO strengthenea, largely on the basis of a revision of USDA estimates of world cocoa bean production. The 1974/75 crop is now being placed at 1.46 billion tons, about the same as last year. International coffee prices weakened slightly, the February New York spot price for Santos No.4 coffee reaching 69.8 cents a pound. Raw carte sugar prices nosedived.
The New York spot price of raw cane sugar at 36 centS a pound was back to levels of October-November 1974. The f.o.b. and stowed, Caribbean ports price for raw sugar destined for the United States was at 34.57 cents a pound, at a premium to prices for raw stigar destined fot the world market.
Real Prices of U.S. Agricultural Export and Import Prices
In view of inflation. it is well to review how commodity prices have changed when measured in "real" tetms. Using the U.S. wholesale price index (WPI) as a deflator, real ptices of wheat, coffee, and rubber declined from 1973 tp 1974. while in nominal terms, import and export prices of these commodities rose (table 25). The U.S. export soybean price declined in both nominal and real terms. In the late 1960's, however, real prices of U.S. wheat, corn, and soybeans at the Gulf ports were especially low. New York spot prices for coffee and rUbber, when put in real terms, were lower in 1974 than they had been during selected years of the late 1960'S.
-48

I
i
i !
" ~'",'
f·
GULF EXPORT PRICE AND EXPORT UNIT VALUE OF WHEAT
S/BU., : ~:
5 ~-----l I---~ !---I'd!
4 f------i ~----l 1---1---.
I Gulf ••port price
3~---l \Il 2 !-----I ~--~?"<--",j i-"=....=.~'-'.. ~---l f------i ......... (.............
Export unit value
• oU-J...I....L.I..J...J....L..J....L.J U-i...I....L.I...L...L..J...I..W U-L.J...J...I..l..J..J...J-L.J L.J....l,..I....L.I...L...L..J....L.J..J JAN DEC JAN DEC JAN DEC JAN DEC
1971 1972 1973 1974 .1
NEG.ERS 600.15131 USDA
Figure 2 ..'
GULF EXPORT PRICE AND EXPORT UNIT VALUE .
OF CORN S/BU.
31-------1
2 f------i :....' Export unit ..... ~ value
.
I I II IoL..L.J..JU-WU-W..LJ JAN DEC JAN DEC JAN DEC JAN DEC
1971 1972 1973 1974
NEG EAS &O::r.75!11USDA
Figure 3
-49
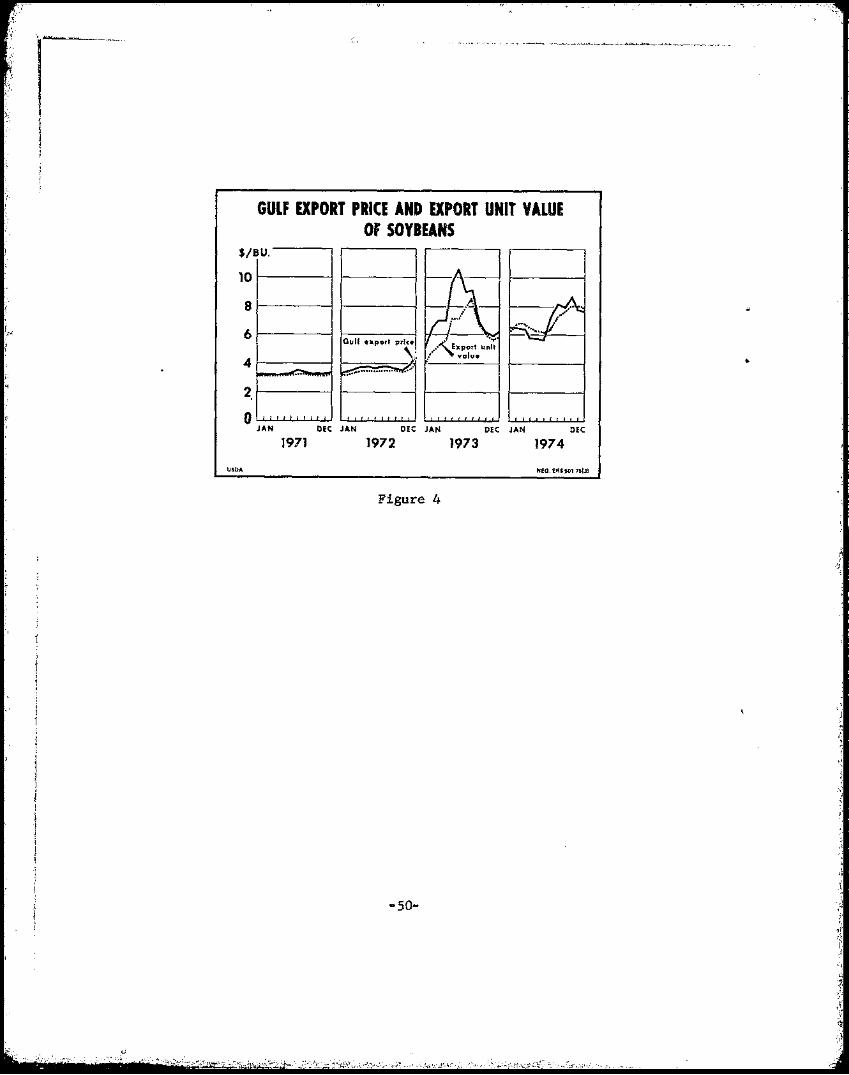
GULF EXPORT PRICE AND EXPORT UNIT VALUE OF SOYBEANS
$/BU.
10
8 , IrL 6
Gull ..pori pr\:
4 _.................. ~~.............-:rr.e." t-------1
" 2
o JAN DEC JAN DEC JAN DEC JAN DEC
1971 1972 1973 1974
USDA NED. ERSSO' 76131
Figure 4
-50
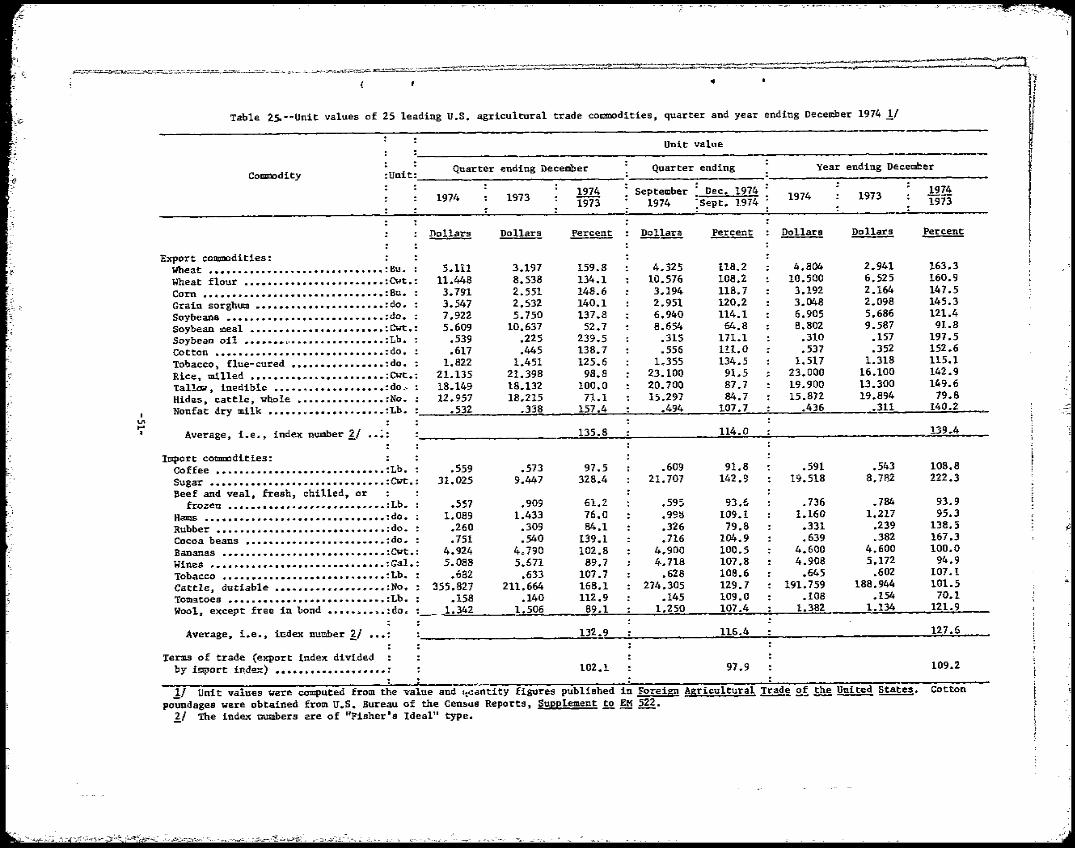
•
Table 2>--Unit values of 25 leading U.S. agricultural trade commodities, quarter and year ending December 1974 11
I UI... I
Unit value
:Unit: Quarter ending December Quarter ending Year ending DecemherCommodity ,--- 1974 September : Dec. 1974 19741974 1973 1974 19731973 1974 :Sept. 1974 1973
Dollars Dollars Dollars Dollars Percentm~ 1!2l~ ~~
Export commodities: Wheat .110 ••••••••••••••••••••••••••• 11: Bu. 5.1i1 3.197 159.8 4.325 118.2 4.804 2.941 163.3 Wheat flour •••••••••••••••••••••••• :CWt.: 11.448 8.538 134.1 10.576 108.2 10.500 6.525 160.9 Corn •• I1 ••••••••••••• ., ................ :'Bu. 3.79l 2.551 148.6 3.194 118.7 3.192 2.164 147.5 Grain sorghum •••••••••••••••••••••• :do. : 3.547 2.532 140.1 2.951 120.2 3.048 2.098 145.3 Soybeans ••••••••••••••••••••••••••• :do. : 7.922 5.750 137.8 6.940 114.1 6.905 5.686 121.4 Soybean meal •••••••••••••• ~ •••••••• :Cwt.: 5.609 10.637 52.7 8.654 64.8 8.B02 9.587 91.8 Soybean oil •••• eo ................... : Lb. .539 .225 239.5 .315 171.1 .310 .157 197.5 Cotton ••••••••••••••••••••••••••••• :do. : .617 .445 138.7 .556 111.0: .537 .352 152.6 Tobacco, flue-cured •••••••••••••••• :do. : 1.822 1.451 125.6 1.355 134.5 1.517 1.318 115.1 Rice, milled ••••••••••••••••••••••• :CWt.: 21.135 21.398 98.8 23.100 91.5 23.000 16.100 142.9 Ta1lal, inedible ••••••••••••••••••• : do., 18.149 18.132 100.0 20.700 87.7 19.900 13.300 149.6 Hides, cattle, whole ••••••••••••••• :No. 12.957 18.215 71.1 15.297 84.7 15.872 19.894 79.8 Nonfat dry milk •••••• < ••••••••••••• :Lb. .532 .338 157.4 .494 107.7 .436 .311 140.2
Average, i.e., index number £1 •••. 135.8 114.0 139.4
Import commodities: Coffee ••••••••••••••••••••••••••••• :Lh. .559 .573 97.5 .609 91.8 .591 .543 108.8 Sugar ............................... :Cwt:. : 31.025 9.447 328.4 21.707 142.9 19.518 8.782 222.3 Beef and veal, fresh, chilled, or
frozen ••••••••••••••••••••••• _••• :Lb. .557 .909 61.2 .595 93.6 .736 .784 93.9 11am.s ................................ : do • 1.089 1.433 76.0 .99M 109.1 1.160 1.217 95.3 Rubber ••••••••••••••••••••••••••••• :do. .260 .309 84.1 .326 79.8 .331 .239 138.5 Cocoa beans •••••••••••••••••••••••• :do. .751 .540 139.1 .716 104.9 .639 .382 167.3 Bananas ............................. :Cwt. : 4.924 4.790 102.8 4.900 100.5 4.600 4.600 100.0 Wines P ••• ~ .......................... :Gal.! 5.088 5.671 89.7 4.718 107.8 4.908 5.172 94.9 Tobacco ............................ :Lb. .682 .633 107.7 .628 108.6 .645 .602 107.! Cattle, dutiable ••••••••••••••••••• :No~ 355.827 211.664 168.1 274.305 129.7 191.759 188.944 101.5 Tomatoes ........................... :Lb., .158 .140 112.9 .145 109.0 .10B .154 70.1 Wool. except free in bond •••••••••• :do. :_. 1.342 1.506 89.1 1.250 107.4 1.382 1.134 121.9
Average, i.e., index number 11 ••• : 132.9 116.4 127.6
Ter.ns of trade (export index divi.ded by import index) ••••••••••••••••••• : 102.1 97.9 109.2
1.1 --Unit values were computed from the ;ra1ue and~:;';;ti"tity figures published in Foreign Agricultural ~~~~~. Cotton poundages were obtained fro1J!. U.S. Bureau of the Cens'us Reports, Supp1ement!2 ~ ~.
11 The index numbers are of "Fisher's Ideal" type.
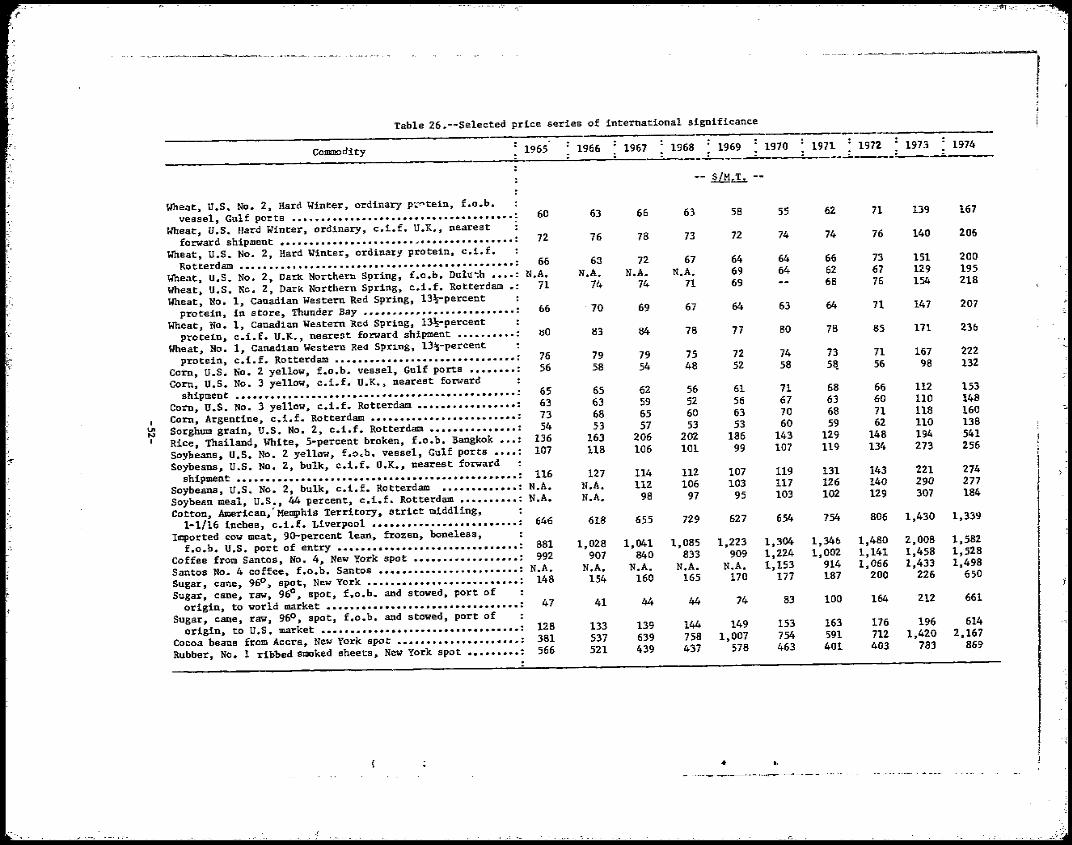
•••••••••••• •••••
~ _. ';"Yo ".
--'~--I
Table 26.--Se1ected price series of international significance
COlIDllOdity 1965
Wheat, U.S. No.2, Hard Winter, ordinary p~~tein, f.o.b. vessel, Gulf ports ••••••••••••••••••••••••••••••••••••••. 60
Wheat, U.S. Hard Winter, ordinary, c.i.f. U.K., nearest forward shipment ••••••••••••••••••••••• v 72
Wheat, U.S. No.2, Hard Winter, ordinayy protein, c.i.f. Rotterdam •••••••.••••••••••.•••••••••••••••••••••.•••••• : 66
Wheat, U.S. No.2, Dark Northern Spring, f.o.b. Du1u~h •••• : N.A. Wheat, U.S. Nc. 2, Dark Northern Spring, c.i.f. Rotterdam.: 71 Wheat, No. I, Canadian Western Red Spring, 13~percent
protein, in store, Thunder Bay ••••••••••••••••••••••••• ·: 66 Wheat, No.1, Canadian Western Red Spring, 13~-percent
protein. c.i.f. U.K., nearest forward shipment •••••••••• : tiO Wheat, No.1, Canadian Western Red Spr~ng, 13~-percent
protein, c.i.f. Rotterdam ••••••••••••••••••••••••••••••• : 76 Corn, U.S. Ko. 2 yellow, f.o.b. vessel, Gulf ports •••••••• : 56 Corn, U.S. No.3 yellow, c.i.f. U.K., nearest forward
shipment •••••••••••••••••••••••••••••••••••••••••••••••• : 65 Corn, U.S. No.3 yellow, c.i.f. Rotterdam ••••••••••••••••• : 63 Corn, Argentine, c.i.f. Rotterdam ••••••••••••••••••••••••• : 73
I \J1 Sorghum grain, U.S. No.2, c.i.f. Rotterdam ••••••••••••••• : 54 N I Rice, Thailand, White, 5-percent broken, f.o.b. Bangkok ••• : 136
Soybeans, U.S. No.2 yellow, f.o.b. vessel, Gulf ports •••• : 107 Soybeans, U.S. No.2, bulk, c.i.f. U.K., nearest forward
116 Soybeans, U.S. No.2, bulk, c.i.f. Rotterdam ••••••••••••• : N.A. Soybean meal, U.S., 44 percent, c.i.f. Rotterdam •••••••••• : N.A. Cotton, American, ' Memphis Territory, strict middling,
1-1/16 inches, c.i.f. Liverpool ••••••••••••••••••••••• ·.: 646 Imported cow meat, 90-percent lean, frozen, boneless,
shipment •••••••••••••••••••••••••••••••••••••••••••••••• :
f.a.b. U.S. port of entry ••••••••••••••••••••••••••••••• : 881 Coffee from Santos, No.4, New York spot •••••••••••••••••• : 992 Santos No.4 coffee, £.o.b. Santos •••••••••••••••••••••••• : N.A. Sugar, cane, 96°, spot, New York •••••••••••••••••••••••••• : 148 Sugar. cane, raw, 960 , spot, f.o.b. and stowed, port of
origin, to world market •••••••••••••••••••••••••••••••••. 47 Sugar, cane, raw, 96°, spot, f.o.b. and stowed, port of
origin, to U.S. market ••••••••••••••••••••••••••••••••••. 128 Cocoa beans from Accra, New York spot ••••••••••••••••••••• : 381 Rubber, No.1 ribbed smoked sheets, New York spot ••••••••• : 566
1966
63
76
63 N.A.
74
. 70
83
79 58
65 63 68 53
163 118
127 N.A. N.A.
618
1,028 907
N.A. 154
41
133 537 521
1967
66
78
72 N.A.
74
69
84
79 54
62 59 65 57
206 106
114 112
98
655
1,041 840
N.A. 160
44
139 639 439
1968 1969
-- iltl.L. -
63
73
67 N.A.
71
67
78
75 48
56 52 60 53
202 101
112 106
97
729
1,085 833
N.A. 165
44
144 758 437
58
72
64 69 69
64
77
72 52
61 56 63 53
186 99
107 103
95
627
1,223 909
N.A. 170
74
149 1,007
578
1970
55
74
64 64
63
80
74 58
71 67 70 60
143 107
119 117 103
654
1,304 1,224 1,153
177
83
153 754 463
1971 • 1972 : 1973 : 1974---"---_=..-.---."-
62 71 139 167
74 76 140 206
66 62 68
73 67 76
151 129 154
200 195 218
64 71 147 207
78 85 171 236
73 51!
71 56
167 98
222 132
"
68 63 68 59
129 119
66 60 71 62
148 134
112 110 118 110 194 273
153 148 160 138 541 256
:,
131 126 102
143 140 129
221 290 307
274 277 184
154 806 1,430 1,339
1,346 1,002
914 187
100
1,480 1,141 1,066
200
164
2,008 1,458 1,433
226
212
1,582 1,528 1,498
650
661
<,.
163 591 401
176 712 403
196 1,420
783
614 2,167
869
• t,
"'_,<."~,~c___. .,...,.",.-......:~_-,.,."".'"""'-~' ,,+ ..'O-~"'~.-
;£
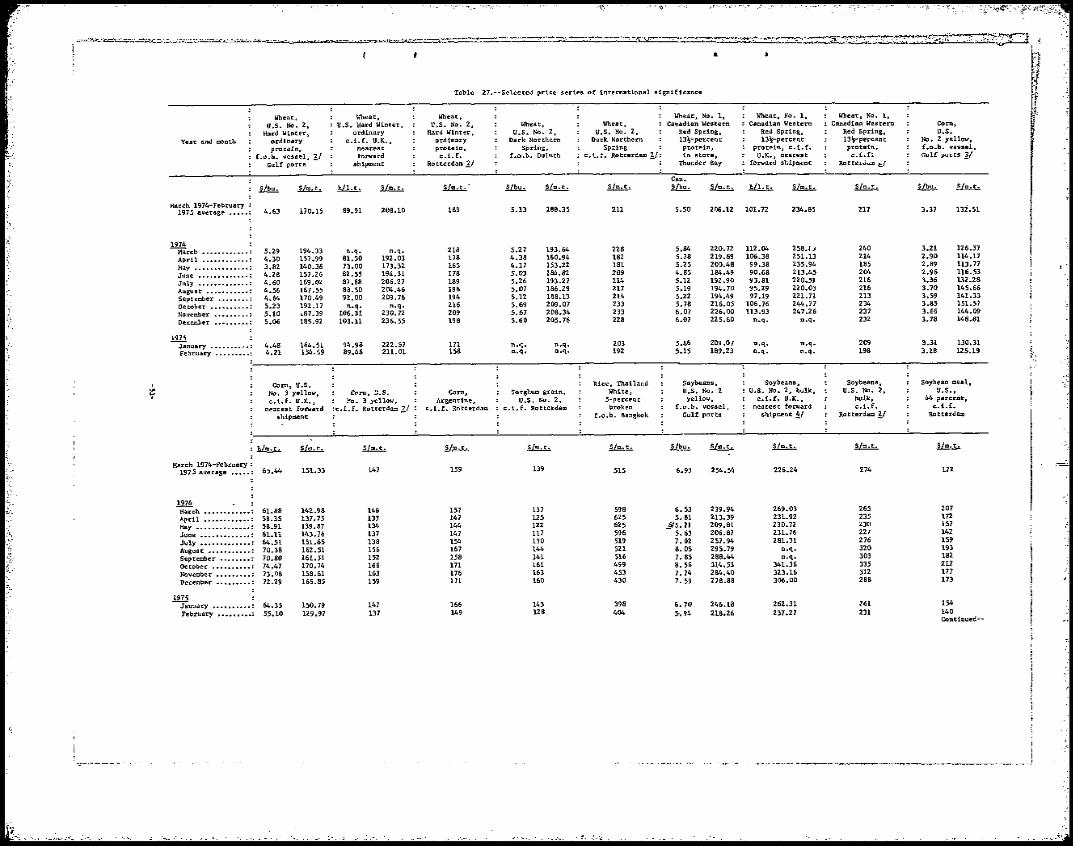
<',) ~,<-- ~ o. ['3'"
•
Table 27.--Selected price series of international significance
'lear and month
March 1974-Februsry : 1975 average ••••• :
Wheat., U.S. no. 2,
Hard Winter, ordinary protein,
f.o.h. vessel, 1/ Gulf port6
U!!!!.. Sh".e.
4.63 170.15
Wheat, U.S. Hard Winter,
ordinary Co.!.f. U.K.,
nearest forward
shipment
h/l.t. ~
89.91 208.10
Wheat, U.S. No.2,
Hard Wint~r I
ordinary protein. c.!.f.
Rotterdam 11
~.
189
Wheat., u.s. No.2,
Dark Northern Spring,
f.o.b. Duluth
lli!!:.
5.13
~
188.35
Wheat, U.S. No.2,
Dark Northern Spdng
c.l.f. Rotterdam 11
S/m.t.
211
Wheat, No.1, Canadian Western
Red Spring, lJ%-percent: protein, in score,
Thunder Bay
Can. ~ ~
5.50 206.12
1974 ---"March ............. :
April .•••••...•.. : May •••••••••••••• : Jt.\ne ••••••••••••• : July ••••••••••••• : August" ............. : September • ~ ••.••• : October .••••••• _.: November ••••••••• : December ••••••••• :
5.29 4.30 3.82 4.28 4.60 4.56 4.64 5.23 5.10 5.06
194.33 157.99 140.36 157.26 169.02 167.55 170.49 192.17 ,,87.39 18.5.92
n.q. 8l.50 n.oo 82.55 87.68 88.50 92.00 n.q.
106.31 103.11
n.q. 192.03 173.32 194.31 206.27 204.46 209.76
n.q. 230.72 236.55
218 178 165 178 189 196 194 216 209 198
5.27 4.38 4.17 5.03 5.26 5.07 5.12 5.69 5.67 5.60
193.64 160.94 153.22 184.82 193.27 186.29 188.13 209.07 208.34 205.76
228 182 181 209 214 217 214 233 233 228
5.84 5.78 5.25 4.85 5.12 5.19 5.22 5.78 6.07 6.07
220.72 219.69 200.48 184.49 192.90 194.70 194.49 216.05 226.00 225.60
1975 ---:ianuary .•••••••.• :
February ..........: 4.48 4.21
164.51 154.59
94.98 89.46
222.57 211.01
171 158
n.q. n.q.
n.q. n.q.
203 192
5.66 5.15
209.07 189.23
, ~
Corn, U.S. No. J yellow, c.!.f. U.K.,
nearest: forward shipment
CC'lrn, V..S .. Po. J yellow,
:c.i.f. Rotterdam 11
Corn, Argentine,
c.i.f. Rotterdam
Sorghum grain, U.S. No.2,
c.i.f. Rotterdam
'Rice, Thailand White,
5-percent broken
f.o.b. Bangkok
Soybeans. U.S. No.2
yelloW', f.o.b. vessel,
Gulf ports
:
March 1974-February : 1975 average ...... :
b/tn.t ..
65.44
~
151.33
~
147
~
159
~
139
Ul!!.h
515
U~
6.93
~
254.54
1974 March •••••••••••• : April •••••••••••• : May •••••••••••••• : June ••••••••••••• : July ••••••••••••• : Auguat ••••••••••• : September ........... : October •••••••••• : November .......... : December ••••••••• :
61.88 58.35 58.91 6l.11 64.51 70.38 70.80 74.47 73.08 72.29
142.98 137.75 139.87 143.76 151.65 162.51 161.51 170.74 158.61 165.85
146 133 134 137 138 156 152 166 163 159
157 147 144 147 154 167 158 171 176 171
137 125 122 117 130 144 141 161 163 160
598 625 625 596 519 521 516 499 453 430
6.53 5.81
_6/5.71 5.63 7.02 8. as 7.85 8.56 7.74 7.59
239.94 213.39 209.81 206.87 257.94 295.79 288.44 314.53 284.40 278.88
1975 --:January ............ :
February ..........: 64.35 55.10
150.79 129.97
147 137
166 149
143 128
398 404
6.70 5.94
246.18 218.26
Wheac, No.1, Canadian Western
Red Spring, 13%-percent
protein, c.Lf. U.X., nearest
forward shiptnent
>'/1.e. ~
101.72 234.85
112.04 258.U 106.38 251.13
99.38 235.94 90.68 213.45 93.81 220.51 95.29 220.03 97.19 221.71
106.76 244.77 113.93 247.26
n.q. n.q.
n.q. n.q. n.q. n.q.
Soybeans. U.S. No.2, bulk,
c.!.f. U.K~,
neares t forward shipment !.t.1
~
226.24
269.03 231.92 230.72 231.76 281.31
n.q. n.q.
341.36 323.16 306.00
262.31 237.27
Wheat, No.1, Canadian Wes tern
Red Spring, 13%;-percent protein, c.!.f~
Rottel.J<JJ.Il ~I
~
217
240 214 185 204 216 216 213 234 237 232
209 198
Soybeans. U.S. No.2,
bulk, coi.f.
Rotterdam 11
~
274
265 235 230 227 276 320 303 335 312 288
261 231
"'·-3
; '.1
Corn, U.S.
No.2 yellow, f.o.b. vessel, Gul£ ports 11
--~
U!!!!.. S/m.e.
3.37 13i.51
3.21 2.90 2.89 2.96 3.36 3.70 3.59 3.85 3.66 3.78
1Z6.37 114.17 113.77 116.53 13Z.28 145.66 141.33 151.57 144.09 148.81
3.31 130.31 3.18 125.19
Soybean meal, U.S.,
44 percent, c.l.f.
Rotterd.wn
}.\"i:"
I I I,
~;;
;,..! ~:"; ~.;
~
172
207 172 157 142 159 193 182 212 177 173
154 140 Continued-
(
;..,' ~. :~~:~ ,.~ :.:~. . !".,-!q,~ .~ .,",,- ',-;'If'

;; ~."'''' ~' IF
____•. __~._.~ ~....-~ ,~~__"" ___,_..;.oo;.- ___,,,_~__~ __~_,_,=___~~.. __~_ """,-,,, ~-.. ~.-~.----....-.
Table 27.--Selected price series of international significance.... COntinued
Imported Sugar, cane, raw, 960 _ spot, f.o.b.
Cotton, American cow meat, Coffee and sto'Wed, port of o'rigin Rubber, Memphis Territory, gO"percent lean, from SantQs, Santos No.4 Sugar, cane, Cocoa beaus No. 1 ribbed
Year and month strict middling, frocr::en, No.4, coffee, f.o.b. 96 • spot, from Accra, smoked sheets, 1-1/16 inches, boneless, New York, Santos New York New York, spot New York,
to "World to U.S. spot port of entry
e.i.f. 1.iverpool f.o.b. U.S. spot market market 1/
.ill!!,. lliili .ill!!,. ~ .£ill,. ~ .£ill,. ~ .ill!!.. lliili .ill!!,. lliili .ill!!,. ~ .ill!!.. ~ .ill!!,. ~
Harob 1974-Februory 1975 average ••••• : 59.60 1,205 65.21 1.438 69,24 1.526 67.93 1.503 33.37 735.73 32.95 726.33 31.73 699.58 101.16 223.01 35.4 78.1
1m. March •••••••••••• : 75.80 1;671 18.75 1.736 73.50 1.620 72.88 1,607 18.11 399.26 21.27 468.92 16.52 364.20 87.9 193.78 47.8 105.4 April •••••••••••• : 73.40 1.618 74.20 1.636 72.98 1.609 19.25 424.39 21.77 479.94 17.62 388.45 110.2 242.95 43.1 95.0 Hay •••••••••••••• : 61.00 1;345 70.07 1.545 74.00 1.631 73.75 1.626 23.05 508.17 23.65 521.39 21.30 469.58 113.7 250.66 44.1 97.1 June •••••• ~ •••••• : 63.80 1,407 65.55 1.445 71.95 1.586 71.58 1.578 26.30 579.82 23.67 521.83 24.57 541.68 103.3 227.74 40.4 89.1 July ••••••••••••• : 64.50 1,422 74.43 1.641 69.62 1.534 66.51 1.466 28.35 625.01 25.40 559.97 26.69 588.41 106.7 235.23 35.4 78.0 August ••••••••••• : 63.40 1,398 72.84 1.606 64.50 1.422 64.50 1.422 32.60 718.71 31.45 693.35 30.97 682.77 107.7 237.44 34.7 76.5 September ........... : 60.50 1,334 63.37 1.397 62.90 1.387 60.85 1.342 33.71 743.18 34.35 757.29 32.11 707.90 106.4 234.57 31.8 70.1 October .............. : 58.50 1,290 62.83 1.385 64.53 1.423 64.58 1.423 38.83 856.05 39.63 873.69 36.99 815.49 115.1 253.75 31.2 68.8 November ... ~ ....... : 53.60 1,182. 60.02 1.323 65.49 1.444 65.53 1.445 57.30 1,263.25 57.15 1,259.94 55.61 1,225.99 104.2 229.72 27.0 59.S December ..... ~.- ....... : 51.90 1,141> 51.33 1.264 69.90 1.541 66.77 1.538 46.74 1,030.49 44.97 991.42 45.16 995.61 85.4 188.27 30.6 67.5
!2ll January ........... : 49.80 1,098 51.96 1.145 70.50 1.554 68.22 1.504 40.15 885.16 38.32 844.81 38.68 852.75 86.1 189.82 29.0 63.9
February ••••••••• ~ 52.80 1,164 52.00 1.146 69.80 1.538 67.01 1.477 36.07 795.21 33.72 743.40 34.57 762.14 87.2 192.24 30.0 66.1
n.q•• No quotation. 11 Beginning .1n May 1974. U.S. No. 1 HWW, f.o.b. tracki beginning in January 197.5, U.S. No.. 2 HWW. f.o.b. vessel. 1:.1 Offering prices.
* 1.1 Beginning in May 1974, No.2 Yello"W corn, f.o.b. traek. y C.i.f. Tilbury. During August and September prices are available for Gla$go"W •
.2./ New York spot price m.inus .62.5 C:2nts duty and m.inua freight and insurance from Caribbean to flew York. &/ U.S. No.1 soybeans, f.o.b. track, starting in January 1975, U.S. No. 2. soybeans, f.o.b. vessel.
Note: The Rotterdam price series for wheat and corn has been changed. Tbe new monthly price is an average of daily quotations.
Sources: Monthly!!:!!.!!.lli in Agricultural ~~ Stlotistics. FAO; ~ Trade Intelligence. FAC; .Ih! l!:!hl!£ Ledser, London; ~~~, AMS, USDA, ~~~, AMS, USDA, Foreign Agriculture, FAS, USDA; llangkok Board of Trade; ~i ~..!ru!. ~ Economic ~, Liverpool; .!h!! National Provisioner, Chicago; The Wall ~ ,Journal; .II!£. ~.2!~; New York Coffee & Sugar Exchange; Bureau of Labor Statiatics, Spot Market Prices; and ill!!2.ili. llamhurg.
• "
.. ,.'"
<',::-. ,-' .Y
I

Export Highlights
.aiiliiliSEiii88iiiiiiiliBiiilllljillli8iiiiiiiiii8iiiiaiiiEIEiljiilBaBilliiil1
U.S. AGRICULTURAL EXPORT VALUE GAINS 10 PERCENT IN JULY-FEBRUARY
Farm product exports during the first 8 months of fiscal 1975, valued at over $15 billion, were 10 percent above the same period a year earlier, although the volume index was 15 percent lower. Export volume declines occurred for wheat, corn, soybeans, and cotton. Due to higher prices, wheat, feed grain, and cotton export values remained near last year's levels. Soybean value, however, advanced 12 percent. Both volume and value gains occurred in fats and oils, meat, and pulses.
February 1975 agricultural exports totaled $1.92 bi11iun, compared with a record $2.46 billion in January 1975 and $1.91 billion in February 1974. Volume declines and some price reductions accounted for the drop from January. Cancellations in exports sales contracts have increased since January for corn, soybeans, and cotton.
In July-February, exports of grains and preparations totaled $7.65 billion, 10 percent above the year-earlier level. Increased shipments of rice and wheat products for relief (bu1gar, rolled ~lheat, and wheat-soya blend) combined with price increases to expand total value. Wheat exports dropped 18 percent to 714 million bushels, whereas value, at nearly $3.5 billion, remained above last year's level.
Rice exports totaled nearly 1.4 million metric tons ($632 million) in July-February, against 1 million tons ($456 million) a year earlier. Larger shipments to. the United Kingdom, Iraq, Iran, Kuwait, Bangladesh, Korea, and Japan accounted for much of the gain.
During July-February, corn exports declined 17 percent to just under 19 million tons, while value rose almost a fifth to nearly $2.7 billion. Reduced movements to Japan, the PRC, the USSR, and Taiwan were outweighed by larger shipments to Canada, Mexin, Peru, the EC, Portugal, Romania, Iran, Israel, and Egypt.
Soybean export volume dac1ined 8 percent to 291 million bushels, while value rose 12 percent to $2.2 billion. Volume reductions were ~~in1y to the European Community, the USSR, the PRC, Korea, Colombia, and Peru. Exports of soybean oil climbed 70 percent to over 1 billion pounds; value nearly tripled to $383"million,' Shipments increased to Canada, Mexico, Central America, the Caribbean islands, Chile, Uruguay, Spain, Portugal, Yugoslavia, Turkey, Iran, Bangladesh, Taiwan, Japan, Morocco, and Egypt.
Cotton export volume dropped to 2.3 million bales in July-February from 3.2 million bales during the same months a year earlier. Due to higher prices, value remained near last year's level. The volume drop was mainly in shipments to the Far East.
-55
/\

.::J .:
I
, I
f
1 f" i !
0
'"
,..J c'",~" , . Go ."
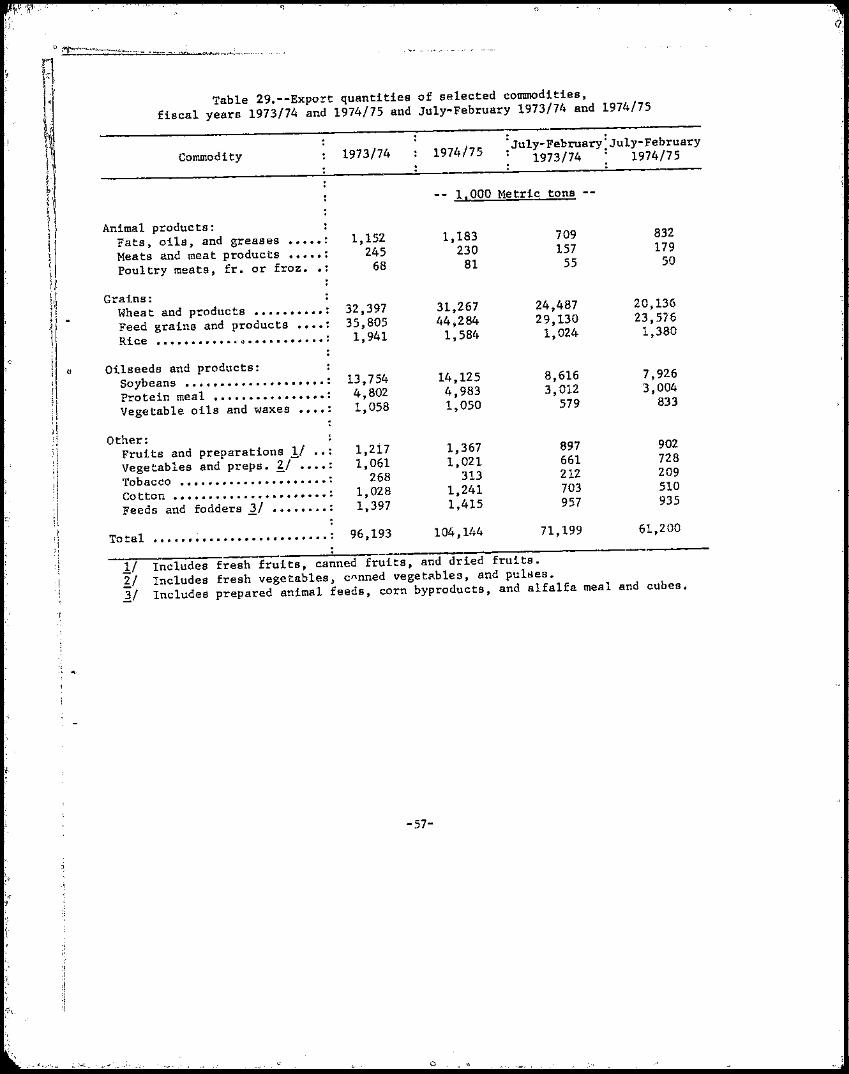
i I I
I
Table 29.--Export quantities of selected commodities, fiscal years 1973/74 and 1974/75 and July-February 1973/74 and 1974/75
~JulY-February:JulY-February Commodity 1973/74 1974/75 ; 1973/74 ; 1974/75
1,000 Metric tons --
Animal products: Fats, oils, and greases ...... 1,152 1,183 709 832
. 230 157 179Meats and meat products ... . .. 245
50Poultry meats, fro or froz. .. 68 81 55 '
Grains: 31,267 24,487 20,136
Wheat and products ........... 32,397 449 284 29,130 23,576
Feed grains and products ·.... 35,805 1,024 1,3801,941 1,581•
••••••••••• to'll ••••••••••••Rice
" l! Oilseeds and products: 8,616 7,926
Soybeans ..................... 13,754 14,125 3,0044,983 3,012Protein meal ................. 4,802
833Vegetable oils and waxes ·.... 1,058 1,050 579
Other: 897 902 Fruits and preparations 11 ... 1,217 1,367
1,021 661 728Vegetables and preps. 'l:..I ·.... 1,061
212 209 Tobacco ...................... 268 313
1,241 703 510Cotton ....................... 1,028
• a 0 ••••••Feeds and fodders 1/ 1,397 1,415 957 935 ,.
61,200104,144 71,199Total .......................... 96,193
1/ Includes fresh fruits, canned fruits, and dried fruits. 2/ Includes fresh vegetables, c~nned vegetAbles, and pu1~es.1/ Includes prepared animal feeds, corn byproducts, and alfalfa meal and cubes.
-57
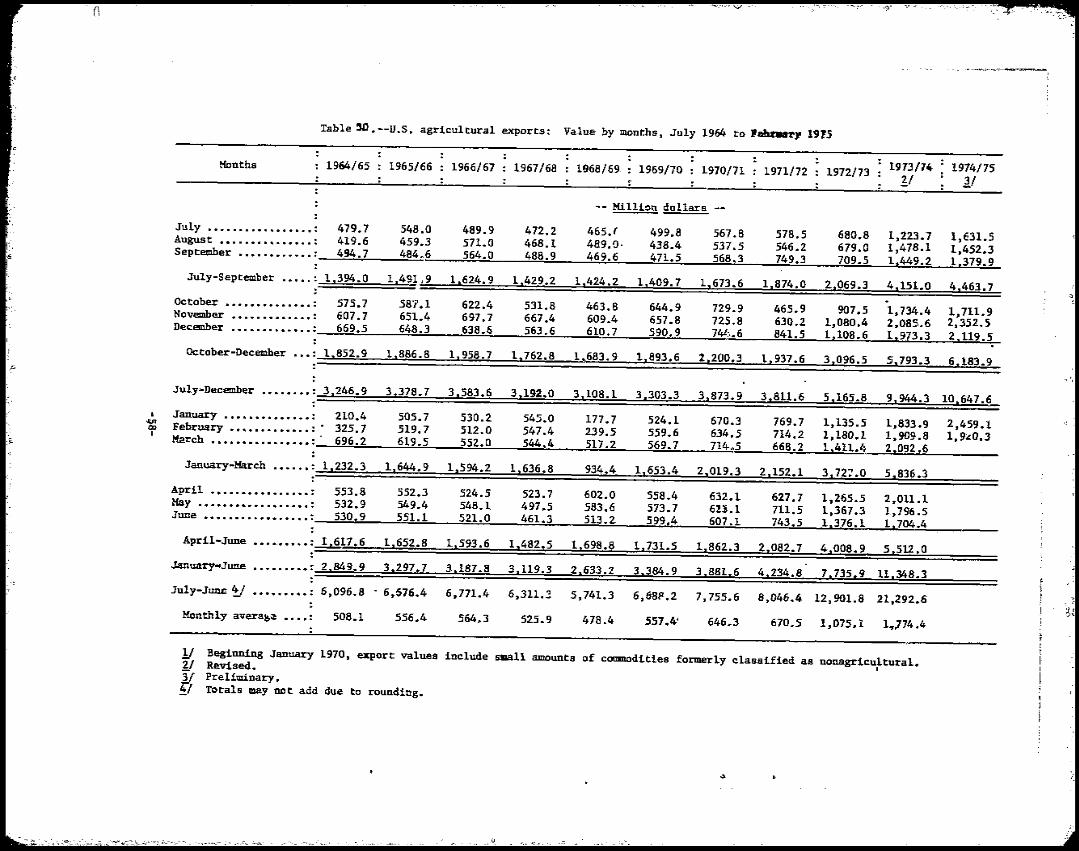
o """"7' """''''"
Table!W .--U.S. agricultural exports: Value!>y !IlOnl:hs, July 1964 to 11'~)' 1'915
. 1973/74 1974/75Months 1964/65 1965/66 1966/67 1967/68 1968/69 : 1969/70 1970/71 1971/72 1972/73 'l:/ 11
-- Million dollars
July 479.7 548.0 489.9 472.2 465.( 499.8 567.8 578.5 680.8 1,223.7 1,E31.5 August ••••••••••••••• : 419.6 459.3 571.0 468.1 489.0· 438.4 531.5 546.2 679.0 1,478.1 1,452.3 September ............ : 494.7 484.6 564.0 488.9 469.6 471.5 568.3 749.3 709.5 1,449.2 1.379.9
July-September ..... : 1,394.0 1,491,9 1.624.9 1.429.2 1.424.2 1,409.7 1,673.6 1,874.0 2.069.3 4.151.0 4,463.7 ,. . ~
October .............. : 575.7 58'7.1 622.4 531.8 463.8 644.9 729.9 465.9 907.5 1,734.4 1,711.9 November ............. : 607.7 651.4 697.7 667.4 609.4 657.8 725.8 630.2 1,080.4 2.085.6 2,352,5 December ............. : 669.5 648.3 638.6 563.6 610.7 590.9 74l,:.• 6 841.5 1,108.6 1__ 973.3 2,119.5
October-December 1,852.9 1,886.8 1.958.7 1.762.8 1.683.9 1.893.6 2,200.3 1,937.6 3.096.5 5.793.3 6,183.9 ;j').;
July-December 3,246.9 3.378.7 3,583.6 3,192.0 3,108.1 3,303.3 3,873.9 3,811.6 5,165.8 9.944.3 10,647.6
I January .............. : 210.4 505.7 530.2 545.0 177.7 524.1 670.3 769.7 1,135.5 1,833.9 2,459.1 :}
Or:> February ............. :. 325.7 519.7 512.0 547.4 239.5 559.6 634.5 714.2 1,180.1 1,909.8 1,9~0.3 -I March ................ :. 696.2 619.5 552.0 544.4 517.2 569.7 714,,5 668.2 1,411.4_..:2....0:::..::9;.:::;2.:.;.6=--__.-_
January-March ...... : 1,232.3 1,644.9 1,594.2 1,636.8 934.4 1,653.4 2,019.3 2,152.1 3,721.0 5.836.3
JApril •••••••• , ..... , .: 553.8 552.3 524.5 523,7 602.0 558.4 632.1 627.7 1,265.5 2,011.1 May .................. : 532.9 549.4 548.1 497.5 583.6 573.7 6U.1 711.5 1,367.3 1,796.5 June .......".......... : 530.9 551.1 521.0 461.3 513.2 599.4 607.1 743.5 1,376.1 1,704.4
April-June ...."..... : 1.617.6 1,652.8 1.593.6 1,482.5 1.698.8 1,731.5 1.862.3 2,082.7 4,008.9 5.512.0
January..June ......... : 2.849.9 3.297.7 3.187.8 3.119.3 2.633.2 3.384.9 3,881.6 4,234.8 7.735.9 11,348.3
July-June':J ••••••••• : 6,096.8 . 6,576.4 6,771.4 6,311.3. 5,741.3 6,68P.2 7,755.6 8,046.4 12,901.8 21,292.6
MOnthly avera~~ •••• : 508.1 556.4 564.3 525.9 478.4 557.4' 646.3 670.5 1,075.1 1..)74.4
11 Beginning January 1970, export values include small a!IlOunts of commodities formerly classified as nonagricultural.2/ Revised., '
"
¥ Preliminary. ~l Totals may not add due to rounding.
.,;J, .'
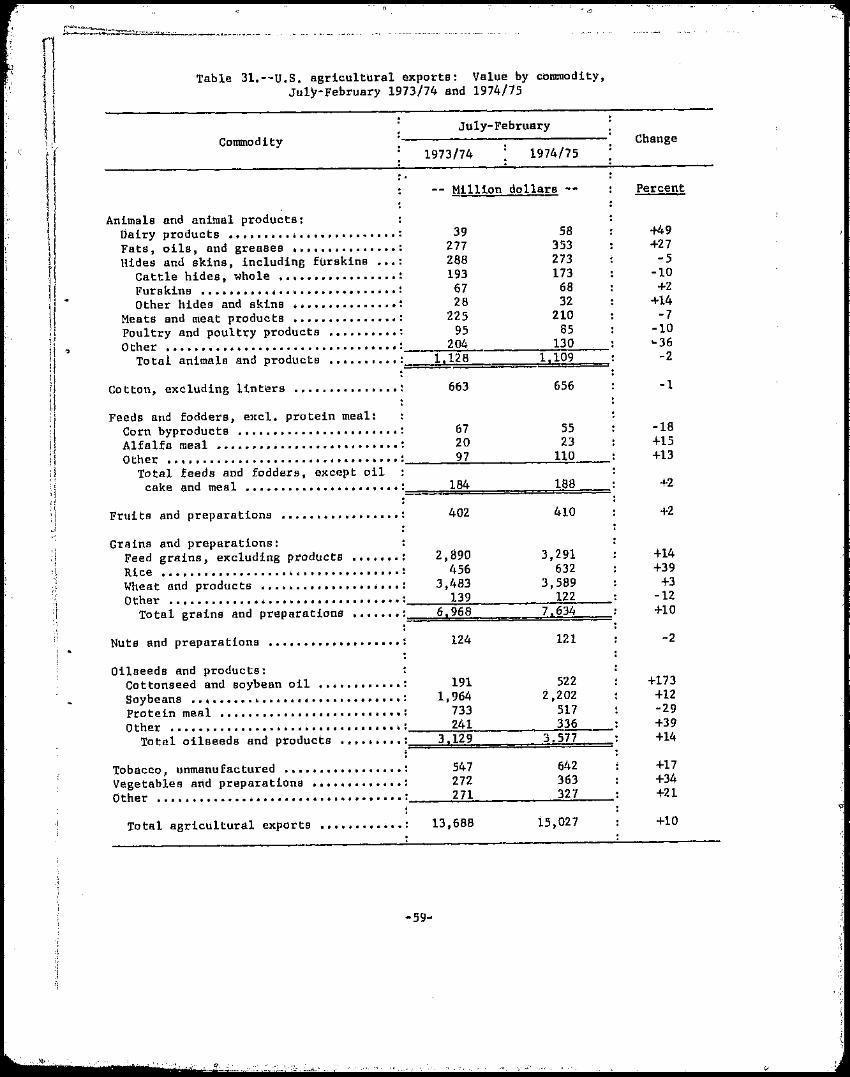
I
(,
Table 3l.--U.S. agricultural exports: Value by commodity, July-February 1973/74 and 1974/75
July-February commodity
1973/74 1974/75
: . Million doHars
Animals and animal products: Dairy products ••• ~ ••••.•••.••••••.•••• : 39 58 Fats, oils, and greases ••••••••••••••• : 277 353 Hides and skins, including fur skins ••• : 288 273
Cattle hides, whole ••••••••••••••••• : 193 173 Ii ..................Furskins .........• : 67 68
Other hides and skins ••••••••••••••• : 28 32 Meats and meat products ••••••••••••••• : 225 210 Poultry and poultry products •••••••••• : 95 85 Other .••••••••••...•..•....•.•••.••••• :____~2~0~4~·--.--------~~1~3~O_______
9Total animals and products •••••••••• :===1=,l;:;::2;,:8=======1==,!:::1=Oif===
Cotton, excluding linters ••••••••••••••• : 663 656
Feeds and fodders, eJtcl. pro tein meal: Corn byprodutts ••••••••••••••••••••••• : 67 55 Alfalfa meal •••••••• j •••••••••••••••• ~: 20 23 Other •••••••.•.••.•••.•••••••••••••••. :______~9~7____________~1~1~0.
Total feeds and fodders, except oil cake and meal •••••••••••••••••••••• :=====1=84~===========1=8=8====
Fruits and preparations ••••••••••••••••• : 402 410
Grains and preparations: Feed grains, excluding products ......... 2,890 3,291 Rice ., Ii ••• ., ••••• ., ••••••• 1(1 •••••••••••••• : 456 632 Wheat and products •••••••••••••••••••• : 3,483 3,589 Other .•.....•....••••.••..•.••..•.•.•• : ____ ~~1~39~----------~1~2~2_____
Total grains and preparations ••••••• :====6==,9=6;,:8========::7=,=6=3=4=====
Nuts and preparations ••••••••••••••••••• : 124 121
Oilseeds and products: Cottonseed and soybean oil ............. 191 522 Soybeans .............................. 4: 1,964 2 j 202 Protein meal •••••••••••••••••••••••••• : 733 517 other ..••.•..•.....•.....•.••....•.•.• :____~~24~1~--------~~3~3~6_____
Total oilseeda and products ••••••••• :====~3~'a12~9==========3~.=5~7=7~===
Tobacco, unmanufactured ••••••••••••••••• : 547 642 Vegetables and preparations ••••••••••••• : 272 363 Other •••••.•.••••••••••••••••••••••••••• :______:2~7:l__________~3~2~7_____
Total agricultural exports .. . ... .... . . . .. 13,688 15,027
-59-
Change
Percent
149 +27 -5
-10 +2
+14 -7
-10 '-36
-2
-1
-18 +15 +13
+2
+2
+14 "
+39 +3
-12 +10
-2
+1n +12 -29 +39 +14
+17 +34 +21
+10
/"
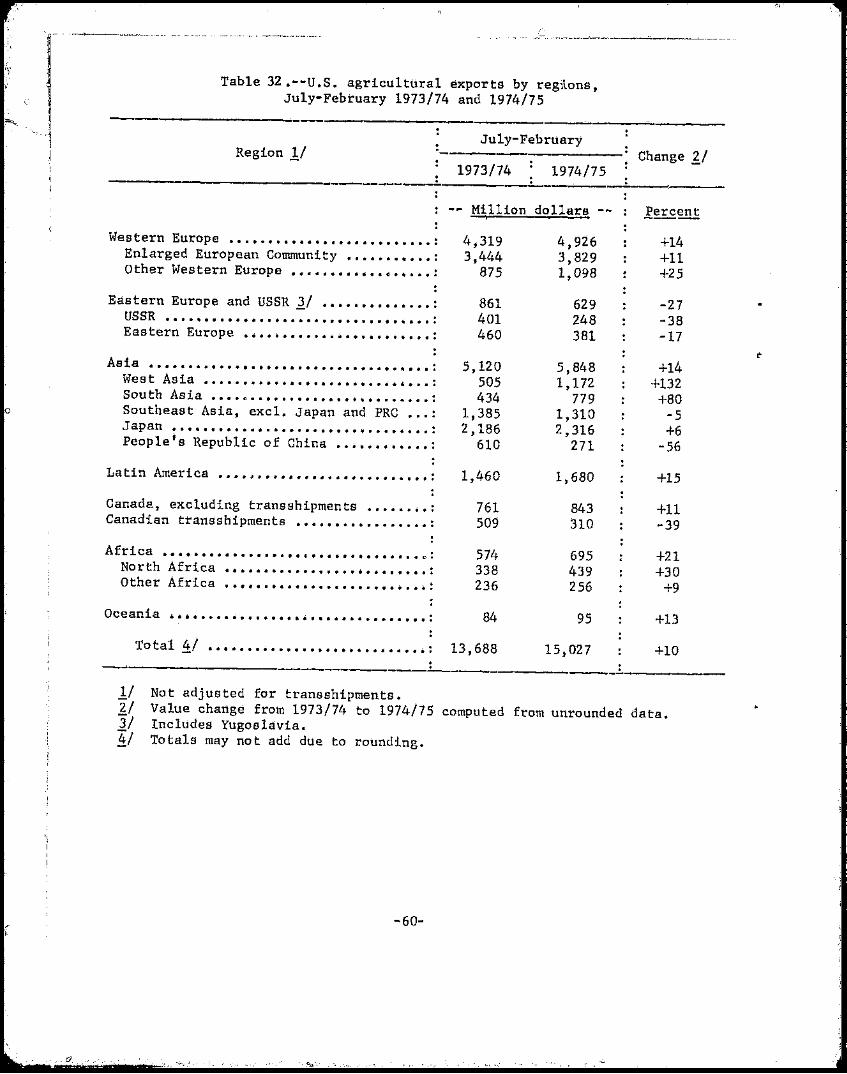
0,
Table 32.-"U.S. agricultural exports by reg'itons, July-February 1973/74 and 1974/75
------.-------------------.--------~--------------------.--~----~~---July-February
Region 1./ Change '1:./ . 1973/74 1974/75 -~----------~-----------~----,-------
Million dollars - ,
Wee tern Europe .•...•.•...•....•....• .,., •• : 4,319 4,926 +14 Enlarged European Community ••••••••••• : 3,444 3,829 +11 Other Western Europe •••••••••••••••••• : 875 1,098 +25
Eastern Europe and USSR 3/ •••••••••••••• : 861 629 -27 USSR •••••••••••••••••••••••••••••••• ".: 401 248 -38 Eastern Europe •••••••••.•••••••••.•••. : 460 381 -17
Asia ..................................... : 5,120 5,848 +14 West Asia ............•.......•..•••..• : 505 1,172 +132 South A~ia •••••••••••••••••••••••••••• : 434 779 +80
o Southeast Asia, excl. Japan and PRC ••• : 1,385 1,310 -5 Japan •.. "..•.•.....••......•••.... , ... : 2,186 2,316 +6 People's Republic of China •••••••••••• : 610 271 -56
1,460 1,680 +15
Canada, excluding transshipments •••••••• : 761 843 +11Canadian transshipments ••••••••••••••••• : 509 310 -39
Afri ca .•....... ., ........ c : 574•••••• III ••••••• p 695 +21North Africa ................... .......... 338 439 +30 Other Africa •••••••••••••••••••••••••• : 236 256 +9
Oceania • it it •• Ii •• Ii ••••• j .................... : 84 95 +13
Total!/ •••••••••••••••••••••••••••• : 13,688 15,027 +10 . . -----.-------------------------~..-------------
1./ Not adjusted for transshipments. 2/ Value change. from 1973/74 to 1974/75 computed from unrounded data. 3/ Includes YUgoslavia. ~/ Totals may not add due to rounding.
-60"
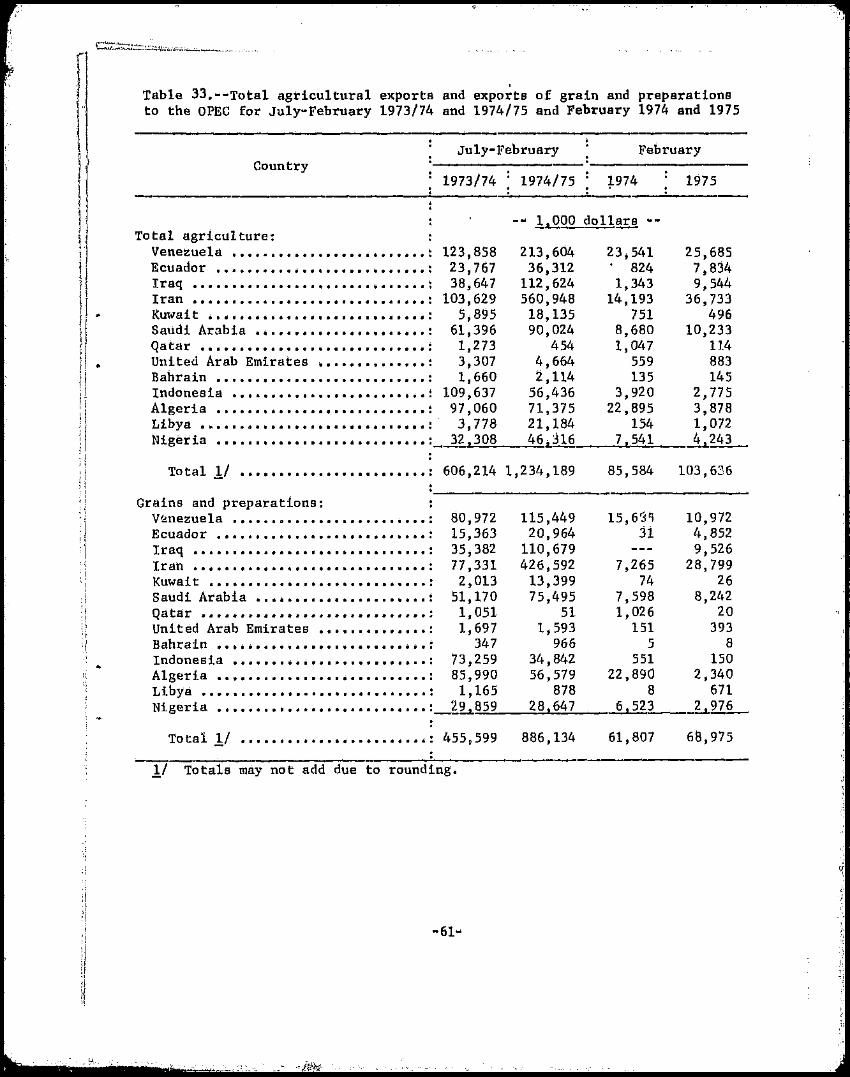
__
, Table 33.--Total agricultural exports and exports of grain and preparations to the OPEC for Ju1y~February 1973/74 and 1974/75 and February 1974 and 1975
July-February February Country
Total agriculture: •• Venezuela •••••••••••• ~ •••••••••••• : Ecuador .... it ................ " ....... ~ Iraq ..•......•......• "..... ., ...... : I ran • Ii ••••••• , •••••• 1ft ................ :
Kuwai t ........ II ....... ...... .- ... iiiIi ...... :
Saudi Arabia .•.••.•.••.•.•.••••••. : Qatar . II •••••••••••••••• it •••••••••• :
United Arab Emirates •••••••••••••• : Bahrain .. II ••• '" •••••••••••••••••••• :
Indonesia ••••••••••••••••••••••••• ! Algeria ......••... Ii •• Ii •••••••••••• :
L i bya ." ..... 8 • '" .............. Ii Ii " ...... :
~ig~tia ••••••••••••••••••••••••••• :
Tota11/ ••••••.••••••••••••••••• :
Grains and preparations: Venezuela .~ ••••••••••••••••••••••• : Ecuador ••••••••••••••••••••••••••• : lraq •••••••••••••••••••••••••••••• : Iran •••••••••••••••••••••••••••••• : Kuwait •••••••••••••••••••••••••••• ! Saudi Arabia •••••••••••••••••••••• : Qatar ••••••••••••••••••••••••••••• ! United Arab Emirates •••••••••••••• : Bahrain ••••••••••••••••••••••••••• : Indonesia •••••••••••••••••••••••.• :.. Algeria ••••••••••••••••••••••••••• : Libya ••••••••••••••••••••••••••••• : Nigeria ••••••••••••••••••• ~ ••••••• :
1973/74 : 1974/75 ~974
l.J!OO do 11&!! ..
123,858 213,604 23;541 23 , 767 36, 312 . 824 38,647 112,624 1,343
103,629 560,948 14,193 5;895 18,135 751
61,396 90,024 8,680 1,.273 454 1 , 047 3,307 4,664 559 1,660 2,114 135
109,637 56,436 3,920 97,060 71,375 22,895 3,778 21,184 154
1975
25,685 7 ; 834 9,544
36,733 496
10,233 11.4 883 145
2,775 3,878 1,072
~3~2~.~3~08~_ 46Lj16____~7,~5~4~1___~~
606,214 1,234,189 85,584 103,636
"
80,972 115,449 15,6~1 10,972 15,363 20,964 31 4,852 35;382 110,679 9,526 77,331 426,592 7,265 28,799 2,013 13,399 74 26
51,170 75,495 7,598 8,242 1,051 51 1,026 20 1,697 1;593 151 393
347 966 5 8 73,259 34,842 551 150 85,990 56,579 22;890 2,340 1,165 878 8 671
~~z8~5~9__~2~8L.6~4~7~~_~6~.5~2~3~~_2,976
Total 1/ •••••••••••••••.•••••••• : 455,599 886;134 61,807 68,975
~ 11 1ota1s may not add due to rounding •
.,
.,
1i/I.·I i
!{

i
Table 34.--U.s. agricultural exports to the People's Republic or China: Quantity and value by comm~dity, July-February 1973/74 and 1974/75
~JulY"'February 1973/74 July-February 1974/75Commodity Unit
Quantity Value Quantity Value
1,000 1,000 Thousands dollars Thousands dollars
Wheat, unmilled •••••••• : Mton 2,928 310,241 1,496 189;180
Corn; unmilled ••••••••• : do. 1,360 144,641 23 2,590
Soybeans ••••••••••••••• : Bu • 13,500 73,241 4,743 32,170. Soybean oil crude •••••• : Lb. 15,430 2,471 o o Cotton, raw •••••••••••• : Rble 346 69,651 168 46,932
Tobacco, unmanufactured : Lb. 3;394 4,077 o o Sheep and lamb skins ••• : No. 25 147 7 42
Tallow, inedible •••••••. Lb. 31,294 5,959 o o other •••••••• ~ ••••••••• : 42 29
Total . . •••••••••••••• 0 •• 610,470 270,943
':
-62
:1

••••••••••••••
1975
Table 35.--U.S, farm export unit values, July-February and February 1973/74 and 1974/75
dOlnnlodity Unit
Soybean oil ,. ••.•..•.•.•..•..•. I. •••••••• : Lb.
dottortseed oil ••••••••••••••••••••••••• : do.
Corn •••••••••••• , .............. 4 ......... : Blt,
Cotton. raw ..• ,.." .•...•.•.••.. II ....... Rbaie:Ii .;
A1fa1fa meal, dehydrated •••••••••••••••. B.ton:
Dried beans ................... "•...•• Ii •• : Lb.
Peaches. canned .••..••••......••....•.• : do.
Soybenns • .; •••••. ~ ••.•.••• ,. ...• "' ..... ,. .... ! Bu,
Graih sorghums .. ,.. •••.•.•.••• ,. •• it II • " do.Ii ••• :
: Fruit cocktail, courted ••••••••••••••••• : Lb,
Wheat •••••••••• ilt •••••••••••••••••••••• : Bu.
Tobacco. flue-cured, Unstemmed ••••••••• : Lb.
Tobacco, flue-cured, stemmed ••••••••••• : do.
Tobacco. unmanufactured •••••••••••••••• ! do.
Lemhs and limes II ••• ',' •• " ...... ......... : do.'II
Beef and veal, exceptoffals ••••••••••• : do.
Pork; except offais •••••••••••••••••••• : do.
Oranges ~I ." .... II " ••••• II ............... • : do.
chickens, fresh or frozen •••••••••••••• : do.
Ta110w f inedible ,. io " ••••• : do.
Raisins ................................. ! do.
Grapes t fresh ............................. : do" I
Almonds ji sbelled ., • ., .• ,.. t ., ••••••••••••• ,. t do.
dlltt:le h:ldes, Whole i .....'. _" i ........... ". ~ No. .. Of£als, edible ............ ;, .... "...... "..• : Lb.
: Soybean meal .................................. ~ S. tort t
July-February
1973/74 1974/75
Average unit
Dollars
.210 .367
.208 .357
2.548 3.619
205.100 280.187
100.175 141.050
82.750 113.371
.196 .253
.188 ,244
6.205 7.561
2.450 3.292
.234 .284
.170 .178
3.870 4.842
1.105
1.521 1.856
1.172 1.396
.125 .145
1.229 1.361
.672 .730
.108 .112
.418 .351
.175 .184
.504 .492
.202 ,208
.210 .195
1.407 1.070
18.275
.474 .345
223.989 154.223
1974
~ 1/
,237
,231
2.898
242,494
114.064
106.000
.267
.202
6.644
2.738
.238
.252
4.884
1.187
1.464
1.184
.112
1.217
.671
.122
.401
.181
.533
.232
.241
1.487
18.327
.500
201. 960
February
.392
.426
3.667
143.453
131. 667
.263
.232
7.394
3.405
.290
.150
5.169
1.659
1.869
1.542
.146
1.382
.732
.116
.317
.153
.482
.192
.248
.979
10.781
.332
158.398
11 Total export value reported diVided by total quantity exported.!/ InclUdes tangerines and c1ementines.
-63~

!
I
Table 36.--U.S. agricultural exports to COMECoN: Quantity and value by principal commodities and countries, July-February 1973/74-1974/75
East Germany Czechoalovakia
COnlmodity Quantity Value Quanti!:y Value
1973/74 1974/75 1973/74 1974/75 1973/74 1974/75 1973/74 1974/75
1,000 1,000 1,000 1,000 :Thouaands Thousands dotlars dollars :Thousands Thousands dollars dollars
Wheat, unmilled ••••• :~IT o o o o o o o o Corn, unmilled •••••• :do. 90 4 9,180 1,300 46 o 3,066 o Barley, urtmilled •••• :do. o o o o o o o o Grain sorghums •••••• :do. 11 21 1,123 1,800 o o o o Oats, unmilled •••••• :do. o o o o o o o o Rye, unmilled ••••••• :do. o o o o o o o o ..Soybeans ••.••.•••.•• :do. () o o o 7 o 1,27() o Sunflower seed •••••• :do. o o o o o 5 o 1,750 Oilcake and meal •••• :do. 33 o 10,765 o 81 59 22,692 10,057 Linseed oil, raw •••• :Lb. o o o o o oo {)
Dairy cattle, breeding •••• ~ ••••• ~No. o o o o o o o o
Cattle hides, Whole .:do. 16 12 152 205 370 457 6,253 5,134 Other hides and skins:
excluding fur skins :do. 30 24 248 222 38 63 223 245 citrus frUits, fresh :tb. 16,504 23,779 1,324 1,534 o o o o Cotton, excl. 1inters:kb1e: o o o o o o o o Tobacco, unmfg•••••• :tb. o o o o 921 1,765 951 2,185 Other ••••••• I •••••• :--- 1,567 631 3,607 1,738
Totl11 1/ ...•.••.•. :--- 24,359 5,692 38,062 21,109
Hungary Poland
Conlmodity Quantity Value Quantity Value:unit:._---:--- 1973/74 1974/75 1973/74 1974/75 1973/74 1974/75 1973/74 1974/75
1,000 1,000 1,000 1,000 ;Tbouianda Thousands dollars dollars :Thousands !h~ dollars dollars
Wheat, unmilled ••••• :~IT o o o o 423 52 44 1 923 6,961 Corn, unmilled •••••• :do. o o o o 366 372 36,892 49,055 Barley, unmilled •••• :do. o o o o 86 20 8,619 2,269 Grain sorghunle •••••• : do. o o o o 27 98 2,293 10,800 OI1(:s, unmilled •••••• :do. 15 o 1,550 o 82 o 7,381 o Rye, unmilled ••••••• :do. o o o o o o o o Soybeans •........••• :do. o 2/ o 27 72 76 22,758 19,278
-0Sunflower seed •••••• : do. o o o o o o o Oi1cl1ke and meal •••• :do. 50 109 12,402 19,318 182 165 49,245 29,259 Linseed oil, raw •••• :Lb. o o o o 32,497 21,533 6,598 9,698 Dairy cattle,
b~eeding •••••••••• :No. 1 1 497 1,147 2/ 2/ 100 80 Cattle hides, I.>hole .ldo. 88 242 1,285 3,462 385 614 7,963 7,207 Other hides amI skirts:
excluding furskins :do. 140 226 813 1,956 397 648 1,609 2,921 Citrtis fruits, fresh lLb. o o o o 4,528 15,096 508 1,297 Cotton, exe1. 1irtters:Rb1e: o o o Q 12 19 3,221 4,201 Tobacco; unmfg•••••• lLb. o o o o o 1,984 o 3,199
\
other •••••.•...••... :--- 78 713 20.641 16,269
Total 1/ .•. , •••.•. :--- 16,625 26,623 212,751 162,494
1/ Totals may not add due to rounding. Continlled-~I Less than 500.

I
.
---
T8b1e 36,--U.S. agricultural exports to COMECON: Quantity and lTalue by principal commodities and countries, Jul'Y-Feblluary 1973/74-l974/75--Continued
USSR Romania
COmn\odity ;\1n1l:: Quantity Value Quantity Value
1973/74 1974/75 1973/74 1974/75 1973/74 1974/75 1973/74 1974/75 0
"1,000 1,000 1,000 1,000 \ :Thousands Thousands dollars dollars :Thousands Thousands dollars dollars \
i I I
Wheat, unmilled ••••• :1-11' 2,338 648 183,594 125,5Cl9 0 0 0 0 \ I
Corn, unmilled .•.... :do. 3,084 838 176,179 101,953 0 509 0 72,260 Barley, unmilled •••• :do • 13 0 858 0 24 30 2,672 4,732 Grain sorghums ..... . :uo. 0 0 0 0 0 0 0 0 Oats, unmilled ...... :do. 0 0 0 0 0 0 0 0 Rye, unmilled .......... :do ... 329 30 28,606 2,917 11 0 1,294 0 Soybeans .•• "",, •.• ,," .:do. 18 0 5,507 0 0 15 0 3,506
0 , I . Sunf10fJer seed •••••• : do. 0 0 0 0 0 0 0 0 Oi1cake and meal .. ".:do. 0 2 0 493 72 12 16,895 1,920
:Linseed oil, raw •••• :Lh. 22,044 0 2,660 0 0 0 0 0 . ,
.. Dairy cattle, breeding ••••••••.. :No. 0 '1:./ 0 3 0 0 0 0
Cattle hides, whole .:do. 0 277 0 4,711 1,008 1,032 15,927 12,207 Other hides and skins:
excluding futskins Ido. 0 626 0 3,364 0 0 0 0 Citrus fruits, fresh :Lb. 0 3,103 0 289 0 0 0 0 Cotton, exc1. linters:Rb1e: 0 0 0 0 45 38 19.267 10,680
gTobacco. unmfs. ••••• :Lb. 0 0 0 0 0 0 0 0 Other •••••••••••.••• :--- 3,934 8,720 149 137
Total 1/ ."" .. "",, .. :--- 401,338 247,959 56,204 105,442
lIulgada Total COMECON:
Commodity IUnit: Quantity Value Quantity value: , :1973/74 1974/75 1973/74 1974/75 1973/74 1974/75 , 1973/74 , 1974/75
--'---_...._- 1,000 1,000 : 1,000 1,000
IThousands Thousands dollars .2.2.llm :Thousands Thousands dollars dollars
Wheat, unmilled ••••• :HT 0 0 0 0 2,761 700 228,517 132,470 •• IICorn, unmilled ••• :do. 0 64 0 9,964 3,586 1,787 225,317 234,532
Barley, unmilled •••• !do. 0 0 0 0 123 50 12,149 7,001 Grain sorghums "..••. :do. 0 0 0 0 38 119 3,416 12,600 Oats, unmilled """ ... :do. 0 0 0 0 97 0 8,931 0 Rye, unmilled "" .. "' .:do. 0 0 0 0 340 30 29,900 2,917 Soybeans ....•..••.••• :do. 0 0 0 0 97 91 29,535 22,811 Sunflower seed •••••• :do. 0 0 0 0 0 5 0 1,750 Oilcake and meal •••• :do. 0 28 0 4,782 418 375 111,999 65,829 Linseed oil, raw •••• :Lb. 0 0 0 0 54,541 21,533 9,258 9,698 tDairy cattle, " breeding •••••••••• :No. 1 ,V 1,241 325 2 1 1,838 1,555 Cattle hides, whole .:do. 19 25 288 262 1,886 2,659 31,868 33,188 Other hides and skins:
excluding futskins :do. 0 0 0 0 605 1,587 2,893 8,708 Citrus fruits, fresh :Lb. : 0 0 0 0 21,032 41,978 1,832 3,120 Cotton, excl. linters :Rb1e: 0 0 0 0 57 57 22,488 14,881 Tobacco I unmfg. • •••• I Lb. 0 0 0 0 921 3,749 951 5,384 Other ._J ............ :--- 289 939 30.265 29.147
: Tota1 l1 .....•.... :-..- 1,818 16,272 751,157 585,591
1/ Totals mlly not Ildd due to routtding.11 Less than 500.
-65

--
II
. ~ ~-. . "';~-"- ~--::;-~.... ,~~.,.---;----- ....-. ~, ~ 711'
,~ ,~,-,""~,.'. ,-". ". - ,,,=~,,,W'",,__-,._ lZ; : ::::::~~
~~.
TABLE 37..-Y.S. -AGAl'CULT4JRAL EXfIIOR!SI GUMTJTY.AHO VALLe a-i OOMtfOOl1Y
~,,--COMHODI1Y .JULY~Y f!EBRUARY,
~, ~lT QUANTITY " - YALlN QUANTI TY YAWE i r ~:~ 73n" 7lfnlS 11 73114 14175 1:1 I 1'9711; 1975 11 19'74 191! 11 1. :;t THOU 0 THOU. huoO D<\L,. 1,000 OOL. T«OU o rHOU. 1.1011 DOL, 1,000 QilL. t
~I.L COMMOOIl'lP - !ih!9~h500 67,229,-000 - 7,2112.700 -8,11111.600 I
HONAGRICULJU~L COMMODITIES 3711907,456.52,201,'943 5.332.e~l6,494,361 1
AaRI'~TURAl~OITIGS 13-'88,044 15,021,~57 1.909.8~7 1,920,239
~z..M"S'A!NO MJUlAL PAQOUCTS ANI~ALS LivE, EX 90ULTRY 160,164 133,912
h128,oa2 1,108 ..532 CAfTLE 165.-692 .en.007If«) 22,119 10,182261 1-46 119,136 067,405OTtlER 26 . .15 13,.6&2 5,539.0\5,91>6 :23.601 8'4~~ 4,643DAIRY PROOUCT.S
.39,011 .58.823AHHyaROUS'~ILK rAT -- 5.52111.8 -421 6.780ISo 253BUTTE'R 124 252 3 125l8 220 3 CHUSE,A~ .CURD "00 lel3 ·35(1 27 118 i!3L8 _ ",.a33 ·5,1)49 4,.681 122 ~Il" .ANO CREAMr 5.666 59? '48 644 101
CONOaNSEQ OR EVAPORATeD L8 26.-994 28,645 5 ..539 6~917 4,132DRY, _HOLE MILK aND CAEAM 4,545 819L8 Z6,11~ 27,462 5,.6a6 ltl03FRESH 7.lIt 1 2,559 2,609 696,GAL 1 ..336 1,146 2,105 751 ~NFAT DRy LB 2.6<110 241 125 ~45 343
OTf1ER 4,098 2/19,614 l,.351 2/9.631 654 !t81 2i1 22218.-666 26.1·54 2,500 3,534'ATS, OI~5, AND GREASEsI La 1 c;S62 ,372 1,833,145 :~77,1t86 35.3.225 '223,792 210,323LARO ANO OToHER AEHtIERED 'PIG rAT 4lt518 310,596'" l.B 72,672 85,$95 15.410'" I Ul.101ij1 22.~07 l·j,no U,566 3,llO 2,781
E-iltst.E L8 a3,296 26,1'93 4.235 5.806U.EiOlSl~ 8,559 OTHER La 1,31<\.578 1,SltO,309 :2",0,050 283,864 196,885
170 1,675 34lito ,817 35.604L8 9.lt-8a6 180,448 27,71+717.791 ·40.948 4,518 n.710 1,1~9 4,034
MEATS ~D M~T PREPARATIONS '.B 345 ..556 395,109 '225,a31 210.Pl 35,388BEEF .ANO YEAL, ExCePT OF'F-ALS La ~2,380 23,976 27,479",18~ 211;,$22POR", E)lCfPTOF'FALS 72,1~1 .33.774 7,385 3.541 8.988 1,,892L8 45,763 a.,U9 30.7·32 .61,436O'FAl-S, EOI.8lE, VARIETY IMEATS 2,360 9,875L8 182,131 218,406 1.583 7,230OT4'lER - L8 86,.665 75~281 17,6117 c!9.971 8,822 9,95551,819 67,742 35,093 039;634 1,997 8,994 4,5!3 5,401
PaUl.TAY _0 ~UL T.RY PRoOUcr.S 911,582POUl TR'h LIVEr ..- .8"'.567 11 ,094 9,080
SREEOlNi .CHICKS INO 7,188 6,a33 10ene 9,369.eASY .CHJ~KS, £)1 BRe:EDLNG CHICKS 1~ ...J1 1lt8INO 1.3 ..340 9,777 2,607 lt393 1,196oOTHfR 2.472 1,359 88~ 3i3 289
POULTRY MEAT, FRESH, FROZENr 2,%7 2.722 ..._- 259 300CHICKENS LB 72,766 16,696 30,1100 '26,999T<URK£YS LB 40,339 9,796 10.117 3,927 3,23022,395 22,Olt5 13~619aTHfA 3,417LS 2'551 1.061 1.253.,359 10.359 4,4fi7POuLTRY. ~ANHED AND sPECIALTIES LB .5,330 4.784 8611 1,164 1+21 517.J,631 3"OJ,s 2,212EGGS IN T~~ StlElL, "OR IHATCHliNG DOZ 7,275 988 283 516 1437,413 ~w"H;EGGS IN ~~ StfEll, tOniER OOZ 10.006 973 1.040 1,1t?8 loJ661,740 5,615 1,168EOOs, OfU~,! 3.~91 112 610LS '2 ..350 2,I·SIt 3 r 520 83 .lit!
EGGS oOWiERW ISf 1'RESEAVEiJ LB 1,094 3.644 208 48 3.5 73946 ,9111 568 SO 83 j9 18 CONTIHUED.
~
on ,'~ 0"" "Q
"

'('. ',r
.. fj
TABLE 37.--U.5. AGRICULTURAL EXPORTSI QUANTITY AND VALU[ By COHMODITY·-CONTINUEO IiJ f,
~ JULY-FEBRUARY FE8RUARY
VAlJUEC~HOOITV iJNIT J QUANTITY VALUE OiJANTlH 7,3174 74175 11 7317~ 74/75 11 I 1974 1975 11 1914 1975 1/ ~ T..OU. THOU. 1,000 DOL. 1.000 DOL. THOU. IHOU. 1,900 DOL. 1,00~ DOL.
--- 52,458 41,639HIDES NND SIU~5, INCLiUOING dJRSKIIo/S :288,4!85 272,521 CATTLE ~IQES. ~OLE !NO 10,51f9 lJ,005 192,780 172.702 1,485 1'718 21,2111 19,169 FURSKINS 61,328 .67.584 '2lt3~6 18,995 OUiER 28,177 ·32,236 3,9~4 3,415
3,4?5 4.156OTHER ANlIMAL PRODUCT5 31,756 ,38.?51 64 187K\!A, ~1"AL, EX WOOL OR FINE HAIR L8 585 611 439 66Z 154 118
1,2~9 1,424SAUSIIGE C~SINGS LB 9,122 8.20& 1l~87,5 12.006 748 887 646 809WOOL, UNMANUfACTUREO,INC fINE HAIR CLB 7,{!24 6.692 11,252 8,645 621 541
OTjiER 14,191 16,945 lt5~5 1,135
V~GETABL£ PR~UCTS .•-- 12.560,041 13,918,525 lt149,6~3 1,786,32i
147,051 10h681COTTON, UNMANUFACTURED RBA 3,468 2,508 .6730026 665.277 639 404 COTTON, R~W ABA ·3,235 2,]44 .663,419 656.779 598 380 144,9~0 100.316 LINTERS RBA 233 164 9,547 8,498 41 Z4 2,0?2 1.305
43,9~0 45,11'1fRUITS AND ~~EPARATIONS ·401,750 410,419 CANHE() L8 281.618 191,713 60,139 .52.~58 26,531 o!!O.207 6.223 5.412
CjiERRIES L8 12,41,9 13.001 4,719 4.771 401 504 195 223 fRUIT CO~KTAIL LB 80.51,9 53.182 18.829 15.291 11.250 8,08Q 2,6@1 2,341 PEACHES LB l()I.,755 72,060 19,732 17.580 9,097 7,785 1,8~1 h808 PEARS LB '9,030 4,313 1.993 1.~45 946 201 256 11
I 0> PINUPPLES LB 92,417 35,231 8,956 7.818 1,394 10717 303 433 .... OTHER LB 22,418 19.267 5,8"9 6,054 J.443 1,921 951 5196I
URIEO L8 184,429 140,217 81,41'9 64.178 21.588 11,807 9,6~2 5,420 PRUNES LB 95.913 55,831 37.400 '21.532 10,256 4.120 3,6~1 !t644
10,063 6,556 5.359 .J.1b3GijAP£,S JRAlS'NS) L8 71,739 70,786 36.190 .34.@03 -OTHER L8 16,71-6 lJ,59S 1,a30 7.!l43 1.269 10131 591 !!I 14
FRt;SH LB 1,511.039 1.649,744 196.'985 229.844 164.553 2u5.494 19,4~7 24.933 APPLEiS LB 129,386 156,239 17,520 :23,774 14,981 ~lt656 2.044 3,4!16 8ERIUts L8 1,3,862 18,492 3,1195 5.067 584 307 1~ 88 GRIIPEF'R\llTS LB 235,492 235,056 23,293 ;25,866 48.630 I7,G82 4,)15 7,486
GRAPES L8 2UIt·31'9 226.342 45.865 ·44.20G 3.893 4,656 9j8 ltl!:13 LEMONS ANO LU1ts L8 234.517 286,925 29.290 .ltl.~56 19,947 ~5,695 2,244 3,1!;3 ,QRAlNGfS, T.ANGER 1~6S.l .Cl,.fMfNT WES L8 415,202 462,293 44,"2 .51.893 69,242 06.886 8.4~8 '7,153 PEARS L8 n.Ool 63,.,91 10.446 9;602 ·3.4111 5,641 533 85! OTHER LB 187,194 200,905 22,433 -27.781 3,867 3,570 780 !:I73 ,:
F'AUlTJUICES GAL a6,6~ 25.119 ·54,392 ,52.-974 3.702 3.916 1.8~9 8,251 ".
GHAPEFRl.!1T GAL .J.a~2 3,617 6,252 5,988 413 412 157 175 ORANGE GAL 1·,,830 14.351 .J5,Slti ,35.779 2.421 2,422 5,5~4 6,093 (lTHER ·GAL ~,074 7,151 12,599 11.207 842 1.081 1,4~7 hl83
fROZEiH F'A\.!ITS L8 1,5 0 152 18.1-62 4,71'9 ·5.561 1.238 9~~ 333 213 OTifiER 4,096 5,203 4~7 821
NUTS ANa 'PR~~,ARATlONS .-. 12l.9Zlt 120.864 15,079 18,264 ALftONOS. SHELLE-D BASIS .L8 54,.664 74.910 76,898 .80.121 1,510 14,305 11.1'?1 14,007 VALHUTS, ~T ,S~£LLEO 8AS~S L8 46,703 51,415 2h553 20,418 848 3,655 334 hl67 OTlHER 25.47.3 20.325 3.5?4 2,889
OONTlNU~O--
- (
'.J -.;:. ~~: ,. -? P::·. .,i:,-.. ,. ~~.<

TABLE 37.--U.S. AGRICULTURAL EXPORTS. QUANTITY AND VALUE By COMMODITY--~ONTINUEO
JULY-f~flRUARV.COMMODITY FEBRUARYUNIT I QUANTITY VALUE I QUANTITY VALUE73174 74175 11 73174 74/15 11 I 1914 1975 11 1974 1975 11THOU. THOU. 1,000 DOL. ~,QOO DOL. THOU. !HOU. 1,000 DOL. 1.000 UOL. GRAIHS AHD ~~EPARATIONS -_. 6.967,.970 7,634,368FEEO ~AAl~S AND PRoDUCtS 812,694 1.043,496IMT 29,129 23,575 2.915,690 3,3ZS,693 3,249fEeD ~AA LNS 3,747 370,6~4 538,082IMT 28.850 23,333· 2 ..890,030 3,2Cj1,~8 3,223 3.722BARLEY 367,5~3 533.977.BU 65,6i!" 29;9ni 156,459 109;~31 5,725OOR'l 3,425 17,7~S 12.865,au 890,.448 739,692 U269,293GRAIN .SOR9HUMS 2,617~0 97,144 ldZ,323. 28lt4~0 448,591·au 168,.51:2 149~621 412,-91'7 1,92.59.OAToS 24,357 i:!lt238 ·66.·~79 72.310.au 36,064 6,4S0 51,·361 11~'90Z 815oHALT .AN" FLooUA ,lINC 8JIRLEY iMALT .La 60,872 43,-909 5,47.8· ·5.489 8,021
89 1,6~9 • 20S CORN .(iRiT,S AND tt0)4I~V 5,693 826 833.LB ;:18.174 28,697 2,131 2.125 4,163 3,606 226CORNMEA'" ellT 3041.918 1,I,6S 10~355 12,609 158CORN .ST-ARCH 89 1.199 821LB oIf9,2fi2 60.454 '6g421 11 ..4108 6,289 6,9234AnMEAL ·AND CROAlS 8~7 1.487CWT 107 73 191 7'94 0 24 0.(1A ~EAL AND QA f.5, ROLl.fD, ETC 266.Le 4,071 15,622 477 2.081 117RICE 2.724 33 ~94LB 2,257,643 .3,Olt2.999 .lt56,270fl 631,178 '264,876oHILLf)Q !iblt,319 6ltSit0 108,528LB 2,008,138 2,1t3lta75 "'15,799 517 ;·306 '2'35,368;tiUSKEoO 0 "l\ROWH "16.267 55,8~6 81,660
RYE .LB 249,505 611.124 400477 llltilt11 29,508 1"8.053 5,6~ 26,868.BU '22,169 ,3,931 ·50,100 11.604 2WHEAT .-HD i?RODUCTS ,au 0 4 0-899,747 739..858 31483,253 3.589,200 76,076~EAT 15,139 371 ,6?2 389,391,au 870,81,3 11-3,985 ~ti37ci,206 3,451,224 72,848IIItIEAT '~~R 11.904 355,80.1 37lt642.au :a3,551e 1'9..653 84,785 '97;834 2,751.(JTHfA l#H~AT PRODUCTS 2,091 12,8?1 l1r41,3·au ·5.319 6.2.!0 '28,262 J~,142 478BAKERY 'PROQUCTS 10144 2,9~0 60336.LB 1'7,657 22.936 7,481 12;0,~J DU;TEUC f:<OODS 2 9340 2,971 1.056 1,551
en La -86,268 U),I46 13,448 .3;·5~i) 15,282 1,251OJ BL£HQEO F90D PRODUCTs 2'0"1 i73, LB 1'~.'997 233,106 23,008 ,35,492 20,700OTlHEA 17'9~2 Z,7?J 'Z.725'COG'" 18,710 '25,045 20'9~S 2,940 fEEDS ~D FOOOERS,EX 'OlL .CAKE ~ ~EAL 184.286 l.a7.~77CORN ·SvPRQ9ijCTS. FEED -- 2lt6~1 26,954·5TH 647 ·540 66,634 .5S.380 63ALFALFA :tl,., O£HYORAT~ ·5TH 92 ·62 7,6113 7.029
93 6,8~8 9t8~3 ALFALFA _ L; SUN-CURED 7 6 '''2 790·5TH 145 \96 9~21 8,{l91 25ALFALFA HAY CUBES 12 2,1~0 689SiN. 53 '93 3,030 7,.619 2POUL TAY F~~DS, 'PREPARED 5 150 270·5THOTtiER _..., ~5 87 20.385 :21 ~018 9. e 2,364 lt996...- 71,00~ ,87,i81 9,3?1 1·3,357
OILUEDS A~AOOUCTS loU!90U2 3.577.038ou. CAKI ",tAL -- ·57.,S?S 407,3765TH -3;.320"'- ·3,·311 '1032,710 Sl1~048 --.SOY86AH '9IL tAKE IANO Ol~L 596 386 119,6P -6h713STN 13,022 .3.1·$4 ,67~,.8lo6 486.·353 ·551:OTH£R 361 Ult2~2 5a,171,5TH 298 1,57ou.:ao. ._- ...... ·55,8911 IJo~695 45 _.1~ a,391 3,59,2 F.LAAsEE@ Z.114~20 2,37atl3JJ .,_. <394,1'13 266.996.aU 353 47 2,41'0 ,369,50\48EANa 42 3 l'h 39.aU .3.106,5'5 2910'221•.sA"IJO~ nEo 1119640461 2.202.~1 56,435 .13,343 314.9~ 2~.538.La Ul,09!i 59..e74 7.-97.1fI.EANUTS "~~16 113 '9'033 1 1•.62Q.LB.. :223009105 ~2a,37.J .s6~3 193.094 41~18._(mtt:A 4t9.~~j -9tf1" 13.819
VEiClETAI&.E <011.4 AND 'WAX!S ,La - 81M1 l>9~9 ._- ,--- a,7'" af57~1.:214.345 h83!5t65S :216,.J!i6..OOTTGH!iDO (Ill,&. ~7oS~4 -248.214 188,899 oS9.,3?O 11,898.LB ~O;.394 lM,635 ~r4I~ 1Ila;~5 ttl.463.soWiEiAH ~IL ~r411 18t-3", 2a,'f.31L8 41<3,&63 1.043t'\66 .1'28,960 124,91$fI.£lINUt 'fiJI. 3&3~1 '1.3)2111 ~t6U lh2"911u 052,731 21,082 12,'206 11,-§76 ~,5ItIt.oTHeR 8'224 2,OSs <3,924.i.e .3HhOSI 374,.72 72,774 l.1tl~3 37,404 .1!hUJPROTEIN -MST.AMCU .L8 -9"3~' l4..~"ens 1O.~ .s.I~ 6~~13 1,9M 824, 103.' 7" ~INU£o;...
.. ..

II \' ·0 Qr- •
)'"
TABL~ 37.__U.S. AGRICULTURAL EXPORTS, QUANTITY ,AND VALUE By COMMOOITy--CONTINUED }!-J
FEBRUARY ~. I QUANTITY VALUE
JULY-f~BRUARY I P, OUANTiTY VALUECOM"ODITY tUN IT
:) 13174 14175 11 1.3174 1~/15 11 I 1914 1975 11 1914 1915 11
THOU. THOU. 1,000 DOL. 1.000 DOL. THOU. II;OU. 1,000 DOL. 1,000 uOL. ~ 56,500466,843 459,932 .541,030 641,856 50,115 36,631 59,"~2TilBACCO, IUNI'I*'NUFACTUREO LB
i~
LB 36.7Ft 25.230 46.546 .35,5J3 4.330 1,023 5.4~4 1.656BURLEY 6.256 11 ,420 154 115 1.141 540Cl·GAR WRA~PER LB 1.101 1.714 1.619 IDARK-' IREi? .l(EtlWCI(Y ~D TENNESSEE LB U.132 12.062 9,441 1l~S49 1.339 1,561 1.0~8
LB 310.020 301,918 .434,695 508.161 339930 ':;1&,962 4694!1 41.145 ! FI.AIE"CURE~ 9 l43195HARYLJiNO LB ·5.990 8,1-58 6,83~ 10.171 !l
4,031 I31,a87 2a,31t2 ,44,340 2,542 :ht21 3,3~2BULK .5MOK'~G TOBACOO LB 21.619
OTlHi;;R LB 19,262 79,5{l3 11t,9Z0 .20,076 7,869 3,648 l,9r9 1,266 I !212,259 363 0 250 34,609 45,915 I
I\!EG£l.ABl.fjS AND PREPARATIONS 139,825 ,36,196 '40.~8 19,988 14,Z7i 4,586 h200
CANNtiO LB 164,081 9Z 127ASP.ARAGI,}S LB 2.737 4,270 1.122 1.454 Z38 381
LB 4Z.947 28,681 8,235 '1 ~~'$!; ·5,915 3.784 102~3 11159COlVol 883 753·5.539 4~rA5 3,604 2,393.SOUPS LB 22.869 13.647
LB 61,996 59,·886 14,241 1~~:;93 5,Z49 3,839 10168 1,1601J"A'IIOE~.TOMATOSAUCE ..lI'~O flUREE OTHER LB 33,533 33.335 7,059 8;552 4.922 3,814 10200 hOOO
PUL.SES LB -444,50(1 5B9,190 35,1418 1~0,148 29,961 (7,702 7,968 18,644 4,510 15,151.L8 289.211 396.048 56.827 102,1'21 16.890 ~7t131ilRIEO ft.i;ANS
~RLE() (!~~AS, llllC oOW »10 CHICK LB 120.193 136,599 20,41'9 :24.~56 10,715 11 ,~41 2.100 10 732 7,821 14,272 ~.356 ~,425 7S7 1,755
~lED L~NTILS Lb 35,098 57.143 fRESH LB 848,::;,..0 875._94 69,790 ,80.690 103,806 lU7.450 9,lB4 '9,<:59
194 140138 672, 291 284 390 181,ASP.ARAtWS LB LB 15... 091 175,208 10,867 1,S~223 25.735 c7,129 2.126 2,221
LETTUCE LB 135,286 105.4'23 12,598 8,894 9,751 11 ,614 1,1?8 !t004I ON loONS
\0 11 ,057 27.253 18,919 1,391 581'" ~OT~lOE~' EXCEPT .S~EET 'POTAT~ES LB ,~59,923 248.889 10.837P 13,845 1-9,342 4,230 12,618 6B8 2.122I
LB 91.052 125.034T~HA'IIOE& " LB 201,450 220,269 21.·353 '25,~90 36.441 .!6,388 3,656 3,891;) ~THER
FROZeN 'VE~~TABLES LB 39,867 35,819 8,·31'9 9,'~78 7,536 5.444 1,401 1,600 2,896 1,914 1,1~4 1,893HOP,S LB 10~505 9,449 10,.545 10~34B 2,603 1.358
SOUPS AND VEGElABL6S, 06HYORATE~ LB 23,250 26,177 11.-4169 18,448 2,467 2.563 1~7 150T<»lAHI I..IU ~~E, CANNeD -GAL 1.482 1,699 1.710 2.467 123 97
1,574.LB 39,196 29.1Bl 12,217 13;153 S,oll8 3.?5!o lt9~2V~ET.ABl.E ~ASONI~GS
36,885 ,47.7fl9 5,311 6.042OTiHfR
40,662 40,911'260,683 311.771OTH£R 'lEGETA8.LE PRODtIcij-s ~,24920,919 26,088 26.255 3,356 3,66Q. 4'2~COfF!E LB 13.703 DRUGS, IHERI:IS, ROOTS, ETC LB 7,81·3 7,815 12,599 13.0961 91B 869 1,1~5 1,166 tSSEHTtAL ~ILS ,AND 'R[~I~OIOS LB Ih511 '9,:)62 39,591 -41;111 1,412 1.~~.1 5,6~5 5.515
33,130 .35;545 5,537 3.989rLAVCADNOSlAUAS, ~UGARS, EXTRACTS --- 426 83LB 12,117 2,641 5.485 1.555 816 jj;JH~EY 10,1t96 ,,858 !t840
NURSE~y Sl'OCK :.--- 8.B703 194,61'& 182,1'97 13,0&0 ,85,1f95 35,919 t4.844 12,611 ll,339SEEDS • .EJI&~PT OILSEEos LB
LB .6~538 7 .. 073 5.441 6.014 915 fJ?9 161 701SPICES 8,368 11 ,02456,.39.. '91.339OTttER
11 flRELlMINAR~. 2/ REEXPORTS OF 12,599,000 LBS. VALUED AT $6,173,000 TO FRANCE IN JANUARY 1975 ERRONEOUSLY INCLUDED IN DmlESTIC EXPORT STATISllCS.
q t:
~
. {\ 1:\ .•P.. ..•4\ '"'"~.:,- .-.. :~.

~',' , >'~"~::::,., r:;F'" {l o,:~
r'I \",
"
"',1 Q"
TAelf 38.U.S. ,AORtCUUURAL EIIPCJRTS TO EC ~UANTllV AND VAUUE IV OOMMOOlTY
r JULV-F~ARY nallUARV COMMODITY ~IT QUAN'UTY VALUE GU~Tl" YWJf Y
7,3/14 14175 11 703/104 704/1~ 1'1 I 1"»74 '."5 11 1974 1975 11 TtiOU. THOU. lvOOO DOL. 1,000 OOL. ntOU. 'HOU. 1,000 DOL. 1,001 DOL.
Ii: VARIABLE-U:VY 9CHMOOIT lUI 21 1,599 14,717 230,066
IIo4T 6,788 7,408 ,&9l,.662 1,067,148 6t'rfEED .GRA lfoIS 222,167 b CORN I"'T ,5,959 6,939 rfll0,l82 1,011,390 661 1,545 .o.4~
320 .,ll 034.l87 ~.950 IS 36 1.799 ·5,3\',3GRAIN 9O~MS If4T BARLEY lMT 187 19 16,739 2.610 0 l' t '2.436 OAf.S IHT l22 27 l2,lSlt 3••n H a 1,507 70
.HT 86 ·58 ·36tol27 :24.~0 19 5 lh~ a.noI: IUCf lHT 8 ·JO 7~7 3,809 0 0 tAyE ORAIN
725 142.7,31 1.s0~.se. 104 t6 2Z~.,g° 2,,144IlltlEAT GRAIN iHT 1,067 _ a.660 1 42IIIHEAT fLOUR ;MT 5 3 660 '1a65 1,201 >971 513 147 lSI lfllBEEf ,AND VE"L. Ell YARIETY IMU1S LB 1,295 " ,. ol.J7PORK, Ell VA~lETY ~EAlS LB 500 4804 ~09 36 41 ~ 3t
LB 280 25 61 11 0 7I' LARD ·31 .1',-- 1,5! 6 ....6 '..- 19° 7DAIRY PAOOU~T.S --- ~
I ,'; POUL TRY MHO ~GS - 16~92 '9.169 .- 1t6~1 ftS-- 104 -3 -,C! LIVE 'POUL THy -- -- 993 704
l. 75997 387 544 l.aS .J6 1328AOl~AS AHO fRYeRS LB -1 STE.~ ~lCKENS LB !)9 0 II 0 2 0 0
L.B 2l.062 12,902 U,.~54 7 ;~515 2,067 h121 h2!1 784TURKEYS 13 1O~R F.RE5H pgUL TRy LB 866 12 S56 19 30 .. 1 310 10Z.•_- 1.6a. 1,346EGGS
15~8 9,615 1.6~ h191OTH£R 255,6391908,..,a9 1,274,756 12lt344TOTAL V~RIABLE-LEVY ITeMS....• --- -
0 1
~ONVARtABLE-L~VY COMMODITIESI 5 3 .sC~NN£D ~~LTRy 41 L.B 4t6 161 HI aJ5 C
20l 50,lis .63.;554 J5 9,112 a.iaeCOTTOH, U I.1HTERS RBA 2Ft ,~-- 6.... 1,OllfRUITS AND PREPARATIONS ...-. 68,OM .52~1 135,096 179,839 14 ..l&2 1'9~4J9 10,013 &'9.683 2,185fRESH F:AU~t.S LB h:~
CITRUS L.8 127.109 111.549 12,'80 17~79 ,! ••~ &7.660 ,,782 ,3,%1 379 116 36 24ORIINGiS AHD TAHGER~ES LB 44,U3 45,953 4;·534
,!h284 41. S.!Lt:f'.1()N AHD LIHE~ I.B 51,308 78,410" s~ 8 9 077 4.459 h213GRAPEFRUITS L8 31,429 46,441 2..138 5.033 '~.9M "2.190 ,3~1
I, OTHER L.B 159 351 33 .35 0 0 0 0 .8 106 0 '510 0 90APPLES LB 16 ~5
~RAPfjS L.B 856 1,124 i't9 ~99 0 119 0 49 7,055 6,522 1,.4441 1.655 1.2<\8 11324 0354 2"-OTHER L.B
lI,836 22.050 10.683 7,299 '2.810. 2.6~7 ,,262OR lEO fRU n.s LB 57,132 GRAPES (RAISLHS) LB '91'997 8,181 5.0lf9 4.020 2.065 1.661 1,1°1 803 PRUNES LD 43,968 19,125 15,758 ·6,1·32 ·5,220 h093 irS'1 "34 .oTHER LB ,3,166 hl30 1.244 -5l1 14 91 !I 26
710 1.061 2,171fRUIT JUICES GAL 4,720 3.555 9.021 ~~1·59 1.5'. ,5,7708 4.455 549 191 h140 1.1It2
.GAL 150 "75 lt04a6 1046 103 86 1~ 111ORANGE ~AL 03.061 2.538 ~RAPEFRYIT OTH£R ~AL ~09 542 !tua 1,558 118 14 233 2103
CANNEO fR~lTS' 51 L.B 9h9<\1 49.'947 20,-421 12,698 ·5.416 AI,2fi3 It!!: h19! 2,132 1,2'79 l31PEACHES L.B 34,663 U,Oll 6,409 2.686 ,553 ~QfRUIT COCKTAIL LB 20,003 S,21S ~tt666 1;·516 2,168 1.416 2.L.B 30,221 2h634 5,lii!? ••633 615 790 146PINUPPL~S 1~3 196OTHER .LB l.J,QSS 12,061 4,220 ·3,863 SOD ~
2,i811 2.143 1;7 211alliER F.RUlr.s ,goHTlNU£u;.•-- --' ., ..
~~ 1-; ,"i~'~'~'."''''."'

• ·f.. •
I lrTABLE 38.UoS. AGRtCULTURAL EXPORTS TO EC ~UANTITY ~D YA~UE 8Y C~U1T~~~TINU[O
~rIJULY....~eAUAAY FEBRUARY
C&4MOOITY UNIT. QUANTITY VALUE QUANTITY VALiJE Ii I~ -ron. 1.175 11 7317.1t 1.1t1l! 1'1 I 1'97. &915 11 191. 1915 11 11
Iimoue THOU... 1.000 DOL. I,oeo OGL. THOU. rHOU. 1,000' DOL. 1,000 UOL. _ t LNONVAAlA~E-LIYY COMMOOITI~CONI (
VEGEUBLEi5 .-0 PAESlAAATIGtlS -- 21.130 .35,1.9 3.189 •• in1 i
PULSE LB 106.511 91,084 UI,OOO a3~t22 8,019 11..923 2,2~5 2.623 f DRUD ~s LB 80.01-8 59,361 12,125 14;70f, .,155 6,362 h218 1.591 !
DRIED P~AS LB ~.55l 38,123 soan -9,01t& 3~323 5,561 hot7 1,u26 FRESH ~EGitABLES L8 !~lJCJ 8,278 10126 1.Ul 1,130 2,893 251 "46 CANNEO 'VE~~TABLES L8 't.2l8 1,542 1,ltt1 2.001 164 812 1~6 Zlt2
ASNAAG\lS L8 las u. Si! .3,~ 0 6 0 3 ' .} ~{lTtER LG 7.092 7,1,28 l.~ 109611 76" 8.61 1~6 238
~ L8 4\)9 342 621 294, 0 95 1 84 OnMfR. ~~lABLES , 'FRE~AATIONS S,ea1 1.~71 1.0~9 1522
,')
HIDSS AlND SKIllS -- 41.329 45.525 10.733 10,731 ,r
CATTLE ~I~~S, ~OLE iNa 510 815 10,O.ItO 11,814 60 205 1,050 2.J09
." CALF AHD ~I-P SKINS INa 2JO 314 I,OiS 1.150 1 ~!I 11 127 OT.I'IER 30,264 131.961 990-13. GiJ~C
OILSEEOS .ANO PRQDUCTS 1 ti315,19lt 1."01.951 260.7i4 1310966-""-OIL CAKE ~ MEAL ,"T 1.·565 2.0.It2 1380,79i! 345.813 2ltS 188 54,oi9 3",1t48 SQY1!EAN ,"T 1,"32 1.950 1357,205 330,960 224 184 50,233 33.955 O.THfR ,"1' 133 92 23.586 1",853 21 ft 3,186 1593 "
OIL-SEEDS 1913.652 989.959 203~113 910639 .soYBEANS ~T .J,904 3,277 ,858.033 916,189 812 J06 196.3rl 85,311 FLAJISEEP II'IT 2 1 236 283 0 0 0
1 OTHER 55,383 13.487 6.142° 6,328........ VEGfTA8LE OILs L8 91.924 164,003 20,4113 .64,311 11,342. 15,515 3,4~2 5',377I
COTTONSE;D LB 17,267 6,7·58 3,606 2,299 4,854 885 1,035 36ft SOY.8EAN L8 10,085 9,416 1,587 4,112 202 26 61 10 LINSEED L8 1'9,19c 65,158 4.174 c8,867 3,305 3.11Oc 1.3~2 1,110 {lTHER L8 S1,J80 82,611 11.106 '29,094 2,981 10,935 1,015 3,,93
TALLO •• LNEOIBLE L8 304.236 259,174 52,461 "",083 29,574 c5,502 5,556 3,535 Til8ACeO, l\JNHAHUFACT\!REO L8 112,034 104,S88 117,95i! li!5,569 9,1:125 &2.681 10,O~7 18,260
!'~ VARIETY M~A!S. FRESH. 'OR FROZEN 41 L8 104,129 119,263 55,553 "'3,114 10,299 18.3.04 5.1009 6,141 NUTS ANQ 'PREPARAn~S 39,854 .55.299 ft .122 7,471 CORN t!l'PAOO\JCTS, FEED 61 II>4T 564 4It3 64,356 "'9.303 53 81 6,412 9,328
" FOOD FOR '~ELIEF AND CHARITY 18 71 0 8 OTHER 101,"61 '99,993 13,10"1 16,507
TOTAL NONVARLABLE-t.:t:m lTE"5 Ip935r435 2.0e5,217 336,23" 223,b85 rOTA I.. 2.843,86" 3.300.019 1057.578 479.325
11 PRELIMINARY. ?I GRAINS, POULTRY, AND PORK WERE SUBJECT TO VARIABLE LEVIES liEGINNIXG ON JULY 30, 196Z~ RleE, ON SEPT. I, 19M: A.'ill BEEF AND DAIRY PRClllUCTS. ON NOV. 1, 1964. 3/ LARD Ft)R Fll(1P IS A v:\RIABL1::-Lla;y cm~!ODITY, liHILE LARD FnR INDUSTRIAL liSE IS BOUND IN TftE GENERAL AGREE~IENT ON TARIFFS AND TRADE (GATT) AT ;) pl'RrF~T AD VALORPI. II.S. I.ARD IS FilR l'(,nD HSE. 4/ AL!BGUGl! CA.....:oiED POULTRY MiD PORK VARIETY ~IEATS ARE SllBJECT TO VARIABLE LEVIE'S, THESE r,\~"OT EXCEED THE "'IOUNT ill' I~lpnRT DUTIF.S BOUND IN GATT. 5/ VARIABLE LEn' ON SUGAR-ADDED CO~TENT. 6/ \fAISLY l'llRN (';WTEN FEED AND ~IEAL, ritrrCi! ARE '\ONV,\RIo\}JLI'-I.EVY r(l'I~IODtTIES: BUT NAY CmiTA-IN S~Li\LL QUANTITIES of OTliER CORN PRODllCTS, SURJECT Til nRtARI.F [.F\·IE~ (Sl"1-' "EXPORT HII~lIumIT<;, ),fARrH 19':'0"1.
" ,0

12
----',,~.---~o
TABLE 39.U.S. AGR lCULTURAL EXPORTS TO ENLARGED EC 'QUANTITY AND VAlUE BY CO"MOU1 TV
I JULY-fEBRUARY fEBRUARYCOtoIMQD I,TY UNIT I QUANTlTY VALUE QUANTITY VALUE l 73114 7417S 11 7317~ 7"175 11 I 1974 1975 II 1974 1975 11'
TtWU. THOU. hilaG DOL. 1,000 DOL. THQU. rtlOU. 1.000 DOL. 1,000 UOL. VARIABLE·LEVY COMMODITIESI al
FEED ,GRAtNS 'HT 1.716 8,018 ,80l,Z27 1.153.37'1 168 1.662 93.828 239,163CORN ,MT 6,935 7.529 716,80: 1,095,341 132 1,608 89.522 2:,n,264GRAIN SOR~UHS HT 33a 443 35,530 52,222 2S ~6 2.799 5. J9:lBARLEY ,loll 187 19 16.739 2.620 0 18 0 2.4J6OAts ,loll 322 27 32,154 3.188 11 0 10507 10RI.CE loll 107 86 4!h989 ·36,826 22 1.0 11..954 4.198RyE GRAIN ,/<IT Ii 3Q 741 3.809 0 0 0 0 ,)Iit1EAT GRAIN HT 1 •.201 881 164,630 182.039 138 96 29.830 c:..-.1l44Iit1EAT FLOUR'0 HT 5 3 672 &fi6 1 0 ~I "2REEF ANO VE"L.. EX VARIETY 'MEAlS LB 2.333 1 .• 455 1.8~9 1.631 681 264 3~1 .J61PORK. EX VARIETY t4E4i ,S. LB 66lt 611 429 316 36 89 36 ':>8URD 3'/ LB 36 •.159 22.663 7.911 S.83a 8,688 3.828 1.821 185DAIRY PRODU!=T.S 198 1~812 28 HZPOULTRY AND toGGS 20,Q1.6 13.324 10853 101li3LIVE "POULT.. y l,Oe3 860 104 63BROILeRS AND FRYERS LB 1,621 480 851 25S 36 132. ~8 15STEWDNG CHICKENS La 59 0 21 C) 2 f) l 0TURKEYS LB aS,Sll 1~,595 14,682 9.63Z 2,096 10844 1.218 'i3lOT~eR FRESH POULTRy LB 869 26 560 4Q 32 16EGGS J. 1 ~.933 2.538 476 noOTHEJi 19.94/t 16.361 2.2Z5 2.U45
t ..... ~ T~TAL. YAHIABlE-LEVy ITE~S 10063.763 1,422,06S l42,Ol2 268..991
NIJH\lAR U&"E-LfVY COI4"'OoIllES t
1
C,tNNEo. "POULTRy 4/ LB. no 377 1'-6 256 ~ 5 3 5COTTON. EX L. LNTERS ABA 256 235 58,167 12.944 42 34 10,415 9. 4 63FAUI~SAND ~REPARATloNS 90.889 12,601 9.160 8,934FRESH FRuJ·T.S LB 1610008 217,606 11,1:161 24.999 10.934 C3.l90 lt3~8 2,125ClTRUS LB 145,551 195,200 14.463 20.027 9.352 18,519 895 h8BOORANGES AND TANGERliN6S La 54,351 6Q.414 4.870 5.819 412 246 47 30LEMON AND LIMEs LB 56.114 83,558 6,356 8.636 4,516 5.518 4~J !::I68GIUPEfHU f T5 La 34,771. 50.8t4 3.1.1! 5,474 4,365 12.815 355 toZ8ZOtHER LB JJ.5 364 67 37 0 a 0APPLEiS LB 2,0):2 10,058 302 1.559 e1Z 3,200 ,!3 !::I 06 0
GRAPES La 4,581 4,224 10294 1.009 19 4285 13OTHER LB .03,864 8,123 1,808 2.4 04 1.290 11327 366 266DALEO FAUltS La 82,389 48.335 33,61>3. 19,936 1O,525 4'002 4.3~6 lt7~8GHAPEiS (RAISINS) La 20,223 18.954 10,380 9,433 3,954 2,338 2,166 10162PHUNEiS LB 51,2941 26,041 21,150 8.864- 6,537 1,608 Z,l~6 610OHlER L8 4,812 3,,340 2,083 1.639 33 51 15 26~l'" JUII;Es ,GAL. ·5,617 4,313 11,265 8478~702 l,ZOl 1.106 2,601QHNlGE .GAL. .3,631 3.056 1,256 5.985 602 1,2!t 2,1991'002~NlEFR',J1T -GAL 81.(1 522 l.a14 901 105 96 1§4 16lOTHfR GAL 1,103 1,35 2,195 1.816 140 103 2?1 cJ8CANNED '~lTS SI LB 118,081 55,961 24.-81.e 14.e!70 6,956 4,849 1.6~ 1,360PEAaiES LS .3ch685 110438 7 ..369 2.784 2,406 h30H 505 347FRUIT COCKTAIL LB 27 ..508 8,402 _ 6~1'9 2,396, J.110 1,848 7~S 515PIH£~I.,~S L8 34.405 23.171 5.912 5.021 615 839 l~6 236OTH£R LB 16••Be! 12.-951 It.'i1.e 4.068 805 822 200' 201OT.H£A ~Ul ts ..3,e!&fi ••699 173 451 CONTINUED.·
..
""'0 _
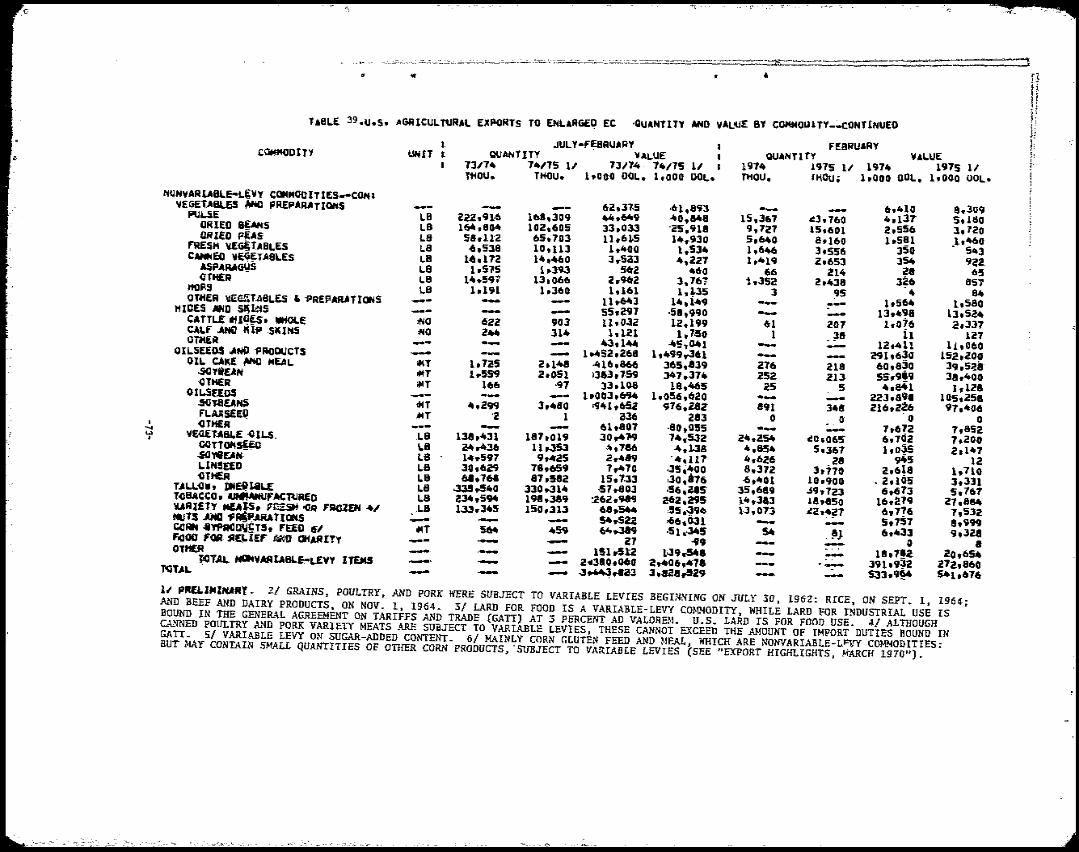
--
.0 < n~,-'::~(;~
.ok~,
If .. • •
TABLE 39.U.S. AGIHCULTURAL EXPORTS TO ENLARGE~ EC ,QUANTITY AHO VALIij£ BY CQIoIMOlllTY_;'CONTlNUEO
I JULY-FESRUARY FEBIiUARYC\JHHODITY tJlfIT t QUANTITY VALUE QUANTITY VALUE" I 13/711. 74/1S 11 7311-'4· 74/75 1/ I 1914 1975 11 1974 1975 1/
TtiOU. THOU. hOOO. DOL. 1,000 DOL. THOU. rt~OU. 1.000 DOL. 1,000 UOL.
NUN¥ARLABLE-L~VY CQMMOOITI~S.-CONI VEGEtABLSS, ~. PREPAAATlQHS --. 62,J70S .61,893 6,410 a,309PULSE -..-LB 2U.~l!6 168,309 44.649 -40,848 15,361 1I!3,160 4.1~'t S.UtoDRIED B~S LB 1641.804 102,605 33,033 '2S,918 9,727 15,601 Z.556 3.120DRUa P~A5 La 5~hU2 65.. 703 11.6105 14.930 5.640 8,160. h581 h460fRESH VEG§TABLEs LB -6,538 10,113 1,400 1.534 1,646 3.556 350 • 543
CANNED ¥~TABLES LB 1-6.172 14,460 3 r SCl3 It ,221 1 ,It 19 2.653 3S4 9a2A5PAAA~S LB 10511S 1.393 56, 1t60 66, 214 28 65~TH£R
I; LB 14,,59-:' 13,066 2,962. 3.U.}' 1,352 2,438 3?6 85"1'J+Qfl.S LB 1.191 1,360 lel{jl 1.PS 3, ~S 4 SItOToH£R ~EfiT~8LEs, , 'PRE~lRATIONS~... -- 11,.643 14,149 -..-. 1,564 1.580 L HIDES .4110 S!\L:4S .58,990 --. -- 13,.~8 13.5245S.C97 r CATTLE itfl'!~' Wiatt iNO 6ZZ 903 11.032 12.199 61 201 1.O?6 4h331CALF AND. IUP SKINS iNO 244 314 1,121 It7,50 1 . ;38 11 127O'DtER .-- 43.144 -45-,041 -, lZ,411 lL,D60OILSEEDS .ANP 'PRODUCTS 11452,268 1,499 ,.361 29lt6~O lSz,ZO/JOIL CAKE ~ tlEAL --IMT 1,72S 2'.148 .It 16,866 365,839 -216 218 60,8~0 39,5~a.sol'i~AN "'r 1.559 2,,051 '363,l59 347,374 Z52 213- 5S,9!9 38.400OTHER IMT 166 ·97 33,108 18,465 25 5 .,841 h128OILSf.£OS 1.003,694 1.0S6,620 223,898 10S,25.
.so'f.8~~ --IJ4T 4,299 3 •.4&0 1~4I,652 976,2&2 891 34& Z16,Z~ 97,406FL,uS!EQ ".T '2 1, aJ6 2&3 01 0' a a~TH£R.... 61,807 .80,055 1,672to> --- 7,852 I VE~T.A6LE .gu.s~ -.LB 13a.431. 187,019 o3O"lI9 11t.,532 24,25.4 1I!0~06S 6,70Z 1,ZOO
QQTt0t4~ LB 2:4..36 110353 ~.7a6 4,1.38. 4,854 S,367 1.,0~5 2,llt7,soWlEAN LS 1·h591 9 .... Z5 2".9 '4.117 4,626 .28 945 12LINSEED 1..8 30,62.9 78,659 7"70 035,400 8,372 3,170 2,6!8 10710-OTtER LB 61.76. 87,58Z IS,7.33 130,*16 -6 ,ItO1 10.900 ,2,lOS 3,331T.lu.~... ]Jj~J.i1.£ LB .33!.,!I1t0 3300314 -570803 .56,as 35,689 .J9,723 6,673 5,767'T.aaAeeo. ~'ACTUR£D LB 231t,5~ 198,389 :262,989 14,383C62~295 Uhaso 16,2,~9 27.884Y..tRl~TY MI~. yf<ESiH JO~ FJiQZEN 4/ ,LS 133,345 lSD.o313 6&.~ ,s5~~94 }<3,073 il2,4?-7 6,7!6 1,532NUTS AHa· 11 ,!.ARATIONS - 54.522 066,031 5.757 8,999COHN .aYPA4l~~T5, fEED 6/ -'IMT ~ 459 64..JH .51.-345 -s.. 6.433 9.328. !J). flOGO ,.~ 2i£J;.IEf" A?4D QHAffITY 27 >99 0 8OTH£R ,...._: 151,.512 1'39,.54, 18.7!2, ZO •.tis.~TAL NONVM1ABLE.-oUVY 1l£M5 2.310,060 2,lt06,47a-, 39lt9~2 272.860NUL - .J~..a3 l,a28,aZ9 "- 533.9~ 54h676
11 PRE1.IMINARl. 21 GRAINS, POULTRY, AND PORIC WERE SUBJECT TO VARIABLE LEVIES BEGINNING ON JULY S(1, I1l6Z: RICE, ON SEPT. I, 1964.; AND BEEF AND DAIRY PRODUCTS, ON NOV. 1, 1964.. 3/ LARD FOR FOOD IS A VARl:ABLE-LEVY CmmOOITY. WHILE LARD FOR INDUSTRIAL USE IS BOUND IN THE GENERAL AGREEMENT ON TARIFFS AND TRADE (GATT) AT 3 PERCENT AD VALOREM. U.S. LARD IS FOR FOOD USE. 41 ALTHOUGH CANNED POULTRY AND PORK VARl:ETY MEATS ARE SUBJECT TO VARIABLE LEVIES, THESE CANNOT EXCEElJ TIffi AMOUNT OF IMPORT DUTIES BOUND IN GATT. 5/ VARIABLE LEVY ON SUGAR-ADDED CONTENT. 61 MAINLY CORN GLUTEN FEED AND MEAL, WHICH ARE NONVARIABtE-L.B[Y COMMODITIES! BUT MAy CONTAIN 51-fALL QUANT!TIES OF OTHER CORN PRODUCTS, -SUBJECT TO VARIABLE: LEVIES (SEE "EXPORT HIGHLIGHtS, ~rARCH I!l7U"}.

d
TABLE 40.__U.S. AGII'ICULT-URAL EXPORTSI QUANTITY AND VALuE BY C0M"40D ITY AND COUNTRy
- JULY-F~aRUAHY FEBRUARY-tQIIIMQDITY' .A!IID .COUNTRY tJNIT I QUANTITy VALUE QUANTITY VALUE13/74 74/15 1/ 7J17Jt 7Jt17rs 1/ I 1974 1975 1/ 1974 1975 1/1.000 OOL. 1,000 DOL. 1,00~ DOL~ 1,000 DOL.
CATTLE,. LIVE 'MNO 261 1-4t1 ll'J,7-36 .67,405CANADA 26 15 IJ,6~2 5.!>392el 79 -93,533 .30,228M£XICQ 22 10 11,033 3,06523 ·54 12,122 19.413 2: OS 1,1~1AR~TliHA 1.310a 1 sa! 2.58" aMORn,MP Q~ 0 2~1 lotio3 e 2.11:2 1~566 0, aUPSQUTH AfR I.CA 01 3 971 1t.~06 0 0 aOTH£R ° 321·3 8 10,47-4 8.809 1 0 1,2~6 717 Mlu( ~ .c:RE".~~DENSEilI(lR ('laflORATEO ,"LB e6 ..9911 e8.fllt5 5.539 6.917 4,132 4.545 879 1.,103"!JI~ a.,17Jt 25,694 4,939 6.000 3.740 4,013 797IAHMA5 950399 516 -99 1:63 23 66 7TRUST T£RR ~AC 15 20754 154 211GuINEA 252 33 pS La 46210 1Z3 37 IS4 169OTH£R 222 .!l 56857 959 zs. ~8 166 Ho ~6 32 MILK. fi(lNf'AT' PRy fIIL8 4,098 19,614 1,351 9,631 654·CAIUOA. 481 2ll e22:SFt 7-39 104 183 105 61 22MUlQO 201,01·3 al9 ·367 1:23 81 29JAMAICA 8 5100 4151 40 128 0 49 0 8UNITal J("~ 12 1,177 ,S' 568 6 3N£TH£RUIIIOS 0 a4 1,125 1 549 4FRANce ,... 0 1 040 2/12,599 Z/6~~73, FtfIUl'PIN(S 2 a 1. 0 ~ 169 232 1-86 189... HONG ~QHG 20 ~9 22239 .34 1.34 21 3 ,
""" J.PM 370 -93 a aI 87 22 6T 0 14OTtER a982: 3,);86 3l.3 1.679 197 343 100 168 L'AO AND 01lHE~ :R~R£O PIG ';'1 ~LB ?a.672 85,.595 15'.-410 ;22,607 13,830CAHAOA lI,!66 3.1~0 2,781-30654 20,921 7706 5.182 192 2,809 52IEXI.co T4128.351 34.610 S.703.UK 8,.669 3,949 4,461 'l1~Cl. It 01.11,811 h16, 445 -490 206 407HAITI ~l 211!-.-338 108 ,3211 40 590 150CClLONILl 22 811-4 4,718 .li2 1.211 20UNITmK~ 27 8 1536.-47'9 22,639 7.-903 5,827 8,688 3,813 1.827OTHEII 778,925 1,436 221 588 185 26 5, 11 'ULLfhI••EOltj:.£ "'LB 1.374,.578 1.540,309 :240,050 a83.!64 196,885 1-0.877MEXICO 3S,6~4 27.71+7a..067 40.627 2,988 8.633 383,CGloGMlA 9'248 10 Ittlos36.z.JS 40.Ctal
MAZl!> #>.~7 6;~4 1.,241 -4.098 23, SS986.147 32,520 16.146 6,552 22,966 5'.946UN ITa! JUNGDQM 4.6~6 83,31.303 71.140 5,.336 12.20, 6.115 14,221 1.117 Z.232tlETHDUHOS 151.3112 121,'903 26,066 19.·56. 7.860 5,51.1 It4~Z. 760raNt«. 32,037 17,986 ,S,2iS. 4.034 2,720lliiiMANY"'!!f 0 4!1 056,283 39,761 '90'9Q2 T-;in 10,434.,AIM 11,761 2.0!0 1,68751,21l 7CJ,647 8,162 1'2.423 2,239llA&.Y 10,388 413 Itl851tI.965 65.257 7,484 11,1'9& 8,560 6,2U 1.5$3 /!It4
CONThwED_
.., "

-~.----. .. <II'"
QUANTITY AND VALuE BY COMt400ITY AND COUNTRy--cxJNTIHUfDTABLE 4Q.-U.S.AGAICUI..TUfIIAI.. EXPORTS'
f£8AUARYJUI..Y-f~8RU~Y vAL«CQMMOUITY ANO COUNTRY 1JHIT • QUANTITY VAlUE au.NTU" . W7a 11 7JI1" 7"11'5 11 103/7-4 74/1'5 U l~" t9"f5 V 1914•1.000 ooL. 1.000 OOL. 1•••• (J~. 1.000 DOL-
IRAN a..Oal .9.710 S.l22 "9.~l1 2.637 2.200; ·5!3 259 a3.91'9 36.868 4.~ T,90( 0 0 0 0UiDIA
33,51l 3dSI .s,!!7 8,145 .:J,063 h5~1 511PAKISTAN C3.104t
13,371 ~,593 0PEOPLES REP ~F CHINA 31,2941 0 5.959 lllt4S3 1'53.333 20,595' '26.e.7° 16.055 18.969° 3,O!1 '2,5M
KOREA,REP of. JAPHf 210.117 183,209 33,421 ,35~.Ji5 28,169 t2,3.0 3,O!O 2.069 ALGERIA 31.,820 21,10' 6,519 4,~0' 0 6,614 0 900
4,221 2,21!1~YPT 106.872 154.781 1,,-31 I32B~1 21,835 t2f~~
291,6.- 392,351 52',190 73,005' "',156 !ll,1Tl 1,5;1 .,OWOTH£R
24,822 72,141, '33,71. 7,385 ..3,541 1t9!1 4,892BEEF AHO VEAL. EXCEPT O'F"ALS t4LB 5th 1.3
22,802 ',122; 24,030 10;991 2,00' hlOI 2,.!:, '2.065CANADA .- 63 17 UIBERttUOA ·535 183 '955 I ....' aAHAMAS 'h33' 4.360 5,893 5,512 !46 51. ...
ltOEfJ 999 1,369 1,339 1.. 153 m 203JAMAlCA h 114NETHERLANfJS _TILLES 7;a6 ~3 l,O?2. fl. ?1 123 ~ 360 ltOe. '913 21 60 16 124SVITZERLAHD .. 71
ttQNG KONG 462 .w.4 .... T41 47 10 JAPAN 22,9.0 3.07S 030,.16 4.208 3,065 311 3,~3 311
5,862' S.U7 ~"36 1 ..509 1.371 16. l,Z!2 h016OTHER
paRK, ExCEPT ~FF"ALS 'IL8 4S,763 84,J;3' 030,132 >61,436 2,.360 9.875 h:;! '1,231 22,860 49,329 l~,Ia4 036,173 916 7,l06 .!I,5M
CANAQA ....• '930; 1,643 - fl7i . 1.1:&8 ~7 212 a. 113 I.n; P.ANAMA;
,,3,187 3,211 2,n9 '2.,515 331 34i 21'. 21S• BAHMAS .. 1.1..09 19376 hOS9 1,10. 103 12=1NeTHERLAHDS~TILLES JAPAH '9~36 11,250 7rl35 14.150 118 611 113 413
1,212: 4!5 6eZOTHER '1.71f' .10.323 4.oJ 6.25 713
OFF.ALS. E-DI8L;, VARIETY MEAlS 'Il.a 182,731 218,~06 16,665 75i211 17.647 H"Tl l..u 9,955 7.083 It1l3 ~,369 ~05 822 i58 456 41
CA~ 24,.568 37,04Z 5.-a.. 8;211 -Z,la6 l,I'2 1~ 759
MEXICO PERU lr51" 1.065 !MIt l.a3' • 1,190 0 419
29.004 31,050 12,.9ill3 U~.(IIO 2,775 ·,i23 h~l 11314UHITtiOKrMGDOM H£THfRLAHDS 13,831 30,199 6,.517 10.~ 9!51 5,713 '-2 11611
17,396 5,165 6;17. 141 h91.9 ~". 616BELGloUM-UUX§"8OUAG 1"09 .(10,223 66,924 35,631 i!~;"3 -6,331 1O,Z!0 1,612 13,609
'ilANC£ 2,lft 101 11. 39GEAMMY VEsT 21.665 3.", 8.113 1;4611,905 2;150 240 514 1~ 262I.!RAEL .3.615 .3.906 .53-3.053 1..t2 2.1·52 226 433 2'tJAPAN 2,388 __ .1·35 h143 4!1 631OTHER 10,357 15,61' 5.043 900
10,3JA 9;36. 1.111 148 1,~ hI"B~EEDII«i CHICKS MNO 7.781 6,833 t,Oll 900 910 1.5 US i31 131 74
CANIIOA ,5~ 241 1,.302 1.f1! 60 14 I" ..
MEXICO 2,3ZZ 1.f18 531 314 33 9 '1VeNEZUELA ll1..BRAZIL 223 1-91 901 ~21 43 1-
QGt4TlNUEg;...
~'
'" ."
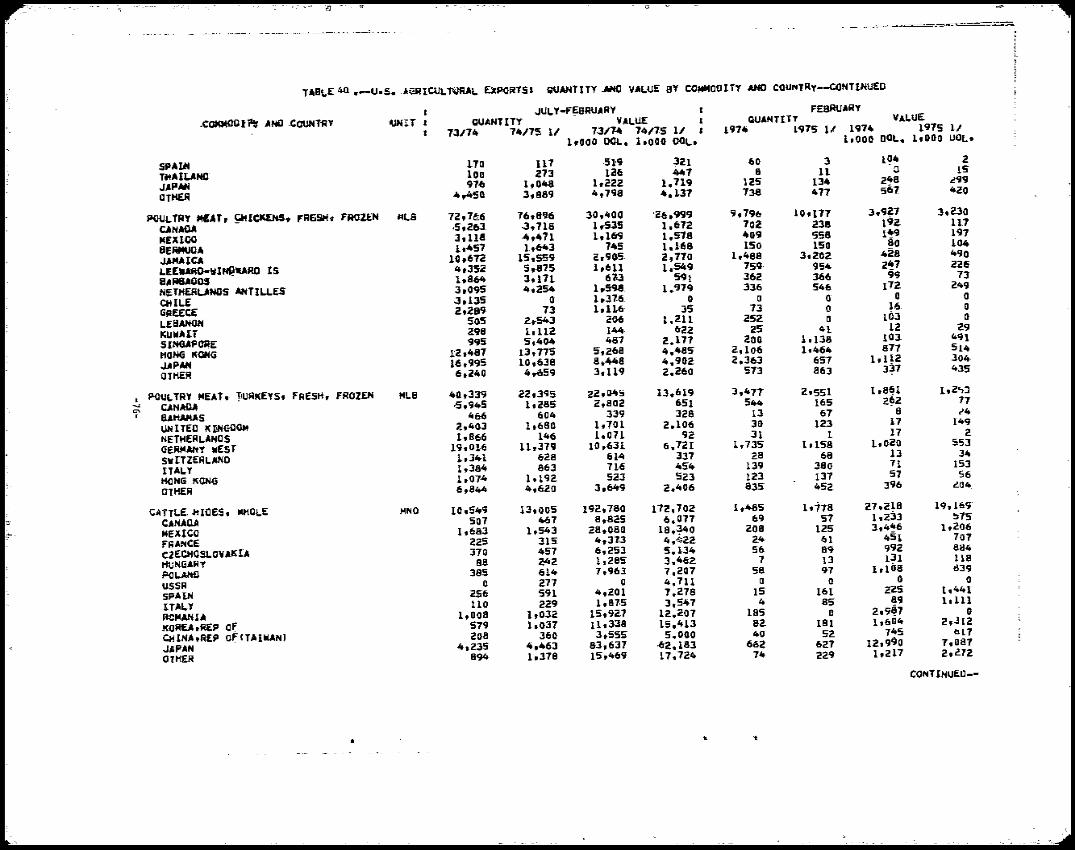
0' c
QUANTITY.AHO· VAl-OE BY COMMOOITY AM) courcTRy--CONTlNUEOYASl-£: 4U ..-0.5•.I!GRICULNRAL EXPQRTSI
.JUl-y-r;aROARY f FEBAtJARY QUANTITY VALUe:;cOMMOO l~. .ANil .CO\JNTiCl ~lT 1 QUANTITY VALUE I
1915 11I 7.J17- 7'+/75 1/ 7.J/llt 74/1S 1/ I 1914 1<J1S 11 1914 1,000 DOL. 1,000 UOL.1.000 1J(ll-. 1,000 ooL.
170 1I7 ·51'9 J2I 60 3 1~1t 2.5PAIII 0: 1S1M7 8 11ToHAIUNO 100 273 ra6
2lt8 ~997-6 1,048 1,222 1.119 12S 134JAPAH 4,450 3,889 4,798 4.U7 738 477 567 420
OTHER
~LB 7Z,7~ 76,896 30,400 'Z(21999 9,796 10,177 3,927 3,lJOPOULTRY IiCAT, 9il~NS~ FR6St19 FROZEN
,S,Z63. .l,718 1 .. 535 1.672 702 238 192 n7CANADA 1973,lla 4,471 1,169 1.'518 409 558 1~9MEXICO 8E~A 1,457 1..643 7ltS 1,168 1So 150 80 104
428 4902,,90S l.,;-770 1,488 3,202.JAMAICA 10,67Z IS,559 759 9S. zit7 226
LEEItAfiCl-IIIINJ.!IURO 15 1t,352. S.875 1.611 1.·549 99 7310864 3,171 613 591 362 366e"AUQas 1:72 2493,09S' 4,254 1.598 1.:979 336 S'46NETJiERLANOS AHnu..e:s
QlILE .J,13S 0 10-316 0 0 a 0 0 2,289 73 1.1.16 3S' 73 0 Hi a
GREECE lO3 0SOS 2,.543 206 1.21L 252 aLE8AP+QN. 41 12 29298 1,112 144 622 2SKUIllAIT 10l, 49199S' 5,404 487 2.U7 200 1.138SINGAPORE HONG KONG t2.487 1.3,775 S,268 4.48S 2,106 10464 817 514
16,995 10,638 8~448 4.902 2,363 6'51 1.H2 304 JAPAN
6,240 4,.oS9 3,U9 2,260 573 863 3~7 43S' OTHER
i'lL 8 40,.339 22,395 2Z,045 13,619 3,477 2.55[ 1.8~1 ItZ.,J" POULTRY MEAT. JiURI(EYS, FRESH, FROZEN
2,8Q2 544 165 2~Z 17.s .91t5' 1.285 65'1CANAil4" , 339 328 13 67 8 14'" BAHAMAS 1t66 604 17 1492.403 1.680 1.701 2.106 30 12.3~IT£QKl!HGlJOM 17 21.866 146 1.071 92 31 1NETHERLANDS
19.016 11.379 10,631 6.721 1,7315 1.1S8 1,020 553GERMANY .EST 13 34628 611t 337 28 68swITZERLAND 1.3"'1 ITALY 1.381t 863 716 4SIt 139 380 71 r,3
57 56523 123 137HONG KONG 1.074 1.192 sa3 6,844 4.620 3.6It9 2,lt06 835 4S2 396 <!.Olt.
OTHER
1,485 10778 27,Z!8 19,169CATTLE~I~e5. ~OLE MNO 10,SIto9 13,00S' 192,780 172,70Z
507 467 8,82S' 6.077 69 '51 1.233 ~75CANADA
1,683 1.543 28,080 18.~0 208 12S 3,4~6 1,206 ~. I4EXICO 24 61 45[ 7072215 315, 4,37.3 4,~22r"ANCE
370 ItS7 6,253 S,134 56 89 992 884ClEatOS1.0VAKIA 131 U888 24Z 1.28S 3.462 7 13HUNGARY
385 614 7.963 7,207 58 97 1,108 1139 POL.Al'tO
a 2.77 0 4,111 0 0 a 0USSR
C56 1591 4,201 1,Z78 IS 161 225 1.441SPAU4 4 85 89 1,111110 229 1.87·5 3,S41ITAL.\'
l.0.08 1,032 1S,9Z7 12.20.7' 185 0 2,9~7 0RO.WHA 1.604 2,.!{2579 1.037 11.338 IS.413 82 181J<OREA,REP O~ 71t5 bt1360 3,555 S'.OOO 40 S2 JAPAN 4,235 4,463 83,631 ·6'2.183 662 627 12,990 7,087CHINA,REP OFCTAIWANJ 208
1.217 2,c.7Z894 1,378 IS,46" 17.724 74 229OTHER
CONTINuEO-
,.,. '"

• •
"-....·I~J- ."; ~- ". <S"': '
f<'
lIJ:
TABLE 40.--U.S. AGRICULTURAL EXPORTS, QUANTITY AND VALUE BY COMMODITY AND COUNTRY--COHTINUED
J\Jf.Y-FEBRUARY FEBRUARY CQMMf)UUY ANOCOUNTRY ·UNIT I QUANTI.TY
73/74 74175 11 VALUE
13/14 14/75 11 I 1,000 DOL. 1,000 DOL.
QUANTIfY 1974 1975 l'
VALUE 1974 1915 U
1.000 OOL. 1,000 uOL.
CUTTO'h RAW El'~LUO""G LINTERS C..HAIlA FRANCE, GERHANY illEST s. ITZERLAfiD PORTUGAL HAL·Y A<lMANU SANGLADESli T.,AlI..AND INDOH£SIA PtlILIPPINES PEOPLES REP or CHINA ~OREA,REP at HONG KONG CHINA,REP OflTAIWANI JAPAN OTHER
MABA 3,235 1.75 43 14 55
6 65 105
9 137 89
132 346 41t9 154 392 774 290
2,344 125 48 40 49 ·39 65 38 65 62 48 66
168 353 ·58
1·30 626 363
.663~19 42,991 8,733
16,968 11.1511
1,780 15,317 19,267 3,969
23.915 33,434 22,786 69,651 80,049 32,089 62.169
146.231 n.3J.3
656,719 >31.836 15.a3B 12,445 15.011 13,378 20,286 10,680 19,178 16.UO 16,449 19,141 46,932
101,646 14.138
'28,202 166,160 109,550
598 17 9 8 8 1
16 31 a
12 7
11 63 61 46 52
119 72.
380 IT
7 It 4
10 11 12 26
8 7 6
35 80
°2S 61 62
144,980 4,671! 2,038 h817 1,686
211 4,6?3
16,080 0
2,512 2,7~9 2,558
13,6?S 13,258 10.706 10.2!] 31.0?8 21.057
100,376 4,Ol3 1,950
995 1,351 ],165 2,912 3,250 4,989 10741 2,2.77 lt991t
11,017 20,156
38 4,638
18.147 17.125
(7
f, ;:
I ~... I
FHUIT COCKTAIL, CANNED CANADA PANAMA s_EDEN NORWAY F'lNLANO UN nEO' I(~GDOM NETHERLANDS BELGI~M-UU~EM8OURG GERMANY IllEST S.ITZERLANO .JAPAN OTHER
"LB 80.51t9 2.4,306
1.980 4,6""" 1.535 2,382 .6.837 7,597 4.181 1,206 6.069 4,561 '9,253
53,782 28,810
881 2,499 1,144
581 3.081
198 3.361
961 4,359
615 6,692
18,829 5,TZO
1t84 919 JIll 528
1,724 1,693 I,09lt 1.658 1,352 1.058 2.198
15,291 8.137
213 729 329 135 8.1t9 212
1,051 216
1.241 185
1 • .g81
11,250 3,001
102 1.020
334 "55 831 351 855 866 800
1,592 1,036
8,080 3,324
48 87
334 74
422 494 811
25 10360
46 996
2.6~1 716
32 2i5 15
102 2lg
87 233 219 2i4 342 2~7
2,.l41 917
16 25 91 13
133 121 e97
9 404
13 c97
I~.
PUCHES 9 CIiH~U CANIrilA BRAZIL SliEo5N UHITEO KJlNGUQIi! NET~LANOS BELGIUM-UU~~8OURO GERHMY WE"ST IlUSTRlA SliITZEALAfiO JAPAN OTHER
"LB 104,755 ,33,571
2,52,4 5.6!:i4 4.132 5,838 4,111
22,201 4,101 5,097 6,897
10,622
12.060 44,060
2 2,413
101 1.136 3,698 4,9<;19 2,618 5.210
722 6,500
19,732 6,248
49Z 1.152
791 1,201
851 3,859
128 "998
1,.330 2.070
17.580 10,487
1 708 '26
409 1.002 1,133
.63S 1.270
219 1.689
9,097 3,243
o. 1,351
207 2lts 439
1,006 231 121 653
1.592
1.185 4.221
2 19 18
103 876 244 463 872
1 965
1,8~1 641
0 295 42 53 93
209 ltO 26 99 3~9
lttlO8 d93
1 7 5
25 240 53
113 221
1 c49
PHtmES. DRIED CANADA
"Le 95,913 1,444
55,837 6,357
37,400 2,903
21.532 2."1
10,256 596
4,120 947
3,6~i 254
1,644 .J88
CONTlNUEO-
'"
..l.,', -' ...:,
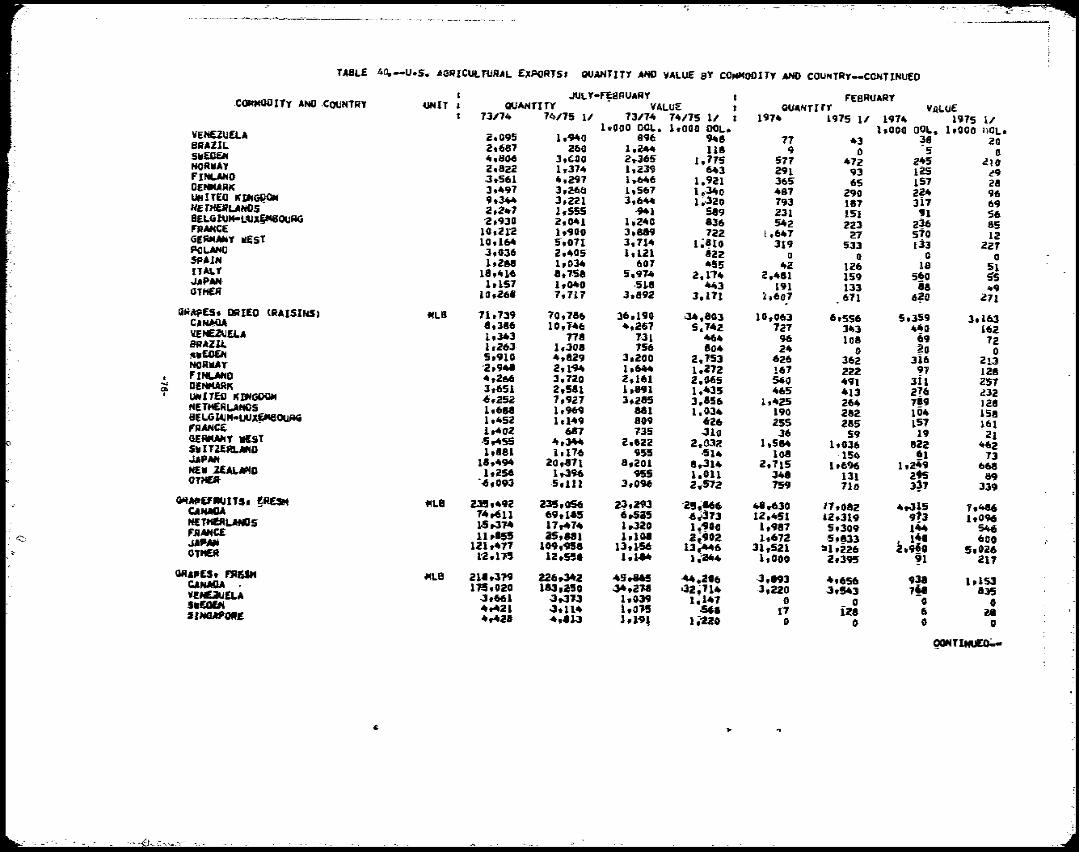
'{- '-a ;~. ,.,..•.•, ..,~~__• 0- ~"'-.......~~.~"-"""-~. _.~~~" __"~" .___ -.. .......~~~.M~_~~. ~.
TABLE 4o..-U.S.. AGfHCULTtJRAL ElCPORTS. OU~nTY AND YALUE BY (OHHoo11Y AHO COUNTRY--CONTlNUEO
JtJI.Y-f~SRUARY fEBRUARYCor.MOOl Ty ANO .COUNTRY UNIT, QU~nT'( VALUE QUjV4rrrr VALUE 73114 74/75 II 7311.1t 74/75 11 , 1974 1975 l' 1974 1975 11
IwOOO OOL. 1,000 DOL. l,OOQ DOL. I,QOO 1)0LoVENEZUElA 2.095 1.-940 896 ~8 17 43 ~8 20BJlAZIL 2.fi87 260 1,~ 118 9 0 5 0SlffOElf 1t,806 3,"0 2,365 1. 775 577 472 245 ~lONORWAY 2,822 1~314 1.239 6<\3 291 93 125 ~FINUNO ,3,561 4.297 1.,6It6 1.921 365 65 157 28DENMARK' 3,497 3.26€i1 1,567 1.·340 487 290 224 96UflITEO KJjfj~ 9,Jit.4 3,221 3,6" 1 ;.320 793 187 3i7 69HETH£iU.AHOs 2,z-.7 -9411~55S 5e9 231 151 91 56B£LG~"'L"'"~OUAG :2-,930 2,0<'1 1,240 836 542 236223 85fFiANCE 10,21:2 lt~OO 3,889 722 l,647 27 510 12GERMJINY ~st 10.164 5.011 l,n-4 1;'10 319 533 Ij3 ZZfPaLAHD -3.036 2,405 1,121 82l. 0 0 0 0sPAlH 1,288 1,034 607 4!i5 42 126 18 51IT"'-Y 18,41>6 ~,'f.S8 5,97.1t Z,4812.174 159 5~0 55JAPAN 1,151 1,0<'0 .5U1 443 191 133 88 .. 9 OTH£R 10,26' 7,717 3,892 J,171 ~.607 671 6~O Z71
G"MlES, DAlEO (AAISINS, tiLe 71.739 70,786 36,190 034,803 10,063 6,556 5,359 3,163c~~ a,386 10,1-46 4.267 5.742- 727 301)3 4~0 162-VENElijElA hJ43 718 131 464 % 108 69 72HAZU. hZ63 1.308 156 804 24~1Ii~ 5,~10 4,l!i9 3.200 2.153 626 362 316 213NOR~Y-
0 ao ° '2,941 2,1'94 1,60\4 I,Z12 167 222- 97 128 I. fl ........ 0 4,266 3.120 i.16l.... 2"."5 540 491 3i1 ZStDENMARK 3.651 2,581 l.a91 l~435 465 413 216 232I '" &.181 TEO K~GOOM -6,252 1,921 3,z85 3,856 1,42.5 264 7~9 128HUHEfiLANIlS 1.68. 1,969 881 1,034 190 282- 104 158BELG~"·UU~OUAG 1,452- 1,149 a09 626 255 285 157 HilFRANCE 1.402 687 135 ,Jl0 36 59 19 21GfAIWIY MUt ·5.455 4,344 2,622 2.032 1,584 1,036 82Z 462.SlIilTZ£RLMO 1,181 i.176 955 <514 l~ 1!it) ~l 73.uPM 18,494 20t871 8,201 8,314 2,715 1,696 1,2,!9 668H£" UAl.1IIL'IO 1,256 1,.-396 955 1,OU 34' 295131 89OlHP:' "-6,093 5 ..111 3..096 2,.5'72 759 710 3~1 339
CiAMlEf'INITS. ~R£SH ... LB 2l!h492 23S,05(t 2~,Zi'3 '2!;~6 ".,630 17 ,082- 4,.115 7.486CAHIIOA 1.,.611 69,1-15 6,.5i5 -6~313 12.451 12.319 913 lt096H£TtCfiLMllS 1-5.314 17..-7" 1,.J20 1,"0 1,981 5,309 144 ~FRM4C£ u,l55 25,881 1.101 2(-902.uti,.,. 1.672 -5,833 2 141 600121,471 lQ9t'9!i8 13.1-56 13....6 31,521 111,226 ,~o 5.026OT~ 1'2,1115 12,551 1.1-Ilt 1iait4 1,000 2.395 !1 2n ORaflES, fRESH ~L0 21-',319 Uh~2 4!ir&e -44,2'6 ·3,893 4,656 938 ltl53CANMlA 175.020 1~,250 .34,2}8 tl2;1l4 3,220 3,543 1!1 835VENDU£LA -3,661 ,J,.-3JJ 1.039 1~147 0 s.~ 04"-21 -3.114 1.OJ5 .56, 17 fi128 l8.,NGAfJOR£ "'''-2' 1.1..! 1 ;"220 0
° 0
° 0 0-4,.»
9GHT~
.,~ ..
~.--:",",":,..:
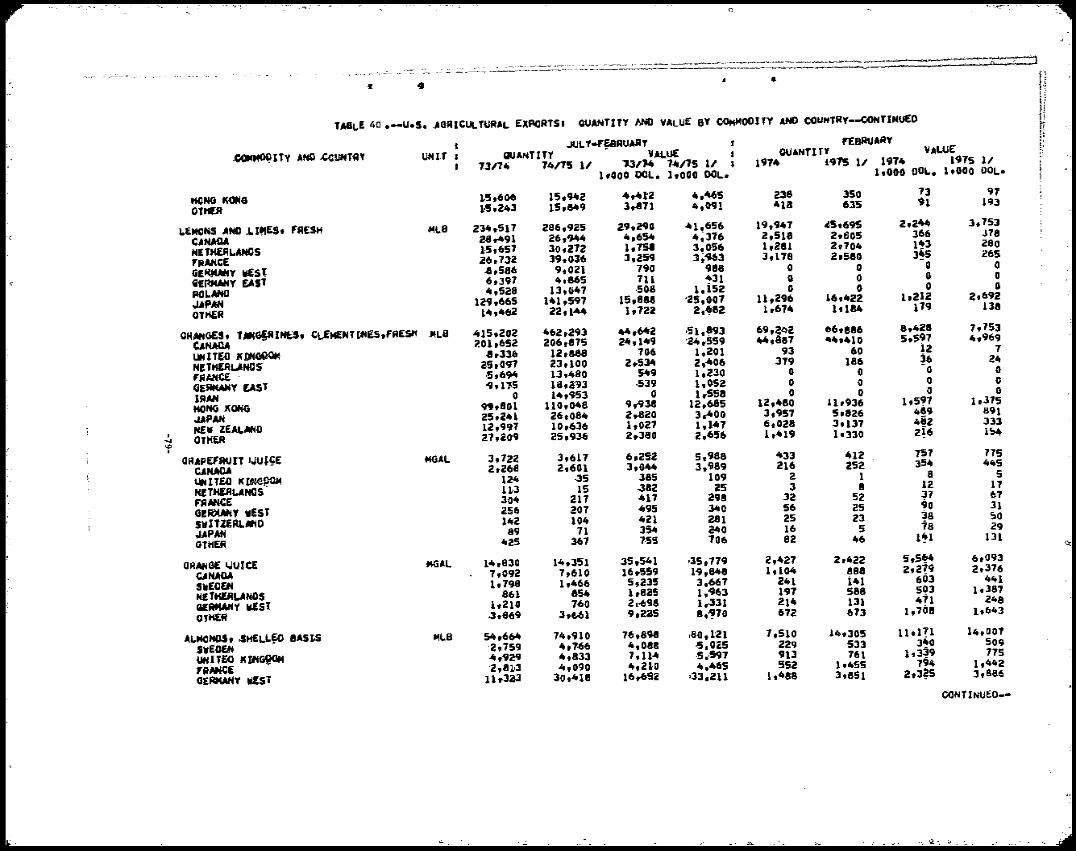
" ~.--.:.....~ ....
.. •!I • 1'1 Ijb
QUANTITY ~ V~LU£ BY COMMODIfY AND ODUNTRy--coNTINuEOTAll.E 40 .-U.S•.AOIUClILTtlRAL EX~RTSI UitFEBRUARYJULY"~AUARY I'
VAl.uE 1 t;QUANTITY VALUE N ~MOqlTY AND .CoUHTftY \mIT 1 QUANTITY 1914 1915 11
1.317i4 14/15 1/ -'3/M 1.tt115 11 I 1914 1915 1/ 1.000 DOL. 1.000 DOL.1,000 OGL. 1,000 DOL.
13 91 1.~,606 15.942 .tt,.ttt2 4,465 238 350
HONG KONG 91 193 OTHP 1·5,243 Hi,8It9 3.a1l 4,091 418 635
2.244 3,153LEMO", AND LI~ES. FRESH ""LB 2'34,.511 286,925 29,290 .ttl ,656 19,941 45,695
366 ..118'.-; 4,6S1t 4~316 2,518 2,605C.NAOA 2~"'91 26,944 280)..5,657 30,212 1,758 3;056 1,281 2.704 1~3H£TttiAl.ANOS 265J.178 2,580 l~526,732 39,036 3,259 l~'963"RANCE 0 0.8,586 9,021 190 -988 0 0G£HMMfy WIST
6,391 4,365 111 ~31 0 0 0
0 aiERMANY EAST
PeLMel 4,528 13,G41 ·508 1.152 ° 0 0 1,212 2,692
.lJP~ 129,665 141,591 15,888 '25,001 11,296 16,422 138
OT~ 14,462 22,1.tt4 1,722 2.~82 1,674 1.184 179
462,293 44,6.ttii! ,51.893 69,a~2 f:l6,886 8,428 1,153ORMGES, U"GPI~S, CLfMfNTlIIES,fRESH J4LB 415.202
1.0h65ii! 206,875 24,1'119 ~24.559 4/t,ael "'4.410 5.5~1 4,969 12 1CA~
~.336 l2,eN 706 1.201 93 60lIHnE{lK~ 25,091 23.100 2,.S34I 2,.tt06 319 186 ~6
0 24
0NET~UNOS .5,694 13,480 549 1.230 0 afAANCE 0 0
GEAMMIY EAST -9,115 18,~13 .539 1,052 0 0 0 014,953 0 1.558 0 0IANt 0 1,S?1 1.315
HONG KONG 99,801 110,048 9,-938 12.685 12,480 11,936 489 891
JAPAH 4i, 33325,241 26,084 2,.820 3.-400 3.951 5,826 12,997 10,636 1.027 1.• 141 6,028 3.131N£W ZEAL;llNO
I 21.ii!09 25.936 2,.380 2.656 1.419 h330 2~6 l~ ... OTHER '" 757 715I
GRAPEf'aun JJUI~E MGAL 3.122 3.617 6.252 5.988 433 412 354 /t45
CA~ 2.268 2.601 3,0ItIt 3,989 216 252 8 5385 109 2- 1UNITal Km6~~ 124 ·35 12 11U3 15 ·382 25 3 8NETHEIlUNOS 37 6732 52304 217 ~17 298FaAHC£
256 207 .1,95 litO 56 25 90 31 G!~Y wesT 38 50142 104 It21 2.81 25 23swITZERUHD 78 2989 71 354 240 16 5JAPAH 106 82 46 1,1 131425 367 155OTHER '"
14.830 14.351 35,.541 .35.119 2.421 ,.422 5~5~ 6,093ORANGe !JUICE MGAL
7.092 7,610 16,.559 1-9,84t8 1.104 888 2,219 2,376CANADA 603 4/t1lt798 1.466 5,235 3.667 241 1415"E004 503 1,387861 854 l,S25 1,%3 191 588NfTtWlUNOS 411 2481.210 7-60 2v698 1 .. 331 214 131GlAMANY west 1.708 !t643.3.869 3,f,61 9,225 8t"nO 672 673OltlEft
54,664 74,910 16,898 .80,1'21 7.510 14.305 n.P'1 14.001 ~I.MOH05f .sHELL~ BASts "La 340 5094,088 229 533S\!lEO~ '2,159 4,1-66 -5.025
~,.929 4,833 7.11.tt ,!i~·591 911 161 1,3~9 715UH ITEOK I*I~ FAAHCE '2 ,8 !J3 4,090 4.21-0 4,465 552 1.455 794 1,442
GERMANY "'sT 11,.J2l 30.418 16,.652 '33,211 1,488 3.851 2,3?5 3.886
CONTINUED.
'1{
S',.~ .. '~'." .... " .

TABLE 40.-U.S. AGAICIJIrTURAL- EXPORTS. QUANTITY AND VALUE BY OO""ODITY ~ COUNTRY--ogNTINUEO Q'
JtJLy-,~eAUARY 'EBAUAAY .COMMODITY .ANQ .COUNTRY 'UNIT • QUANTITY VALUE QUANTITY VAIJUE
13,/74 7,./75 11 7317.1t 7.1t/75 1/ I In4 '975 11 1974 1975 11 1.000 DOL. 1.000 DOL. 1.000 D~. 1,100 UOL.
~
-S"lTlERL.,O 1,314 3,547 Z,11@ 4,088 400 72. 6~ 803 USSR 1,100 5.199 1.672 5.897 0 2,61.) 0 2.593 JAPAN 17,01'3 4,370 22,550 3~964 2.139 2p011 3,1~1 1,630 OTH~ 1-3,352 11,088 18,.1t.1tl 17.874 1,7$8 2,293 2~~ 2,310
.ALHUf.S, ~OT ·6.HELL£O a~SIS tlLB .lt6,10l 51 ,.It15 21,553 '20.415 848 :h655 3~ 1,361CANADA 3.609 6,928 iMO 2 • .ltl1 6't ns i9 1'; 8RAZIL 3,567 .It ,823 1,703 1.7.68 30 ~.O Ii 0 GERMANY VEST 15.364 17,194 1,720 ~.O~.i1 0 22(; '0 CJ4 SPAUI .s,aa7 9,806 2,.4126 3,S74 0 -992 0 376 iTALY 871 3,967 460 1 ..313 0 636 0 236 OTHER 17t.ltoo 1"',698 7,384 5~295 154 1,521 3!3 S8Z
F~EO 6RAliNS MMT 23,850 23,331 Z_e9G,OlO 3,~91.188 ·J.22~ 3,722 .367.-50 ·533,977 MU1CO 731 1,.341 13,265 206,!15 74 229 I.~ 36,a52 UH ITEO I( ~GIlOM 916 609 106,41.1t 086.193 12 62 t.o!' 1.921 NETHERLAHOS 2,450 3,"'08 !232,353 ,"3~023 210 630 23,363 16.104 GERMANY VEST 2,3H 2,125 :254,235 346.239 ~16 393 .39,110 65.954 USSR <3,097 338 177,037 101~!53 271 165 15,.4102 24,415 SP~l~ 1,"'23 1,"28 160,012 1-97;684 22a "69 '21.814 64.543 PORTUGAL 304 614 34,188 .a9.104 21 41 2,.06 ·5.18.2 ITALY loS58 1,529 193rf110 209,461 169 .lt24 '2291~!:i 56,1"7GREECE 716 310 83.71'2 .lt5,~74 19 .3 9,0!1 12,418
0>• AOMAHU lit 539 2,~1.2 76 ••92 23 3,429 ? ISRAEL ItS6 6'tl .lt8,651 79,089 61° 94 5,962° 1(1,571
PEOPLES REP Of CHINA lt360 '23 144,641 2,-590 165 Uh2i, 0-KOREA,REP OE 544 506 11,~ .80,410 1'" 56 ° 20,211 8,658JAPAH 7,103 5,192 '154,UI2 119,,?07 974 78J211SUI 115'1:UHDHTfO CTRY-CAN 1/5 h440 831 152,67.8 11".406 1 139 OTHER 4,01-5 3,399 1399,6~ 411.<991 421 ° 533 1t9,2~' 71,096
BARLEy MMT 1,429 651 156,459 109~431 125 15 11,135 12.8'65 MEXICO 1'9 101 7,788 21.016 16 18 1.8~ 3,606COL0t4SlA 51 26 6,9s.. 0 0" ..932GERMANY VEsT lOS 2 9,683 1.a4 ° 0 ° 0 0 PClLAtiO 86 '20 Srfl1'9 2,269 0 0 ° 0 0 ITALY 80 18 7,059 2.436 0, 18 2,436GREECE 100 0 10 ..956 0 0 0 0° AOMAHIA lit ·30 2,612 "'.132 ° I) 0 ,eyPAUS 610 ~,J1W9 0 ° () 0 0 , IRAIt 12 65 1,289 1O.J.ll 0 0 0 KOREA .AlP Of 2l1t 2418 <31,182 ~1 • .a7S 102° 36 1"""OS 6,243
° CHINA,REP O~(TAIVAN' 16 0 7,068 0 0 0 0JAPAN 31t 84 4,285 12~l3'" 1 °2 1,.ItS8 "23UNDNTfO CTRY~CAN TIS 4!'iJ ,s8 49,097 8,,~52 J ¥t 13! OTHER 34 0 2..863 116 0 0 0 21 °
,c CORH. EXCEPT .~EED ."MT 22,617 18,l88 211269,'24)3 2,617,260 2,461 .3,101 'ill ..!O ..t\It8,S91 CANADA It1.8 ~ .ltl ..S'S .s9~901 44· 31 ",5!" 4f141
~TINUfo;...
II "'
>~ "",J:~ ~
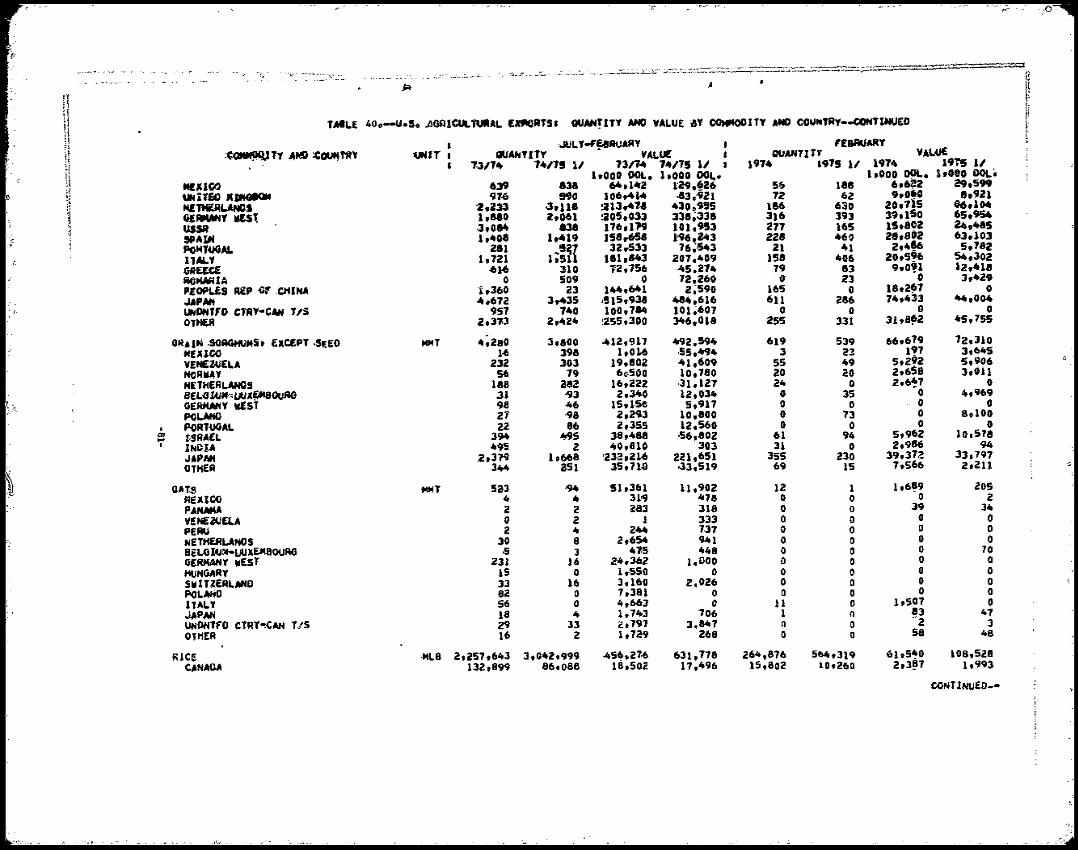
11
n . ·-c "
AJ;:I
TAiLE 40 ..-U.lo JlOOlCULfUIIIAL EXfIOATSI QUAN!ITY AND VALUE aY COMMODITY AND COUNTRY--ooNT~EDr h I ·.JULY""~AUAAY FEBRUARY i! VALAJE:~C»IM9I!ITY A~ :C~",Y ~(T I QUANTITY VAL(If GtiANTIT1' tj 7-311. 14/15 11 13/J1t 14115 11 I 1914 1915 11 1914 1915 11 • 1.000 DOL. 1,000 oo~. 1,000 DOL. IwOOO DOL.It MlXICQ 639 818 64,1"'2 r29,~26 s!. 188 6.6?2 29,599'f uti iTS IUINGI<IM "",1.6 MO 106,4J.1t .83..921 12 62 9,060 Ih921
NlTHEALAN05 '2,233 .;s,U' :213","'8 430.955 186 630 20.1i5 S6,lo.Ul G£RMANY dST. 1,8'0 2,061 :a05,033 338;338 316 393 39.150 65.954
USSR .3,084 818 176,IH 101,953 217 145 15,8~2 24,"5 ~ IPA~ 1,408 1t419 158.658 1'96,243 228 46f 28,802 63,103if :t POMT4JGAL 281 32,.533 16;·543 21 41 2,416 5,782l;iUI1ALY 1,721 181,843 207.409 158 4;06 20,S" 54,302
GAUCE -61-6 :no 1'2,156 45.274 79 83 9.0,1 12,418 AOMiliHA 0 509 0 12 .. 260 it 23 0 3 ••29 P.EOfILES REP ~1 .CHl~ i~360 23 144,641 2~590 165 0 18.2!17 0 JAPAII -4,672 3,435 ·!115,918 484,616 611 286 74,433 ltIt,oo.
0~OHT'D efR~CAH Tli 951 7-40 100,714 101~607 0 45,755OTHER 2,3'Jl 2.424 :255,300 Jlt6,018 2SS 331° 31tB~2 °
OMAIN .SOAGHUM$, EXCEPT ,SEED 14MT 4,280 3,800 -'112,917 ~2.594 619 539 66.6?9 720310 1,0106 ,S5,~1t 3 21 1,7 3.645HEUCO 106 398 o .
VENE~ELA 232 303 19,802 -'11,609 55 49 5.292 5,906 HOA~Y 56 79 6,,500 10,780 20 20 2,658 3.011
2,6~7H£THERLANOS 188 28a 16,222 ·31.127 24 BEL4~"~UUX~0UR0 31 -93 2,340 12,034 0 35° 0 4,969° GERMANY dsT 98 -46 15,1·5ti 5,917 0 0 ()
POLAHD 21 '98 2,2t,J3 10,800 0 73° 0 8,100 PORTUGAl. 22 86 2,355 12,560 0 0 0
t» I 5,962 10,518... f.SRAEL 394 ~5 38,488 ·56,802 61 94 ° I lI'..OlA 495 2 40,810 303 31 0 2,986 94
J.PAH .2,319 1,668 ~232,2106 221,651 355 230 39,372 33,797 35,71.0 .33,519 69 15 7,566 2,211OTHER 344 a51 «.
GAlS sa3 -94 51,361 11.902 12 1 1,6~9 lOS""TNEXICO 31'9 478 0 0 2
39 34P.ANM4A "2 "2 233 318 0 ° 0 VI!NE2lYEU () 2 1 333 0 0 0 0 PERU 2 4 244 7.37 0 0 0 0 NETHEIlLANOS 30 8 2,654 941 0 0 0 0 B£LOWD4-UUX~BOUAG .5 3 47.5 448 0 0 10 GERMANY VESt 231 16 24,362 I.QOO 0 ° 0 0
HUNGARY 15 0 I ..S50 0 0 0 0 ° 0 5vITlEALAND 33 16 3.160 2.026 0 0 0 POL~ 82 0 7,381 0 ° 0 0 ITALY 56 4,663 0 11 ° 0 !tS07° JAPAN 18 It ° 1,743 706 1 0 !3 47 ° UHDHTFD CTRY~CAN T/5 29 33 2,797 3.141 0 0 2 3 OTHEA 106 2 1,7a9 268 0 0 58 48
RICE ·MlS 2,257,643 3,042.999 456.2706 631.778 264,876 5&4,319 ~h5'0 108,528 C.NAllA 13~,899 86,088 18,SQ2 17.496 15,802 10,260 2,3!l7 1,993
CONTINUEO:'·
"'.,,,- <lr.:.r .•i;:~ "' .
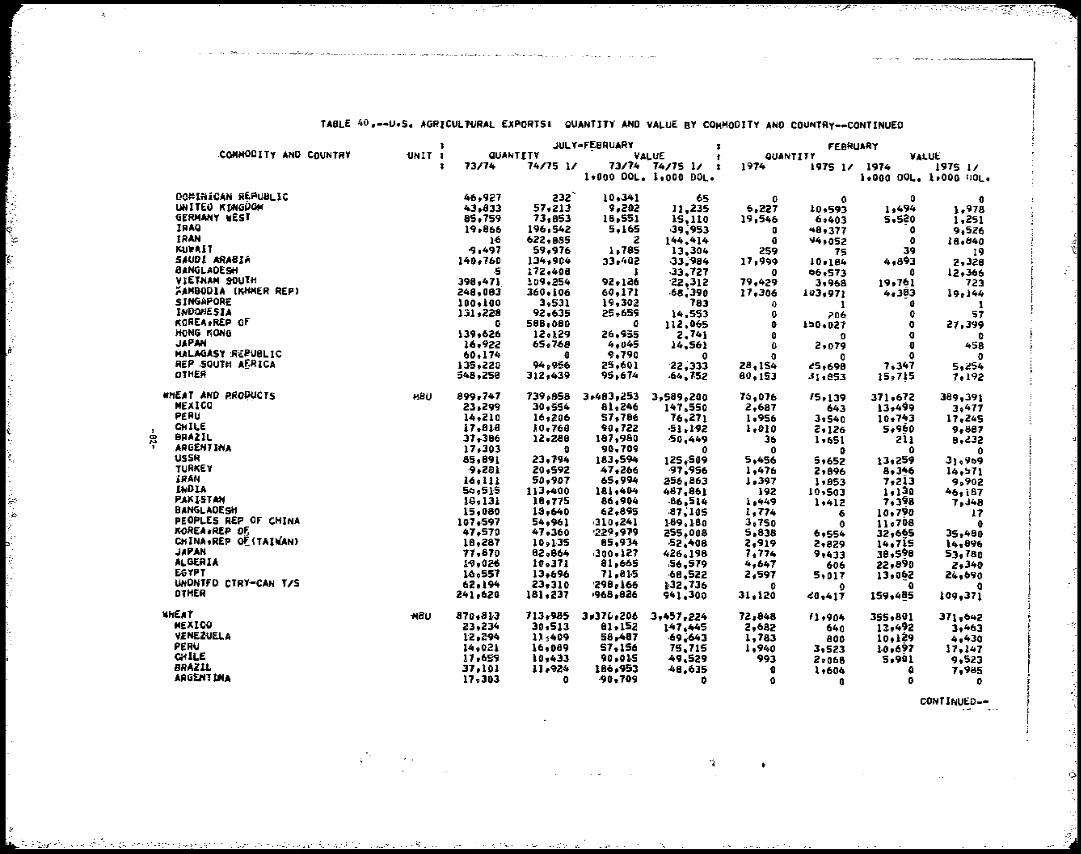
'-, ''''''r ~~- F'C --:"""'t-h~F",>'";.;
\\
_..,.,...•- -~~-.--.,~.j;,'--.-,. - .--' ,,,--~-~.' - '"""--
TABLE 40.--U.S. AGRICUL1URAL EXPORTS. QUANTITY' AND VALUE BY COMMODlTY AND COUNTRY--CONTINUED
JULY-f~BAUARY fEBRUARY ,COI4HOD lTY AND COUNTRY 'UNIT I QUANTITY VALUE f QUANTITY VALUE
73174 74175 11 13/74 1~/75 11 I 1974 1975 11 1974 1975 1/1,000 DOL. 1,000 DOlo 1,000 DOL. 1,000 IlOl.
OO~I~iCAN R~AuaLIC 46,927 232~ 10,341 65 0 0 0 0UN ITEU KUoIGPOf( ~,833 57,213 9,202 11.235 6,227 10.593 lt494 1.918GERMANy illEST 85,759 13,853 18,551 15,110 19,546 6.403 5,5~0 },251IRAQ 1~,B66 196.542 5,165 ,39;953 0 "8,317 0 9,526IRAN 1,6 622.885 2 144,414 <14,052 18,840 "($
f
.~KUlPUT 09,491 59,916 1,185 13.304 259° 15 39° 19SAUD! ARABIA 140,160 134,904 33,402 ,33~~84 11,999 10.184 4,893 2,328BANGLADESH ·5 112,408 1 ,33.121 0 06,513 0 12,366I/IETt4AM 90Ulti 398,411. 109.254 92,126 '22.312 19,429 3.968 19,7(11 123 ~~M90DIA (KHMER REP) 248,083 360.106 60,171 ,68;390 17.306 1U3,971 4 • .3~3 19,144SJNGflPORE 100,100 3.531 19,302 783 0 1 0 1 IHD~ESU 13}.228 92,635 25,659 14,553 0 706 0 57KOREA,REP Of 0 588,080 0 112.065 0 hO.02? 0 21,399HONG /'lONG 139,626 12,129 26.9S5 2.741 0 0 0 0JAPAN 1.4;'922 65,7.68 4,045 14,561 0 2,079 458 MALAGASY :R~~U8LIC 60.174 9,790 0 °0 REP ,SOUTH A~RICA 135,220 94,956° 25,601 '22;333° 28.154 ° c!5,698 7,347 5.254° OltiER 548.258 312.439 95.614 .64.7.52 80.153 .l1,853 15,7J5 7.192
WHEAT AND P.RO~CTS MBU 899,747 139,558 3.483,253 3,589,200 7~,016 15.139 371 ,6?2 389,391 MEXlCO 23,299 30,554 81,246 147,550 2,687 643 13,499 3,417PERU 14,210 16,206 57,786 76.271 1,956 3,540 10.1~3 17.245
I CHILE 17,81·8 AO,768 90,722 ,51.1-92 1,010 2.126 5.9~0 9,ij87 CD 8RAZIL 37,,386 12.Z88 187,980 ,50.449 36 1,651 211 8,232 !'" ARGENTJ!HA l7,303 90.709 0 0 0 0 0
USS~ 85.891 23,'94° 183,594 125,·509 5,456 5,652 13,259 31.909 I
TURKEY 9,2S1 20,592 47.266 '97~~56 1,416 2.896 8,3~6 14,!J71 I I!RAN l~,ll1 50,907 65,994 256.863 1,397 1,853 7,213 9,902 I
IHOlA ~05j:5 113~00 181,401t 481.861 192 10.503 lell0 46. i81PAKI,STAN 1.G .131 18,775 86.904 ,86,514 1.449 1.412 7,3~8 1.J48 I BANGLAOEstf 15,080 15,640 62,895 ,87;105 1,174 6 10,7~0 17PEOPLES REP OF CHINA 107,597 54,961 1310,241 1,89.180 3.150 0 11.108 IIroREA ,RfP Of; "7,570 47.360 '229,91'9 i!55,008 5,838 6.554 32,6~5 35,480 ° f CHINA,REP OfUAlVAN) 18,281 10.1-35 65,934 .52;408 2,919 2,829 14,715 14,896 IJAPAN 77,870 820864 1300.127 426 0 198 7.714 9,433 38,5~8 53,180 IALGERIA 1'9,026 100371 81,665 ,56,579 4,647 606 22,890 2,340 I EGYPT 1-60557 13,696 71,81,5 ,68,522 2,597 5.017 13,0~2 2/.,«:'90UNONTfO CTRY·CAN TIS 62.194 23,310 '298,166 1132.1.36 0 ° 0 °
I IOTHER 241,620 181,231 1968,826 941.300 31.120 c!0,411 159t4!5 109,371 I t
WHEH -MBU 810,81<3 11·3,'985 3111370,206 3,.,.51,224 12,848 I}.904 355,801 371,642 I MEXI00 23,234 30,513 81.152 1-47.445 2,682 640 ll,4~2 ],463 I
i ':"1
V£NUUEl.A 1'2,294 58~87 ,69~.6431"~409 1,783 800 10,l?9 4,430 bPERU 14,021 16,089 51,156 15,715 1,940 3,523 1.(J,6?1 17,147 ~ OIilLf 17,6Sc;J 10,433 90,0105 ~9.529 993 2.068 5,901 9,523BRAZI&. 37,101 11,924 186,953 48~635 0 1,604 0 1,985 J
I fARGEnlliNA 11,303 0 ·90,709 0 I° ° ° °
CONTINUED.
.. ':l
,,:",,~~.r ... ', , ....~ .-: '~J...<:_., ". ;!J. ~. •.....,;(1' ".;51.:: ..
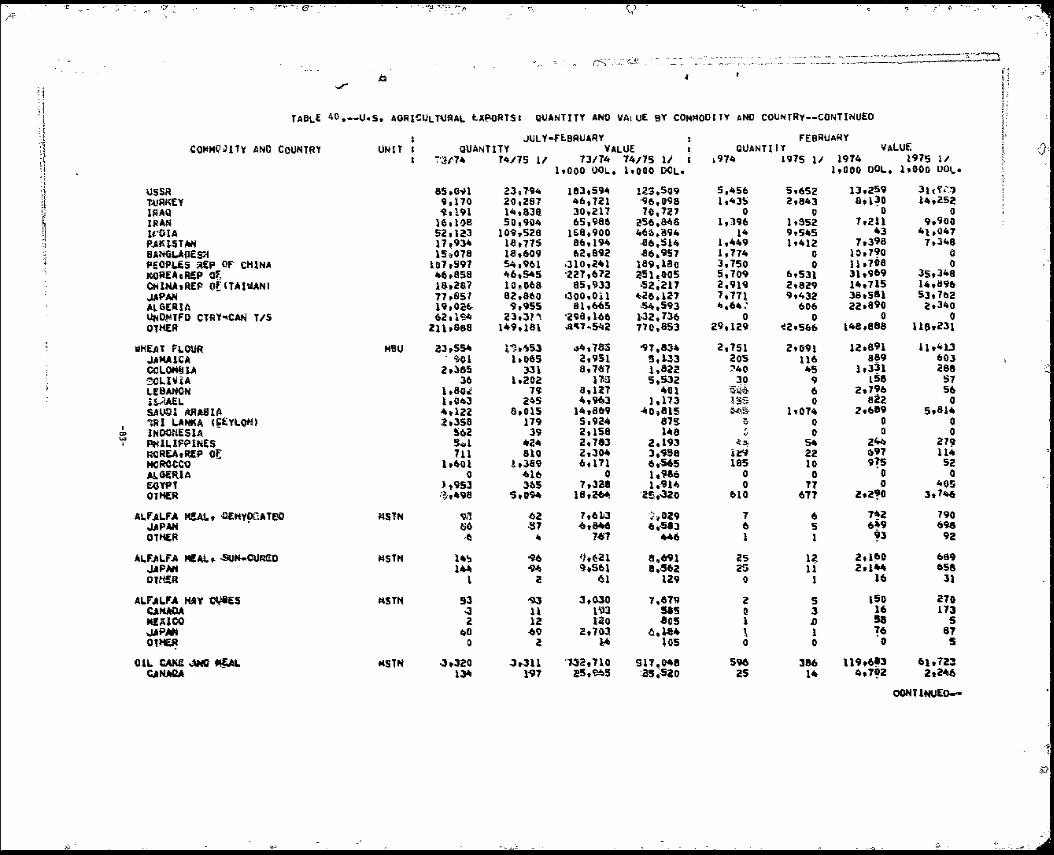
~.;t ~'0 '1 "-r;" 7~~C,'" ff}' .~;'~ ~:~ ~~~~ tr t\ '\,,> "'>Ji-; <"\ 0
n
r,:;:'l~-", ,_. ,,~.' '" "_'n"__.,__ ''''_'"~''~~_ ~_ ~.___ '~"'~""'""',,' , b ~
..r t! TABLE 40. __U.S. AGRI~ULT~AAL lXPORTSI QUANTITY AND VAlUE 9Y COMMODITY ANO COUNTRy--CONTINUED Ii
,4> JULY-ft.BRUARY fE8RUAHY It 11 ,CQI4H~ j) lTY ANO CoUNTRY UNIT QUANTITY VALUE QUANTIfY IIALUE l;
l; 0'':'U74 74175 11 73174 74/75 11 I .974 1975 11 1974 1975 1.1 Iirl 1.000 UOL. 1,000 DOL. 1,000 DOL. 1,000 UOl. r
I h i
USSR 85,8'1il 23,r94 183,594 1~3.S09 5,456 5,652 13.259 31tW,:1 l1URKEY 9,170 20,Z87 46,721 '96,098 1.1t3S c.843 8tl~0 14.c52 !IAAQ ~, 191 14.838 30~c17 10.127 0 0 0 f IRAN 16,10e 50,904 65,986 i!56.84& 1,)96° l,SS2 7,211 9,900
~ U'GIA SZ.lV 109,528 168.900 46~hB94 14 9,545 43 41,047 '1 P~KtST~ 17.934 18,nS 86,194 ,86.S1. 1,449 1.412 19398 7.348
BANGL.AI,lE$i 15~078 18.609 62,892 .86~957 1,174 0 lO,7?0 Qi PEOP~ES ~EP Of CHINA 107.591 54,961 ,310,241 189,180 3,750 0 119708 0 KOREA,oRIEP O~ 46,858 46.545 'aZ7.672 aS1.00S 5,709 6,,531 31.969 35,348 OHlMA.REP of ITAl WAN I 1~,281 10~06S 85.933 ,52;217 2.919 2.829 14.715 14,1:196 JAPAN n,85', 82,SM 1300,011 ~26.127 7,7n 9,432 38,581 53,762 ALGEIUA 19.02t- 9,955 81,665 ,54,593 4,6." 606 Z2,89Q 2.3"0 UNO~TFO C1RV~CAN TIS 62,1SII 23.31,\ '29S.146 1,3Z.736 0 0 0 0 OlH£R 211,8S8 149,UH Jl"" ~5I;jii! 710.853 29,129 <!2.S66 14th88S 1l~hZ31
\tHEA" FLO\jft ",8U a3~554 l"h~S3 64,785 '9T .83. 2,751 2,(191 12,8~1 lh"LJ JAMAICA . ~Ol it065 2,951 5.1.33 205 116 S89 603 COL~U Z,l6S )31 1),7(21 1,822 ::'40 "5 1.3~1 c88 ~ ~Ll\/iA 36 1.202 nil 5,532 3Q 9 158 57 lEBANON 1,80.i! 7i: a.121 401 ~~ 6 2.796 56
A"e aZ2U ..;lAEL. 1.0<1>3 245 4.963 1.173 ::11_ 0 0 5.4001 /lUtASIA 4.1ZZ a,Q1S 1·.,S&9 "'Oi8lS ~~ 1.• 074 2.689 5.814
I 1RI L.A~A ,GEVL0f'4) :t,358 179 S.9a4 8T$ , 0 0 0" co INDONESIA " !iCl2 39 2.158 148 0 0 0 .... ~,
" ~lLIPf'INES 5.1 424 2,183 z,l~3 ~fl< 54 2~ 27, ~REAIRfP of 111 610 2.304 3,998 !~ 22 <197 114 H<lROCCO 1t6Ql 1.389 6 •.171 &.-565 ISS 10 9?5 52 A!. Gl::R.lA 0 4116 0 1.:~86 0 0 0 0 EGYPT 't953 3ttS 1.3a1 1,,91~ O. 77 0 40S OTHe:R ·'h498 5.094 18,264\ 'a!t,~o 610 617 2.2?0 3,746
ALFALFA M!Al., 4J£H.vot:ATOO ~STH 'iliJ .{)2 ,,.6113 ';;~029 '7 6 742 790 ~PAN • 66 .57 4,S-6 6.·513 6 5 6-9 698,.OTH£R. ·6 l,f/T 446. 1 1 ?J 92
4L.f'JlLFA tEAL,. ,suN.-OUR!D "STH 14!:! '% ·J.~Cl 8.<r91 25 1~ 2.1~0 689 JAPAN 144 ~ ~.S61 8 • .562 25 11 21144 658 OTt!£R 1 2 (H 129 1 16 31°
AI.FALFA I:4AV t\liES I4STH 53. '\\3 J,GlO 7,619 2 5 150 270 CANAOA .J 11 193 515 Q 3 16 173 ~Xl(lO Z. 12 120 80S 1 .0 51 5 .JAPAN ~o 49 ;e.103 {l.1.84 \ 1 ?6 81 01~ 0 Z 14 .05 0 0 0 ~S
Olio ~~ f4f;AL. fIIS1N .:1.320 J~U '13tl,7l0 !UT.048 596 386 1l9.6!3 610723 CANMA 134 1'91 ~59~5 :as~.saQ 25 1. ",7!2 2,246
OOHTlttUEo
tJ;
.t;)
J.~ -' fi
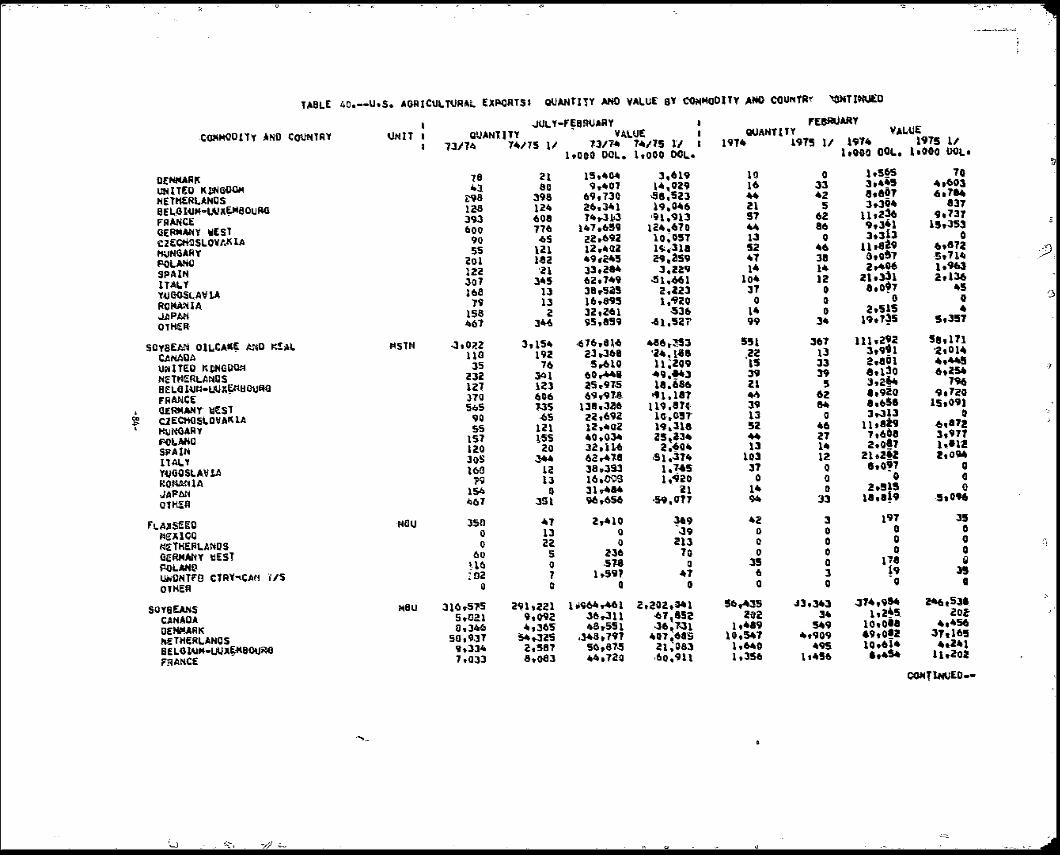
jIIf ~, "'",'- , ... , '":'\i"-.'. ? ~' r..:;< ••" ~"~1~ 4..""
QUANTIlY AND VALUE 8'1' COMMODITY ~NO COUNTRt 't!NTI~DTASL.E 40.--U.$•.AOAIC\ll.ltIAAi;. ElIPOATSI
.JUl.Y-fE800ARY F£BAUAAY • VAlOf.: Qt)l\NTlTY ",,1.\1£·CoHM<lO tTy AND COUNTRY ~lTl QUANtITY
741T5 11 7-3174 74/75 1'1 I 1974 1915 1/ 1911t 1~75 117311~ 1,000 DOL. 1.000 bol_1.000 DOL. 1.000 001.. 'Ii
DE.NMARK Ul't ITE~I( ~GOQf4 NETH£~LANDS SEL.Ol~"oUUX~OU~ fRANCE OERfII~Y !:lEST ~2E~SlOVf.~LA HUNGAMY POLAND SPAIN llALY Y,UGOSr...All ].A Rol'WllA JAPNl OTH£R
18. It,)
498 l~ 393 600
90 5S
lol 122 307 168 }9
15S 461
21 80
1.98 124 60a 776 -65 III 1-82 '21 ~5
13 13
2 3<\fI
lS.4~ 9,407
69,130 26.341 7'-,.3111
141.459 llt69i! 12,.Oiil .9,241>5 33,284 62.7419 3S,.5i5 16.895 32,261 95,859
3,619 14~O29
>5a.523 19.~6
-91.913 H!••670 10;057 1~;,31a 29.259 3.229
.51.061 2.223 1.9 20
-536 .(tl.52i'
19 16
"II 57
"13 52 1t7 14
104 37
0 1· 99
0 33 .2
5 62 86
0 .6 3a 14 12
0 0 0
34
1,5~ 3,." 8.8~1 3 .. 304 11,2~-h3.1 l.313
Ihd9 lhOS7 2,406
2h331 8,O~7
0 29515 l'h7~5
70 4,603 6.1"
831 9.731
1!h353 0
(n872 s.n.. 11963 2.136
'-5 0..
S.351
B
:;D!. ;
0
, '"..,•
S.QyaE~ 01L.CAK~ AND j.1l11L CANADA UN I.TEO KDNGOQ:.i NfTttlElll.ANIJS BELOIUt:l-UijX~tlO\lRG '~ANC:£ GERMANY idlEsT Cl£CtKlSLOIIAIUA ~NGAAY POI.AND SPAl~ 1.11\LY Y~GOSLAVu\ ROMANIA JAPAN OTHER
t'lSTN o3,0?2 U8 35
2!3i! 1.2.1 .no 545
90 55
1.57 110 30S 168 1'9
154 1.161
3.• 1·54 In
76 341 li!3 606 7.JS .()S
121 1"55 20
344 II 13
Q 351
.676,81-6 23,.368
5,-610 60 .....' 25~"9lS 69~la
13"'3456 22.692 12,.Q2 40,0~ l2,H6 6a"l8 38t.393 16.WS 31..484 9-6,656
4-86..l53 ~2•• 1'&8 U;209 "'9.!43 18.686 "1.181
119.17q, 1<;,.051' 19.31a 25\234 2.~04
.51 .• .374 1.~"S 1 •.'920
il .59,l1n
551 22 '15 39 11
'" 39 1.3 52
" 13 103
31 0
14 94
367 13 33 39
5 62••0 46 27 14 12
0 0 0
33
1111292 3.9!1a •• Ol .,I~O 3,2~ 1.920 8,658 l..313
I1t.8 1,608 2.0~1
2.1,Z~Z 8.0,7
0 2.S1!
18,a!9'
58.11\ '2.01~ 4.445 6,254
796 9.720
15.091 Q
~.812 3.911 11,112 2tOM
0 0 0
.s.096
'1
f\.AJlSEED MEJUOQ NUHERI.ANOS G/ERMAHY titsY PoLANtI. UHONTFO CTR'("CAti OTHER
tIS
Hau. 358. 0 (1
60 Wb ~Da
0
47 13 i!2. s 0 7 Q
2,410 0 0
236 ,51"
1.597 0
~9 039
213 70
0 .7
0
4Z 0 0 0
35 6 0
3 0 0 0 0 1 0
191 0 0 Q
118!9
0
35 0 0 0
" l!I Q
!J
SOYSEANS CANADA DE.~RK ..UHERLANDS BELO~M·UUX~~OU~ FBANCE
"8U 31(l!rS1l5. S.Sal 8,3,"
58,9,17 ch33~ 7,033
2c,)l,221 9,092 4,365
34,.325 2.587 ~hoa3
11/964,461 36,.311 41hSSl
.348.791 56.8105 44 ,lao
2.202."1 -61,852 036\ 7031
401.689 21;083 .60.911
56,435 2.02
1,·.9 10,541
1,640 1,356
.l3.~3. 3.
549 4,909
495 1.456
:J14.9~hZ,s
10.01. 69,O!Z 10,614 1,.$4
N,SU 2Q~
....56 31.165 ...Ut
n,lO!
~TlHUED.-
'" •
LJ S:-x '0i "~ G
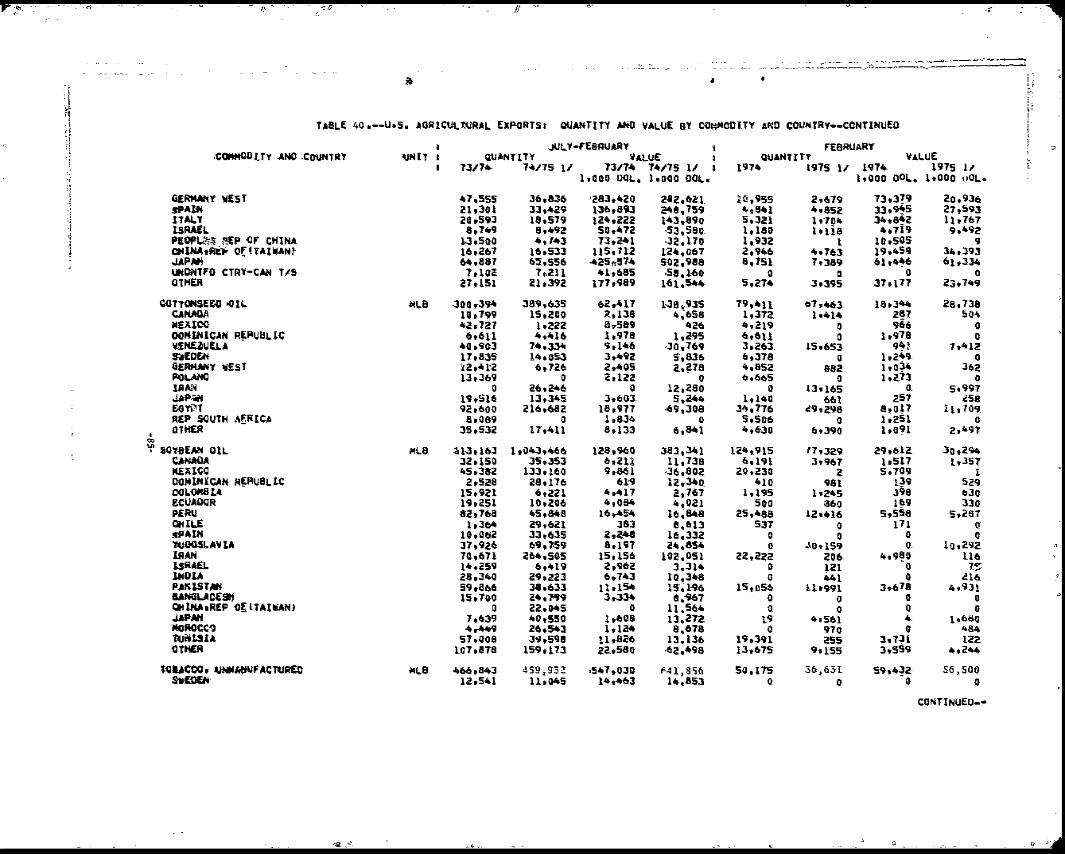
I
~ f'-~,,-"0 (}'-- ~-{}~fb~- II ~ 'ij
u ,,,•• __ ____ r __,,~,,",,,.,.,,,,, ~~_~_~.~, _...,.~~~_="~~ "·'~~_·_·
' ~» ~ i',;fi; ~
U I;Pt
h ,I q TABLE 4(h--U.S.AGRICU\.'WRAL.. EXPORTSI QUANTITY AtiO VALUE BY COMHOOny AND COUHiRY--CONTINUED r ~!, t
~ f '1 ]
.CQMfII(U)UY ..-NO .COUNTRY 'UNIT .JUl.Y-FEBRUARY
QUANTITY VALUE 13174 714/75 11 73174 74/75 11
1,.000 OOL. 1,000 DOL. a
FEBRUARY QUANTITY' VALUE
197. 1975 11' 1974 1975 1, 1,000 oOL. 1,000 \lOLl
I ~~
1\ if ;j
GfRMNty WEST sP"lfiI l1AL.Y lSAAfL.
47,555 21,301 20~593 8,7,,9
36,836 33.429 18,579 8,492
'283,42Q lo36,8CjJ 124,222 50.472~
282,6~1 a4S,75g 143,890 .53,580
il!,95S 4 q841 5,321 1,180
2,679 4,852 1,'r04 l'li8
73,3!9 33,.9~5 34,842 4,7i9
20.936 27.593 110767 9,1092
~ .! :
PIOPL(ltit Sf:P.aF CtiiNA ~lHA,~ of.tTAIWAN~ JAPN!
103,500 16.261 64.887
4./43 16.533 ~,556
73,241 115,712 425,,574
.32,170 1'24,061 502,988
1.~932 2.94-6 8.751
1 4,763 7.389
1.0.505 19,459 61 .4~6
9 34.• :193 6lt334
UNONTfO CTRY·-C~ TIS 7.10a 7 ~211~ 41,685 ,58.1-60 0 0 0 0 o.tHfR C1,151 210392 177,989 1-61.544. 5.274 3.395 37.1.77 2:;.749
OOfTOHSEE-D. .0 Il. CANAW\ 14£)(100
~LB 0300,394 10,799 42.727
389,635 15,200
1,222
62.41'7 ~,138 a ,,589
1>38.:935 4;658
426
79,411 1,372 4,219
117.463 !t414
0
18.34-4 2!7 966~
28.738 50-\
0 DO~"'IHIC.AN Af;~ueLIC >aNDUEU
6,611 40.903
4.416 74,334
1..978 9.1.46
1,l95 .30.769
6,611 3,263.
o. 15,653
1.918 9~!
0 1,lt12
~EQ£iN 17.835 14.053 3,1092 5.836 6,378 0 h2~9 0 GERMANY '!fEsT P()I.ANO
12.41:2 13,369
6,726 0
2.405 2.122
2,278 0
4,852 6,665
882 0
lto;J4 lt273.
362 0
IJ;A~ JAP~ EGYPT REP SOUTH ~~RICA
0 19,!il~ 92,600
8,089
26,~6 13,345
U6,682 0
0 3,603
18.977 1.834
12.280 5,244
-69,308 0
0 1.140
3~.776 5.506
13,165 661
c9,298 0
o~ 257'
I!,op 1,251
5.997 e5e
1l,109~
° I OTHER 35,53Z 17,411 8,133 6,841 4,6-30 6,390 ltO?l 2,1091'
CD
'i' SQY-8EAH OIL CANAQA MEXlCO OOMIHXCAH OOL-oMaU ECUADOR PERU
R~AUBLlC
MLB~ .<\103.,163 32,150 ItS,38Z 2,Sl8
15,921 l'h2S1 82.768
1.~43.466 35,353
1.33,160 28,176 6,221
10,206 45.848
1Z8.960 6,2.11 9,861
6l'9 It ,411 4,084
16,4!:4
383,341 11,738 .36,802 12,340 2,767 4,021 16~848
124,.915 6,191~
20.230 410
1.1.95 500
25,488
11,329 3,967
2 981
1'24S 360
12,416
2.9,612 1,517 5.109
1~9 398. 1~9
5.SS8
30,29419357
1. 529 630 J30
5,281 CHILE 1,3610 29.62.1 383 8.613 537 0 1~71 (l
s9"1~ Y4J6O!I.AVtA lfiAN J.SRAEL ltfOIA
10.0(j2 37,926 70,671 14.Z59 28,340
33,635 69,.159
264,505 6,419
29,223
2.248 8,197
15,156 2,962 6.743
16,332. ZIt.8!4
102.051 3.314
1~Q ,348
0
°22,222 0 G
°..10.159 206 121 441
0 0
4,9~0 0 0
0 10,2<,12
U6 1<:'.J'
l.l6~ PAIUSTM IIANGUDESti .CHlNA,R£P O~lTAI~H)
59,866 15,700
0
38.633 24,1«19 22.,045
111154 3,334
0
15;~96 11.-967
11.564
15,056
° 0,
1.1'991
°0
3.618 0 0
4,931 0 0
JAPAN McIROCC-9
1 ,639~ 4,449
40,550 26.543
10608 1.1054
13.212 8.678
19 0
4.561 970
4~
0 1.080
1084 1\Iil4UlA OTtER
51.008 101,878
JV.S98 159,173
11,826 22.,580
13.136 .62.498
19,391 13.675
255 9,155
3,731' 3,559
122 4,2tWt
l-QIJCCO. ~IItWF."C'/lUR£D f4LB 1166,843 459.93Z .547,030 1'41,856 50.175 3&,631 S9,4~2. S6~SOO Stt~ l2t!!41 U.045 l4.~463 14-.• 853 ° ° 0 0
CONTINUED-
"$_ ow. u '!

'-.11:-,,9 ' (]
'\
.... -~,."~
~
1¥"' TABI.E 40.--U.S. AGRICULTURAL. EXF'QRTS. QUANTITY AND VALUE BY COMMOOlTY AND COUNTRY--CONTINUEO
I JULY-F~aRUARY t FEBRUARY CQ;OOJDIT)! ,ANO COUNTRY UHlTl QUANtITY VALUE QUANTIf't VALUE
73'/7" 74/15 U 7JI1.1t ~,QiJO DOL.
74/75 11 t 1,000 DOL.
197~ 1975 1.1 197~ 1975 1/ 1.000 DO~. 1,000 UOL_
D£NMAR!(: 23.503 11•.17'" 2.1.9~9 13,566 Q. 58 0 67 UNtTEil KJlt<GOQI4 93,470 15~24e8 U6~18 ll5.047 3.891 5.649 5.069 9.406 HETtiERUNOS 33,·39 22,204 3J.s32 2S~607 l,870. 1.971 4.254 10905. 6£RtW.Y illEst S"ITZERUHD
51,865 20.552
50.42.1 21.695
6,1.903 23.187
.51!l.G55 28.139
1,177 1.723
1.380 1 .• 187
1.371 2.339
1 .• 1i73 It''U3
HALY U;AILANO CHlNA.R£P OfITAIWAN}JAPAN AUSTRALIA
7,412 12.313 10,.160 80,5eS 16.618
16.186 18
1ti.71S 93,172: U.·137
1i.27.6 15.827 12,095
108o.1ta4 2.0.061
26.693' 40
25;-932 1'19;632 16.988
2,501 6.022 1,190 ",480 3,164
8.054. 0
6.321 3.798
181
3.105 S.226 S.738 6.060 4.724
13.034, 0
10.1.36 7.121
.J11. '-laYA ~YPT OTt;£R
1.2(;'1 1'46a,
95,168
11,173 U,824
106,122
1,591 1.562
10,..105
17.3.11 13.183
13'6.,150
0 0
15.557
13 130,
., ,883
0 a
15.538
30lao
10,454
8IJRLEY r08AC:c<I MLB 36,114 25.230 4fh~6 .JS.5J3 4.330 lt023. 5.4~4 10056 RRAZll. 769 50,} 1 .. 121 870 a 0 0 0 S"EDEIO: FINLAND
2.577 934
3.1·38 361
3.763 i.~2
5.193 607
0 126
0 65.
0 211
Q US
DENMAfiK 2.762 l.t963 3.750 2.923 I} 0 a /) NETH£fi~HOS f"R~CE GERMANY "tis!
3.951 3tt3
10.954
1.673 426
8.167
S"H9 59!
12,218
2,550 862
11,386
501 26
514
39 113, 82
628 ~l
541
46 362
93
•Q1
'"•
"'"'STRIA Sli IT.zERLMND ITALY SYRlAH .AliAS Rep L£8AHQN
1.098 ,,466 2,314
2t9 165
2 S04
0 a,013
922:
1."915 3 .. 547 2.937
i!69 221
l; 1 .• 113
0 ,.zn 1.4 94
0 418
1.945 a 0
a 3 O. a
463.
0 48S
2'.~ o. 0
Q 4 Q Q
75Q PtllLl'P~IN£5 ~STRALIA
.3.230 B.lo
609 2.07
3,581 1-.1250
828 298
0 271
0 0
0 4~8
0 0
~YPT OTHER
:;
0 4.061
559 3.2Zl
Q 5,120
1~5 4.309
(j
521 0
200 0
671 0
lSe:
F\.UE..cuEIEO TotIAC:CO StI&IlEH
MLB 310,020 1.232
JOh918 5.801
·434.695 10,088
508.161 8.518
33.930· a
t6.962 a
1t6,1t!7 0
47. lit!! 0'
;:
iJ!NMAftK UN I.TEil KDNG4)"'" ~TH£RLAHOS GERMAtfy ~ST !w.I.T.ZER1.MfD ITALY UtAILAHO CDtlHA.R!F afC.TA{IiAN' JAPlIN ",",STJULlA LIBYA EGYPT OTHIER
Ut2S1 1.3,860 ll.C4J 39.805
6,938 4,305'
12.076 Hh640 61.651 U.31a
992 10361
5...548
7,068 58.028 8.686
34,431 2,,594
16,510 a
15.-522 70,608
1 .. 531 8"~31
10.784 SS~51.
17,21.3 110.01.3
14,287 .-,681
9.3119 4.630
15.. 5],5 12..562
106,786 1.1,169
1,519 1.556
69,a3!:
10.149 105.528
10'.996 .lt2;7.5.
3.347 .26.2118
0 ·2S~83l.
l.lt1.3a3 13~835 17;~~9 12 ...530 .83;832
0 3.070 1,764
349 13
556 ,6.022 7,190· 3 •.453 2,423
If 0'
9 .. 091
58 4.686
696' 10126
77 8,054
0 5,128 3.194,
118. 0' 0
3.165,
0 4.533 2,034
412: 15
642: 8.2Zti, a,138 6.002 3.7~0
a 0
12.1;5
61 8,8409
912 1.548
115 13.0J4
0 IlhG3!! "f,Tl2
299 0 0
4,51!!
ii
CONTlNUED_
" .,
·it·6<"::~~, -;,:";-""'"" .~;.:::--, 2:.-·., ,':;,~-

"'~ .... "
'"
"'t1' - .. - ..-.....::-....:~ •.>:::::.:....~.. }l
n ~ n~
I'f!H lJ
nTASLE 40. __UeS. AGRICULTURAL EXPORTS 1 QUANTITY .AND VAl UE BY COMMODITY AHO CQUNTRY--caNTIMJ£D
11 l'I,
I JULY-FEBRUARY I FEBRUARY ?:
l COMMIlUHY AND COUNTRY UNIT QUANTITY VALUE I: QUANTITY VAl.4JE
!.l 13174- 7417'S: 1/ 73174 1 ... ,75 11 J. 1914 1975 l' 1-974 1915 l:I hOOO DOL. 1.000 DOL. 1.000 DOL. 1..0.00' UOL.
: ,<
r!
~ n J,
.MARYLAND TOSA~CO NETHERLANDS BELGIUM-L!UXE.MBOURG· GERMANY illEST Sitl.TZERLAND SPAIN PORTUGAL ITALY OTHER
lolLS 5,990 60
864 1,694 2,409
233 310 338
82:
a.158 539
1,50i!. 1.217 3.681,
364 3.88 i!.73 135
6,aJO fl,j
965 1.834 3.072
226 ~Hi Z70
86
10.711 681
1.124, 1.4 81 5.4l7:
400 453: 443 119
n 0 O. 0 0 0. O. 0
11
195 0 a
145 SO
0 0 0 0
.9 0 0 a 0 0 0 0: ~
""3 0 0
..l66 71
O. 0 0, 0
, D
, CD ......
~ULK SKOKING TU~ACCO PANAMA DQMINICAN REPuaLIC ECUADOR PERU FINLAND NETHERLANDS GERMANY illEST AUSTRIA SitITZERl..ANO SPAIN AUSTRALIA CANANY. lSI-ANUS OTHEH
"'La 21.619 586:
l,31i!. 634 891
1069S 7.399
486 215
3,863 1.348
8.90 1
2,226
31,287 233
2,1:31 604 632
2.•493 2,658
890 701
LO,917 2.7-33 1.263 2.a.!i 3,1,86
28,342 199
1.640 81.6 918
2.0!!9 100451
48i!. 270S
5.599 1,64.4 lt04!i
1 2,!ice
·44.3410 349
i!.,,796 871. 894
3 •.630 3.1... 4 1.05'6 hOll6
16,017 3,.695 2 •.077 3.618 4.CiaT
2:.S4Z 90 a
70 35
161 58
0 215
1.18i!. 0
392 6
333
3.121. 20
643 331
0 362 311.
0 122
It02-" o· 8 0
293
3,342: ?1 a
106 48'· 1~3 57
0 275
.1.7~1 0
450 6,
3~0
...,Oll ]4,
ale 551
!f 612: at
0, 156'.
11187 o'
12.' 0'
5!i4, l
VtGETABLES ANil· 'PREPARATIONS. CANAilA lojEXICO PANAMA NETHERLANDS .ANTILLES WfnED KDNGDWI GERMANY illEST HONG r.~G JAPAN AUST~ALIA OTHEI(
CANN!:D MLB 164,081 53 ..2~1
8,149 4,094 2.509 -6.71109 3.650 -90472
35,331 ·3.097
37,183
139.e25 58,56:1
8,568. 2.362: 3,403 4,900' 3.533 4,213
14 ....15 7,13,
32,7036
36,1% ll.8a4 1,386 1,001
580 1,,411
116 2.146 ;,867
750 804S!
40.2"8 16,101 1.812
722 1.040 1.605:
882 1.222 ....486 i!..469 9;9IO
1.9,988. 7,061 loOS8
51Z 120 631 329
L.2Il 3.6~
129 4.6112
14.2.71 4 •.927
656. 332 426
1..685' 42~ J5J
1..761. 49
3.tt5'6
.,586 1 .• 5~1
158 1C6 L ,?8 1~2 73
292. 906· n
ltlq5
4.200 hZ~1'
150, lOS' 139 650 i06 116 497'
19', hi'll
~,
PULSES CANAilA MEXICO COSTA RIel. OOMINlCAN REPUBLIC: VENEZUELA BRAZIL UH nEa KtoNG!lWl NETHERI;.AHilS
MLB 444,508 11.733' 14.856
1.108 22,ll5 24,391 43,103
11'2.147 31..531.
589,790 1'.,'940
lSfi.MO 9.109
183 i!.9,53e
3 • .341 63,843 13,492
85,U8 2.21.2 10500
.37.6 4,6706 .,.OU 7,7'.3.
25,19'2 5,053
140;748 3;327
43,590 3,409
29' 6.487
879 15~482: 3.376
29 •.961 '2,040
16.1t 1,016
114 1,819 1t.3 81 7',130 4,558
17.7021..6198
CAt. 186 746
a 2.834
100 119760 11195
;.9~a.2",is:
351 ~
5!1 361:
1,7~Zt!4
18•.~ 382
; ..4189 C26
~ 70a
10 2.511
220
QOHTlMJm:.
~
::S
.....,

"'" ,~,-"~,(r ""<> k. '--::~
TAaLE. 40 .-\l.S• .AGRI.C1JL"RJRA~ Ext'OATSI OUAN.TI.TY MIO VALUE BY. COMMODITY AND COUNTRY--CONTINUEO
, Cl,
"",
.t;(J4MQIlITY AND .COUNTR'I'
F'Ji....CE G!RI4~Y weST £;;:lAIN IT...Y GAEta;. ",-,PM AlUSTRAL.I:A AL-G£RIA OTHER
BEMS., 4RIEfJ CANAGA· MEA:lGO COSTA RICA Do"'fltICAN Ii~BUC' SIiAZIJ.. UiNIlfi1 .K~ NETHERLANOS !"RAN" GERNHy weST !PAlM ITALY JAPM AUSTRALI.. ALGERIA eITHER
I' ~IT I
t
lIItB
JUL.y..r~eAIJAA't l QUANTITY VAL.UE t
7,3n4 74115' 1/ 7.3114 74/7S V t 1.000 OQI.. •. 1.000 001...,
16,852. 29,009. 3.212 6.4 80 4bSQ6 2S,.U8 7 .. 3U 6.100
4,484J 21.186 .U S~,0791.4;947 26,927 2.lll9 ~.a60
7,295' 9,232' le71. 2.083 21,717 $4,1'98 Z.~ ~h~a(J9,438 7,996 2~5 2.~6
1,5,.347 32,121 2,9" 7'.57& 5I,~n:8 93.205 1.1.155 20.•953
289,21T 396,048 56,827 102.).:218,2Vt 12,551' 1.728 2.;931 14.1.7~ 15S.147 10406 43.,386 1.011 8,892 .354 3 • .354
22,159 0 4~~ 0: 1"9.6CS' 350 3,.81(, -...~,
830458 40,651 2.0,49« 10;.2921,490 9,009 2.218 ~~.112 14,793 OU,Ui8 2~c: 5 •.249 31~54 a.S8a S.2l1t 2.289
371t 8.5'97 52 2.077 10.586 14,886 1,.542 4.031' 8,225 22.1.a1 7·51 2:,681'9.009' It,a57 2,222 2,111
1l,392: 32.121 2,081 7.578 32:,81i2 51.3It9 7,.345 lJ~519
FEBRUARY; QUANfITT VlL.UE
1'174 1975' !If 14)74 1915: 1..hOOO 001... 1.000 U0l.._
Z.13& 3.229 sn T18 1,,098 Z172S: ·tt3 S~S
0 3',921 a 910 284 4,6IT 55 1.091 110 2,156 lit 433
{,lOS 5.a'i4. 278 741 l,333 410 ~9 H4
0 Q; 0 05,412 J..3,07l1 h357 2,,944
16.890 ~7.731 4-.510 15.151 877 h~61 2~9 l47 82 c3,907 9 7.035
981 725 344 222:n_ o !2 0 0 100 0 10
4,813: 9.162 1.2'l1 2.077 2,593 960 113 1:84 {,67ft. lt863 501 440
2.04 299 1o!9 68 0 2:.010 a 1081
284 3.083 55 856 1t94 4,464 99 1:186
1,213 390 407 110 0 0 ° 0
3',561 ~.308 8~3 2.61t1
'e
}~
~ "
t''';'·
·~t
~\ re l'
.pE"AS. LNa.UOI~ to'" AHa CA~,
TRIHI4AO·TCtjAGO CGLQ4eIA; ftHDtJEU PERU IlAAZlL <UNlTEOK1lI4GQQM N£ni£fiLANOS GERMANV IifST SflA~ ITALY atUtA.REP C[(TAlilANJ JAFAN OTHU
LEnUCE, FR!5I'! CANAOA Sw£QEH N£TtiEfiLAMlS
CHltK, ORIEiI ..La
filLS
120,193 03,064
366 1 •.816
14,600 ·3,868 2Z,s:..~ '28,652:
.a,150: 3,144 1,806 l.~oo,
743, 13,492:, 1·5,726
154.091 137.n~
1.395, 7a2;
136,599 h972 4.409 StS20
20',976 2
2:.958 22.892.
1,834 Z,2.~4 4.840 4.0'9
n.312:. 31,993 Z1-t528
175,2.08 160",.34CJ
l.t 139 1.607
20,4l9 423
68 223
2,100' 939
3,166 S.3:tec 2,361
774 297 231 54
1,~ Z.6loJ
1.0,867 6,601
248 171
24;356 -311 alt8 -982
4.0'12: 1
836 4,.978
l34 .10'
1.094 ~95
1.347 -3,90S 4;538
15.223 12:.967
219 325
10,715 1.,llt3
45 114 629
0 1.-381 2,317 1.965
821 0 0
° 811 1••69
2S,7JS Z2,6U
.ft3c 26e:
th547 n4 5t.
h53fi 789
0 0
2.559 1ST l~'
629 h075
992 580
3,041
.!7',729 4!6.Z4IJ
279 5a5
2',700 1~5
12' 17
IS9 0
361 50S 711. 2!Z
0' 0' Q
118 3!2
2:.t26 r,6!3
72. 48
lt132 18 a
[6.7 [IT
0 a
426 2, IG
123 126 88 56,
550
2,221' h'i46:
so 122:
COrtnNUEO..
lI' .,
?'
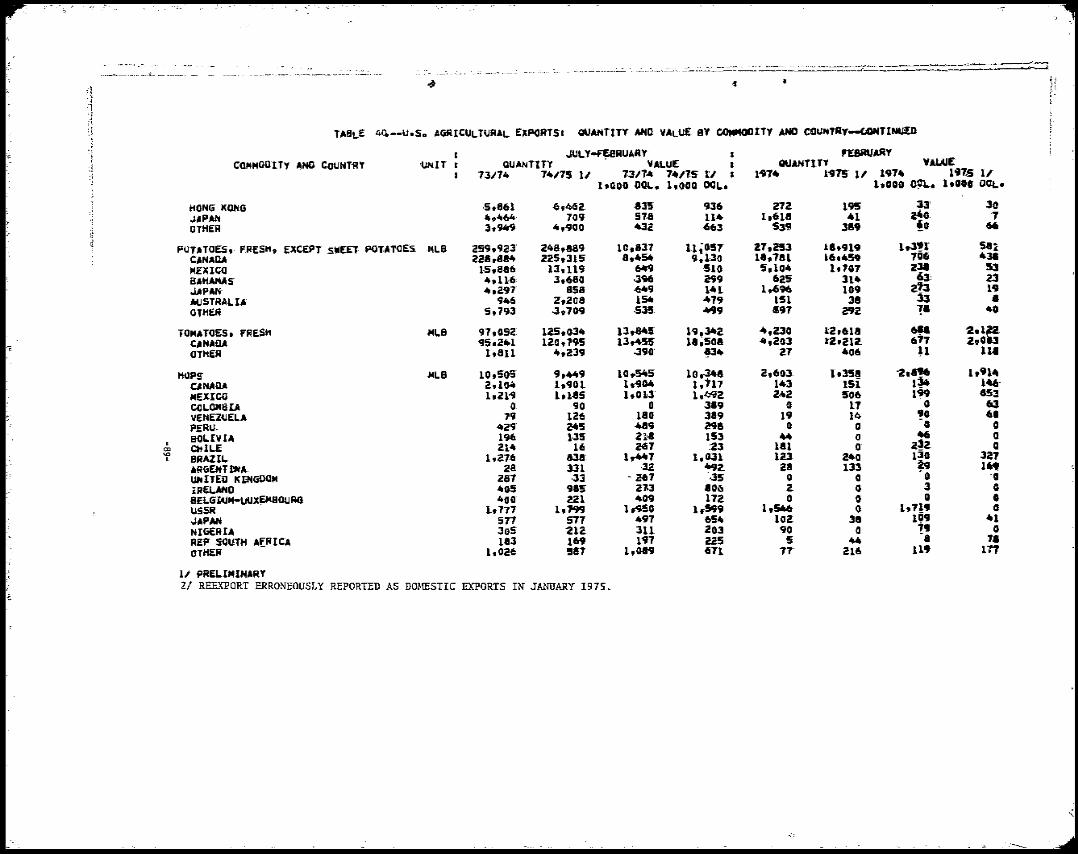
,;
o
4 •n " ;.j q,,!
,\ TA8~E 4~--U.S. AGRICULTURAL EXPORTS I QUANTITY ANIl VALUE eY COMMOOIT'f AND CQUNTR'f-cA:lNTlNU£D;1
;1 ,I' JULY-r~AUARY nBAUAR'fI COMMOO'ITY ANO: CQUNT'RY '\JNIT QUANTITY VALUE I QUANTITY YAWE :i 13/14 74115 11 7317.1t 7.1tl1S rI I 1-974 1915 II 1914 19T5 IF 'i hOOO DOL.. 1.000 OGL.. hOOO D~. 1.0••. DOL.:t i :J HONG' KflNG' ,~r.861 ~h46Z ..35 936 Z7Z I~ 33' 30 :j 4~464, 109 57.. 114 1,6111 41 z40 '7J"PANII OTHER 3.'1119· 4,900 432. .663 531l 389 ~G 66
J 1 POTATOES, F.RESH, EXCEPT SWEET POlAT'OEs.ML.B 2.59.923: 248,889 10,831 n~O!17 21.a3 18.919 hJ?I sai
CANADA 228,884 225,315 8,454 9.130 18,781 16.459' 706 438 MElUCO 1,5,886 13,119 6ofJ9 510 5,104 !t107 238 53
13,aAHAMAS; 4,U6: 3,680 -396 a9 625 114 Zl JotPIW 4,297' 858 .6.9 141 1.696 109 z13 1" AUSTRALIA 946 2,208 154 419 151 38 33, •OTHER 5,793' -3,709 ·53! ~9 .97 sa !8 40
TOM,HOES, FRESh ~L8 91',092.: 125,034 13.a4! 1'9.342 4,230 12,618 ".. 2.1= CANADA 95.2.41. 120.195 13,455' 11.508 .,2el 12,212 617 200
~ OTHER 1,8U 4,239 -390 ~.. 27 406 ~1 lUi
HOPS ~LB 10,505 9,449 10r5ltS' 10 ..346 2,603 Ie3S8 "2.....' 19914 ONADA 2..104 1.901. 10-904 1,117 143 151 1~ 1~ MEXICO 1.2l'9 1.1..5 l,OLl 1,/;192 242 506 199 853 COL.OMBIA 0: 90 0 319 0 17' 0 61
~' VENEZ~ELA 19 126, 180 389 19 14 !O .0 PERU; 42<1 245 489 298 0 0 0 0 BOLIVIA 196 U5: 2~8 153 44 0 46 0
ex:• QjlLE Zl4 16 267 :23 181 0' 2~2 0 ""• BRAZIL. 1.276 838: lr4o\7 1,031 123 240 130 327
ARGEHTfJlA 28 331 ·l2 ~2 28 133 ~9 169 WfITE.JI K~GUO", 281 ·33 -267 .35 0 0 0 •3iREi.AND ItOS 915' 2703 806 z: 0 a eELG~M-UUX~OUAG 400 2.21 409 172 0 0 0 USSR 1,771 1,i199 1~50 1..599 1,546 0 ItT!. •0 JAPAN 571 577 1t.1 6510 102. 38 1~9 41 NIGERIA loS '212. 311 203 90 0 !' 0 REF ~UTtt AfR ICA 183 1.69 191 225 5 44 a OT.HER 1.026 587 l,0a9 611 77' 2.16 11' 117
,. 11' 9RELIMINAR.Y 21 REEXPORT ERRONEOUSLY REPORTED AS DOMESTIC EXPORTS IN JANUARY 1915.
" ;'~
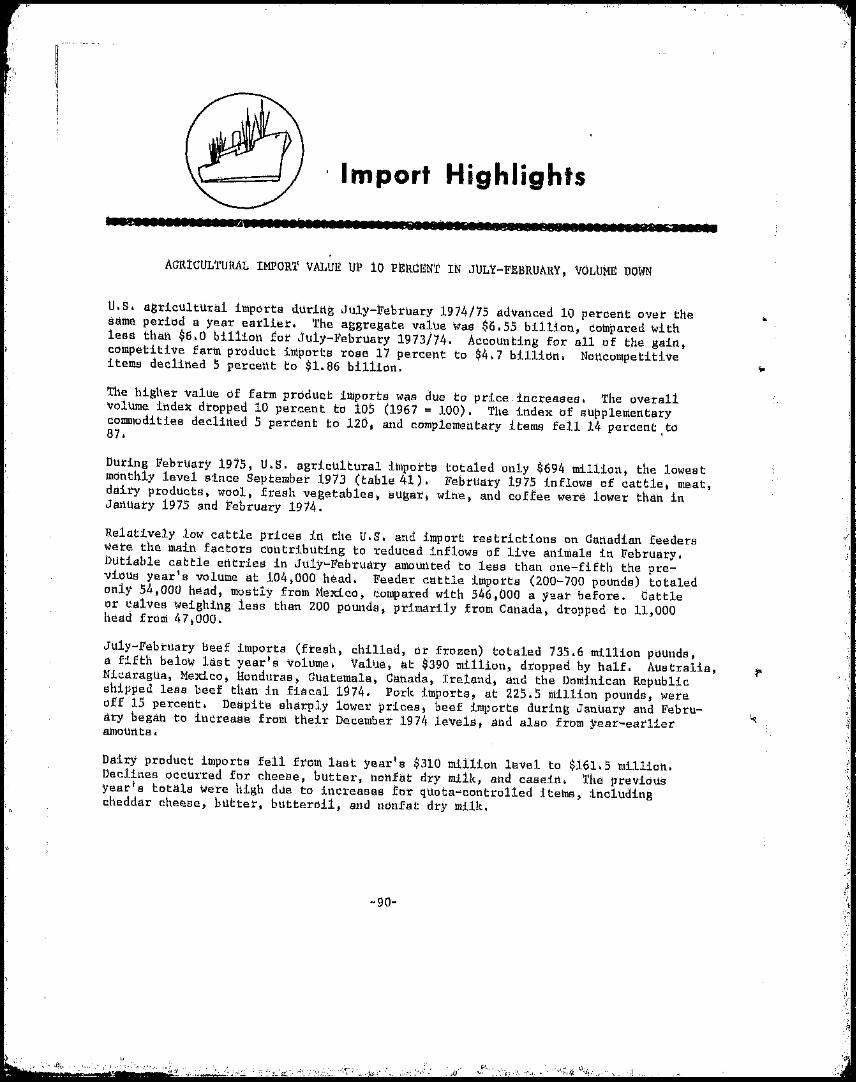
r(
. Import Highlights
.1.11•••••I •• I.I••IIIII.I.II.IIII.I •••• illl ••li.~II!.~ •• 111•••••••11••1.'••••••
AGRtCULTURAL IMPORT VALutt UP 10 PERCEN1' tN JutY~FEBRUAltY, VOLUME DOWN
U. S. agt:Lcultural ilhPt.:l1'ts t1udtl~ JUly-li'ebruary 1974/75 ad'lanced 10 percent (wer the saine period a year ear1ier. 1'he aggregate 'Ialue. was $lL 55 bil1ion; compared with less that\. $6.0 bil1ion ror July-l<'ebruaty 1913/14. Accounting for all of the gain; competitive farin product imports rose 17 percent to $4.1 billion. Noncompetiti'leitems declined .5 percent to $1.86 billion.
The higher 'Ialue of farm product imports was clue to price increases. 1'he overal1 'Iolume index dropped 10 percent to 1()5 (1961 '" 100). 'the index or SUpplementary colnnlocHties decHtted 5 percent: to 120, and comp1enletltary items fell 14 percent. td87.
buring February 1915, U.s. agricultural imports totaled only $694 million, the lowest monthly le'le1 since September 191J (table 41). February 1975 inflowS of cattle, meat, dairy products, wool, fresh 'Iegetables, sugar, wine,and coffee were lower than in January 1975 and February 1974.
Relctti'le1y low cattle prices itt the U.S. attd import restrictions on Clattadiart feeders were the main factors contributing to reduced inflows of live animals in February. butiable cattle etttdes in JUIY~:February amounted to less thatl one-fifth the pre~ vious yearts volume ~t 104,000 head. Feeder c~ttle imports (200-700 pounds) totaled only 54,000 head, mostly from Mexico, totnpared with 546,000 a ysar berore. Cattle or ~alves weighing less than 200 pounds; primarily from Canada, dropped to 11,000 head from 47; 000.
July-~ebruary beef imports (fresh, chilled; or frozen) totaled 735.6 million pounds, a fifth below last year's 'Iolume. Vallje, at $390 million, dropped by half. Australia, Nicaugua, Mexico, Uonduras, Guatemala, Cahada, Ireland, and the bOnlihicatl Republic shitlped less beef than itt fiscal 1974. Potit imports, at 225 . .5 lhil1ion pounds, were ofr 15 percent. Despite sharply lower prices; beet imrlorts dUrin~ Jatluary and Febru-.. ary begAh to increase fronl their December 1974 levels, and ~1BO from year-earlierB.!hoUhtS.
bairy ptoduct iinports fe11 t1'OI1\ IMt yearts $310 million lewd to $161.5 million. Deciil1es occuI'red for cheese, butter, nonfat dry milk, and casein. 'thE! previous year t s totals were high dde to increases .tot quota~colttrol1ed Hems, including cheddar cheese, butter, butteroil, and nonfat dry milk.
...
DUring July-J!'ebruary; 'tolume increases took place for miscellaneous animal produ«:ts, raw cotton, certairt fruits artcll?tocessed vegetables, grains, vegetable oiiB; blbacco,artd malt be'Verages.
U.S. SUgar imports in February 1915 were slightly above the January 1975 w:ilUlne at 203,000 short tortS; but \<teli below the 500» 000 short torts recorded irt E'ebtuary 1974. '!'he average iml?ort uttit value fell sigttificantly itt February to $659 frcHlI $829 in January, but remained well above the February 1974 average of $210 (table 45). ~he 3-l?ercellt decline ill sugar iml?orts to 3.3 milliott sharI: tortS (tel quel) itt JulyJ!ebruary mainly reflected reduoed shil?mettts from the philippittes, Dominicatt Republic,MeXico; and AUstraiil1 (table l~6).
~..
\

,.0;," A
-,~",~
1l'
Table lAl..--rr.s. agricultural imports: Value by months,' July 19Eilr to Yebraafty 1975
MOnths :: : .. ::
1964/65 .. 1965/66 ; 1966/67 1967/68 : 1968/69 : 196!j7~ ~ 1970/71
-- Mil110n dollars -~
1971/72 1972/73 : .
1973/741/
::
1974/75 Y
July
::
318.7 354.0
933.0
342.6 352.6 415.3
1,110.5
346.8 369.4 347.7
1,063.9
438.6 442.1 460.3
1,341.0
434.0 407.7 398.6
1,240.3
461.7 463.8 469.0
1,394.5
489.0 555.0 650.5.
1,694.5
471.6 563.7 547.1
1,582.4
635.0 720.4 639.8
1,995.2
897.9 854.1 751.1
2,503.1
411.0 398.8 428.1
388.1 358.6 351.6
3.7~•.5 379.7 388.3
396.0 419.4 419.8
469.1 411.2 48"1.8
480.3 442.9 522.3
302.5 298.2 540.2
573.6 547.7 550.2
712.2 862.5 778.6
740.9 837.3 965.6
October-December n: 1,099.9 1,237.9 1,098.3 1,144.3 1,235.2 1,362.1 1,445.5 1,140.9 1,671.5 2,353:.3 2,543.8
July-December •• n ... : 2,070.2 2,170.9 2,208.8 2,208.2 2,576.2 2,602.4 2,840.0 2,835.4 3,253.9 4,348.5. 5,046.9
~. r;>
January .H .......... :
February ............ : March n ........... u:
175.1 269.3 420.3
352.7 371.2 430.7
413.0 353.7 412.9
414.7 402.4 369.7
208.6 315.6 474.8
491.0 457.5 523.9
506.6 419.7 499.6
575.6 591.6 506.6
648.9 615.3 658.9
786.9 819.4 984.2
810.9 693.9
January-March n ... : 864.7 1,154.6 1,179.6 1,186.8 999.0 lA72.A 1A25.9 1.673.8 1,923.1 2,590.5
April ••••••••••••••• : May ••••••••••••••••• : June •••••••••••••••. ::
368.5 337.9 344.6
383.0 358.1 387.1
362.8 337.0 364.8
439.5 434.4 386.7
487.9 438.1 430.0
514.5 443.5 499.4
554.4 477.9 529.8
489.5 529.0 520.6
696.5 786.5 664.4
877.8 890.1 844.9
April-June ........ : ::
January-June ........ : ::
July-June y ........ ::
1,051.0
1,915.7
3,985.9
1,128.2
2,282.8
4,453 •.7
1,064.6
2,244.2
4,453.0
1,260.6
2,447.4
4,655.6
1,356.0
2,355.0
4,931.2
1,457.4
2,929.8
5,532.2
1,562.1
2,98&.0
5,828.0
1,539.1
3,212.9
6,048.3
2,147.8
4,070.5
7.324.4
2,612.8
5,2033
9,551.8
MOnthly average ••• : 332.2 371.1 371.1 388.0 410.9 461.0 485.7 504.0 610.4 796.0
11 Y Y
MOnthly totals for July-December 1969 do not include furskins. PreHminary. Totals may not add due to rounding.
~(
" .'

-~ -""'-',: '~y~-, -, --~.--, '"
.d " 7
r~le 'I .·1 11 II 'I;1 .)
Table 42.--U.S. imports of meat under Public Law 88-48211: Quantity and value by country, calendar years 1969-74
Jan.-Peb.Country 1969 1970 1971 1972 1973 1974 ;I 197411
: : : : : :
Jan.-Peb. 1975Y
l·t ,\ - 1,000 Eounds -
~ !
Australia ••••••••••••••••••••••••••••••••• : New Zealand •••••••••• ~ ..................... :
542,993 224,036
565,500 241,927
530,015 241,037
727,462 266,233
708,662 291,303
512,989 259,751
103,465 23,689
152,891 44,709
.5;,
Canada •••••••••••••••••••••••••••••••••••• : CACM:
Costa Rica .............................. :
43,329
35,712
77,810
37,735
77,716
40,884
58,298
50,460
55,270
47,814
36,540
60,l30
8,840
14,378
1,019
10,486 El Salvador ••••••••••••••••••••••••••••• : 0 0 0 7,163 9,322 12,761 3,039 1,440 Guatemala ••••••••••••••••••••••••••••••• : 23,829 23,246 25,968 32,028 38,504 29,528 7,952 5,079 Honduras •••••••••••••••••••••.••••••••••• : 20,813 15,872 16,785 25,726 40,064 29,400 6,287 4,964 Nicaragua ••••••. wo ••••••••••••••.••••••••• :
Dominican Republic •••.••••••••••••••••••••.• : Haiti ••••••••••••••••••••••••••••••••••••• :
39,672 11,353 1,330
42,329 7,720 1,277
43,943 6,982 1,489
54,103 14,260 2,004
54,806 16,155 2,060
32,689 14,318
1,699
9,412 2,325
419
7,559 177 179
Ireland ••••••••••••.••••••••••••.••••••••••• ; 65,973 68,963 63,830 30,883 21,796 44,014 12,766 195 Mexico .... ~ ..................... • ' ................. • ' ............ :. 66,479 78,519 79,108 81,870 67,254 40,418 6,737 3,157 Panama ••••••••••••••••••••••.•••••••••••••• : 3,393 5,149 2,717 4,911 2,127 2,9l,1 831 612 Be1i'!-e ••••••••••••••••••••.•••••••••••••••• : 0 0 0 0 188 79 . 0 20 United. Kingdom-Nortnern Ireland ••••••••••• : 5,225 4.553 2,164 64 236 1,887 223 499
Total 11 •••••••••• u .................... ! 1,084,137 1,170,600 1,132,638 1,355,465 1,355,561 1,079,144 200,363 232,987
, \0 t.>,.
Australia •••••••••••••••••••.•••••••••••••• r 242,987 274,877 273,572
- 1,000 dollars -
398,653 550,000 350,095 91,432 72,651 New Zealand .... • ' • .- ..................... ' .... .-.- ................. ' ...... : 104,058 123,465 129,539 154,039 225,551 175,580 21,284 21,427 C'anada .........'.......'.....' ................................................ : 21,750 41,152 42,872 37,037 48,790 26,619 7,769 594 CACM:
Costa Rica ••.•••••••••••••••••••••••••••• : 14,938 17,682 20,531 27,564 33,434 37,672 11,472 4,917 E1. Salvador ••••••••••••••••••••••••••••• : 0 0 0 4,268 7,620 9,464 2,765 85S Guatemala •••.•••••••••.••••••••••••••••••• : 11,230 12,089 14,509 18,631 28,283 21,282 6,336 3,284 Honduras •••••••••••••••••••••••••••••••• : 7,976 6,295 7,021 11,232 23,438 19,607 4,939 2,686 Nicaragua .. ...................................... ' .................... : 19,181 21,814 24,547 33,578 47,340 24,474 8,423 3,932
b
Dominican Republic •••••••••••••••••••••••• : Haiti ••••••••••••••••••••••••••••••••••••• : Ireland ••••••••••••••••••••••••••••••••••• :
4,388 521
31,784
3,721 513
34,596
3,605 673
34,749
7,477 956
17,296
11,331 1,382
18,403
9,074 1,034
32,444
1,918 282
10,987
87 96 78
Mexico ••••• F.· ............................. : 33,112 40,581 43,433 48,222 51,862 32,292 6,305 1,914 Panama. ............... -......... ' ...... e''- .' ...........' .......' .....' ........ : 1,499 2,404 1,399 2,823 1,443 2,065 630 312 Belize ......................... -.......................... e'" .............. : 0 0 0 0 140 58 0 11 United Kingdom-Northern Ireland ••••••••••• : 2,535 2,312 1,166 40 185 1,370 206, 197
Total 11 •.•••••.••.••••••••••••••••••••••• ; 495,959 581,501 597,616 761,907 1,049,202 743,130 174,748 113,040
11 P.L. 88-482 (1964) provides for the imposition of quotas on fresh, chilled, or frozen beef, veal, mutton, and goat meat. Presh, ·chi11ed,. or frozen boneless beef accodnted for more than 90 percent of tne import volume in 1969-74 (95.8 percent in 1974). The data in this table include rejections by APHIS inspectors totaling 13.5 million pounds in 1969, 17.4 million pounds in 1970, 21.0 million pounds in 1971, 17.8 miUion pounds in 1972, and 18.4 million pounds in 1973.
11 Preliminary• 11 Totals may not add due to rounding~
o. ,.{,1~-......

Table 43.--U.S. agricultural imports: Value by commodity, July-February 1973/74 and 1974/75
JUly-FebruaryCommOdity or commodity group Chunge
1973/74 1974/75
-- Hi1lion dollars ~- .?~ Comp11)IJlentaty
Bananas; fresh .......... + .. ~ '- .............. ' It •• ': .27..............
Cocoa and chocolate: Cocoa benns • If, .................. " ................................................. : 143 Caean butter •••••••••••••••••••• ~ •• ' .... I •••••••••••• ~ 23 Coc!:>n cllld chocola.te, prepared ......................... : 51
Coffee: Coffee, sreen or crude •••.••••••••• , •••••••••••..••• : 1,040 Coffee, aoluble ......... ill ....... iI ............ '- .................... ~ 63
Druga t crude io ......... " ..... It ............... " ............... e I ...... ! 20 Essentinl 6118 •.•...••••••••••••••.•••.•..•••••••••••. : 43 Fibers, unmanufnctured .. "10 ............................. " II ........ ! 16 Rubber, crude:
R.ubber, crude, dry .. form ....••••.••.•••••••••. 1., ••••••• : 260 Rubber) latex .................. ., ••..•••.••.•.•..••... : 22
Silk" rtn-t ... i ••.•••.••• " ••••••••••• , •••••••• " •••• Ii ••••••• : 2 Spices •.. Ii ....................... ~ ................ Ii'........ : 48 Tea., crude ......... ~ .............. II ....................... : 45 '';001, carpt!t ••••.•••••••.••••.•••••••••••••••••••••••• : 23 Other complementary products •••••••• 111 34•• 111.111111.111.111111.111 •••• : __
-Totul complementary products 1;960•••••••••••••••••••••• :========== Supplementary
Animals and animal products: Cattle anG calves .•. ".. ".... i ................................... : 142 Daity products and eggs .................. II .............. : 315 Hides and skins, including furskins ••••••••••••••••• l 94 Mea.t and meat products, excluding poultry:
Beef and veal ............................ ".............. ".. : 925 l?ork ......................... II .............. " ............. : 326 Other ments and products ................... it ••••••• : 38
Sausage casings ......................... 10 •••••••• ~ .".: 19 '~ool, apparel ..•....... u ......................... 1, ••• : 18 Other animals und animal p~oducts ••••••••••••••••••• :_ 92
Total animals and animal products ••••••••••••••••• : ___ 1,969 :-
Cotton, raw, excluding linters .••...•..........••..••. : 6 Feeds and fodders It .............. ~ •• ••••••••••••••••••••• 35 FrUits and preparations ....... i ......................... : 126 Grains and preparations ................................. : 79 Nuts and ~reparations, edible .......................... : 101 Oi1seeds l oi1nuts, and products:
Coconut oil •••••..•. ".......................... "••..••.. : 72 Copra • II ............... It .......................... 1\0 •••••••• : 31 Olive oil; edible ............. '••••••• 23Ii ...... "" Ii. •••••••• :
Other o:l.lseeds and products ••••••••••••••••••••••••• : 117 Seeds, cut flowers, and nursery stock, excl. o:l.lseeds .: 52 Sugar and mOlasses:
Sugar, cane or beet ••••••••.• I\o ....................... ~ 648 Nolssses, inedible ..••.• !I •••• ••••••• ".jII •••••••••••• ~ 65_
Tobacco, unmanufactured •••....•••••.•••••••.••••••.••• ~ 124 Vegetables and prepa.rations .. i, ••• '•••••••••••••••••••• : 237 \{tnes and mal t beverages:
'~ines ••• "•••••• '" ................. ~ ...... •• '............. : 193 Malt beverages ......................................... t 37
Other supplementary vegetable products •••••••••••••••• t 80 Total supplementary products •••••••••••••••••••••• : 3,995
Total agricul tura,l "imports ,•••....••••••.•.......••...• : 5,955
Percent change computed on unrounded data.
~94-
130 +2
171 +20 40 +70 74 +45
796 -23 68 +8 31 +54 55 +28 38 +133
260 27 +22
2 +12 55 +15 54 +20 R -65
51 +50 1.860 -5
38 -73 165 -52
89 -6
481 -48 232 -29
25 -34 23 +21 14 -22
128 +39 1,195 -39
8 +37 32 -9
143 +13 126 +60
99 -3
200 +178 f 0 -100
29 +30 225 +92
70 +35
1, ',93 +177 72 +10
142 +14 227 -4
168 -13 51 +40
112 +40 4,692 +17
6,552 +10

Table 44.--Average unit values for principal imported agricultural products: July-February 1973/74 and 1974/75 and February 1974 and 1975
--------------------------~--------------.----------------July-February February
Commodity Unit 1973/74 1974/75 1974 1975
Dollars
Cattle, 200-700 1bs. ................................. No. 187.52 158.43 166.87 171.67 Cattle, 700 1bil. and over .......................... . -.4o: do. 583.79 533.45 594.54 422.71 SWine, live .... 404o4o4o4o4o .. It ................................ to .................. : do. 130.81 85.47 98.67 102.67 Beef, boneless, fresh or frozen •••••••••••••••••• : tb. .84 .54 .86 .46 l?ork hams and shoulders, canned ••••••••••••••••••• do. 1.36 1.09 1.27 1.20 Pork, frozen .. '" ................................ .............. . do. .71 .64 .65 .76.................... It '
Cheese.. Cheddar ............... '................................................ -.. do. .65 .70 .65 1.13 Cheese, Emmenthaler ••.••••••••.••.•••••.•••••••.. : do. .69 .83 .74 .91 Cheese, Edam and Gouda ••• ~ ••••••••••••••••••••••• : do. .71 .89 .74 .98 }li1k, dry, not over 3% butterfat •••••••••••••••••. do. .34 .42 .37 .52 Casein, excluding mixtures •••••••••••••••••••••••. do. .47 .67 .52 .62 Sheep and lamb skins •••••••••••••••••••••••••••••. do. 3.47 3.59 2.79 2.94 }link furskin3 ..................................................... 4o ................ . No. 16.98 16.35 17 .89 14.49 Wool, apparel -..................................................................... ~ .. G1b. 1.45 1.24 1.04 .70
Rble. 269.43 311.05 463.76 241.36Cotton, raw ............................... " ...... 4o ......................... -
Apples, fresh ........................................ . tb. .12 .13 .14 .14 Oranges, fresh ............ ., ........... '.............. : do. .08 .10 .06 .16 Oranges) canned, mandarin •..••..........•••. ', .... " do. .23 .27 .22 .22 Canteloupes, fresh ................................ : do. .08 .08 .09 .10 Pineapples, canned .................... '. '.... ~, .•.••. : do. .14 .19 .15 .20 Strawberries, frozen ••••••..•.•.••••••••••••••••. ~ dt'. .23 .23 .22 NA Brazil nuts, shelled .... ".... "... " •. '" " ...., ... ., .....• t do. .59 .73 .54 .48 Pistachio nuts, unshelled ••••••••••••••••••••••••. do. .88 1.07 .98 1.00 Cashe~~ nuts) shelled ••••••••••••••••••••••••••••• : do. .81 .91 .89 .82
Bu. 3.06 3.86 3.62 4.2lfBarley-, unmilled •••. "..... "••••.•• ., •• ., ••• "."" ...... : Biscuits, cake and wafers ........................ . t.b. .48 .60 .44 .60
.27Castor oil .......................... ".". '.•••.•.•.• " .. . do. .42 .28 .43 Coconut oil ...................... -. ..•...••..•..• " ... : do. .19 .47 .25 .37 Olive oil, edible ................................. do. .58 .83 .63 .81 Palm oil ..•...••....•. ,.••....•.... c- ••••••••••••••• do. .14 .24 .16 .28 Palm kernel oil ....••........•....•••••.•...•..••. do. .20 .42 .25 .35 Sugar, cane or beet ..• II ••••••• " ...... " • • • • • • • • • • • •• S. tOll 188.58 540.58 210.19 659.21 Molasses, inedible ••••..•.•.••..•.•.........•.••.. Gal. .28 .28 .22 .32 Cucumbers, fresh ••••••.••••..••••.•.••••••••••••. : Lb. .05 .05 .05 .05 Olives, in brine .................................. : Gal. 3.40 3.95 3.64 3.82 Onions, "fresh or dry •••••••••••••••••••••••••••••• tb. .09 .10 .07 .09 Peppers, fres'h ...................... ., ••...••. "..... do .. .11 .12 .10 .11 Squash, fresh •• "" ................ I.,,, I •••••• " •••••• do. .05 .05 .05 .05 Tomatoes, fresh •••••••.•..••••..•.•..•••........• ! do. .12 .1'2 .10 .11 Tomatoes, canned ............. -.............. ,.•••••... ~ do. .17 .20 .20 .20 Tomato poste and sauce .•• ~ ••••..••....••.....•.... do. .19 .39 .19 .42 Tobacco leaf, oriental ........................... : do. .61 .68 .62 .72
1.49 1.62 1.55 1. 78 Wine, still grape, less than 14% alcohol •••••••••• uo. 5.20 4.59 4.74 4.62 Bananas, fresh ......................... 11> ............. : t,b. .05 .05 .04 .05 Coffee, green ........................................ : do. .57 .58 .57 • oSti Coffee, roasted or ground ..• -....................... : do. .61 .74 .58 .86 Coffee, soluble ....................... -•..•..••.... : do. 1.42 1. 72 1.53 1.88 Cocoa beans ......................... \: ............. ". '.. t do. .52 .74 .54 .77 Cocoa butter -.................. '. . • . . . . • . .. .. • •• . .. . . .. .. .. do. 1.25 1.59 1.30 1.61 Lime oil ................................................. do .. 6.54 8.00 6.93 8.22 Sisal and henequin •••••••••••••••••••••••••••••••• t.ton 216.39 654.82 461.51 910.90 Rubber, natural, dry .......... 1: ••••••••••••••••• -•• : l~b. .29 .28 .32 .23 Rubber, natural, latex .• e.'•••••••••••••• ·, •••• '•••• : do. .26 .35 .28 .29 Pepper, unground, black •. ., ...... it ........... '• ....... • : do. .52 .74 .53 .77 Silk, raw .......................................... it ..... ! do. 14.42 11.n 10.93 10.41 Vanilla beans -. it • -••• I •••••••••••••••• " •••••• '••••• • ! do. 5.23 6.19 5.60 5.90 Tea, crude ..••.......•.. "................... ·.• '••..• : do. .40 .50 .40 .53 Wool-, cat'pet ., .........•..• -;-.-••.•.•••.••.•.•.•... : Glb . 1.07 .93 1.04 .70
Beer and ale ••••••.•..••••••••••••.•••••••••••••• : Gal.
.----~--------.-------.
-95
,')
"

i
I
i ! !
----
": r.~ n, "\ ,,- ~. \, ' " '''; ",;~ !' ,,-.. • ~: ~ '". ." n . ':, '..,:'
.- .............''"''.''"'"'',.J/,)..__......, ..____''---=..''-'',.,.._.;.,,-.\,'-~~...,............,~~___...., ~ __'.~,~_~ •••• ,;
Table 4S.--U.S. sugar imports: Quantity and value by month -, and average import unit values,
Ja nuary 1973 through February 1975 -\
:c
Year a'nd month Q,tta.ntity Value Unit Value
Short tons $1,000 ¢!Lb.
1973: Jan'lary ..........• 435,:/)1)0 71,879 8.3..... c
Febl.·uary ......... Ii ~ 292,445 48,942 8.4 March 444,869 72,055 8.1
......
............. Ii ...... :
@ April .....................· 477,367 80,313 8.4 May ................. " .......· 506,816 85,549 8.4 June ............................· 418,522 69,615 8.3 Jul.y' .......................... : 452,574 75,545 8.4 August · 570,622 100,451 8.8...... Ii ..............
September · 394,320 80,077 10.2Ii ...............
october .... " ..............· 219,588 39,244 8.9 November ·................. · 566,891 109,798 9.7 December .. " ................ 487 2280 21 2663 9.4
522662251+ 9252131 8.8
1974: January ....................· 243,573 45,892 9.4 February ..................· 499,749 105.040 10.5, , March ............... 553,657 124,681 11.3"
April ..................... 509,261 134,319 13.2 May ...........................· 512,145 154,826 15.1 June ...................· 491,676 155,559 1.5.8 Jul.y' ........................· 600.353 233,125 19.4 August ...................... 593,076 261,734 22.1 September ..... ~ 437,217 213,226 24.4 October .....................· 360,186 201,223 27.9 November ...................· 479,056 288,745 30.1 December ·................. · 4242416 337 2168 3~.1
r .......
: 5,774 l 365 22255 2538 19.5-
1975: January •........• : 149,616 124,027 41.4 February 203,049 133,851 33.0• ..... It ....... :
Source: U.S. Bureau of the Census.
$!S.ton
164.99 167.35 161.97 168.24 168.80 166.34 166.92 176.04 203.07 178.72 193.68 188.11 175.65
188.41 210.18 225.20 263.75 302.31 316.39 388.31 }~41.32 487.69 558.66 602.74 681.95 390.61
828.97 659.21
,,~
,--:1:
~~~,:)
-pi
-~
)~"
~
i
FA:rUS/FDR'J;)IGN AGRICUVrURAL ,TRADE OF 1'ijE: UNITED STATES, 1975, APRI,L.i WaShin9t;'~, DC, "Economic H'esearch Serv ice.USPA! FATUS~
APR 75 '

.0 :: Illp·8_1::::::::::::::: D~ W
111111====:= ~ I.:.l I~
1\111..bb L~
I\\\I~ 111111.4
2 5 \\\\1 .
2.0
16 11111 .

"'" '.; , , ,( ;'~:,'. ~.,.", ;.-: ';;:~:~,,; ,~'> " ' ~'~!" .r;~:~:: .>'-': ",";":' .... " ;c:' ,:~ :'.' l:l'~~'·'.i~t~.''':'Jf'·l'''''~· ;.':".~ , " '. '~:-:f~' ":;~"';';f~' ....~ t(:~~. ,:':.. ' ,~..~ ;.;:,~.~<::;-';. ::"',". '};o';,' - '.'~'" ~""~-'
,j.,~~~:1:~=~";;;'l~~~f>".-:.-....'t':":leI2'i'1tO:''''''''''·"'':~~~--=:t:~..·~""''.",,.c-''j¢ottItr'!M'-_~~tO S>',rtz~~"t;j77'mj¢9*",,='Ik""**i' (;'/ ~ '(J " .~
~. I
TABLE 46.--U.S. CANE OR BEET SUGAR IMPORTS: QUANTITY AND VALUE BY COUNTRY OF ORIGIN q
JULY-FEBRUARY FEBRUARY COM~ODITY IMPPRTED AND AREA/COUNTRYOE ORIGIN '~Nn:S QUANTITY VALUE QUANTITY VALUE
1'914 1915 '1/ l·~?~ 1975 1/ 1914 1915 1/ 1914 . 19;5 1/Si.lGAR, .CANE SHORT TONS 2/ DOLLARS DOLLARS CANliL)A 122 0 632 .. 0 ,577.085 .. Q 412 , 0 36S"645 M~XICO '201 ·334,789 :20S,424 661031,411 t26,364,331 . 9~,12~ 1."58 22,419,083 .80S~5~2GUATEMALA 205 '22,349 62,511 ·4,12av407 ,27,094.543 o o o . 0aaLIZE '20e 23,:551 28,836 4~012~1~9 .16,063.135 .41454 '7,382 846.<!7.2 .;l,95912~5
I I,EI. ,SALVADOR 211 51,958 40,301 ,9.286,824 .21,402.268 ~n9? 15,976 1.230,436 io,6~~;'708HONDURAS 21·5 0 8,17.8 . '0 '·4.676,012 , 0 r i:"o 6 1\100 ,)NIClaRAGUA 219 ·36,220 24,626 6,290,365 10,41·4,285 o 6,!599 . . 0 :?,~S',S~2 i'}COSTA RICA 223 ·59,184 43,S34 11.287,822 20;985,540 .5i982 o l,220t480 " 0 I ' P.ANAMA 225 l8,375 26,623 3;363,964 .15,127.198 2,115 8,092 453,984 5,2T4!t931 1 '~
.JAM,6ICA 242 ,6,321 37,6a6 h252,2~3 '22,365,761 ~_32i 7.512 1,252.263 ';,~72,o1'7 /'.. HAlTI 245 ,4.704 1'9,354 7.5797.22 6,822,861 o iI . 0 . 0DOMINICA~ REPU~~lC 241' 411;716 .338,150 1>5 .21·5 ,4~316? ,632 .139 40,.959 ·52,4i1 8,705,098 3~,9P;480TRINIDAO-TOBAGO 214 0 20.042 0 10,600,438 o o o o " 1 N~THfRLANOS ANTI~~ES 277 0 564 0 .361,5"j15 o 198 o U5~20090LOMSIII ' . .301 S2,139 "'6,363 15,',59;911 .38,967.ll!2 . o 1,470 o g~5.566VENEZUELA ,30'7 .16~2:)4 0 ;2~~300930' 0 .. 0 Ii . 0 o.b GUYANA ·31;2 ·47,450 36,250 ~,86O',5a4 :20,598~629 1(",712 o 3,910,920 o";' ECUADOR ·331 61;629 58,945 10,812,47.4 ,J6~236,S64 o 9 , 0 4;40'6
P.E~U 333 299,667 293,772 56,48(",211 Z,3h89h435 36n29 28,760 7,175,4'1'2 la,70~.643eO~IVIA 335 '7,387 ,3,31'9 1,464,7~1 1;786,583 o • 0 . 0 • 0~I{AZIL ·351 -439,328 .548,370 85,891,501353,094,202 13~_6~~ 12,099 28,475,614 '~"'9,o66P~RjlGUAY ,353 0 8,256 '0 ' 5,448,926 o o o oARGENTlI';A ·:557 86.529 lJ;2.7.41 16,O25,3~6 .67,781.418 24 5,814 ·4;345 ·~;247·;147S... EOEN ·40i 0' '2 ·0 1,084 o o o oUI~ITED KINGDOM 4);2 1,643 0 183,330 0 ii o o oIRELAND ,41'9 1,035 0 ;228,735 0' o o o oNETHERLANDS 421 1 0 3lt3 0 o o o oGERMANY WEST 428 2 0 1,166. 0 o o o o1l'>j0 I A 533 'Slr'+18 82,104 q;S8f~6a8 32t'79h7S1 o 3. o 2,409tMAILANO ·549 18;77.2 12,lQ2 l;158,8?33,37h291 o o _ _ 0 , 0 PHiLIPRINES ·565 930~556 774,61-4 I7h814,O'?6~62,525;2!?0 9~;21~ 54,ii!56 18,934,142 3~o?25.94TP~OPLES REP O~ .CHINA .570 0 1 0 ·416 o o , 0 oQHINA,REP OF(TAIWAN) 583 28,109 42,928 ,5;930,9~5 .36,342,09; 28,109 o S,930,925 o.JAPAN j5S8 1 0 4149 o o o o .:.'~AUSTRALIA ·602 245;728 :231,381 ·48,106,377 1·42 ..967 f 958 o o oOTHER eAC ~S~~, NEC 686 '42~~9S ,3;3,71:2 8,819,435 '.28t69?,,635 o Q °o o ~JM!\IJRITIUS AND IlEP 784 li3.216 ,3lt808 :2,844,8~2 16,61,3,1·49 o o o oi'loZAMBl"UE ' 787 0 ,.8,398 o· 5,039,051 o o o o . Hi\I.~GASYREPuiL·IC 788 0 1'2,645 6.64&,422 . 0.' 0 , ,0 oR~PSOUTH AFR~~A 791 :35,826 ·44,049 '7,471,183 27.794,51;3 22;509 o° 4,880,049 oSwAzI\,.AND 795 '28,'771 31,199 ·5 ;832 ;7if2 IT "71'7,426 o o .o' oM~LAWI 797 . 26,,968 1:5';645 .4,Eii7,6ri if;296,621 o i) o o TOT.41. WORl.D ~,434,598 ;3,3~6,966 647n09,(j~41193,098, 190 499n4~ 203,048 1050039J703 h3,~50~7.4
1/ PRELIMINARY. 2/ IMPORTS FOR CONSUMPTION; TEL QUEL OR ~CTrrAL WEIGHT BASIS.
",.j,>!. '(;:>">".:~:f,,~~;>; ':'t).t:,1.~",-,j.;:-,:;:;::-,,; ~ ? -~~: '<::i"" .~~"~ ,,,,.>,. .: ,;::.':.",'';;I,>;,.,;:·i~v"' -; ,{ _
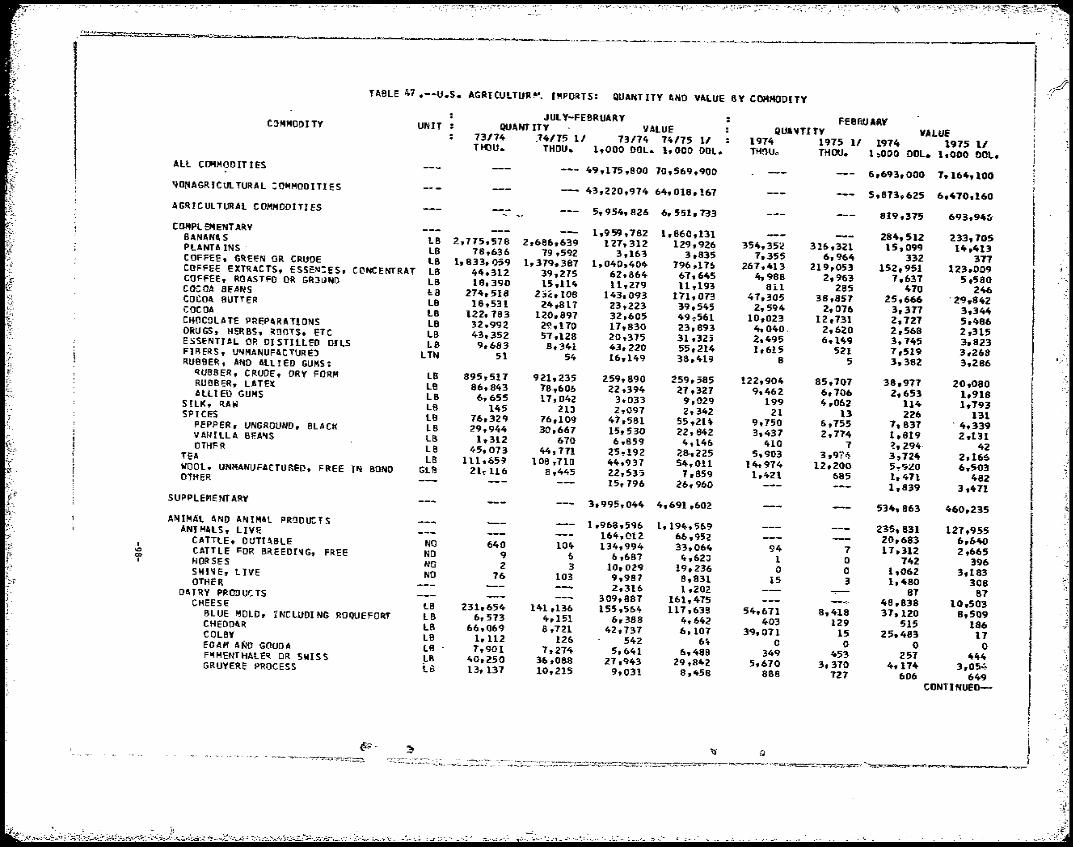
TABLE 47 .--U.S. AGRICULTUIU~. IMPORTS: QUANTITY AND VALUE BY COMMODITY
J JULY-FEBRUARY FEBfUJARYCOMMODITY UNIT QUANTITY t,VALUE QUA'HlTV VALUE73174 ,14/75 11 73174 1H15 11 1974 1915 11 1914 1975 11 ITIf3U. THOU. 1,000 DOL. 1.000 DOL. TH!)Uo THOU. 1.000 DOL. 1,000 DOL. 1ALL COMMOOIT IES
49,175,BOO 70.569,900 6,693,000 7,164,100 I~ONAGRICULTURAL :OMMODITIES 43,220,974 64,018,167 5,873,625 6,470,160 IAGRICULTURAL COMMODITIES
5,954,826 6,551,733 819,315 693,94:i COMPL EMENTARY
1,959,782 I,B60,131BANANAS lB 284,512 23,3.7052.775.578 2,686,639 121.312 129,926 354,352PLANTA INS' lB 316,321 15.099 14,41378,636 79,592 3,163 3,835 7.355 6,964COFFEE. GREEN OR CRUOE LB 332 3771,833,059 1,319,387 1.040,404 196,116 261,413 219,053 152,951COFFEE EXTRACTS. ESSE~:ES. CONCENTRAT LB 123,009 COFFEE, ROASTED OR GRJUND LB 2,963 7,637 5,580
44,312 39,275 62,864 67,645 4,98818,390 15 ,11ft 11,279 11,193 Bll 285COCOA BEANS lB 470 246274,518 232,108 143.093 111,013 47,305COCOA BUTTER lB 38,851 2S,666 , 29,84218,531 24,811 23.223 39,5ft5 2,594 2,076COCOA lB 3,377 3,344122,183 120,897 32.605 49~561 10,023 12,731CHOCDlATE PREPlRATlONS LB 2,727 5,48632,992 2~,170 11,B30 23,893 4,040, 2,620 2,568DRUGS. HERBS. ROOTS. ETC LB 2,31543,352 57,128 20.375 31,32:; 2,495 6,149ESSENTIAL OR DISTILLED OILS LB 3,745 3,8239,683 8,341 43,220 55,214 1,615FIRERS. U~MANUFACiURE) LTN 521 1,519 3,26851 5ft 16.1ft9 38,419 8RUBBER. AND ALLIED GUMS: 5 3.382 3,286
RUBBER, CRUDE, DRY FORM lB 895,517 921,235 259.890 259,5B5 122.904 85,707 38,977RUBBER. LATElC LB 20,08086,843 78 .•606 22,394 27,321 9.462ALLI ED GUMS LB 6,706 2,653 1,9186,655. 17,042 3.033 9,029SILK, RAW LB 199 4,062 114 1,793145 21:) 2,097 2,342SPICES LB 21 13 226 13116,329 76,109 41,581 55.2H 9,750 6,755PEPPER. UNGROUND, BLAC/( L8 7, B37 - 4,33929,944 30,667 15,530 22.842 3.437 2,774 1,819V AN ILL A BF.MIS LB 2,1311,312 670 6.859 4,146 410OTHFR lB 7 ~. 294- 4245,073 44,111 25,192 (1)" 225 5.903 3 ,9i'~TE~ LB 3,724 2,16!>111,659 lOB ,710 44,937 54,011 14,974 12,200WOOL, UNMANUF~CTUREO. FREE IN BONO GLB 5.';lO 6,503210116 8,ft45 22,535 1,B59 1,421OTHER 685 1,471 48215,796 26,960 1,839 3,411 SUPPLEME NT ARY
3,995,044 4,691,602 534,863 460,235 ANIMAL AND ANIMal PRODUCTS 1,969,596 1,194,569ANIMALS, LIVE 235. B31 121,955164,012 66,952
I CATTLE. DUTIABLE 20,683 6,6~ \0
NO 640 10ft 134,994 33,064 94 ():) CATTLE FOR BREEOI,'lG, FREE NO 7 17,312 2,6659 6I 6,6B7 ft,62JHORSES 1 o 742 396NO 2 3 10,029 19,236 oSWI'l E, l lVE o 1,062 3,183NO 76 103 9,9B7 8,831OTHER 15 3 1,480 3082,316 1,202DArRY PRODUCTS 81 87309,8B7 161.475CHEESE 48.838 10,503lB 231.654 141,136 155,564 117,63S 54,671 B.418BLUE MOLD, ~NCLUDING ROQUEFORT 31.120 8,509LB 6,513 4,151 6,388 4.642 403CHEDDAR 129 515LB 66.069 6,721 42,737 6,107 39,071
186 COLBY 15 25.483 17LB 1,112 126 542 6ftEDAM AND GOUDA o o oLB 1,901 1,274 5,641 6,48B 349
o EMMENTHALE~ OR SWISS 453 257 444LB 40,250 36,088 27.943 29,B42 5,670 3,370GRUYERE PROCESS 4,174 3,054i..6 13, 137 10,215 9,031 8,458 888 127 606 649
CONTINUED
(fo:" ~ 'Ii' t)<~"'" --,-,-,.,- '-'I-~'."."...~-r',..~•.'7r~';'~:~::::z...,~

sr:;....~~~I~~lWpt~1~~~~~·m:",i i.I, "\i~:C*~;{5'A :,~t'1--~~~ .~.
TABLE 47.--U.S. AGRICUL,URAL IMPORTS: QUANTITY AND VALUE BY COMMODITY--CONTINUED
JULY-FE8RUARYC:l.'!"'C1DITY UNIT : QUANTITY FEBRUARYVALUE73/74 QUANTITY74175 11 VALUE73174 74175 11 1974THOIJ. 1975 11 1'.174-THOU. 1,000 DOL. 1.000 DOL. THOU. THOU.
1975 11 ROMANO, REGGI AND, PAR MESANO 1,000 DOl. 1,000 DOL.
LB 6.539DECORINO ~~O SHEEPMTLK 5,085 6,029 5,671OTHER LIl 13,948 12,681 11,480 15,005
970 337 847 4171,147 1,417BUTTER 45,772 41,361 1,033 1,680L8 54,572 348 4,204 2.060CASETN AND ~IXTURES 30,757 240LB 86,584 7tt8 1NONFAT DRY MI LK 54,719 40,869 37,732 12,936
266 0 OTHER 2,957 64.388 6,641 1,83BLB 192,195 2,586
1,227 8,398 3,127HIDES AND SK INS, INCLJ) ING FURSKINS 18,310 4,638 81 42
1,685:ALF AND KIP SKINS 94.314 88,985 114LB 3,399 1,867 IB,874CATTLE HIDES, WHOLE 2,335 1,354 15,663LB 27,388 81 54GOAT liND Kro SK INS 15,871 8,919 54 45LB 877 3,376 1,945 1,264 577SHEEP A~D LA"!B SKJNS 840 1.238 1,150 175LB 16,798 132 144FURSK INS 24,227 24,554 3&,959 1,714
187 1973,355OTHFR 51,607 42,307 2,224 4,690
14,945 10,027~E4T AND MEAT PREPARATIONS 5.661 3,838LB 1,378,786 1,076,176 886BEEF AND VEAL 1,288,662 737,799 529136,920CANNFO LB 1,068,346 825,014 925,100 481,261 94,B33 13a,844 132,524 80,800
L8 67,996 102,308FRESH OR FROZ=·.., 47,202 .61, 833 47,365 6,331 85,622 49,404
PREPARED OR PRESERVED LB 958~OBO 758,40'> 812,325 413,4077 81,748 3,351 6,654 2,919LB 42,269 19,408 97,61B 70,286~UTTON, GOAT, AND LAMB 50,941 20,419 45,201
J>ORK LB 17,043 7,976 6,751f. 1,339 8,68211,057 5,4!:l3 2,2U, 1,283LB 266,761 225,567 1,660 1, 561FRESH OR FROZEN 326,355 231 ,7'>3 986LB 36,353 25,37044,391 27,562 41,627HAMS AND SHOULDERS.CND,C~OKED.ETC LB 31,871 18,186 6,6~4 3,011 28,942
OTHER 203,796 183,2118 276,125 4,443 2,320LB 199,53'> 27,614 21,35118,573 14,717 35,142OTHER 18.359 14,022 25,551LB 2,04626,636 1,008 2,042POULTRY AND POJLTRY !>RODUCTS 17,620 26,152 19,341 lv0653,507 1,507 3,715BABY CHICKS 17,652 14,335 1,468NO 2,065 1,449 1,107 2,141 1,576FGGS, DRIED JR OTHE~WISE PRESERVED 1,237LB 24 134 163EGGS I N SHELL 21 18 23 130 155DOZ 8,625 10,020 3 1 2FEATHERS AND DOWNS, :RUDE, SORTED 4,939 3,877 1,259 2LB 5,664 964POULTRY MEAT 3,847 10,462 8,3B3 534
6~8 371 OTHER 91.5 323 1.127 1,186 1,008LB 424
815 125 8OTHER ANIMAL PRODUCTS o 125 40 BEESWAX 94,068 125,023
o 0 0 BONES. HOOFS,. AND HORNS LB 2,113 2,4;)0 1,823 3,490 295 151
12,770 12.774
I 280BRISTLES, CRJDE OR PREPARED 2,223 6.026 202 I LB 6.193 210 126FATS, OILS, AND GREASES LB 2,142 1,285 9,140 114 803 i I '" I
I
GELATiN 15,340 18,009 3,132 4.924 1,204 3,021 1,065 5~6'" HAIR, UNMANUFACTURED 14,119 214- 81934.176LB 3,078 2,410 2,108SAUSAGE CASIIIIGS 4,777 2.9663.593 186OSSEIN 18.866 70 527 20323,029
RENNET LIl 7,312 10,919 3,413 2,112 1,965LB 1.917 5861,144 1.777 287WOJL,UNMANUFACTURED,EX 1,248 1,993 1,465FREE IN BOND GLB 2,126 138OTHER 12,631 11 ,5B 18,253 139 168 35814,322 2,908 1,336 4,41916,330 19,168 1,519 V EGET ASL E PRODUCTS 1,416 1,959
2,026,448 3,497.033 COTTON, UNMANUFACTUREO 332,280299,033
RBAcorrON, RAw 49 42 7,427 9,610RBA 2l. 5 2LINTERS 25 5,701 7,817 1,173 463RBA 3 128 17 1,726 1,793 2 1,575 347
1 198 117 CONTINUEO-
G
'~","""-
'- ....__ . ---_._ .. ~--"~--~----.-----.,....-~~"--~.-~-~-.-

(r' ,
TA6LE 47.--U.S. AGRICULTURAL IMPORTS: QUANTITY AND VALUE BY CO~M~OITY--CONTINUEO
JULY-FEBRUARY FEBRUARYCJ"MOOITY UNIT : QUANTITY VALue QUMITITY VALUE73/74 74/75 11 73174 74175 1/ 1974 1975 1/ 1974 1975 11THOU. THOU. 1,000 DOL. 1,000 DOL. THOU. THOU. 1.000 DOL. 1.000 DOL.
FRUITS AND PREPARATIONS 126.274 142,978 19,266 19.405APPL ES, F~ES" Le 49,071 38,230 6,033 4,995 10,335 5,743 I.~O eOIAPPL ES. PREPARED OR PRESERVED L8 7,457 8,811 1,478 1 t871 1.299 542 259 136APPLE AND PEAR JUICES GAL 15,100 16,705 11.377 6.739 1.833 1.546 1,245 539APRICOTS LB 3,298 3,789 1.631 2,025 475 64 224 61BLUEBERRIES LB 11,552 6.536 4,325 1,978 605' 90 285 41STRAWBERRIES L8 67,458 68,184 14,386 15.444 17,510 18,815 3.398 4,171OTHER BERR IES LB 15,943 13,139 3,773 3,335 394 79 161 .26CH'ERRIES INCLUDING GLACE LB 3.B94 2,433 10 788 1,334 170 15 61 32OATES LB 27,496 24.029 3,463 4.19) 15.091 11.996 1,899 2.1.66FIGS~ INCLUDING PASTE LB 10,907 10,597 3.407 3.495 3,401 1.647 995 . 516GRAPEFRUIT, FRESH LB 9.746 1.732 1,721 1.219. 811 509 189 88GRAP ES, INCLUDING RAISINS LB 11,155 10,567 2,568 1,448 405 25 167 13GRAPE JUICE GAL 5,547 2,852 3,837 2.092 232 443 190 290MA~GO:S LB 5,525 7,611 1,3~7 1,71T 259 731 62 193MELONS LB 28,510 26.729 1,346 1,428 10,311 8,6073 593 448ORANGE, MANDARIN, CftNNED LIl 49.794 60,312 11.627 16,451 2,695 2,586 647ORAt>lGE, FRESH LB 80,602 67,452 6.349 6,173 561
3,OBO 539 lB7 88ORANGE JUICE, CONCENTRATED GAL 19,866 12,936 7.782 5,066 1,411 3.831PEAR S, FRESH 578 1041BL8 660 3,341 137 578 17 125 3 17PE~RS. PREPARED OR PRESERVED LB 273 114 78 83 2 4PINEAPPLES, FRESH LB 1,379 2,512 1 4
1,019 1.324 227 616 143 189pr~EAPpLES. C~D, PREP OR PRES LB 149,615 206,124 20,991 39.647 29,153 22,870 4.448 4.624PINEAPPLE JUICE GAl: 5,924 7,39(1 1,390 1,873 765 503 185 160JEllIES AND JAMS La 5,475 9,209 2.118 3.880 435 874 152 439OTHER 12.243 13,988 -- 1.752 2,384NUTS AND PREPARATIONS 101,403 98,656 13.100 5,796ALMONDS La 117 61 U8 71 0 0 1 1BRAZIL NUTS LB 27,998 11,193 10.776 8,080 1,396 760 751 336CASHEW ~IUTS LB 63,645 53,299 52.006 48.621 8,332 3.256 7,445 -2,665CHESTNUTS LB 12,361 7.912 4,533 3,448 177 66 73 30COCONUT HEAT, FR, PREP, OR PRES LB 74.928 55,615 16.304 23.700 9,656 5,905 2,621FILBERTS 2.2llLa 9,442 1.998 5,683 1,3ft4 1,221 130 145 117PIST ACHE NUTS LB 10,907 10.289 9.616 10,846 1,197 93 1,180 110WALNUTS LB 212 34 177 23 17 0 II 0OTHER 2.131 2.517 272 325GRAINS ANO PREPARATIONS 79,041 126,202 7,199 9,884...I BARLEY au 5,652 12,946 17,286 1t9.9n 213 4350 172 1.846BARLEY MALT0 CWT 144 409 1,148 4,929 4 86 51 1:,127I COR~, EXCLUDING SEE~ BU 731 171 2,103 2.896 24 48 82 222OATS BU 161 154 272 281 11 4 19 6RICE La 9.682 2,041 994 589 128 207 '14 93RYE BU 0 23 0 62 0 a O· 0WHEAT, EXCLUDING SEED BU 41 455 llO 2.230WHEAT FLOUR CIIT 25 156 0 2 0 14
272 2.480 1 15 0 260WHEAT GLUTEN lB 11.193 19.321 5,721 7.267 2.080 1,650 812 512BISCUITS. CAKES. WAFERS, ETC LB 61.643 55,466 29,391 33,145 7 •.095 5,018 3.091 3,023BREAD CRUMBS LB 21,356 19.898 4,414 4,707 1.938 1,36.6 435 360BREAD. YEAST-LEAVENED LB 3.337 3.490 1.009 1,126 416 262 129 . 94 . CONTI NUED" ~.'
~"'".. ... ',), Cl" '--~'~~7..%~~.

:" ':~.";::;~:;'::~:.':~'i,{py;1:'.;:7- .;..~" -:"-,",."",-.-,:.~, . - ; ".' -:.....~, :'.<··:-:!:;':"f~~::>:;~~.:;"'~; '··'~''->·':;·;;·!:.'~~·J~~;,~,.;.t ;9,""";y;..~,::·:;;
~~o.;\;:=: _--*' d ...'t'!1!1i-'~-::a.t~~~~I"'~~~Ill~}~"!:<!t:rt..~tt<1~-e-~w:<t¢1:7~~"~.~~~
f~~~' oJ ~ )
TABLE 47.--U.S. AGRICULTURAL IMPORTS: QUANTITY AND VALUE BY COMMODITY--CONTINUEO
JUL Y-FEilRUARY FEBRUARY :JM~IODtTY UNIT QUANTITY VALUE QUAIITITY VAl..UE
73/74 74/75 11 73174 74175 11 197ft 1975 11 1974. 1975 11 THOU. THOU. 1,000 DOL. 1,000 DOL. THOU. THOU. 1,000 DOL. 1,000 DOL.
MACARONI, SPAGHETTI, ETC L6 30,346 32,216 8,505 11 ,018 3,6~1 4,904 1,100 1,639OT-t!: R 7,816 5,491t 628 629
OIlBEARING MATERIALS A~D PRODUCTS 242,552 453,903 21,945 4S.245 OIL CAKE AND MEAL STN 17 6 1,424 693 3 o 409 17 QIlSE~DS AND OIlNUTS 46,239 210 752 3,951 3,301 i
Cr:)PRA la 193,666 31.265 o o o o o MUSTARD S~EDS LB 45.170 40,234° 4,426 9,247 6.848 1t.352 807 975 SESAME SEE) LB 32,472 25,158 8,277 9,113 1l,21n 4.682 2.839 1,948POPpy SEED CWT 31 26 909 1.316 4 3 121 189 ISUNFLOWER SEED La 1.540 1,931 189 342 222 58 30 20 OTHER 1,173 1,735 153 :'69
VE:;"TABlE OILS AND WAXES LEI ~59, 113 1,128,363 194,8119 431,458 83,790 127,467 23,585 41,926CUNAl/BA WAX LB 5,508 I3,865 2,595 5.031 536 600 407 585 BABASSU OIL LB 9,504 18,921 2,998 7.943 8,798 2,786 o CASTOR OIL LB 79,531 72,B19 33.580 20,545 9,492 9,408° 4,121 2,555 I COCONUT OIL LB 373,663 425,336 71,998 200,389 25,296 40,542 6.368 15,150 \ OLIVE OIL, EDIBLE LB 39,037 35,457 22,548 29.366 4,023 2.020 2,518 1.639 l P~LM OIL L6 228,808 405,032 33,026 99,202 18.775 56.080 3,011 15.446 ,.jPALM KERNEL OfL lB 86,731 105,420 17.666 43,999 14.046 15.191 3,453 5,360 I~}RAPESEED OIL la 8,257 11,028 1.709 3,859 300 431 70 178 -{~;"; SESAME OIL LB 1,513 1,426 785 1,114 98 48 6! 46 TUNG OIL La 7.322 19.339 1,340 5,055 o 1,835 o 392 OTHER La 19,235 29 ,71~ 6.646 14,895 2.425 1,313 791 576
SUGAR AND RELATED PRODJCTS 748.126 1,925,318 114,552 149.529 SU:;~R STN 3,435 3,317 647,710 1,793,098 500 203 105.040 133,851MOLASSES, INEDIBLE GAL 234.010 2,57,257 61t ,879 71,682 25.752 25.396 5.778 8,138MAPLE SUGAR ANO SIRUP La 7,063 5,928 4,198 3,354 830 535 537 339 CONFECTIONERY PRODlCTS LB 62.106 14,030 26,985 41.927 6,745 6.819 - 2,389 4,730HONEY La 7.343 22,813 2,770 8,882 1,228 3,096 472 1,113OTHER 1,584 6,374 337 1,358
VEGETABLES AND PREPARATIONS 236,960 226,842 49,321 39,186FRESH OR FROZEN:
ASPARAGUS LB 3,713 3.786 715 1,069 2.536 1,367 517 618BFANS LB 9,792 5,968 1,181 &91 4,373 3,056 452 324 CII R.ROT S LB 45,971 59,636 1.856 3,270 5,389 1.893 137 83 CUCUMB ER S LB 132,049 80,125 6,451 3.791 58,819 40.419 2,655 1,877
I OASHEENS LB 16y 479 16.500 2.013 2,l7!> 1,71t6 1,443 193 205.... E:;GPlANTa La 19,937 11,558 1,223 597 7,022 4,594 356 231.... I GARL Ie La 9.719 9,885 2,938 2,1t0!> 1,344 1.618 415 51jJ
LETTUCE lB 1,457 3.176 170 328 4 29 o 5 a~ IONS LB 59,473 42,594 5,167 4,691 20,079 15,746 1,534 1,731PEAS lB '7, 141 6,097 1,519 1,501 2.519 1,999 467 395PEpPERS La 58,658 28,736 6,426 3,590 27,791 13,567 2,828 1,548POTATOES. ~HITE O. IRISH CWT 858 713 4,273 2,623 257 167 1,472 633 SQUASH LB 2B,789 20,150 1,559 1,050 12,768 10.615 641 551 TOMATOES LB 278,991 152,538 32,859 18,55:' 137,440 85,683 13,862 9,305TURNIPS OR RUTABAGAS CWT 613 633 3,632 4.242 86 90 466 576 OTHER 6,753 8,882 961 1,481;
CONTINUED-
,"","""'=~="W"=~··'d __'_ .- ___.. -'._ J

I
'~«"" __'_«__'~'_~~________ 'O"__ '"_'.'.'_"'__ " '««,.------'--«''-'-----.•,,----"'----"-"--,'-l
[TABLE 47.--U.S. AGRICULTURAL IMPORTS: QUANTITY AND VALJE BY COMMOOITY--CDNTINUED
JULY-FEBRUARY FEBRUARYC)'1HDDHY UNIT: QUANTITY VALUE QUANTITY VALUE
PREPARED OR PRESERVED: ARTICHOKES LB AS PARAGUS LB BEANS, DRY. INCLUDING MUNG L8 CASSAVA, FLOUR, STARCH AND TAPIOC lB CHICKPEAS LB HOPS L8 MUSHROOMS, INCLUDING DRIED LB OLIVES, IN BRINE GAL ONIONS LB PEAS, EX DRIED LB PICKLEO VEGETA8lES LB PIMENTOS, CANNED LB TOMATOES LB TOMATO PASTE AND SAUCE LB WATERCHESTNUTS L8 OTHER
OTHER VEGETABLE PRODUCTS BROOMCORN STN CUT FLOWERS ESSENTIAL OR DISTILLED OILS LB FEEDS AND FOJDERS,EX OIL CAKE & MEA ---FLAVORING EXTRACTS JUTE AND JUTE BUTTS, UNMANIJFACTUREO lTN MALT LIQUORS GAL NURS ERY AND r,REE"lHO~S ESTOCK SEEDS, EXCEPT OILSEEDS LB SPICES LB TOBACCO, UNMANUFACTURED LB WINES GAL OTHER
11 PRELIMINARY
73174 THOU.
9,685 8,819
31.801 84.124 10,615 10,164 32,794 11,206
4.157 5.225
34,484 9,485
55,237 65,566 12,241
9
967
17 24,628
30,611 25,033
199,196 35,340
74175 11 nlClJ.
8,165 2,730
22,201 99,698 6.529
12,900 31.748 9,989 5,247 8,115
28,284 9.455
45,806 17,100
5,851
8
1,600
17 31,656
40,454 19,143
212,655 34,247
73114 1,000 DOL.
3,.792 3,327 6.634 4.505 1,681
12,475 23.864 38.135 1,578 1,082 4,452 4,022 9.191
12,737 2.220
19.528 484,665
6,334 10,758
3,142 34,894 5,203 2,690
36,742 22,203 18,714 10,695
123,760 192,529
17,002
74175 1/ 1,000 DOL.
3,121 1,526 6,451 1,201 1,266
16,203 25,968 39,43& 2,132 2,112 5,065 4 ,96~ 8,967 6,7H 1,530
23,708 513,52~
8.149 12,645 5,071
31,831 6,509 2,824
51,335 25,915 30.793 10,671
141,544 167,616
18,621
1974 ncu.
390 731
10,291 16,554 2,296 2,361 2,948
932 400 840
4,276 3,287 7,589 6,448 2,517
1
84
2 2,443
6,030 6,340
42.977 3,163
1975 1/ THOU.
592 82
3,040 6,412
291 2,562 3,043 1,013
523 1,031 2,405 2,065 5,663 2,172
319
1
108
3 3,577
7,289 2,384
25,984 2.910
1974 1,000 DOL.
no 283
2,864 987 341
2,846 2,086 3,388
160 200 574
1,346 1,523 1,252
469 2,931
65,876 614
1,479 455
' 5.030 59!j 255
3,785 1.869 3,435 2,951
26,984 16,227
2,197
1975 11 1.000 DOL.
220 't8
604 418 61
3,294 2,170 3,865
219 277 603
1.213 1,127
902 121
2.778 62,772
777 1,483
493 3,609
859 1,101 6,358 2,082 9,570 1,416
17.943 14,631
2,448
I... 2 I
<"" ., '"~.. ) JI '--~~ "'=·>\~~~:~!Z~::;:,=:,:-.:::::;:;:;o:::?;;,=:=-~~-».....,,~,..~,:Z;~9:7.~~_.... ~,,_'A~,.... ""' ~"'~==C"'''''-'''_?/.7'''~~~~,~~~ ::>._ ..,...-.""".

••••••••••
11 "'~~~I,*~ ",,="·r-·~"'~·· ··~rm::::t""'''~~~~-:~~~~~:~~~~~~~'t~~~'~<~~A:,~
, - ,\ fI'""".7 V iIJ II
Table 48. --U.S. agricultural exports and imports: Va lue by country, JulY-February 1973/74 and 1974/75
Exports Imports .. country Exports Importscountry
1973/74 1974/75 1973/74 1974/75 1973/74 1974/75 1973/74 1974/75
-- l..SifiQ ~ - .. --l..QQQ~ --World ].J •• : .......................... : 13,688,044 15,027 ,057 5,954,860 6,551,733 :: Europe--Continued :
Major Trade Blocs: 60,761 67,200 13,361 14,399ct.CM ••••••••••••••••••••••••••••••• ~~ ~~~:~:: ::::::::::::: :::::::::::: :::72,629 95,215 348,018 378,270 80,110 79,843 13,195 13,944•• Finland •••••••••••••••••••••••••••• ,IAFTA ............................. . 1,145,918 1,281,437 1,495,841 17 ,459 34,7711,770,068 14,953 I;}, 565EC-9 .............................. . 3,443,823 3,828,529 838,222 .. Denmark ............................... : 99,566 69,543 175,658739,603 131,607EASTERN EUROPE, EXCL. USSR ......... : 459,589 381,421 117,454 : : United Kingdom ..................... : 474,278 441,441104,566 59,905 71,101:: Ireland .......................... ": 26,114 17,525 65,166 17,572
Greenland •••••••••••••••••••••••••••• : o o 1 a • • Netherlands •••••••••••••••••••••••• : 959,612 1,206,150 173,785 164,537Canada ZJ •••••••••••••••••••••••••••• : 760,783 Belgium-Luxembourg ••••••••••••••••• : 158,489842,876 368,101 329,127 180,219 28,094 21,151Miquelon and St. Pierre Islands •••••• : France .... ". '*" .. , ........................ : 269,52759 24 o o 333,933 162,252 138,135Mexico " ••••••• '" ••••••••••••••••••• ; 330,764 618,603 412,040 372,998 West Germany ............................ : 963,532 1,043,312 88,120 93,452East Germany ................................. : 24,359 5,692 107 527Central America ...................... : 98,198 138,316 367,229 ... Austria ................. 9 : 12,326 7,119 11,603 11,742
Guatemala .......................... : 17 ,285 30,093 89,267 ~22 ,821 :: Czechoslovakia .•••••••••••••••••••• : 38,062 21,109 1,078 1,135
Belize ............................. : 2,215 2,725 4,574 114,822:: Hungary ••••••••••••••••••••••••.••• , 16,625 26,623 6,238 7,429
El Salvador ........................ . 18,545 17,248 :: Switzerland •• '" • '" •.••••••.•••••• : 105,12321,020 55,756 113,991 21,623 22,544Honduras .................... ~ ................................ : 9,351 75,319 :: Estonia ••••••••••••••••••••.••••••• : o 114,636 74,852 a oNicaragua .......................... : 49,697:: Latvia ............................. : Costa Rica .......................................... _ ...... : 43,104 :: Lithuania ••••••.•••••••••••••••••.• :
11,703 11,035 53,473 o o 29 o 15,745 18,431 74,670 o 9 (J o panama ......................................... '0 .. 95,328 :: Poland ••••••••••••••••••••••••••••• :23,354 40,376 14,572 212,751 162,4!:4 66,194 55,343
Canal Zone •••••••••••••••••••••••••• 27,283 :: USSR ••••••••••••..•••••••••••••••.• :o o 65 401,338 247,959 4,430 6,61420:: Azores .............................. : 669 181 43 31Ca~ibbean ............................ . 201,756 242,856 :: Spain .............................. : 367,069 535,815158,756 107,388 111,0148,488 11,040 10 91,612 182,878 32,660 27,393
,!. Bermuda •••••••• ~ ......................... : 296,328 ;; portugal ........................... : S Bahamas .............................. : 3.. Gibraltal; .................... '" ... :27,255 30,819 279 64 55 20 1I Cuba ••••••••••••••••••••••••••••••• : 423 ;; Molta-Gozo ......................... :o 2,117 2,2327 a 1 oJamaica •••••••••••••••••••••••••••• : a .. Italy •••••••••••••••••••••••.•••••• :47,017 49,833 3,673 492,704 536,404 85,243 102,050Haiti .............................. : 27,534 :: yugoslavia ••••••.•••••••••••••••••• :12,184 19,362 13,219 109,561 43,156 33,281 31,115Dominican Republic ••••••••••••••••• : 20,119 :: Albania ............................ :53,352 61,731 210136,895 632 266 73Leeward-Windward Islands ••••••••••• : 228,023 " Greece ........................... ".6,566 6,533 135,040 69,382737 21,584 24,317Barbados ........................... 0.0: 446:: Romania ......... " •••••.••••.••.•• -:5,234 5,216 870 56,204 105,442 7,673 6,721Trinidad-Tobago •••••••••••••••••••• : 416:: Bulgaria .......................... .;22,189 1,81835,126 1,817 14 239 :: • 16,272 2,617 2;222Netherlands Antilles ••••••••••••••• : 17,256 20,229 1,115French West Indies ••••••••••••••••• : 2,215 2,960 141· 5,1~.9,640 5,847,845 !fIlG,208 1,490,7445 :O~~ : :Asi:rk~;'::::::::::::::::::::::::::::: ~ 57,220 110,485 60,566 53,851South America ........................ I : : Cyprus ••••.••••. ~ .......... It ., It.., ...... :.... It ....829,493 680,282 1,094,316 1 420 132 :: 15,464 3,457 ~83 294ColOmbia ••••••••••••••••••••••••••• , Syrian Arab Republic ••••••••••••••• :110,417 78,765 220,512 ,207'030 :: 1,358 20,693 1,950 1,402
123,858 213,604 19,642 15:927: : 33,802 42,456 5,639Venezuela ....................."••••.• : Lebanon •••••••.•••••••••••••••••••• :
5,968Guyana .............................. : Irsq .............................. .;8,037 38,64710,388 10,225 22 798:: 112,624 3,930 1,682Surinam •••••••• "" •• " ... " "." ......... ,,: 6,159 Iran .................................. : 103,6296,894 100 '232: : 560,948 25,105 35,644French Guiana •••••••••••••••••••••• : Israel ............................. :143 159,399166 187 32: : 184,994 5,993 5,911Ecuador ................... " "." ••• "•• : J ordsn ... ~ ....................... ~ ... :23,767 36,312 69,573 135 666:: 9,090 10,554 o oPeru .................................. : Gaza Strip .......................... :100,047 o139,117 87,439 161;909 :: 37 6 5Bolivia •••••••••••••••••••••••••••• : Kuwait ••••••••••••••••••••••••••••• :9,720 14,810 3,114 2,936: : 5,895 18,135 o oChile .............................. : Saudi Arabia ••••••••••••••••••••••• :108,710 77,767 3,527 5 731:: 61,396 90,024 161 549Brazil ••••••••••••••••••••••••••••• : 240,687 82,640 Qatar •••••.•••••••.••••••••••.••••• : 1,273 Parsguay ••••••••••••••••••••••••••• : United Arab Emira tes ............... .554,252 711 \24 :: 454 o o
431 507 12,436 14:507 , 3,307 4,664 61 15Uruguay •••••••••••••••••••••••••••• : Yemen Arab Republic ••••••••••••••••2,732 9,932 1,479 1,264 7,120 4,034 199 14394,785 9,380 4,544 5,750Argentina •••••••••••••••••••••••••• : Yemen (A den) ...................... .
111,827 140,676 60 181Other Soutb Americs ................ : Oman ............ ~ •••••.•••.••••••••••a o 1,361 4133 o o oBahrain ........................... . 1,660 2,114 '0 Europe ••••••••••••••••••••••••••••••• : 5,179,983 Afghanistan ....................... . 196
o 5,555,760 1,197,044 997 1,170 3,1611,090,210 India ............................. .Iceland •••••••••••••••••••••••••••• : 2,883 242,2204,417 513,607. 69,197477 89,973415 Pskistan .......................... . 108,318 109,432 2,267 3,105
Continued-
~~~~.4~_~".~o,. ! . " ...,"'"""_.--~"' <" -·-·~ ...----'--"-~--~'-'--,..",,,~,....,.~~-.ft.~~~__.........~_.. __ ___ -,...._~_.. ",-_~-., ___,_J
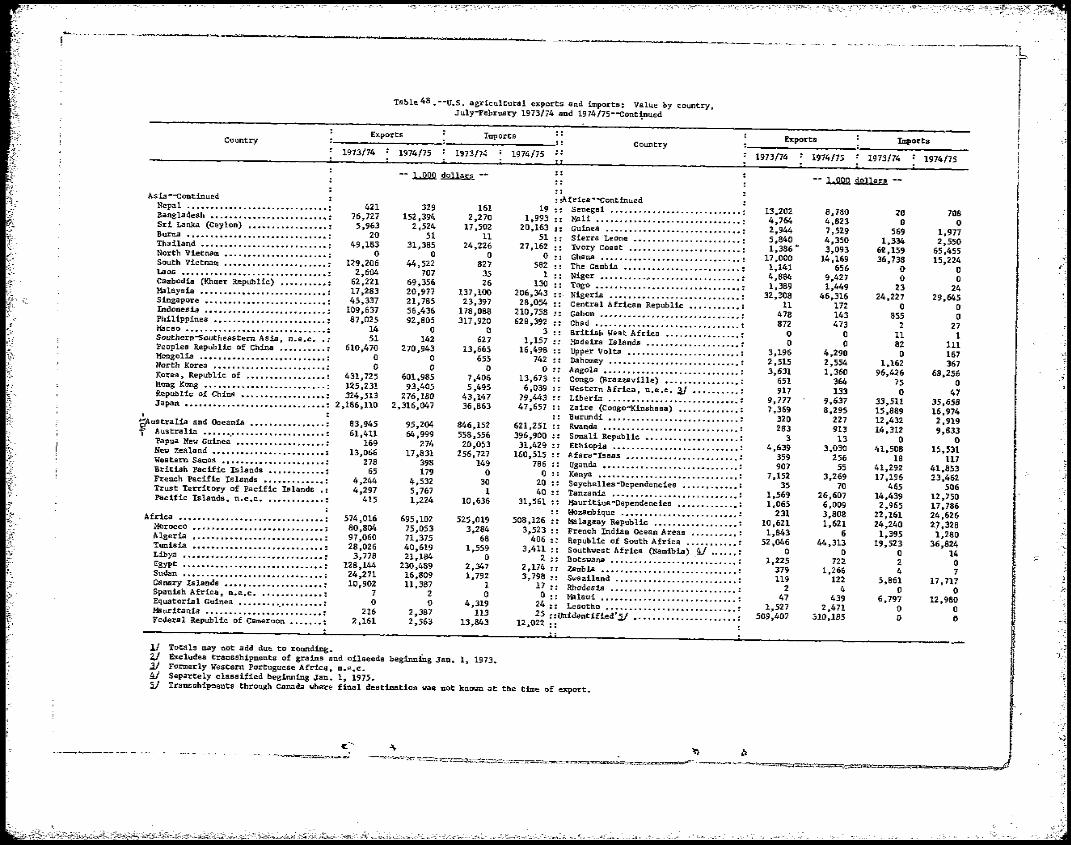
""--- ~ ~
t - •.--. I l
Table 48 .--U.S. agricultural exports and imports: Value by country, Ju1y-February 1973/14 and 1974/75--Cont¥>ued r
Exports ImportsCountry Exports ImportsCountry I1973/74 1974/75 1973/7:; 1974/75 •• 1973/74 1974/75 1973/74 1974/75 i,
-- l....QQQ .!l!1.l.lw. -- I ~- l....QQQ .!l!!ll.!!.m ~-
Asia --Continued : :Africa-'continued Nepal ............................. . 421 329 161 19 :: Senegal ............................ : 13,202 8,780 20Bangladesh ........................ . 76,727 152,394 2,270 708
1,993 :: Mali ............................... : 4,764 4,823 0Sri Lanka (Ceylon) ................ . 5,963 2,524 17 ,502 020,163 I: Guinea ............................. : 2,944 7,529 569 1,977Burma ...................................................... : 20 51 11 51 :: Sierra Leone ....................... : 5,840 4,350 1,334 2,550Thailand ........................... : 49,183 ~31,385 24,226 27,162 :: Ivory Coast ....................... .: 1,386· 3,093 62,159 65,455North Vietnam ...................... : o o o o :: Ghana .............................. : 17,000 14,169 36,738 15,224South Vietnam ...................... : 129,206 44,522 827 582 :: The Gambia ......................... : 1,141 656 (} 0!.aOB .............................................................. : 2,604 707 35 1 :: Niger ............................... : 4,884 9,427 0 0Cambodia (Khmer Republic) •••••••••• : 62,221 69,356 26 130 :: Togo ............................... : 1,389 1,449 23 24Malaysia ........................... : 17,283 20,977 137,100 206,343 ::. Nigeria ............................ : 32,:ro8 46,316 24,227 29,645Singapore .......................... : 45,337 21,785 23,397 28,054 :: Central African Republic •••.••••••• : 11 172 0 0Indonesia .......................... : 109,637 56,436 178,088 210,758:: Gabon .............................. : 478 143 855 0Philippines ........................ : 87,025 92,805 317,920 628,392 :: Chad .............. : ................ : 872 473 2 27}laeaa ........................ _ .................................. : 14 o o 3 :: British West Africa ................ : 0 0 11 1Southern-Southeastern Asu, n.e.c ... : 51 142 627 1,157 :: Madeira Islands .................... : 0 0Peoples Republic of China .......... : 610,470 270,943 13,665 82 III 16,498:: Upper Volta ........................ : 3,196 4,290 0 167Mongolia ........................... : o o 655 742 :: Dahomey ............................ : 2,515 2,554 1,162 367North Korea ........................ : o o o o :: Angola ............................. : 3,631 1,360 96,426Korea, Republic of ................. : 431,725 601,985 68,2567,406 13,673:: Congo (Brazzaville) ................ : 651 364 75 0Hong Kong .......................... : 125,231 93,405 5,495 6,039:: Western Africa, n.e.c. 'Jl .......... : 917 133Republic of China .................. : 324,513 276,180 0 4743,147 79,443:: Liberia ............................ :
Japan .............................. : 2,186,110 2,316,047 9,777 9,637 33,511 35,65836,863 47,657 :: Zaire (Congo-Kinshasa) ••••••••••••• :
:: Burundi ............................ : 320, 7,369 8,295 15,889 16,974
227 12,432 2,919?ustralia and Oceania ................ : 83,945 95,204 846,152 621,251:: Rwanda ............................. : I Australia ............ " ...................................... : 61,411
283 913 14,312 9,83364,999 558,556 396,900:: Somsli Republic .................... : 3 13 0 0Papua New Guinea ................... : 169 274 20,053 31,429:: Ethiopia ........................... :New Zealand ........................ : 13,066 17 ,831 4,639 3,030 41,508 15,531256,727 160,515 :: Afars-Issas ........................ : 359 256Western Samoa .................... " ...................... : 278 398 18 117149 786 :: Uganda ............................. : 907 55 41,292British Pacific Islands •••••••••••• : 41,85365 179 o 0:: Kenya .............................. :Fl:ench Pacific Islands ••••••••••••• : 4,244 4,532 30 7,152 3,269 17,196 23,462
20 :: Seychelles-Dependencies •••••••••••• : 35 70Trust Territory of Pacific Islands .: 4,297 5,767 1 465 506 40 :: Tanzania ........................... : 1,569 26,607 14,439Pacific Islands, n.e.c ............. : 12,750415 1,224 10,636 31,561 :: Mauritius-Dependencies ••••••••••••• : 1,065 6,009 2,965 17,786
:: Mozambique ......................... : 231 3,808 22,161 24,626Africa ............................................... .. 574,016 695,102 525,019 508,126:: Malagasy Republic .................. : 10,621 1,621 24,240Morocco ................................. . 80,804 75,053 3,284 2.] ,3283,523 :: French Indian Ocean Areas .......... : 1,843 6 1,395 1,280Algeria .......................... .. 97,060 71,375 68 406 :: Republic of South Africa ••••••••••• : 52,046 44,313 19,523 36,824Tunisia ............................ : 28,026 40,619 1,559 3,411 :: Southwest Africa (Namibia) ?lJ ...... : 0 0 0Libya .............................. : 3,778 21,184 o 14
2 :: Botswana •••••••••••••••••..••••••••• : 1,225 722 2Egypt .............................. : 128,144 230,489 2,347 0 '" 2,174 :: Zambia ............................. : 379 1,266 4 7Sudan .............................. : 24,271 16,809 1,792 3,798:: Swaziland .......................... : 119 122 5,861 17,717 17:: Rhodesia ........................... : 2 4 0 0
Canary Islands ..................... : 10,902 11,387 1 Spanish Africa, n.e.c.............. : 7 2 o 0:: Ma1aui ............................. : 47 439 6,797 12,980
24 •• Lesotho ............................ : 1,527 2,471 0 0Equatoria1 Guinea •••••••• '.' •••••••• : o o 4,319 Mauritania ......................... : 216 2,387 113 25 ::Unidentified'.2./ ...................... : 509,407 310,185Federal Republic of Cameroon ....... : 2,161 2,563 13,843 12,022 ::
0 6
11 Totals may not add due to rounding. V Excludes transshipments of grains and oilseeds beginning Jan. I, 1973. iJJ Formel:ly Western Portuguese Africa, n.e.c. ?lJ Sepal:te1y classified beginning Jan. 1, 1975. 51 Transshipments through Canada where final destination was not known at the time of export.
~ ~ ~

'''~ ..,.,-~--..~~~~---~"""'t'7....,...,..~:~'";;/ Ht ' ..,JI •
Table 49.--U.S. 8gricuJ.tural exports: Quantity indexes or prinCipal commodity groupS, calendar years 1924-7.4
(1967 = ~oolAn_I productsTotal
: Year Poultry :
agricul. Meats andturd Dairy Cotton Fruitsand Animal Tobacco, GrAInselCpOrts Total meat Vegetable andproducts poultry and unmanu- othertats products other and oils and vege ..products: linters tactured Vegetablefeeds oUseeds table. products
1924 •••••••••••••••••••• ; ~8.87 100.611925 .................... : r47.51 79.19 170.511926 .................... : 78.55 20.8648.87 1.5769.87 215.38 71.80 46.63~927 .................... : 15.7752.94 2.10 43.~65.21 232.05~928 .................... : 74.33 16.79 1.0548.87 57.76 238.46 49.2277.71 21.37225.64 2.~0 56.991929 .................... : 46.15 58.69 95.45 16.79 2.~0 60.451930 .................... : 38.69 54.03 196.15 92.071931 .................... : 15.7738.01 42.85 173.08 1.57 65.6392.071932 .................... : ll.~9 1.0540.05 33.54 180.77 56.1385.311933 .................... : 9.67 1.0537.33 32.61 235.90 63.9062.51 7.12 1.57221.79 68.42 55.271934 .................... ; 3.5629.19 27.02 1.05 49.221935 .................... : 26.47 13.04 152.561936 .................... : 69.26 3.5625.ll l.0512.ll ~55.13 44.911937 .................... : 63.35 2.0429.~9 .,214.91 142.31 56.131938 .................... : 68.42 2.0432.58 16.77 .52152.56 47.5070.95 5.60: 1.05116.67 46.631939 .................... , 81.93 17.3027.83 '21.43 ~.05 67.361940 .................... :
1941 20.36 17.70 ~0.51 54.90.................... : 9.6718.33 68.01 97.44 3.14 60.45194'2 .................... : 36.32 6.ll23.08 137.88 29.48 2.10 29.361943 .................... : 48.15 5.6032.58 177.01 26.92 2.10 41.4543.08 3.5639.74 31.951944 .................... ; 71.Bo 5.og 2.10
29.19 169.55 7.86 45.771945 .................... :. 34.62 log.93 25.64... ~946 .................... : 49.84 5.og c 49.55 ~45.33 64.10 7.86 53.54~947 .................... : Bo.24 1~.76'r 50.91 93.16 258.57 ~G2.56 3.14 63.041948 .................... 83.26 30.1:9 172.23 ll3.19 22.3942.76 54.03 181.96 44.83 28.65 69.23 88.69 42.23
3.67 73.4023.07 54.~~ 4.7~10.82 86.361949 .................... 71.79 75.1B 36.13 95.8452.94 611.28 170.47 5.24 66.491950 .................... 46.15 26.90 61.79 49.08 24.19 104.91
60.56 139.B2 130.771951 .................... 85.18 53.56 42.83 87.00 39.6954.30 63.35 13.37 .lB.33 41,.04141.74 144.871952 .................... 46.15 67.25 70.03 50.87 83.62 26.46 16.24 89.6048.44 8.28 52.681953 .................... 40.72 57.46 38.43 74.15 55.33 15.92 f~:~G 20.43 57.84
60.56 lOl.51 36.51 74.15 63.36 G~:g~ ~B:~ 51.81 47.0729.92 14.6771.79 91.22 62.181954 .................... 44.~ 68.0l 29.00 17.28, 36.29
1955 .................... 114.92 ~0.99 1b1 ,53 65.14 49.02 60.45 49.3449.55 108.07 106.41289.22 48.67 78.55 23.911956 .................... 67.20 117.38 8'1.34 78.53 61.~ 64.10 30.90 65.63294.96 58.28 93.76 33.58 60.68~957 .................... 98.05 log. 7672.84 ~02.57 217.83 59.21 115.38 89.53 35.62 69.081958 .................... 63.20 85.89
51.11 85.06 119.96 69.97 ~75,55 48.85 45.04 36.29
206.91 51.82 67.58 87.65 49.69 88.08 55.5767.99 63.25 116.19 84.29 48.og 4g.~8 89.17 58.26~959 .................... 67.58 91.03 149.89 89.21 44.79 83.~5 52.3~1960 .................... 83.64 94.53 79.79 57.7794.96 119.53 92.85 81.46.1961 .................... =.19 104.84 82.81 66.16 54.8683.50 ~00.87 151.24 ~41.68 188.75 86.63 64.3~ 62.85 86.451962 .................... 96.86 59.5383.42 98.67 165.73 144.31 79.S, 70.01 J,60.86 87.63 72.30 69.83 89.37 69.~41963 .................... 88.78 76.7191.74 ~0.91 247.65 64.28 96.11 82.03 57.00 88.08~6.34 106.66 103.95 79.14 63.5371.36 ~08.30 7ll.4788.44 98.32~964 .................... 87.30 69.88103.99 ~~i5.77 29~.36 ~6.10 76.67 96.511965 .................... ~00.54 136.~6 133.02 89.18 78.05116.58 ~31.68~.78 116.54 89.29 96.46~06.60 98.76 ~07.37 108.58
99.73 108.13 ~01.74 95.88 8~.89 100.52 96.71 91..49 89.4188.40 98.84i~ :::::::::::::::::::: 100.00 100.00 103.60 90.90100.00 96.43 99.31 101.971968 .................... ~OO.~8 104.66 100.00 100.00 100.00 100.00 100.00 117.87
93.31 107.99liB. 57 100.00 100.00 ~02.5595.89 99.33 107.53 101.98 93.6895.06 104.85 100.00 100.001969 .................... 98.79 100.0094.22 104.78 104.2~ 107.7~1970 .................... 85.07 9~.J,4 ~8.40 89.99 102.69=.18 112.15 61.47107.97 101.5~ 1.02.651971 .................... 00.98 112.28 106.59 118.64 87.07=.38 ~8.50 160.66 78.33 90.46 1l§.75 ~03.73 107.711972 .................... ~8.88 81.94 ~0.81 125.91 135.66 105.18 15 ;65126.20 124.40 log.77 82.99 104.51 ~3.921973 .................... 166.42 128.44 93.66 105.18 143.63 153.74 96.35 1511.98 1.02.7652.76 81.03 log. 74 ~45.261974 .................... 98.89 101.2~ 201.25 128.99 168.06~55.1.7 ~4.06 35.99 178.86 146.28 1og.06 112.59 168.71103.05 119.93 ~71.53 ~72.11 190.82 171.50138.01. llS.21 130.02 171.53159.46i 191.39 131.58 210.13
f
f~ __.. ... .;; ,-, ~~-----..-.....,. '--.....~~'---"------.-.-.............",,-,~-.;.-,-- -.
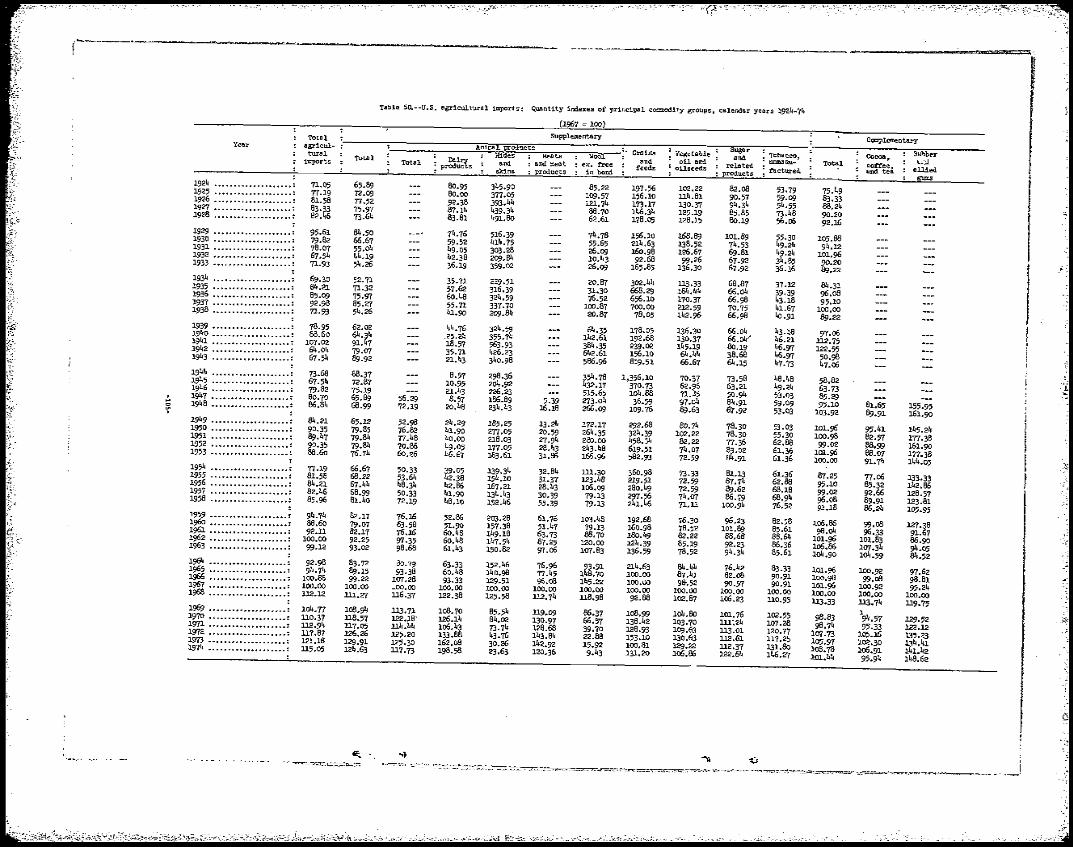
~----_....._--------'-"""'-='''''=,....\,
Table 50 ... -U.S. agricultural import.s: Quantity indexes of prir.cipa~ commodity groups" calendar years 192.4-74
ComplementaryYear
1924 ................... . 1925 •••••••••••••••••••• 1926 •••••••••••••••••••• 1927 •••••••••••••••••••• 1928 ................... .
1929 ................... . 1930 ................... . 1931 .................. .. 1932 ................... . 1933 ................... .
1934 ................... . 1935 ................... . 1936 .................. .. 1937 •••••••••••••••••••• 1938 ................... .
1939 •••••••••••••••••••• 1940 •••••••••••••••••••• 1941 •••.•••••••••••••••• 1942 ................... . 1943 ••••••••••••••••••••
1944 •••••••••••••••••••• 1945 •••••••••••••••••••• 1946 ••••••••••••••••••••. 1947 ••••••••••••••••••••....
o 1948 ••••••••••••••••••••'l'
1949 ................... . 1950 •••••••••••••••••••• 1951 ................... . 1952 ................... . 1953 ................... .
1954 ................... . 1955 ................... . 1956 ................... . 1957 ................... . 1958 ................... .
1959 ................... . 1960 ................... . 1961 •••••••••••••••••••• 1962 •••••••••••••••••••• 1963 ................... .
19£,4 •••••••••••••••••••• 1965 •••••••••••••••••••• 19£,6 •••••••••••••••••••• 1967 •••••••••••••••••••• 1968 ................... .
1969 ................... . 1970 •••••••••••••••••••• 1971 •••••••••••••••••••• 1972 ................... . 1973 •••••••••••••••••••• 1974 ................... .
Total agricUltural
imports
71.05 77.19 81.;8 83.33 82.46
95.61 79.82 78.07 67.54 71.93
69.30 84.21 85.09 92.98 71.93
78.95 88.60
107.02 64.04 67.54
73.68 67.54 79.82 80.70 86.84
84.21 90.35 89."7 90.35 88.60
77.19 81.58 84.21 82.45 85.96
94.74 88.60 92.U
lOO.OO 99.12
92.98 94.74
loo.88 100.00 112.12
101,.77 UO.37 U2.94 117,87 121.18 U5.05
(1967 = 100)
Supplementary
Ani.iilRI prOducts: Total
Total : ])a! ~ produ~s
RiCles a!1d
skins
M-eats : and meat : products
WOO1 : ex. free
in boed.
65.89 72.og 77.52 75.97 73.64
80.95 80.00 92.38 87.14 83.81
345.90 377.05 393.44 439.34 491.80
85.22 log. 57 121.7" 88.70 62.61
84.50 66.67 55.01, 44.19 54.26
74.76 59.52 49.05 42.38 36.19
516.39 414.75 303.28 2og.84 359.02
74,78 55.65 26,og 10.43 26.og
52.71 71.32 75.97 85.27 54.26
35.71 57.62 60.48 55.71 41.90
229.51 316.39 324.59 337.70 2og.84
20.87 31.30 76.52
100.87 20.87
62.02 64.34 91.47 79.07 89.92
44.76 .25.24 18.57 35.71 21.43
324.59 355.74 563.93 426.23 340.98
64.35 142.61 384.35 642.61 586.96
88.37 72.87 75.19 65.89 68.99
56.29 72.19
8.57 lO,95 2l.43 8.57
20.48
298.36 204.92 226.23 186.89 234.43
5.39 16.18
354.78 432.17 515.65 273.04 266.og
65.12 79.85 79.84 79.84 76.74
52.gB 76.82 77.48 70.86 60.26
24.29 4l,90 40.00 49.05 46.67
185.25 277.05 218.03 177.05" 183.61
13.24 20.59 27.94 28.43 31.86
172.17 264.35 280.00 243.48 166.96
66.67 68.22 67.44 68.99 81.40
50.33 53.64 48.34 50.33 72,19
39.05 42.38 42.86 4l.90 48.10
i~ti~ 167.21 134.43 152.46
32.84 31.37 28.43 30.39 55.39
U1.30 123.48 l06.og 79.13 79.13
82.17 79.07 82.17 92.25 93.02
76.16 63.58 76.16 97.35 98.68
52.86 51.90 60.48 60.48 61.43
203.28 157.38 149.18 147.54 150.82
61.76 51.47 63.73 87,25 97.06
103.48 79.13 88.70
120.00 107.83
83.72 89.15 99.22
100.00 lU.27
80.79 93.38
107.28 ~OO.OO
u6.37
63.33 60,48 93.33
100.00 122.38
152.46 140.gB 129.51 100.00 125.58
76.96 77.45 96.08
100.00 =.74
93.91 148.70 145.22 100.00 u8.98
108.94 U8.57 U7.05 126.26 129.91 124.63
113.71 122.18" 114.44 125.20 125.30 117.73
l08.70 126.14 106.43 133.88 162.08 198.58
85.54 84.02 73.74 43.76 30.26 23.63
119.og l30.97 128.68 143.84 l42.92 120.36
86.37 66.57 39.70 22.88 15.92 9.43
Grains and
feeds
197.56 156.10 173.17 146.34 178.05
156.10 214.63 160.98 92.68
165.85
302.44 668.29 656.10 700.00 78.05
178.05 192.68 239.02 156.10 819.51
1,356.10 370.73 104.88 36.59
109.76
292.68 324.39 458.J4 619.51 582.93
360.98 219.51 280.49 297.56 241.46
192.68 160.98 180.49 124.39 136.59
214.63 100.00 100.00 100.00 92.88
108.99 138.42 128.93 153.10 100.81 131.20
Vegetable oil and
ollsseds
102.22 u4.81 130.37 125.19 128.15
168.89 138.52 126.67 99.26
136.30
113.33 184.44 170.37 212.;9 142.96
136.30 130.37 145.19 64.44 66.67
70.37 62.96 71.35 97.04 89.63
80.74 102.22 82.22 74.07 72.59
73.33 72.59 72.59 74.07 71.U
76.30 78.52 82.22 85.19 78.52
84.44 87.41 9&.52
100.00 102.87
101,.80 103.70 log.63 130.63 129.22 106.86
Sugar and
related products
82.08 90.57 94.34 85.85 80.19
101.89 74.53 69.81 67.92 67,92
68.87 66.04 66.gB 70,75 66.98
66.01, 66.01," 80.19 38.68 64.15
73.58 63.2l 50.94 84.9l 67.92
78.30 78.30 77.36 83.0~ 84.9l
81.13 87.74 89.62 86.19
100.94
96.23 101.89 88.68 92.23 94.34
76,42 82.08 90,57
100,00 l06,23
101.76 lU;24 113.01 112.61 U2.37 122.64
Tobacco,1ll1ln3nuf'actured
53.79 59.og 54.55 73.48 56.06
55.30 49.24 49.24 34.85 36.36
37.12 39.39 43.18 41.67 40.91
43.18 46.21 46.97 46.97 47.73
48.48 49.24 53.03 59.09 53.03
53.03 55.30 62.88 61.36 61.36
61.36 62.88 68.18 68.94 76.52
82.58 85.61 B8.64 86.36 85.61
83.33 90.91 90.91
100.00 UO.95
102.55 107.28 120.77 U7.25 131.80 146.27
Total
75.49 83.33 88.24 90.20 92.16
105,88 94.12
101.96 90.20 89.22
84.31 96.08 95.l0
100.00 89.22
97.06 112.75 122.55
50.98 47.06
58.82 63.73 85.29 95.10
103.92
lOI.96 100.gB 99.02
101.96 100.00
87.25 95.10 99.02 96.08 91.18
106.86 gB.o1,
101.96 106.86 101,.90
101.96 100.98 101.96 100.00 113.33
98.83 98.74
107.73 105.97 108.78 101,44
Cocoa, coffee,lind tea
81.65 89.91
95.41 82.57 ~.99 88.07 91.74
77.06 85.32 92.66 89.91 86.24
99.08 96.33
101.83 107,34 104.59
100.92 99.08
100.92 100.00 113.74
~94,57 95.33
105.16 102.30 106.91 95.94
Eu'Qber ~".:l
allied gt>Dls
l55.95 161.90
145.24 177.38 161.90 l77,38 144.05
133.33 l42.86 128.57 123.81 105.95
127.38 91.67 86.90 94.05 84.52
97.62 98.81 95.24
lOO.OO U9.75
129.52 122.12 135.23 134.41 141.42 l48.62
~'" -.} ""';\
-"'~·~'~"'~~__.iJ2<:::::r 4J

~~~..--~........ ....'~·..."h""'mt":::t£!I~~~'~~~~~~7·,z:,·""""'~"':'~~ .. ,,_~... """M":t$':t<ml1~~~~>.£:...J 4 , • ti
-- 'f
Table 51.--Quantity indexes: U.S. agricultural exports, fiscal years 1968-74, monthly and accumulated, July 1973 to date
{Calendar ~ear 1967 ~ 100~ Animals Cotton Tobacco, GrainsYear and month Oilseedsand animal Fruitsand Allunmanu
products linters factured and and and agriculturalfeeds products vegetables co=dities
1967/68 •••••••••••• : 96 lOll1968/69 •••••••••••• : 110 101 104 99 9169 101
1969/70 •••••••••••• : 101 100 85 106 9375 92
1970/71 •••••••••••• : 117 101 97 148 10998 106981971/72 •••••••••••• : 134 106 157 10389 115941972/73 •••••••••••• : 126 103 159 107126 115
1973/74 •••••••••••• : 126 102 167 182 118155 152
JulY-February 118 178 186 131 1651973/74 •••••••••• : 128 134 121 1861974/75 •••••••••• : 132 169 13495 165117 160 179 137 152
B2! adjusted 12! seasonal variation 1973/74:
July ••••.•••••••• : 103 88August ••••••••••• : 120 190 80114 131143 14385 223September •••••••• : 58 120131 84 121 158
I 196October •••••••••• : 52167 138..... 80 147 0 179 .... November ••••••••• : 142
153 182 16084 169179I 195December ••••••••• : 128 280 152193 192January •••••••••• : 114
122 186 237 135177 181116February ••••••••• : 124 170 210 122194 168102 151March •••••••••••• : 250139 248 114 163April •••••••••••• : 126
86 167 254 124206 176May •••••••••••••• : 127
107 161 261 121177 170119 154June ••••••••••••• : 193101 129154 1561331974/75: 161 177 124 152July ••••••••••••• : 123 131August ••••••••••• : 116 83
92 193 147 145 160September •••••••• : 96 142 104 126112 41 83 124130October •••••••••• : 104140 12340 114137November ••••••••• : 129 140 139 15890 137173
151December ••••••••• : 136 115
160 260 146 176January •••••••••• : 157 163 195 126135 160139February ••••••••• : 148 187 284 134126 19079 154March •••••••••••• : 198 134 155April •••••••••••• : May ••• "•••••••••• : June ••••••••••••• :
: Note: The seasonal adjustment series is being revised.
I '"-.=~. I
.~~-'----.»,- ""'"~." ...--,-,.,,.,...,. =-'--<'''''~=-'''''''''''''"~-~''"''''''''''''-'~'''''''''''''''~'- -'-'~'"~'-''' '-.. ~_ .. _"J
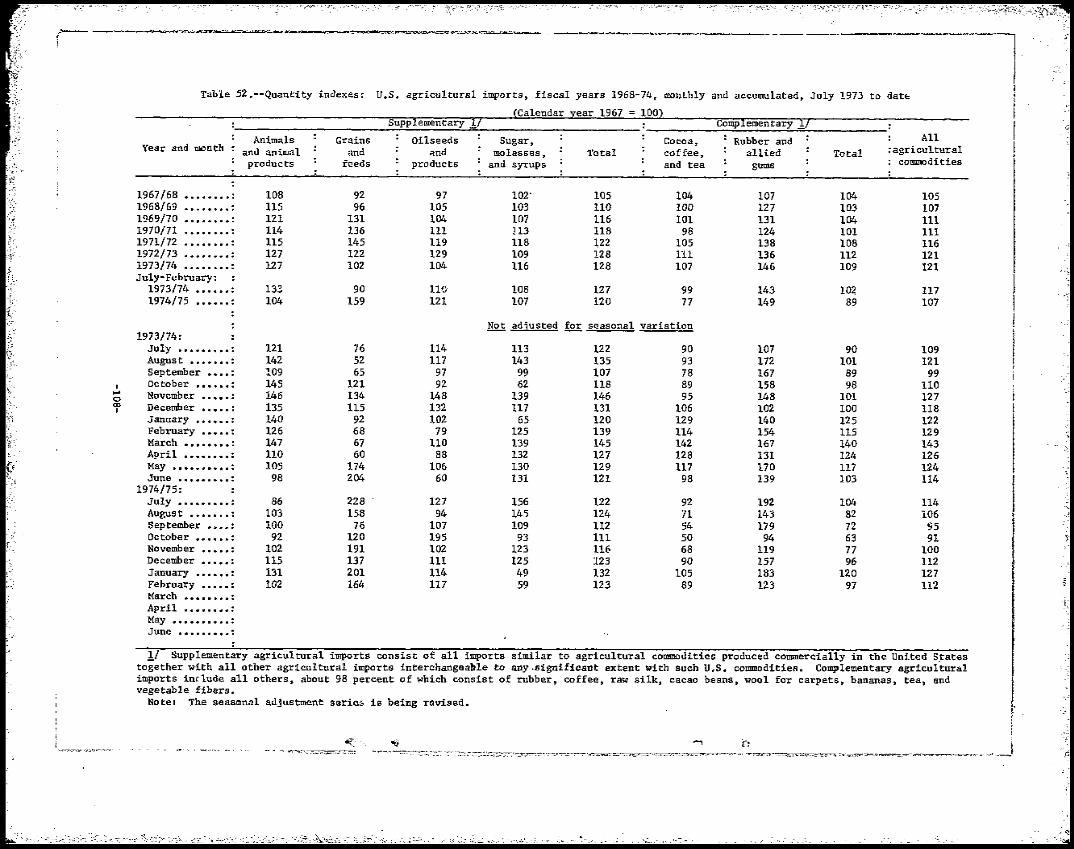
-,---......~~~>. -.-",."~l;~~c-::;~:-;;il .:;::~;~:
• "='It b>!::'7lii"litW'" tr ....~·:<:¢;oq~!I·'~.."........·~i~h ~",,*,'¢;:tttnr"»'·...,1''f*'''''''''''''''kT~'''''P"''¥'=!¢~lYffltC¢d>4-~. _, *''"*--- --,--,--- !--
Table 52.--Quantity indexes: U.S. agricultural imports, fiscal years 1968-74, monthly and accumulated, July 1973 to dat~
ear 1967 = 100)
AllAnimals Grains Oilseeds Sugar, Cocoa, Rubber and Year and month : agriculturaland animal and and molasses, Total coffee, allied Total
commoditiesproducts feeds products and syrups and tea gums
1967/68 •••••••• : 108 92 97 102' 105 104 107 104 105 1968/69 •••••••• : 115 96 105 103 110 100 127 103 107 1969/70 •••••••• : 121 131 104 107 116 101 131 104 III 1970/71 •••••••• : 114 136 111 213 118 98 124 101 III 1971/72 •••••••• : 115 145 119 118 122 105 138 108 116 1972/73 •••••••• : 127 122 129 109 128 111 136 112 121 1973/74 •••••••• : 127 102 104 116 128 107 146 109 121 ~ r~ July-February:
1973/74 ...... : 133 90 1Hl 108 127 99 143 10~ 117 1974/75 ...... : 104 159 121 107 120 77 149 89 107
~ adjusted for seasonal variation 1973/74:
July ••••••••• : 121 76 114 113 122 90 107 90 109 August ••••••• : 142 52 117 143 135 93 172 101 121 September •••• : 109 65 97 99 107 78 167 89 99
I October •••••• : 145 121 92 62 118 89 158 98 110 .... November ••••• : 146 134 148 139 146 95 148 101 1270 ex> I December ••••• : 135 115 132 117 131 106 102 100 118
January •••••• : 140 92 102 65 120 129 140 125 122 February ••••• : 126 68 79 125 139 114 154 115 129 March •••••••• : 147 67 110 139 145 142 167 140 143 April •••••••• : 110 60 88 132 127 128 131 124 126 May •••••••••• : 105 174 106 130 129 117 170 117 124 June ••••••••• : 98 204 60 131 121 98 139 103 114
;,'
1974/75: July ••••••••• : 86 228 127 156 122 92 192 104 114 August ....... : 103 158 94 145 124 71 143 82 106 .~~ September •••• : 100 76 107 109 112 54 179 72 95 October •••••• : 92 120 195 93 111 50 94 63 91 )' November ••••• : 102 191 102 123 116 68 119 77 100 December ••••• : 115 137 III 125 123 90 157 96 112 January •••••• : 131 201 114 49 132 105 183 120 127 "i·February ••••• : 102 164 117 59 123 89 123 97 112 ;< March •••••••• : 'I',
'-'"",April •••••••• : May •••••••••• : ":-;;
June ••••••••• :
1/ Supplementary agricultural imports consist of all imports similar to agricultural commodities produced commercially in the United S,tates together with all other agricultural imports interchangeable to any ,significant extent with such U.S. commodities. Complementary agricultural imports in(lude all others, about 98 percent of which consist of rubber, coffee, raw silk, cacao beans, wool for carpets, bananas, tea, and vegetable fibers.
Notel The seasmna1 adjustment serie~ is being revised.
{ ,.. 'fii ~ h '!Ih:nr-'::""7H~~:"'-:::t:~
,::.
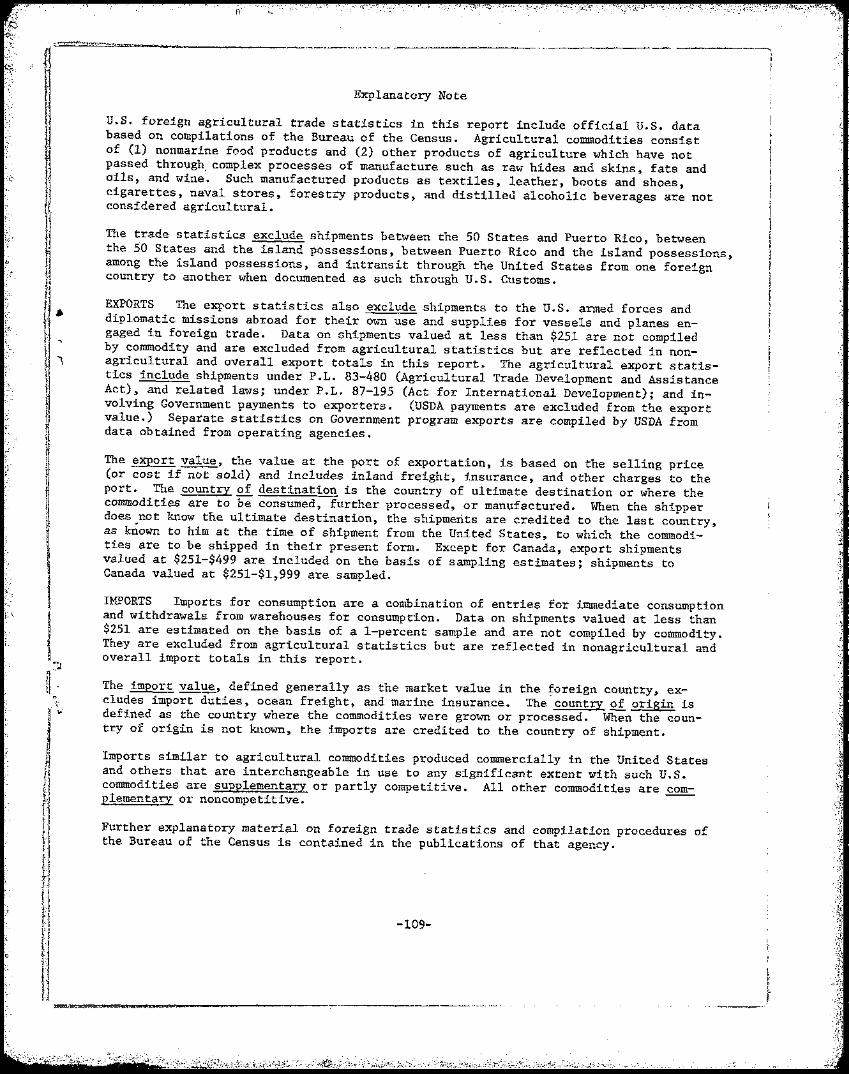
Explanatory Note
U.S. foreign agricultural trade statistics in this report include official U.S. data based on compilations of the Bureau of the Census. Agricultural commodities consist of (1) nonmarine food products and (2) other prodUcts of agriculture which have not passed through. complex processes of manufacture such as raw hides and skins, fats and oils, and wine. Such manufactured products as textiles, leather, boots and shoes, cigarettes, naval stores, forestry products, and distille~ alcoholic beverages are not considered agricultural.
TIle trade statistics exclude shipments between the 50 States and Puerto Rico, between the 50 States and the island possessions, between Puerto Rico and the island possessions, among the island possessions, and intransit through the United States from one foreign country to another when documented as such through U.S. Customs.
EXPORTS The exrort statistics also exclude shipments to the U.S. armed forces and diplomatic missions abroad for their own use and supplies for vessels and planes engaged in foreign trade. Data on shipments valued at less than $251 are not compiled by commodity and are excluded from agricultural statistics but are reflected in nonagricultural and overall export totals in this report. The agricultural export statistics include shipments under P.L. 83-480 (Agricultural Trade Development and Assistance Act), and related laws; under P.L. 87-195 (Act for International Development); and involving Government payments to exporters. (USDA payments are excluded from the export value.) Separate statistics on Government program exports are compiled by USDA from data obtained from operating agencies.
The export ~, the value at the port of exportation, is based on the selling price (or cost if not sold) and includes inland freight, 1.nsurance, and other charges to the port. The country of destination is the country of ultimate destination or where the commodities are to be consumed, further processed, or manufactured. When the shipper does not know the ultimate destination, the shipmerits are credited to the last country, as known to him at the time of shipment from the United States, to which the commodities are to be shipped in their present form. Except for Canada, export shipments valued at $251-$499 are included on the basis of sampling estimates; shipments to Canada valued at $251-$1,999 are sampled.
IMPORTS Imports far consumption are a combination of entries ror immediate consumption and withdrawals. from warehouses for consumption. Data on shipments valued at less than $251 are estimated on the basis of a I-percent sample and are not compiled by commodity. They are excluded from agricultural statistics but are reflected in nonagricultural and overall import totals in this report.
The import val~, defined generally as the market value in the ~oreign country, excludes import duties, ocean freight, and marine insurance. The country of origin is defined as the country where the commodities were grown or processed. When the country of origin is not known, the imports are credited to the country of shipment.
Imports similar to agricultural commodities produced commercially in the United States and others that are interchangeable in use to any significant extent with such U.S. commodities are supplementary or partly competitive. All other commodities are ~ plementa~ or noncompetitive.
Further explanatory material on foreign trade statistics and compilation procedures of the Bureau of the Census is contained in the publications of that agency.


