IFPRI’s experience and innovations in CGE modeling with the example of the AIDA project Workshop on Impact Analysis Toolkit Organized by UN-ESCWA, May 8, 2018 Presenter: Clemens Breisinger With inputs from James Thurlow, Yumna Kassim, Sikandra Kurdi, Tewodaj Mogues, Mai Mahmoud, Askar Mukashov, Josee Randriamamonjy, Mariam Raouf, and Manfred Wiebelt
Transcript
IFPRI’s experience and innovations in CGE modeling with the example of the AIDA project
Workshop on Impact Analysis Toolkit
Organized by UN-ESCWA, May 8, 2018
Presenter: Clemens Breisinger
With inputs from James Thurlow, Yumna Kassim, Sikandra Kurdi, Tewodaj Mogues, Mai Mahmoud, Askar Mukashov, Josee Randriamamonjy, Mariam Raouf, and Manfred Wiebelt
From SAM construction to static and dynamic CGEs
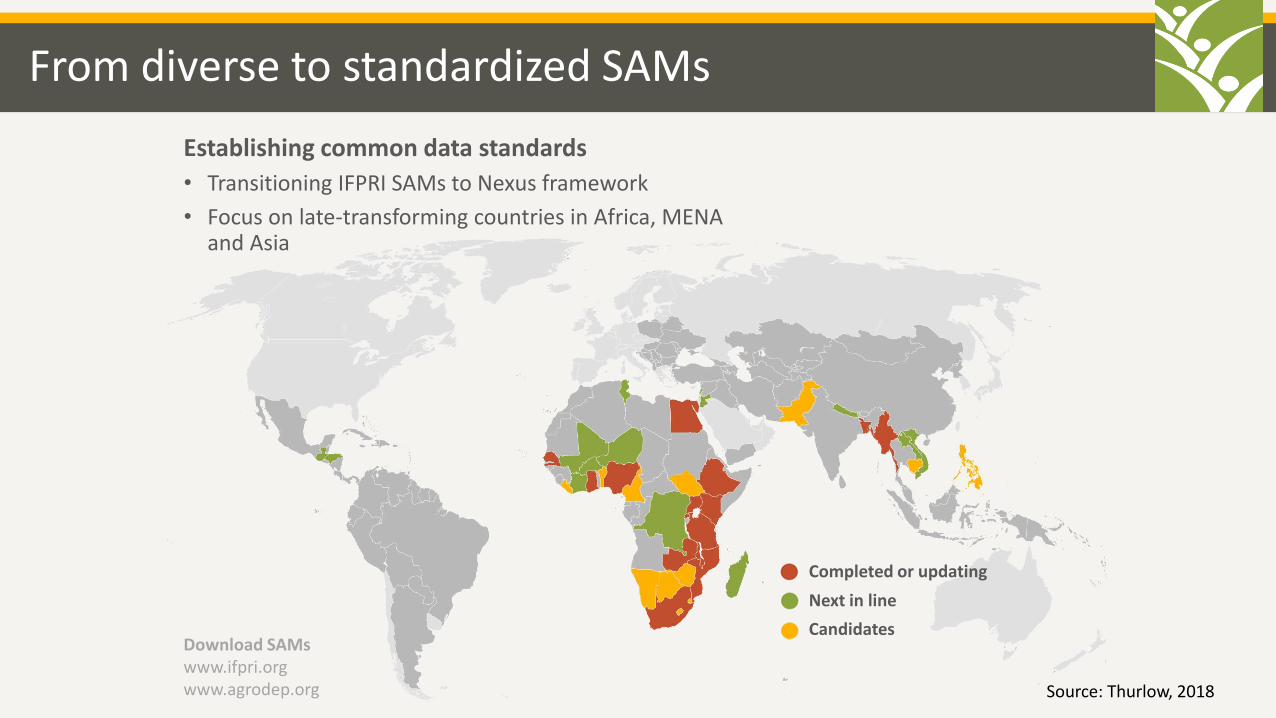
Establishing common data standards
• Transitioning IFPRI SAMs to Nexus framework
• Focus on late-transforming countries in Africa, MENA and Asia
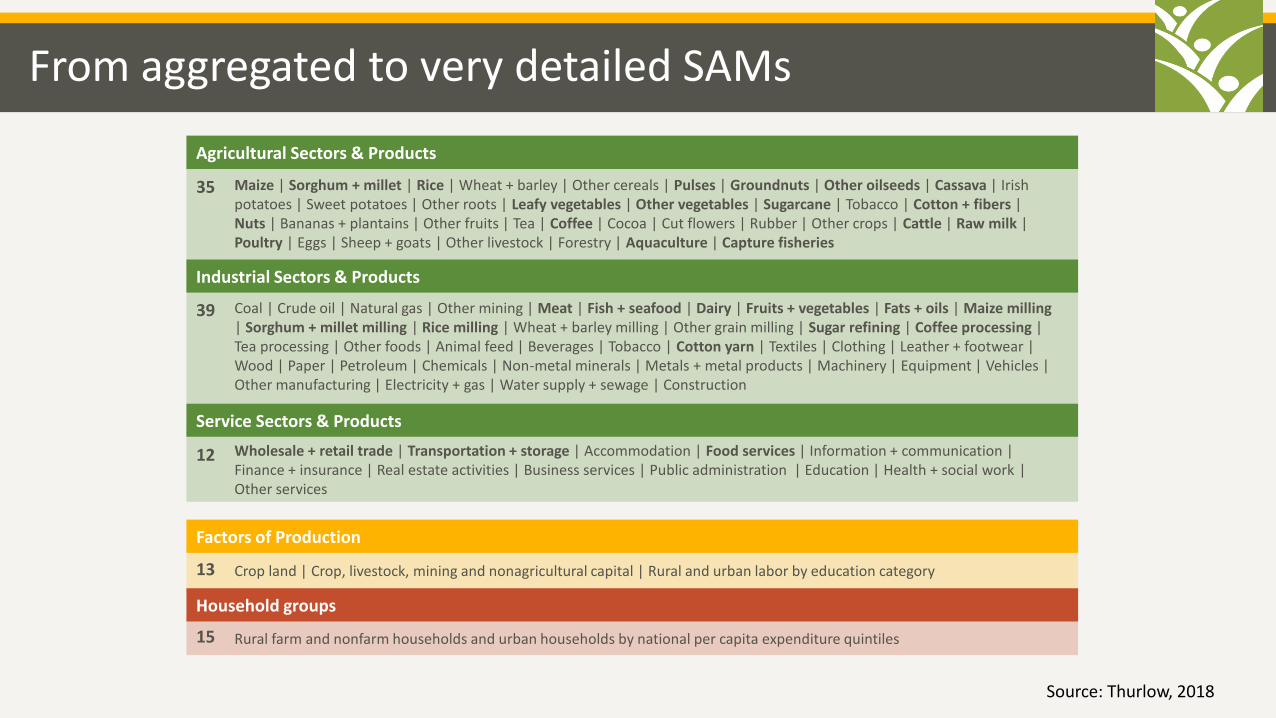
Wholesale + retail trade | Transportation + storage | Accommodation | Food services | Information + communication | Finance + insurance | Real estate activities | Business services | Public administration | Education | Health + social work | Other services
Service Sectors & Products
Crop land | Crop, livestock, mining and nonagricultural capital | Rural and urban labor by education category
Factors of Production
Rural farm and nonfarm households and urban households by national per capita expenditure quintiles
Household groups
35
39
12
13
15
Source: Thurlow, 2018
Example: Focus on Agri-Food Systems in Nexus SAMs
Detailed agricultural processing• Important for tracking agricultural
transformation and dietary change
15 18 2414
22 27353
5
9
86
11
18
1622
2835
30
32
33
1990s 2000s 2010s GTAP N58 N70 N86
Agriculture
Processing
Other
IFPRI Africa SAMs GTAP vs. Nexus
Average number of SAM sectors
29
65
46
75
GDP Employment
Meals outside the home
Trade & Transport
Input production
Processing
Agriculture
Share of Malawi total in 2014 (%)
Measuring Agri-Food Systems
Source: Thurlow, 2018
From national to sub-national SAMsDisaggregate: Sectoral production | Factor markets | Household groups
Tanzania
Kenya
Zambia
Mozambique
Malawi
Middle Upper
Alexandria
Greater Cairo
Suez Canal
Delta
North Upper
South Upper
North
Center
South
East AfricaEgypt Tunisia
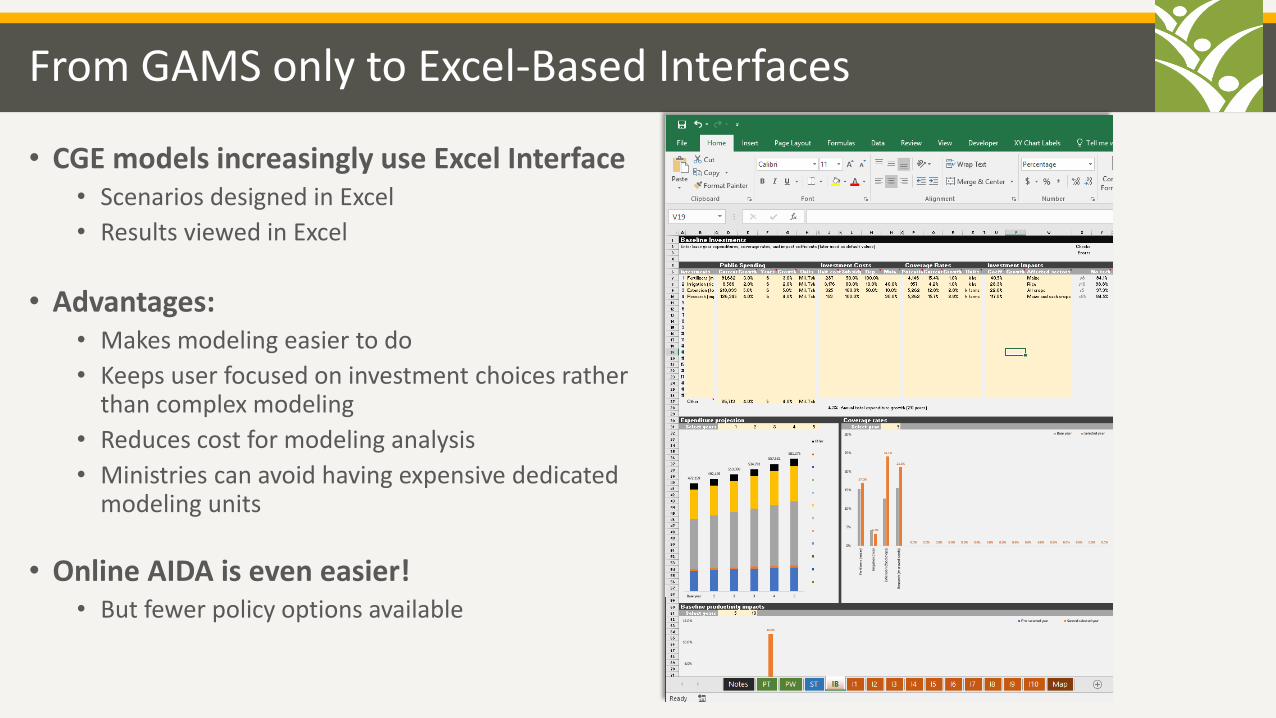
From GAMS only to Excel-Based Interfaces
• CGE models increasingly use Excel Interface • Scenarios designed in Excel
• Results viewed in Excel
• Advantages:• Makes modeling easier to do
• Keeps user focused on investment choices rather than complex modeling
• Reduces cost for modeling analysis
• Ministries can avoid having expensive dedicated modeling units
• Online AIDA is even easier!• But fewer policy options available
Excel-based Modeling Framework
ReportResults
By sectors, regions & household groups
Dynamic CGE Model
Production & prices
Jobs & migration
Economic growth & structural change
Micro-Simulation
Poverty incidence & depth
Inequality
Dietary change
Design Scenarios
New budget level & allocation
Unit costs & impact parameters
Nexus SAM Database
National accounts
Public finances
Enterprise & household surveys
Investment Analysis
Farm impact estimates
Unit costs
Past budget levels & allocations
User Interface Model
Data
Problems for offline version• Takes time to run a model in real-time • Model may not find a solution• Modeling software knowledge & licenses required
Result• Most policy analysts use less-sophisticated tools
Simulation procedure• User selects different spending levels and types and
policy reform options• Send choices to the model, which runs and returns
results
Examples of how CGE-based results help governments in decision making
• IFPRI’s CGE models are used to assist countries’ to evaluate and prioritize their agricultural investments and policies as part of the African Union’s Comprehensive African Agricultural Development Program (CAADP). • In Malawi, Uganda, Ghana and Rwanda modelling analysis was used to facilitate a debate between Ministries of
Agriculture and Finance and international donors on the role of agriculture in the country’s national development plan. • IFPRI’s models was explicitly cited by the government when choosing to revoke Tanzania’s recent maize export ban.
• IFPRI’s economywide evaluation of Malawi’s input subsidy program formed part of a IFPRI-facilitated dialogue on subsidy
• IFPRI’s CGE models are routinely used in a number of government policy units to design national development strategies, including identifying the contribution of agriculture to broader development processes. • In Ethiopia, IFPRI worked with government-appointed policy analysts to provide the macroeconomic framework to the
Second Growth and Transformation Plan, which included setting targets and investment priorities for the agricultural sector.
• In South Africa, IFPRI’s models are used on a regular basis to evaluate energy investment strategies, water resource management, climate change risks, and policies to reduce poverty and unemployment.
• In Yemen, IFPRI’s CGE model and its findings on trade-offs and cost/benefits across various food security sectors and investments was the basis for the formulation of Yemen’s National Food Security Strategy.
• In Egypt, IFPRI worked with CAPMAS, MOPMAR and the World Bank to analyse the impacts energy subsidy reforms
• IFPRI’s CGE economywide models and analysis are routinely used by international development organizations to support their policy dialogue with national governments. Two current examples illustrate this trend. • World Bank is using model-based analysis to encourage governments in Africa and Asia to consider rural-urban linkages
• FAO is expanding its CGE modeling capabilities, with IFPRI support, to inform their policy engagement• IFAD is working with IFPRI to inform country strategic plans and support countries in investment prioritization (RIAPA-AIDA)
From offline to online CGE modeling: the case of AIDA and agricultural investment analysis
• AIDA Arab Investment for Development Analyzer (AIDA) is an evidence-based tool for prioritizing agricultural policies and investments. It can assess “packages” of interventions and captures the whole of agriculture-food system and national economy
The project has 3 components:
1. Component 1: Prioritizing Rural Investments and Policies
✓ Overview and Rationale
✓ Investment and Policy
✓ Economy-wide analysis
2. Component 2: Advocacy and Policy Engagement
3. Component 3: Community of Practice
AIDA: Policy and Investment Analysis From “offline” to
online CGE models
Additional support from IFAD “Rural Investment and Policy Analysis (RIAPA) Model”; CGIAR Research Program on “Policies, Institutions and Markets” (PIM); BMGF Project “Prioritizing Policies for Driving
Inclusive Agricultural Transformation”
Policy Challenge
• Designing agricultural policies and investment plans is challenging• Allocate scarce resources across both interventions and locations
• Consider both investments and policy reforms
• Track downstream spillovers and trade-offs (i.e., systems approach)
• Link agricultural spending to growth, job creation, and household poverty Sp
atia
l allo
cati
on
Sectoral allocation
Where to invest?
Which crops or activities to invest in?
What interventions to prioritize?
Three dimensions of decision-making
Evaluating Investments and Policies against a “Baseline”
Investment and policy
shocks
Base year
Baseline (with investments/policies)
Alternative baseline (without investments/policies)
Final year
New package effects (applied on alt. baseline)
Source: Thurlow, 2018
Example: Economywide Approach to Prioritization
• Evaluate national development strategy• Within & beyond agriculture (i.e., food system)
• Across ministries and public-private sectors
• Cover full range of policies and investments• Investments affect productivity or behavior
through direct spending (e.g., irrigation, inputs)
• Regulations set quality standards and directly restrict quantities (e.g., export bans)
National Strategy
Policies
Trade & pricesSocial transfersMacroeconomic
Investments
On-farmOff-farmEconomywide
Regulations
Source: Thurlow, 2018
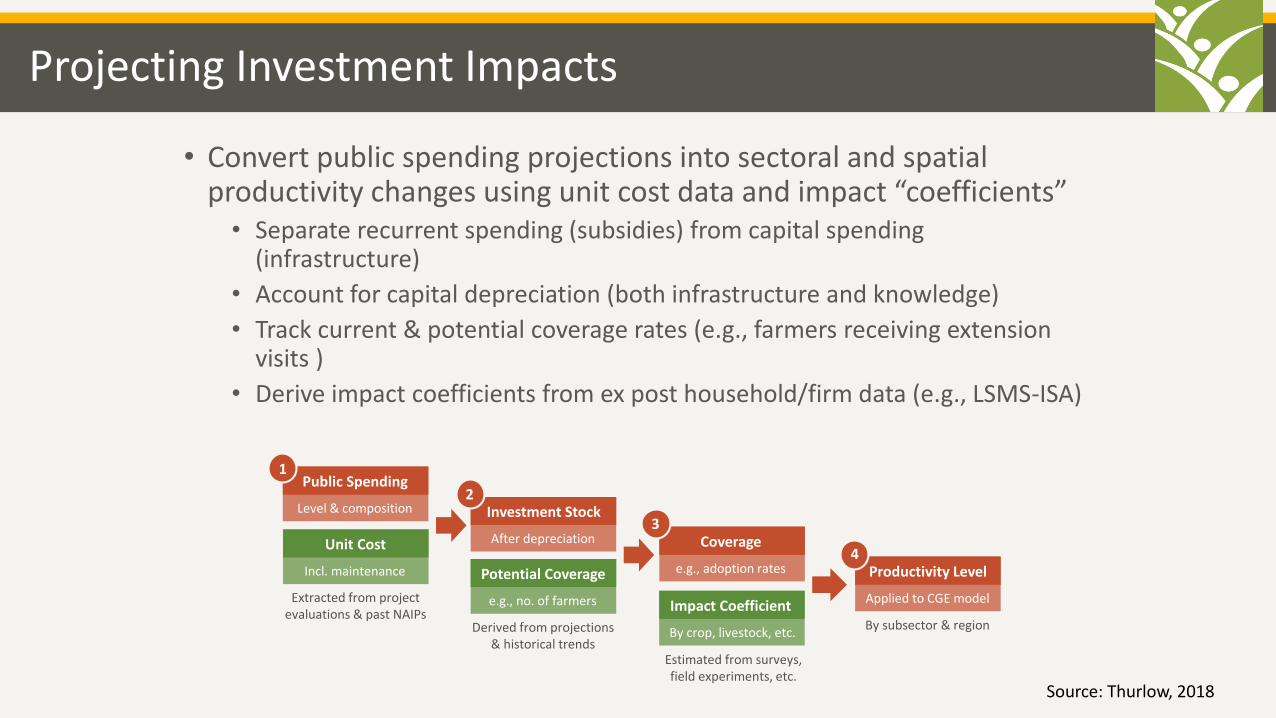
Projecting Investment Impacts
• Convert public spending projections into sectoral and spatial productivity changes using unit cost data and impact “coefficients”• Separate recurrent spending (subsidies) from capital spending
(infrastructure)
• Account for capital depreciation (both infrastructure and knowledge)
• Derive impact coefficients from ex post household/firm data (e.g., LSMS-ISA)
Public Spending
Level & composition
1
Unit Cost
Incl. maintenance
Investment Stock
After depreciation
Potential Coverage
e.g., no. of farmers
Coverage
e.g., adoption rates
2
3
Impact Coefficient
By crop, livestock, etc.
Productivity Level
Applied to CGE model
4
Estimated from surveys, field experiments, etc.
Derived from projections & historical trends
Extracted from project evaluations & past NAIPs
By subsector & region
Source: Thurlow, 2018
Types of Questions that AIDA can answer:
• What is the economywide impact of different packages of investments and policies?• On-farm vs. downstream value-addition
• Number of jobs created and people lifted out of poverty
• What are the spatial and temporal trade-offs of different packages?• Growth in high-return areas vs. poverty reduction in lagging regions
• Short vs. long-run (e.g., fertilizer subsidies vs. irrigation infrastructure)
• What are the implications of different financing options?e.g., raising taxes, foreign borrowing, reducing spending elsewhere
• Are my policy expectations reasonable?• How would a change in policy affect the impact of the new investment package?
• Increasing expenditures vs. improving investment efficiency
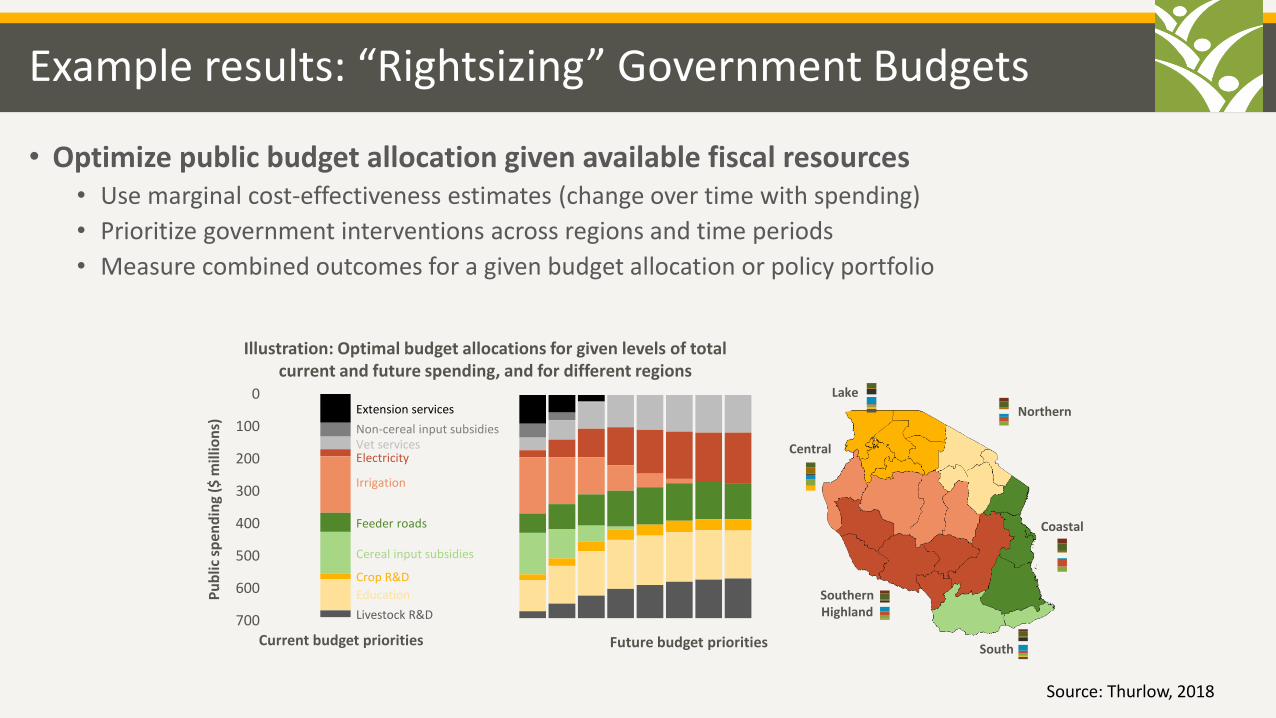
Example results: “Rightsizing” Government Budgets
• Optimize public budget allocation given available fiscal resources• Use marginal cost-effectiveness estimates (change over time with spending)
• Prioritize government interventions across regions and time periods
• Measure combined outcomes for a given budget allocation or policy portfolio
0
100
200
300
400
500
600
700
Pu
blic
sp
end
ing
($ m
illio
ns)
Extension services
Non-cereal input subsidies Vet servicesElectricity
Irrigation
Feeder roads
Cereal input subsidies
Crop R&D
Education
Livestock R&D
Current budget priorities Future budget priorities
Illustration: Optimal budget allocations for given levels of total current and future spending, and for different regions
Lake
Coastal
Southern Highland
South
Northern
Central
Source: Thurlow, 2018
Towards the Online Modeling Framework
Online Results Database
Match user’s scenario to pre-solved results
“Big Data” search algorithms
Dynamic CGE Model
Production & prices
Jobs & migration
Economic growth & structural change
Micro-Simulation
Poverty incidence & depth
Inequality
Dietary change
Design Scenarios Report Results
New budget level & allocation
Unit costs & impact parameters
Nexus SAM Database
National accounts
Public finances
Enterprise & household surveys
Investment Analysis
Farm impact estimates
Unit costs
Past budget levels & allocations
User Interface Model
Data
Advantages• Searching a database is much quicker than running a model• Solution is guaranteed since simulations are pre-solved• No modeling software knowledge or licenses required
Result• More policy analysts with access to “frontier” tools
Innovative simulation procedure• Pre-run model thousands of time to capture range of
possible policy scenarios (generate results database)• User makes policy choices online and these are
matched as closely as possible to results database
Result Indicators from Online AIDA
• Typical development outcome indicators for each investment and policy package:• National and agriculture-food system aggregate, e.g. GDP and employment
• Macro distribution, e.g. investment vs consumption; private vs public demand
• Sectoral distribution, e.g. agriculture vs non-agriculture; tradeable vs non-tradables
• Spatial distribution, e.g. North/Bekaa/Mount Lebanon/South
• Functional distribution, e.g. labor income vs capital income; skilled vs non-skilled labor income etc.
• Household distribution, e.g. rural vs urban, poverty headcounts and gaps, dietary change
• Measure rates of return for each policy and for overall package• e.g., AFS GDP gain per dollar spent on investments or revenues lost from policy change
• e.g., Number of people lifted above the poverty line per dollar spent
Summary and Next Steps for AIDA
• CGE models have gone through a substantial evolution
• Online CGE models are expected to broaden access to “non CGE expert” economists and increase the use by governments and policy analysts
• Ongoing and next steps for AIDA model:• Close collaboration with country partners, especially statistical bureaus (for SAM), Ministries of Planning
(for “housing” CGE models) and line Ministries like Agriculture, Trade and Finance
• AIDA Egypt model expected by September 2018 and AIDA Tunisia by December 2018, Lebanon and Jordan to follow in 2019. All will be available free and on the www
• For now online AIDA focuses on rural investments and policies, but there is interest to expand AIDA models to additional purposes such as developing national development plans and rapid response tasks (Egypt)