32
© 2015 IHS TRENDS IN THE POLYMERS MARKET IHS CHEMICAL Jesse Tijerina, Managing Director, Consulting Americas +1 281 752 3251 [email protected]
© 2015 IHS
TRENDS IN THE POLYMERS MARKET
IHS CHEMICAL
Jesse Tijerina, Managing Director, Consulting Americas
+1 281 752 3251

© 2015 IHS
ENERGY
© 2015 IHS
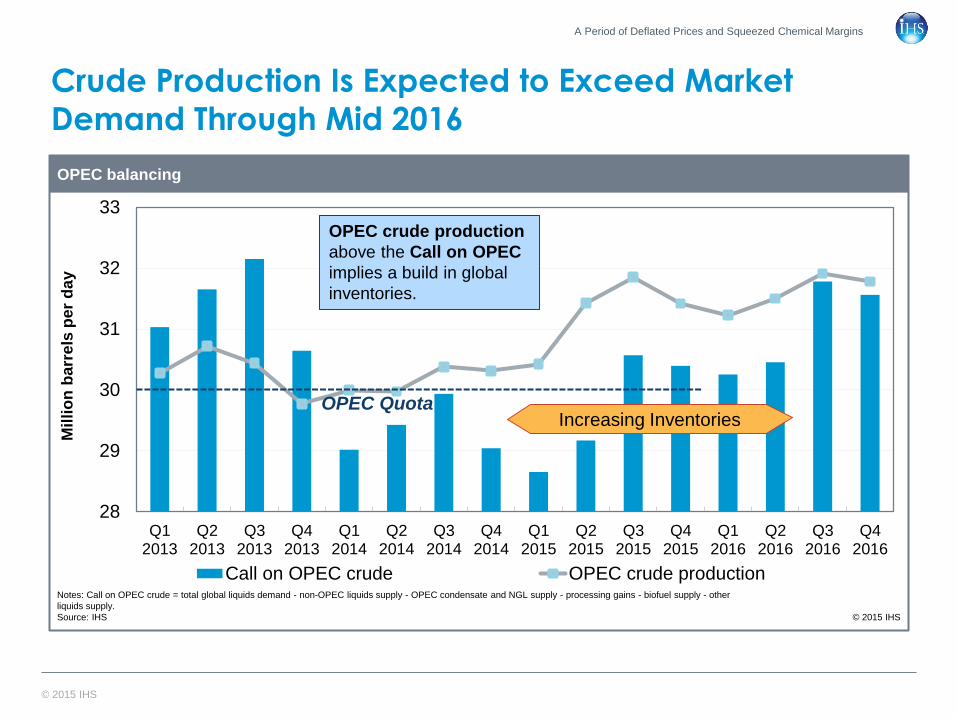
Crude Production Is Expected to Exceed Market
Demand Through Mid 2016
A Period of Deflated Prices and Squeezed Chemical Margins
28
29
30
31
32
33
Q12013
Q22013
Q32013
Q42013
Q12014
Q22014
Q32014
Q42014
Q12015
Q22015
Q32015
Q42015
Q12016
Q22016
Q32016
Q42016
Call on OPEC crude OPEC crude production
OPEC balancing
Notes: Call on OPEC crude = total global liquids demand - non-OPEC liquids supply - OPEC condensate and NGL supply - processing gains - biofuel supply - other
liquids supply.
Source: IHS © 2015 IHS
Mil
lio
n b
arr
els
per
da
y
OPEC crude production
above the Call on OPEC
implies a build in global
inventories.
OPEC Quota Increasing Inventories

© 2015 IHS
After Falling from the Cliff, Crude Prices Are Expected
to Bottom at Turn of the Year
Dated Brent and other benchmark crude oil price outlook to 2016
0
20
40
60
80
100
120
140
Brent - WTI
Brent FOB
Dubai FOB
WTI Cushing
© 2015 IHS 5
Presentation Name / Month 2015
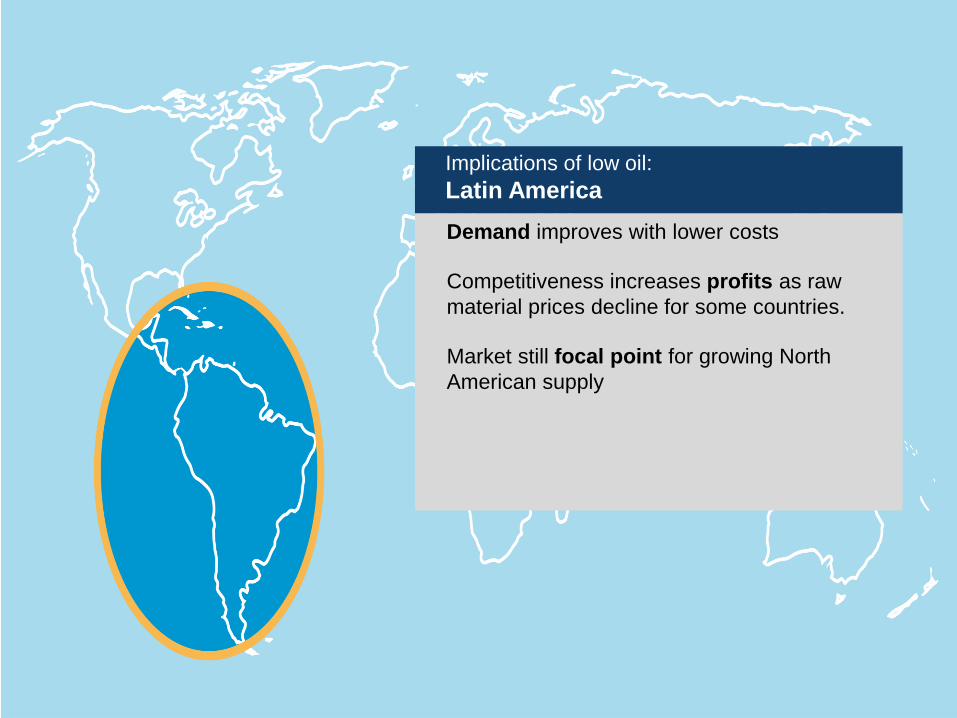
Demand improves with lower costs
Competitiveness increases profits as raw
material prices decline for some countries.
Market still focal point for growing North
American supply
Implications of low oil:
Latin America

© 2015 IHS
ECONOMY
© 2015 IHS. ALL RIGHTS RESERVED.
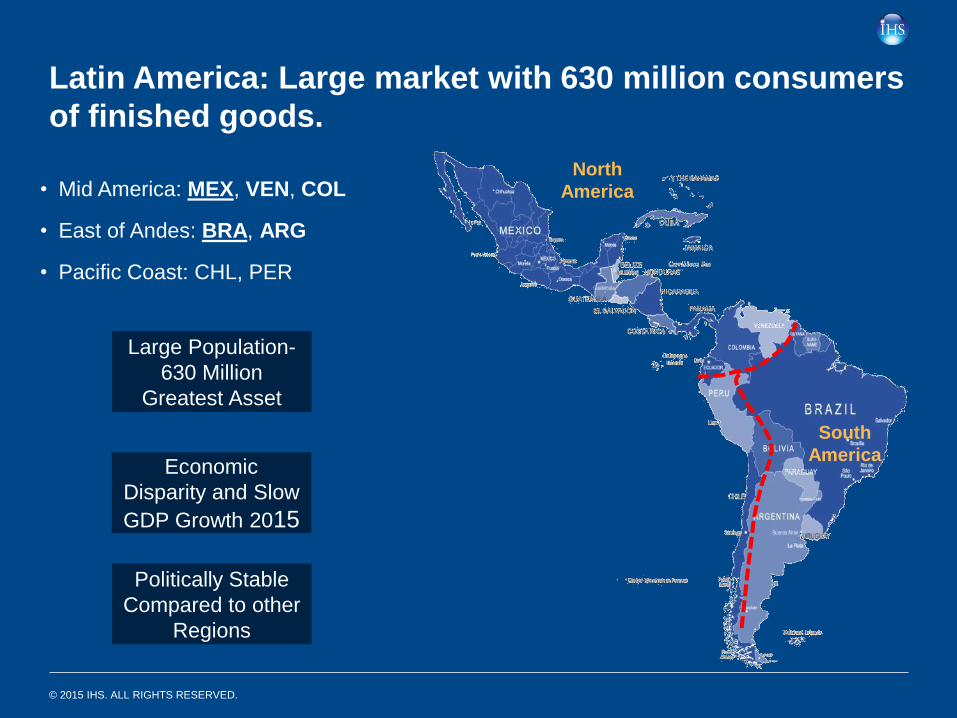
Latin America: Large market with 630 million consumers
of finished goods.
• Mid America: MEX, VEN, COL
• East of Andes: BRA, ARG
• Pacific Coast: CHL, PER
South
America
North
America
Economic
Disparity and Slow
GDP Growth 2015
Politically Stable
Compared to other
Regions
Large Population-
630 Million
Greatest Asset
© 2015 IHS
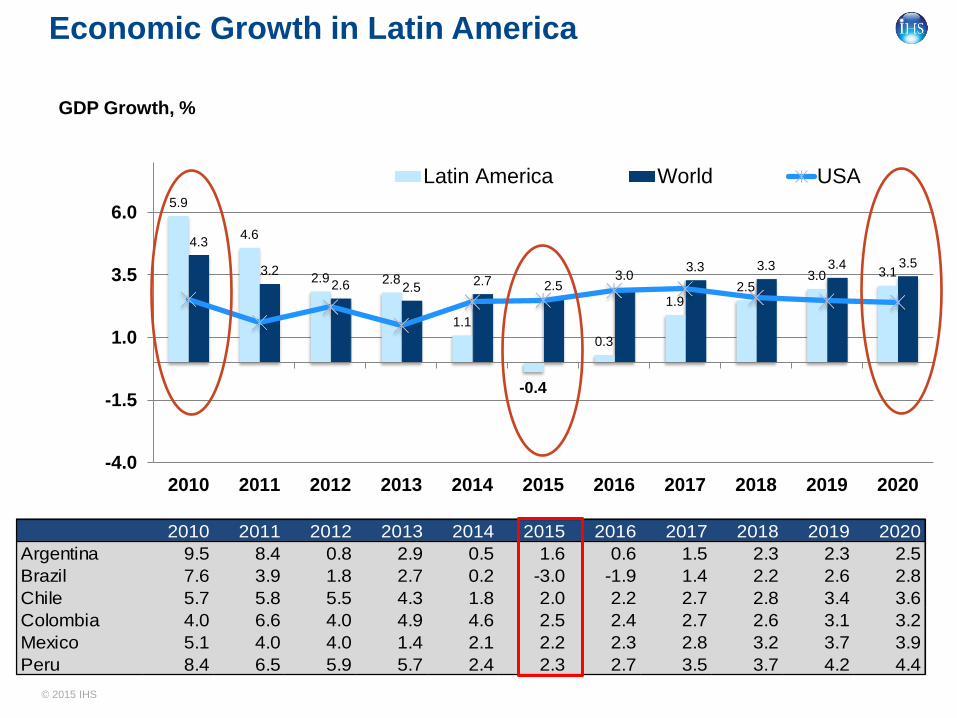
5.9
4.6
2.9 2.8
1.1
-0.4
0.3
1.9 2.5
3.0 3.1
4.3
3.2 2.6 2.5
2.7 2.5 3.0
3.3 3.3 3.4 3.5
-4.0
-1.5
1.0
3.5
6.0
2010 2011 2012 2013 2014 2015 2016 2017 2018 2019 2020
Latin America World USA
Economic Growth in Latin America
GDP Growth, %
2010 2011 2012 2013 2014 2015 2016 2017 2018 2019 2020
Argentina 9.5 8.4 0.8 2.9 0.5 1.6 0.6 1.5 2.3 2.3 2.5
Brazil 7.6 3.9 1.8 2.7 0.2 -3.0 -1.9 1.4 2.2 2.6 2.8
Chile 5.7 5.8 5.5 4.3 1.8 2.0 2.2 2.7 2.8 3.4 3.6
Colombia 4.0 6.6 4.0 4.9 4.6 2.5 2.4 2.7 2.6 3.1 3.2
Mexico 5.1 4.0 4.0 1.4 2.1 2.2 2.3 2.8 3.2 3.7 3.9
Peru 8.4 6.5 5.9 5.7 2.4 2.3 2.7 3.5 3.7 4.2 4.4

© 2015 IHS
Polymer Industry Overview
© 2015 IHS 10
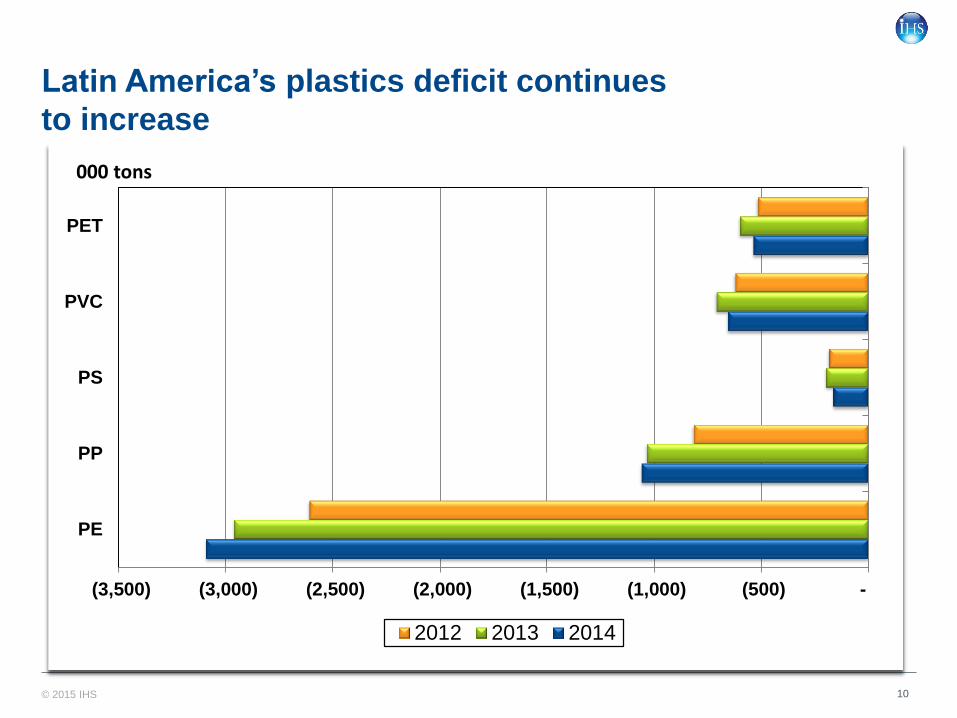
Latin America’s plastics deficit continues
to increase
(3,500) (3,000) (2,500) (2,000) (1,500) (1,000) (500) -
PE
PP
PS
PVC
PET
2012 2013 2014
000 tons

© 2015 IHS
PE
PP, 3995
PVC PET Other
PE PP, 3255
PVC
PET Other
2009 2013
2009 Latin America Plastics
Demand = 15.3 MMT
2013 Latin America Plastics
Demand = 17.8 MMT
AAGR 09-13
4.4%
Latin America Plastics Consumption Has Been Growing
with No Additional Capacity
© 2015 IHS
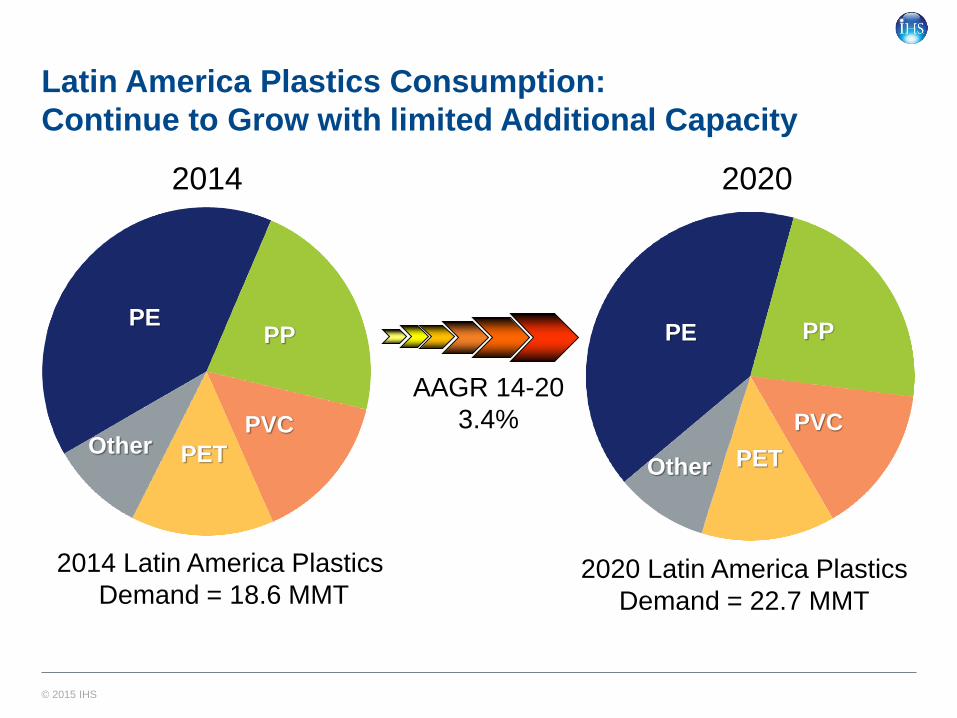
PE PP
PVC
PET Other
PE PP
PVC
PET Other
2014 2020
2014 Latin America Plastics
Demand = 18.6 MMT
2020 Latin America Plastics
Demand = 22.7 MMT
AAGR 14-20
3.4%
Latin America Plastics Consumption:
Continue to Grow with limited Additional Capacity
© 2015 IHS
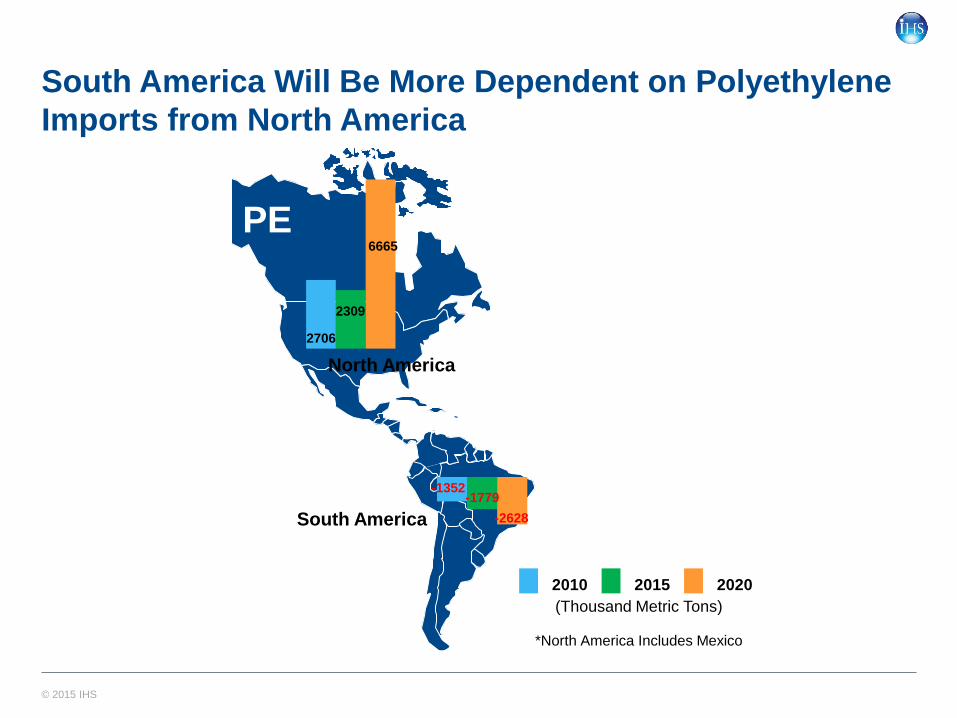
South America Will Be More Dependent on Polyethylene
Imports from North America
(Thousand Metric Tons)
*North America Includes Mexico
2010 2015 2020
North America
South America
PE PP
2706
2309
6665
-1352 -1779
-2628
© 2015 IHS
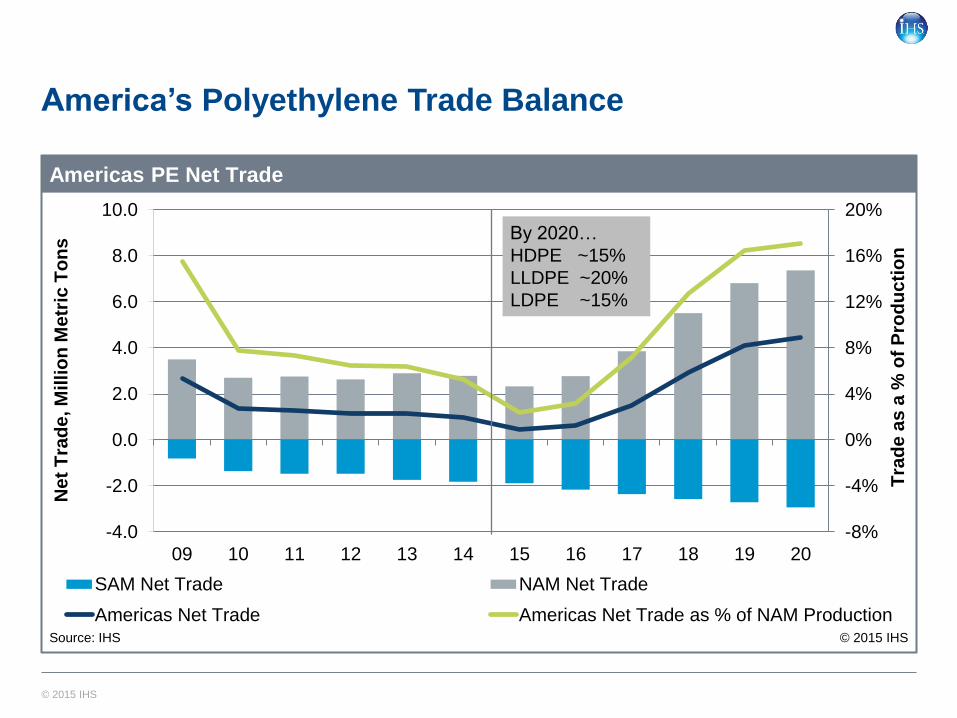
America’s Polyethylene Trade Balance
-8%
-4%
0%
4%
8%
12%
16%
20%
-4.0
-2.0
0.0
2.0
4.0
6.0
8.0
10.0
09 10 11 12 13 14 15 16 17 18 19 20
SAM Net Trade NAM Net Trade
Americas Net Trade Americas Net Trade as % of NAM Production
Americas PE Net Trade
Source: IHS © 2015 IHS
Ne
t T
rad
e, M
illio
n M
etr
ic T
on
s
Tra
de
as
a %
of
Pro
du
cti
on
By 2020…
HDPE ~15%
LLDPE ~20%
LDPE ~15%
© 2015 IHS
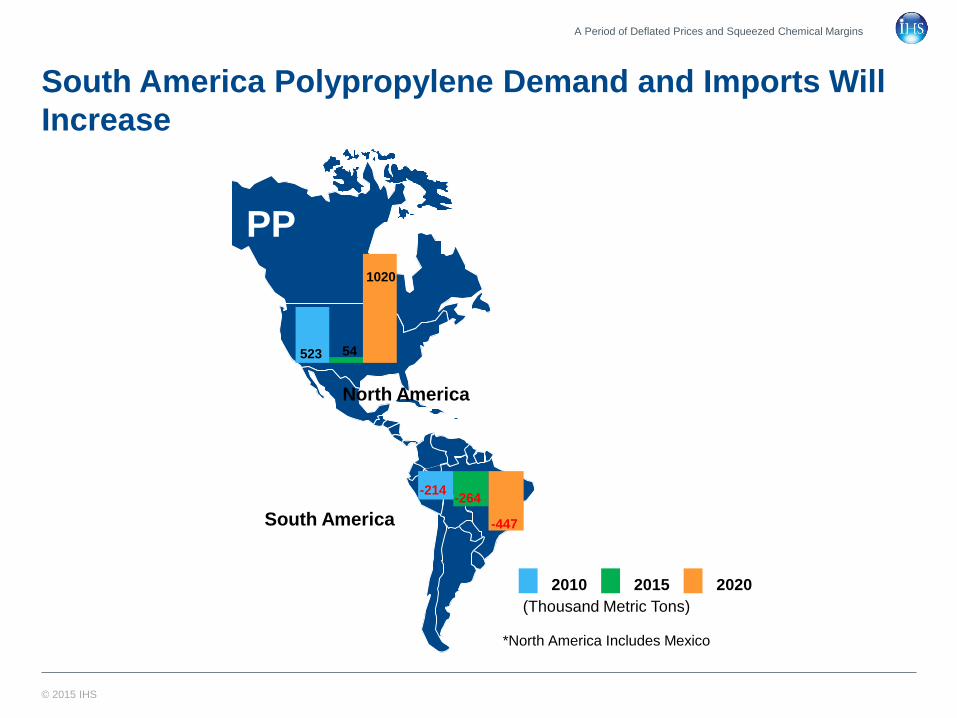
South America Polypropylene Demand and Imports Will
Increase
A Period of Deflated Prices and Squeezed Chemical Margins
(Thousand Metric Tons)
*North America Includes Mexico
2010 2015 2020
PP
North America
South America
523
1020
54
-214 -264
-447
© 2015 IHS
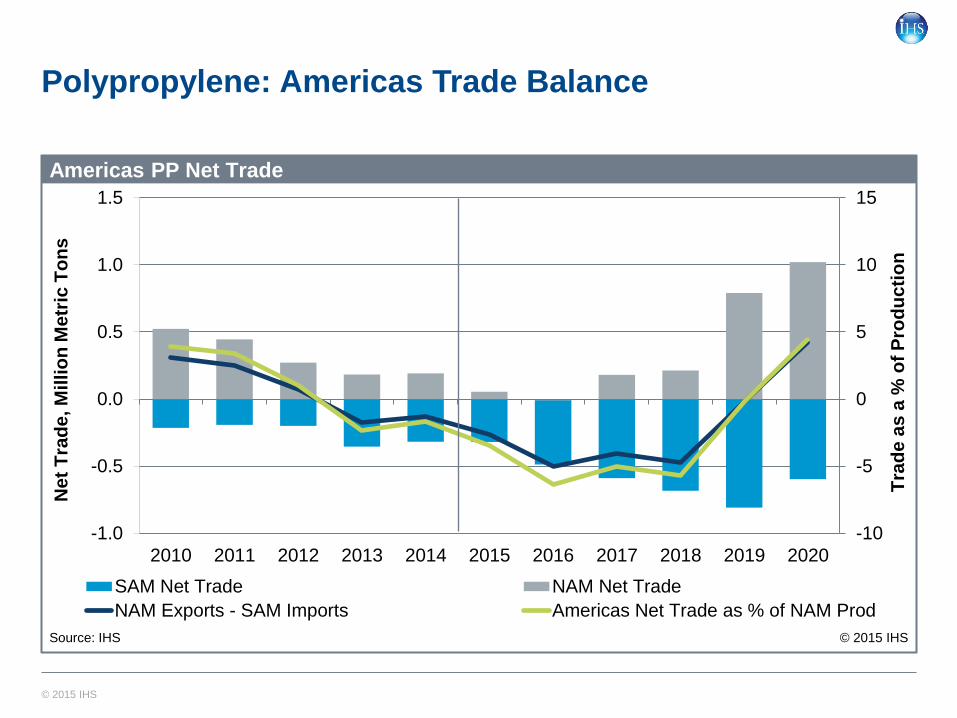
Polypropylene: Americas Trade Balance
-10
-5
0
5
10
15
-1.0
-0.5
0.0
0.5
1.0
1.5
2010 2011 2012 2013 2014 2015 2016 2017 2018 2019 2020
SAM Net Trade NAM Net Trade
NAM Exports - SAM Imports Americas Net Trade as % of NAM Prod
Americas PP Net Trade
Source: IHS © 2015 IHS
Ne
t T
rad
e, M
illio
n M
etr
ic T
on
s
Tra
de
as
a %
of
Pro
du
cti
on
© 2015 IHS
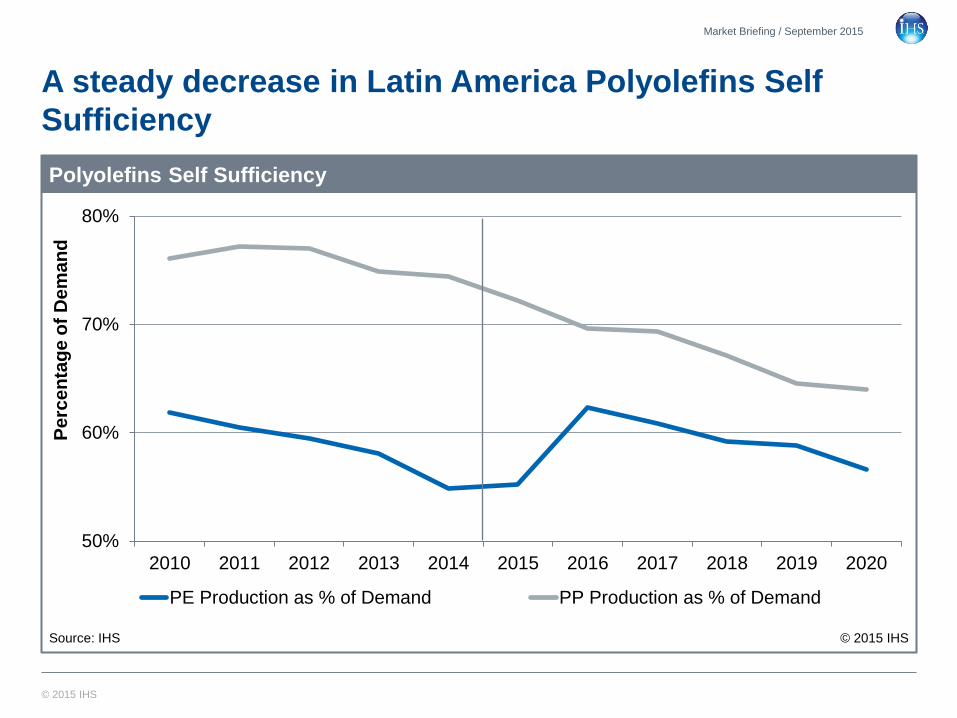
A steady decrease in Latin America Polyolefins Self
Sufficiency
Market Briefing / September 2015
50%
60%
70%
80%
2010 2011 2012 2013 2014 2015 2016 2017 2018 2019 2020
PE Production as % of Demand PP Production as % of Demand
Polyolefins Self Sufficiency
© 2015 IHS
Pe
rce
nta
ge
of
De
ma
nd
Source: IHS
© 2015 IHS
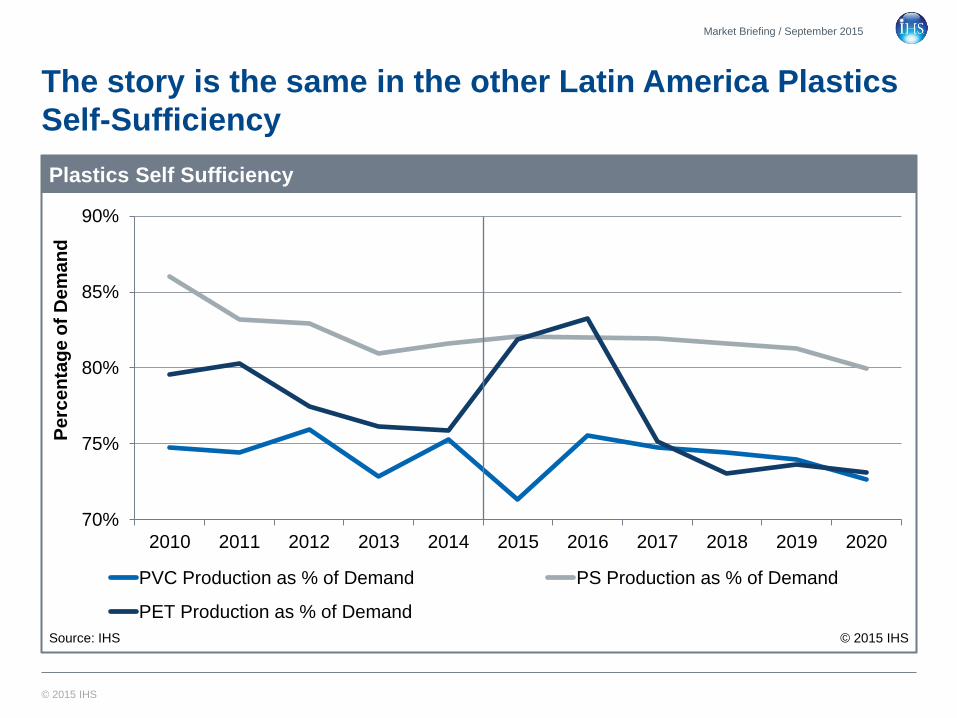
The story is the same in the other Latin America Plastics
Self-Sufficiency
Market Briefing / September 2015
70%
75%
80%
85%
90%
2010 2011 2012 2013 2014 2015 2016 2017 2018 2019 2020
PVC Production as % of Demand PS Production as % of Demand
PET Production as % of Demand
Plastics Self Sufficiency
© 2015 IHS
Pe
rce
nta
ge
of
De
ma
nd
Source: IHS
© 2015 IHS
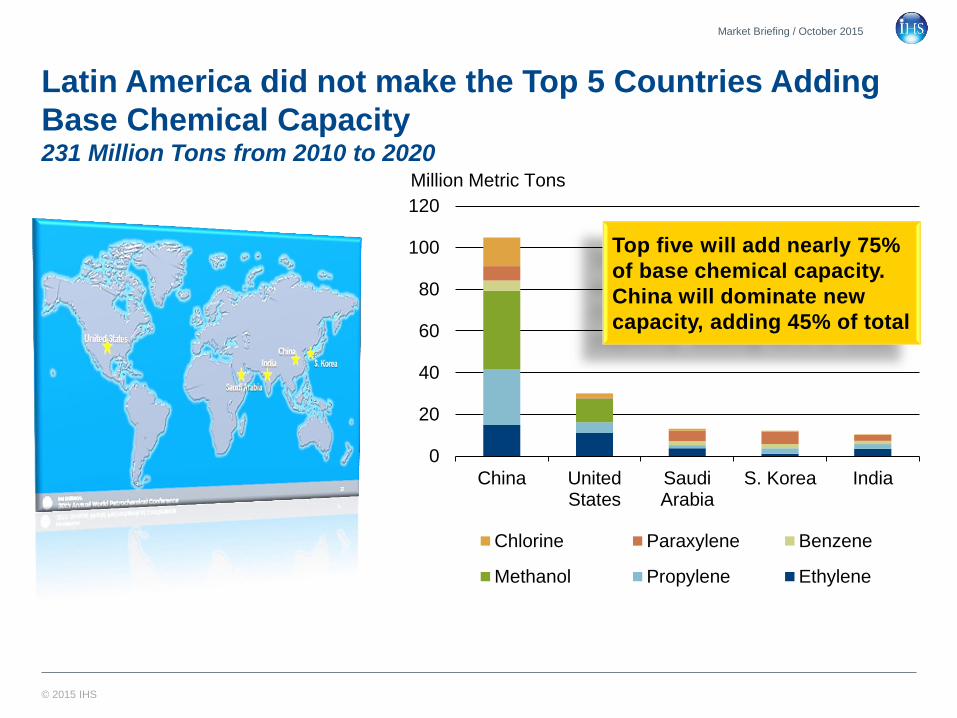
Latin America did not make the Top 5 Countries Adding
Base Chemical Capacity 231 Million Tons from 2010 to 2020
Market Briefing / October 2015
0
20
40
60
80
100
120
China UnitedStates
SaudiArabia
S. Korea India
Chlorine Paraxylene Benzene
Methanol Propylene Ethylene
Million Metric Tons
Top five will add nearly 75%
of base chemical capacity.
China will dominate new
capacity, adding 45% of total

© 2015 IHS
COUNTRY OVERVIEW

© 2015 IHS
Venezuela
• Low crude oil prices and currency crisis
restricted availability of raw materials and
created scarcity of finished goods.
• Most affected by lower crude oil prices..
• Economic downturn and currency crisis
may lead to political unrests.
Colombia
• Ecopetrol focusing on completion of
Cartagena Refinery expansion by YE 2015.
• Economic growth will slow down, but will
still lead Latin America.
• Domestic demand for petrochemicals
increasing.
Mid America: Country Overview
Mexico
• Energy reform is opening new
possibilities. Foreign Direct Investment
will enter slowly.
• Lower electricity costs expected to
increase competitiveness as gas pipeline
carry cheap gas to Mexico.
• Etileno XXI startup end 2015 First new
capacity in North America.
• Demand recovering in 2016 amid lower
petrochemical prices.

© 2015 IHS
Mercosur: Country Overview
Brazil
• Brazil expected to contract by 3.0
• Low crude oil prices and scandals
related to corruption is keeping
investment low.
• Weaker Real slows down purchases
but makes local products more
attractive.
• Drought affecting power & gasoline
supply.
• Petrochemical Projects cancelled. No
Expansions through 2020.
Argentina
• Energy development continues with
focus on Vaca Muerta (Shale - NGL).
• GDP Contracted to nearly zero.
• Presidential elections this year.
Some changes may come after
elections.
• Dow and YPF working to increase
ethane supply to increase capacity in
Bahia Blanca.

© 2015 IHS
Pacific Coast: Country Overview
Chile
• Closure of small ENAP Ethylene &
Petro Dow PE units in Talcahuano in
2014.
• Slowdown in GDP growth from ~5.6%
2010-12 to ~2.2% in 2015-16.
• Increased availability of product from
North America and Asia will continue to
supply product to support local growth
in Chile.
• Convertors will benefit from additional
supply and growth will follow.
Peru
• 2014 was a challenging year for its
economy, but we expect a slight
recovery in 2015 GDP growth.
• Odebrecht awarded contract to build
gas pipeline from Camisea to
Southern Peru.
• This new gas pipeline could
stimulate a Petrochemical project in
the South of Peru.

© 2015 IHS
TRENDS
© 2015 IHS
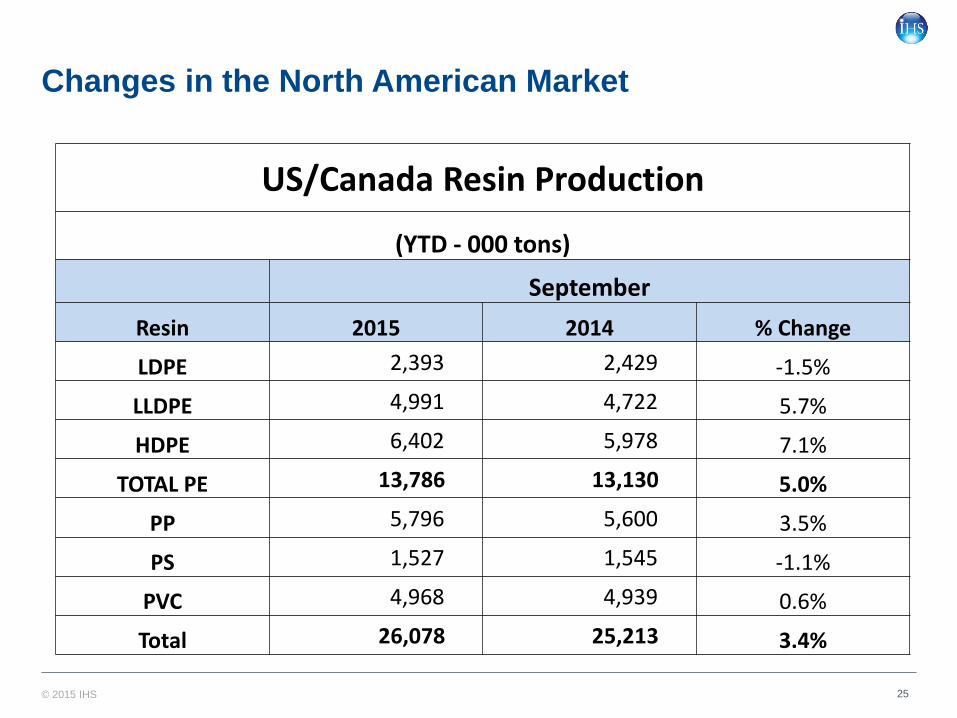
Changes in the North American Market
25
US/Canada Resin Production
(YTD - 000 tons)
September
Resin 2015 2014 % Change
LDPE 2,393 2,429 -1.5%
LLDPE 4,991 4,722 5.7%
HDPE 6,402 5,978 7.1%
TOTAL PE 13,786 13,130 5.0%
PP 5,796 5,600 3.5%
PS 1,527 1,545 -1.1%
PVC 4,968 4,939 0.6%
Total 26,078 25,213 3.4%
© 2015 IHS
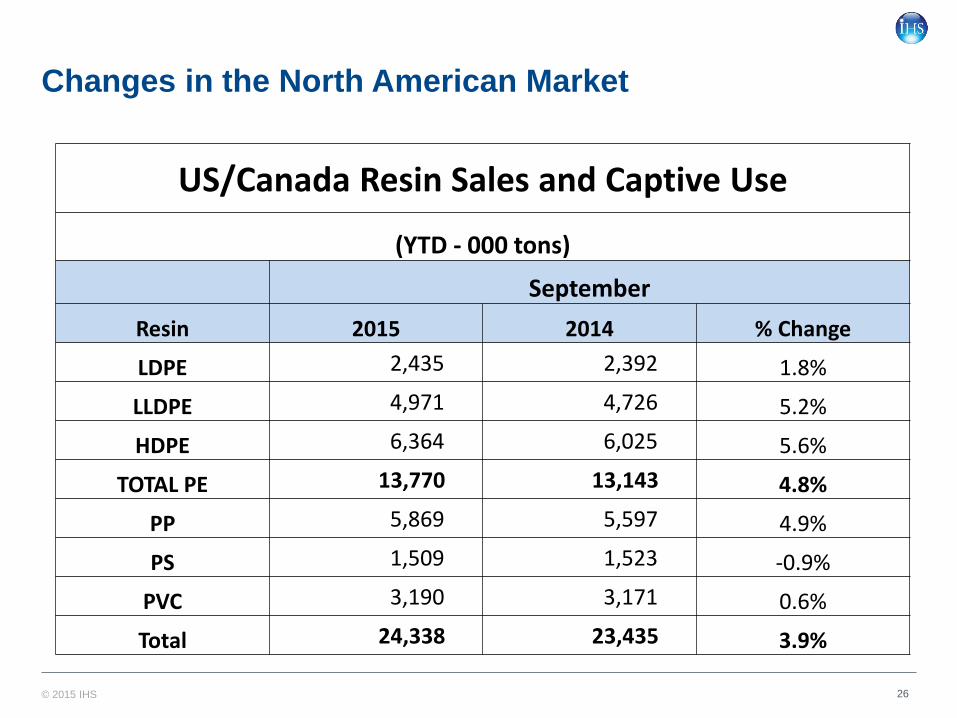
Changes in the North American Market
26
US/Canada Resin Sales and Captive Use
(YTD - 000 tons)
September
Resin 2015 2014 % Change
LDPE 2,435 2,392 1.8%
LLDPE 4,971 4,726 5.2%
HDPE 6,364 6,025 5.6%
TOTAL PE 13,770 13,143 4.8%
PP 5,869 5,597 4.9%
PS 1,509 1,523 -0.9%
PVC 3,190 3,171 0.6%
Total 24,338 23,435 3.9%
© 2015 IHS 27
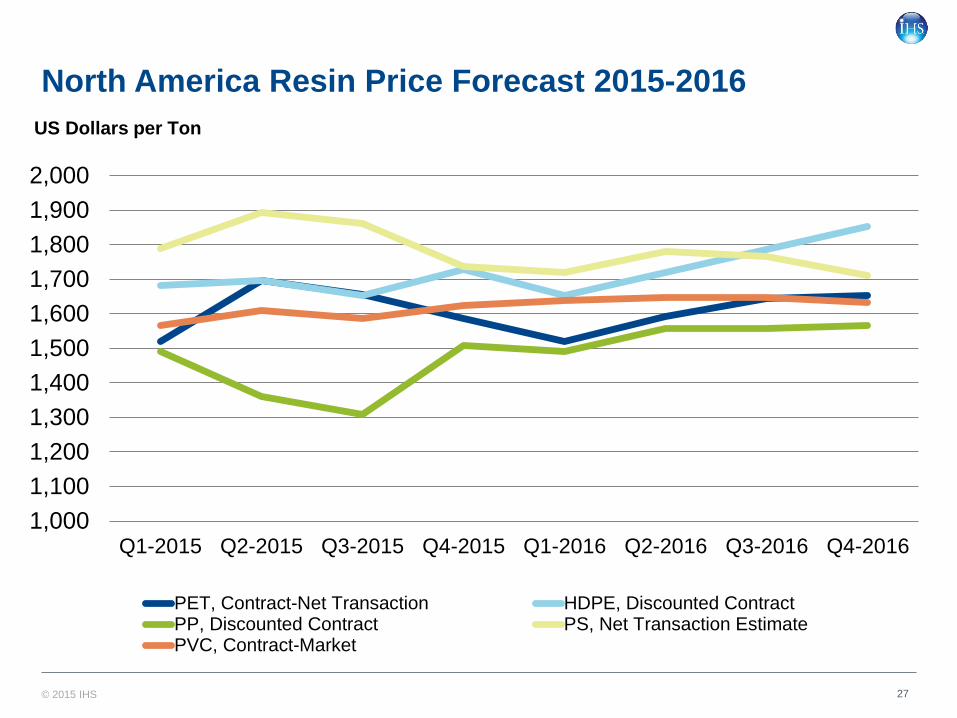
North America Resin Price Forecast 2015-2016
1,000
1,100
1,200
1,300
1,400
1,500
1,600
1,700
1,800
1,900
2,000
Q1-2015 Q2-2015 Q3-2015 Q4-2015 Q1-2016 Q2-2016 Q3-2016 Q4-2016
PET, Contract-Net Transaction HDPE, Discounted ContractPP, Discounted Contract PS, Net Transaction EstimatePVC, Contract-Market
US Dollars per Ton
© 2015 IHS 28
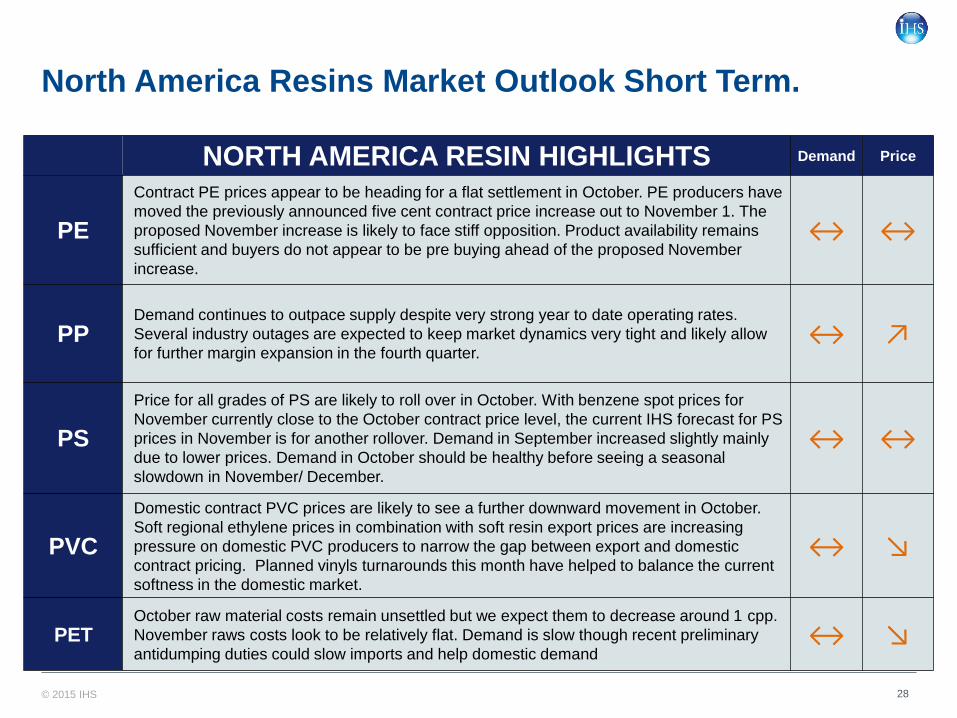
North America Resins Market Outlook Short Term.
NORTH AMERICA RESIN HIGHLIGHTS Demand Price
PE
Contract PE prices appear to be heading for a flat settlement in October. PE producers have
moved the previously announced five cent contract price increase out to November 1. The
proposed November increase is likely to face stiff opposition. Product availability remains
sufficient and buyers do not appear to be pre buying ahead of the proposed November
increase.
↔ ↔
PP Demand continues to outpace supply despite very strong year to date operating rates.
Several industry outages are expected to keep market dynamics very tight and likely allow
for further margin expansion in the fourth quarter. ↔ ↗
PS
Price for all grades of PS are likely to roll over in October. With benzene spot prices for
November currently close to the October contract price level, the current IHS forecast for PS
prices in November is for another rollover. Demand in September increased slightly mainly
due to lower prices. Demand in October should be healthy before seeing a seasonal
slowdown in November/ December.
↔ ↔
PVC
Domestic contract PVC prices are likely to see a further downward movement in October.
Soft regional ethylene prices in combination with soft resin export prices are increasing
pressure on domestic PVC producers to narrow the gap between export and domestic
contract pricing. Planned vinyls turnarounds this month have helped to balance the current
softness in the domestic market.
↔ ↘
PET October raw material costs remain unsettled but we expect them to decrease around 1 cpp.
November raws costs look to be relatively flat. Demand is slow though recent preliminary
antidumping duties could slow imports and help domestic demand ↔ ↘
© 2015 IHS. ALL RIGHTS RESERVED.
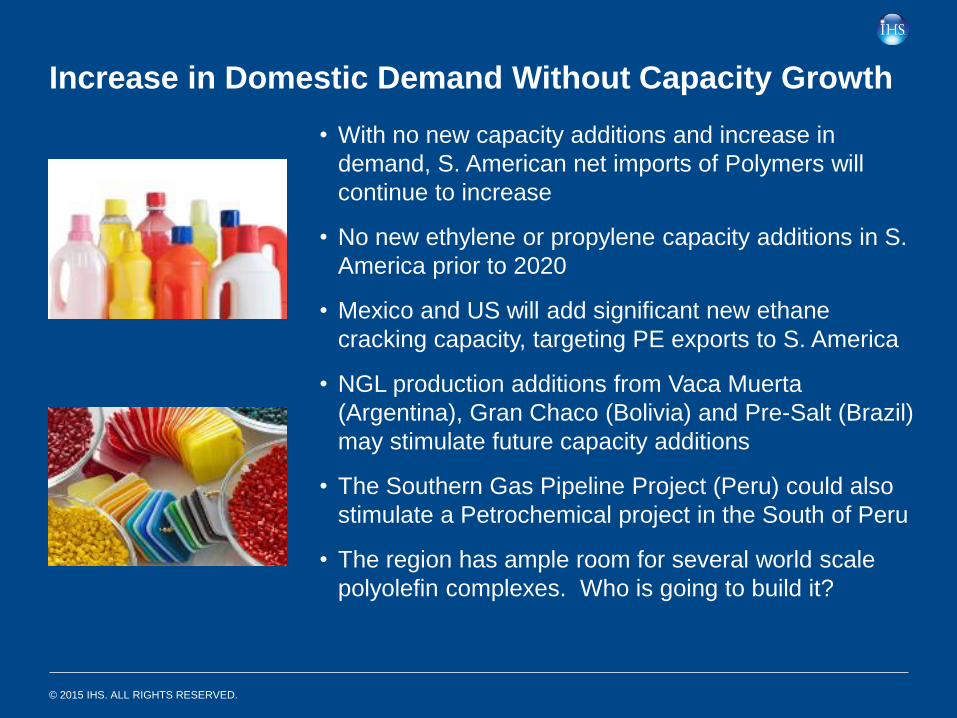
Increase in Domestic Demand Without Capacity Growth
• With no new capacity additions and increase in
demand, S. American net imports of Polymers will
continue to increase
• No new ethylene or propylene capacity additions in S.
America prior to 2020
• Mexico and US will add significant new ethane
cracking capacity, targeting PE exports to S. America
• NGL production additions from Vaca Muerta
(Argentina), Gran Chaco (Bolivia) and Pre-Salt (Brazil)
may stimulate future capacity additions
• The Southern Gas Pipeline Project (Peru) could also
stimulate a Petrochemical project in the South of Peru
• The region has ample room for several world scale
polyolefin complexes. Who is going to build it?
© 2015 IHS
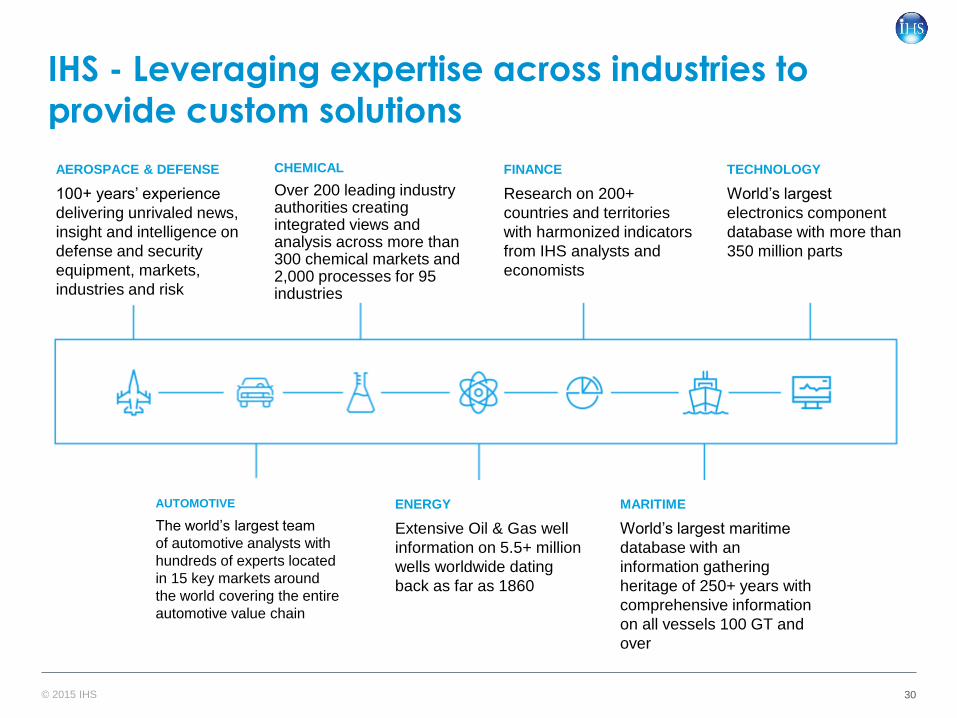
IHS - Leveraging expertise across industries to provide custom solutions
30
AEROSPACE & DEFENSE
100+ years’ experience
delivering unrivaled news,
insight and intelligence on
defense and security
equipment, markets,
industries and risk
CHEMICAL
Over 200 leading industry authorities creating integrated views and analysis across more than 300 chemical markets and 2,000 processes for 95 industries
FINANCE
Research on 200+
countries and territories
with harmonized indicators
from IHS analysts and
economists
TECHNOLOGY
World’s largest
electronics component
database with more than
350 million parts
AUTOMOTIVE
The world’s largest team
of automotive analysts with
hundreds of experts located
in 15 key markets around
the world covering the entire
automotive value chain
ENERGY
Extensive Oil & Gas well
information on 5.5+ million
wells worldwide dating
back as far as 1860
MARITIME
World’s largest maritime
database with an
information gathering
heritage of 250+ years with
comprehensive information
on all vessels 100 GT and
over
© 2015 IHS
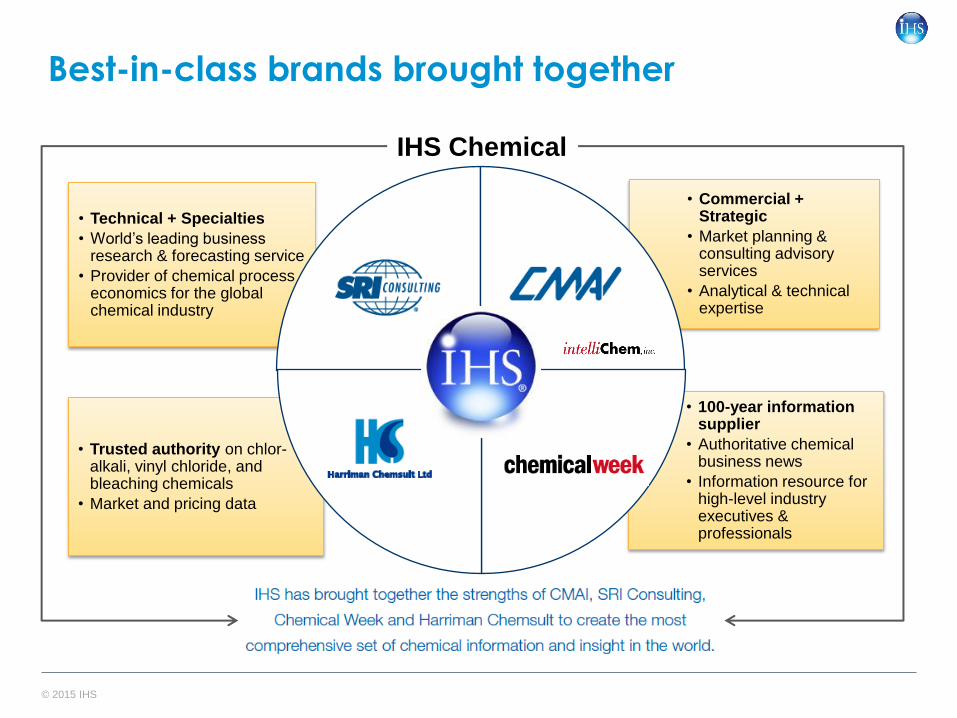
• Technical + Specialties
• World’s leading business research & forecasting service
• Provider of chemical process economics for the global chemical industry
• Trusted authority on chlor-alkali, vinyl chloride, and bleaching chemicals
• Market and pricing data
• 100-year information supplier
• Authoritative chemical business news
• Information resource for high-level industry executives & professionals
• Commercial + Strategic
• Market planning & consulting advisory services
• Analytical & technical expertise
Best-in-class brands brought together
IHS Chemical
© 2015 IHS
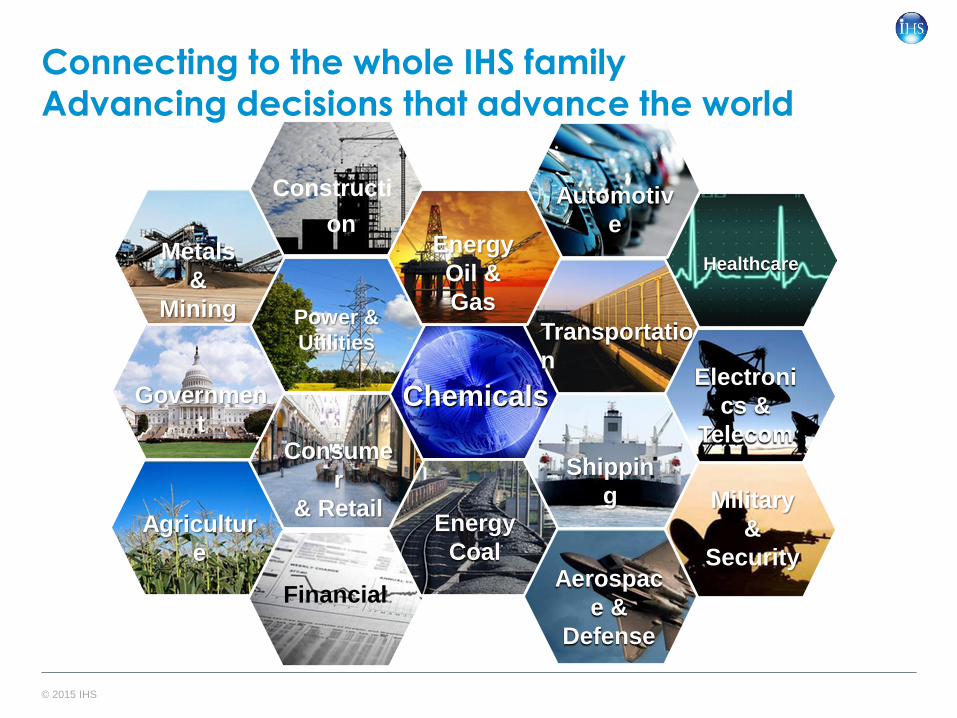
Connecting to the whole IHS family
Advancing decisions that advance the world
32
Agricultur
e
Electroni
cs &
Telecom
Governmen
t
Metals
&
Mining
Healthcare
Financial
Military
&
Security
Chemicals
Automotiv
e
Energy
Coal
Transportatio
n
Shippin
g
Aerospac
e &
Defense
Constructi
on
Power &
Utilities
Energy
Oil &
Gas
Consume
r
& Retail


