145
| Date post: | 25-Mar-2018 |
| Category: |
Documents |
| Upload: | duongduong |
| View: | 216 times |
| Download: | 1 times |


iii
DEDICATION
Dedicated To My Parents

iv
ACKNOWLEDGEMENT
In the name of Allah, Most Gracious, Most Merciful
First and foremost, all praise is to ALLAH SUBHANAHU-WA-TA’ALA, the
Almighty, Who gave me an opportunity, patience and courage to carry out this work. I
feel privileged to glorify His name in the sincerest way through this small
accomplishment. I seek His mercy, favor and forgiveness. I ask Him to accept my little
effort. May He, SUBHANAHU-WA-TA’ALA, guide us and the whole humanity to the
right path (Ameen).
Acknowledgement is due to King Fahd University of Petroleum & Minerals for
providing the research facilities and research assistantship to complete my M.S.
I wish to submit my sincere gratitude to my thesis advisor, Dr. Ibnelwaleed A.
Hussein for his invaluable support, guidance, continuous encouragement and every
possible way of cooperation through out the period of my research and in the preparation
of this manuscript. His precious suggestion made this work interesting and learning for
me. He was always kind, understanding and sympathetic to me.
I am also indebted to my thesis committee members Dr. Basel F. Abu-Sharkh,
Dr. Muhammad Atiqullah, Dr. Ramazan Kahraman, and Dr. S. M. J. Zaidi for their
sincere help, constructive suggestion, and cooperation.
v
I would like to thank Dr. M. B. Amin, Chairman, Department of Chemical
Engineering, for providing me all the available facilities. I am also grateful to all the
faculty members and staff of the department who has in one way or other enriched my
academic and research experience at KFUPM. Special thanks are to Mr. Mafizul Islam
Bhuiyan for his continuous help in arranging my experiment accessories.
I acknowledge the financial support provided by King Abdul Aziz City for
Science and Technology (KACST) under Project # AT-22-16.
I also gratefully acknowledge the support of my fellow graduate students and to
the members of the Bangladeshi community at KFUPM.
Last but not the least, I would like to pay my best gratitude to my beloved parents
and my family members for their prayers, encouragement, and support that permitted me
to indulge my passion for the long task to complete this work. Special thanks are to my
dearest little daughter, Rida, whose face always keeps me alive in the pool of works.

vi
Table of Contents ACKNOWLEDGEMENT............................................................................................... iv
Table of Contents ............................................................................................................. vi
List of Figures ................................................................................................................... ix
List of Tables....................................................................................................................xii
THESIS ABSTRACT (English) ....................................................................................xiii
THESIS ABSTRACT (Arabic)………………………………………………….…….xiv
CHAPTER 1 ...................................................................................................................... 1
INTRODUCTION............................................................................................................. 1
1.1 Objectives.................................................................................................................. 4
CHAPTER 2 ...................................................................................................................... 6
LITERATURE REVIEW................................................................................................. 6
2.1. Metallocene Catalyst ................................................................................................ 6
2.2. Mechanical Testing .................................................................................................. 6
2.2.1. Tensile Properties.............................................................................................. 8
2.2.2. Elastic Modulus............................................................................................... 12
2.2.3. Yield Phenomena ............................................................................................ 12
2.2.4. Ultimate Tensile Stress.................................................................................... 14
2.2.5. Elongation at Break......................................................................................... 15
2.3. Modulated Differential Scanning Calorimetry....................................................... 15
2.4. Literature Review................................................................................................... 20

vii
CHAPTER 3 .................................................................................................................... 29
EXPERIMENTAL .......................................................................................................... 29
3.1. Materials................................................................................................................. 29
3.2. Experimental Procedure ......................................................................................... 31
3.2.1. Mechanical Testing ......................................................................................... 31
3.2.2. Modulated Differential Scanning Calorimetry (MDSC)................................. 36
CHAPTER 4 .................................................................................................................... 38
RESULTS AND DISCUSSION...................................................................................... 38
4.1. Influence of Branch Content, Comonomer Type, and Strain Rate on the
mechanical properties of metallocene LLDPEs ............................................................ 38
4.1.1. Abstract ........................................................................................................... 38
4.1.2. Introduction ..................................................................................................... 39
4.1.3. Experimental ................................................................................................... 42
4.1.4. Results and Discussion.................................................................................... 45
4.1.5. Conclusion....................................................................................................... 70
4.1.6. References ....................................................................................................... 71
4.2. Influence of Branch Content, Comonomer Type and Comonomer Composition
Distribution on non-isothermal Crystallization of Metallocene LLDPEs..................... 75
4.2.1. Abstract ........................................................................................................... 75
4.2.2. Introduction ..................................................................................................... 75
4.2.3. Experimental ................................................................................................... 78
4.2.4. Results and Discussion.................................................................................... 84
4.2.5. Conclusion..................................................................................................... 108

viii
4.2.6. References ..................................................................................................... 109
CHAPTER 5 .................................................................................................................. 113
CONCLUSIONS AND RECOMMENDATIONS...................................................... 113
5.1. Conclusions ..................................................................................................... 113
5.2. Recommendations for Future Work................................................................ 115
References ...................................................................................................................... 116

ix
List of Figures
Figure 2.1: structures of Metallocenes that are used in the polymerization of olefins
(Kaminsky, 1998)........................................................................................... 7
Figure 2.2: Generalized force versus elongation curve for polyethylene illustrating
principal tensile phenomena [Peacock, 2000]................................................ 9
Figure 2.3: Effect of molecular weight on the mechanical properties of polymers. a)
Tensile modulus curve, b) Tensile strength curve, c) Elongation at break
curve, d) Impact strength curve [Ward & Hadley, 1993]............................. 11
Figure 2.4: Schematic of some failure modes of glassy polymers [Swallowe, 1999] ...... 13
Figure 2.5: Schematic diagram of the two types of DSC sample chambers: (a) Constant
heat flow into the chamber; (b) modulated heat flow to maintain specific
temperature ramp [Peacock, 2000]............................................................... 18
Figure 2.6: Example of MDSC: (a) Typical temperature-time profile, (b) Raw data for an
MDSC scan of quenched PET, (c) Deconvolution and analysis of the curve
in (b) [ Reprint from TA Instruments, Inc.]. ................................................ 21
Figure 3.1: a) Hydraulic Carver Press; b) Pneumatic Punch Cutter.................................. 33
Figure 3.2: Instron 5567 equipped with Pneumatic side action grips. .............................. 35
Figure 3.3: a) Modulated DSC Q1000, TA Instrument Inc. equipped with Auto sampler
b) Liquid Nitrogen Cooling System (LNCS). .............................................. 37
Figure 4.1.1: Stress/strain curves for EB m-LLDPEs with different BCs. ....................... 46
Figure 4.1.2: Stress/strain curves for EH m-LLDPEs with different BCs. ....................... 47
Figure 4.1.3: Stress/strain curves for EO m-LLDPEs with different BCs. ....................... 48

x
Figure 4.1.4: DSC thermograms of EBs before (solid line) and after (dashed line)
mechanical testing at crosshead speed of 125 mm/min. (the arrows show the
appearance of the peaks.) ............................................................................. 50
Figure 4.1.5: Avrami plot for EH m-LLDPEs (strain rate 4.92 min-1). ............................ 56
Figure 4.1.6: Effect of BC and branch type on yielding behavior (crosshead speed of 125
mm/min). ...................................................................................................... 58
Figure 4.1.7: Young’s modulus as a function of BC (crosshead speed 125 mm/min)...... 59
Figure 4.1.8: Ultimate Modulus as a function of BC and branch type (crosshead Speed
125 mm/min). ............................................................................................... 61
Figure 4.1.9: Elongation at break as function of BC and branch type (crosshead speed 125
mm/min). ...................................................................................................... 62
Figure 4.1.10: Ultimate tensile strength as a function of BC and branch type (crosshead
speed 125 mm/min)...................................................................................... 64
Figure 4.1.11: Young’s Modulus as function of crosshead speed and BC. ...................... 65
Figure 4.1.12: Elongation at break (%) as a function of crosshead speed and BC. .......... 67
Figure 4.1.13: Tensile Strength (MPa) as function of crosshead speed and BC............... 68
Figure 4.2.1: MDSC thermograms of m-EB15, the three curves from top to the bottom
are reversing hear flow, total heat flow and non-reversing heat flow,
respectively................................................................................................... 81
Figure 4.2.2: MDSC crystallization exotherms of EB m-LLDPEs and ZN-LLDPE........ 85
Figure 4.2.3: MDSC crystallization exotherms of EH m-LLDPEs................................... 86
Figure 4.2.4: MDSC crystallization exotherms of EO m-LLDPEs................................... 87
Figure 4.2.5: MDSC crystallization exotherms of m-HDPE and ZN-HDPE.................... 88
xi
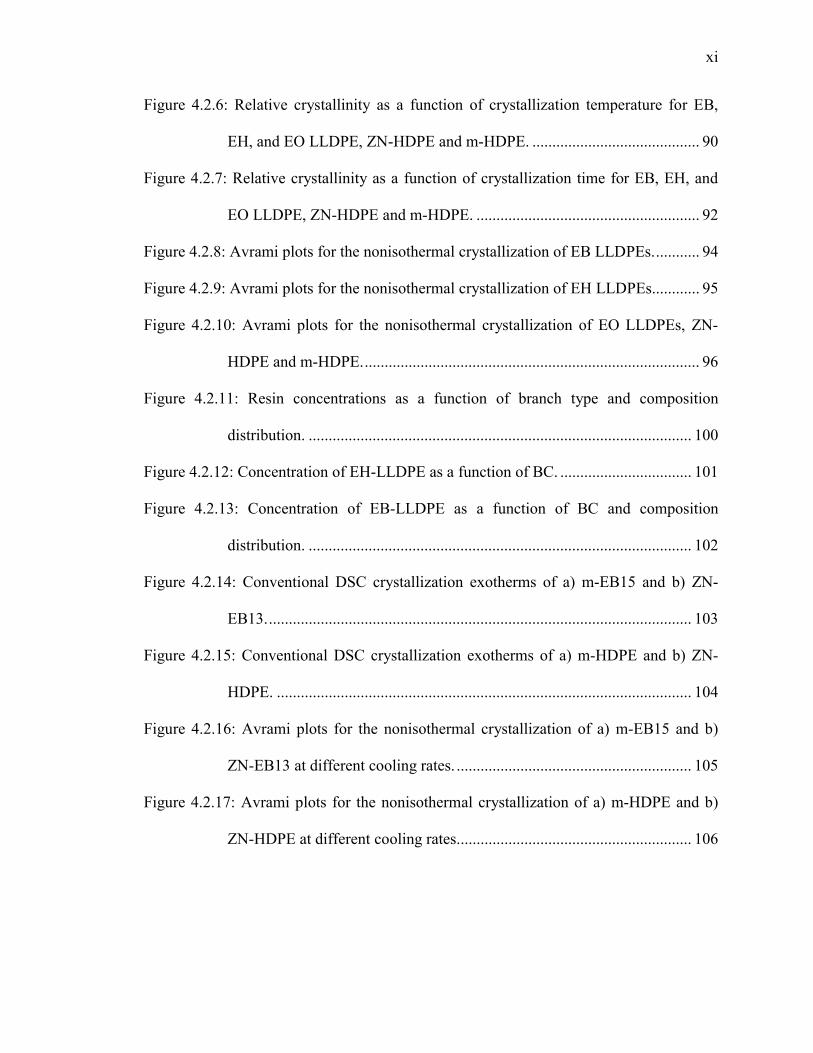
Figure 4.2.6: Relative crystallinity as a function of crystallization temperature for EB,
EH, and EO LLDPE, ZN-HDPE and m-HDPE. .......................................... 90
Figure 4.2.7: Relative crystallinity as a function of crystallization time for EB, EH, and
EO LLDPE, ZN-HDPE and m-HDPE. ........................................................ 92
Figure 4.2.8: Avrami plots for the nonisothermal crystallization of EB LLDPEs............ 94
Figure 4.2.9: Avrami plots for the nonisothermal crystallization of EH LLDPEs............ 95
Figure 4.2.10: Avrami plots for the nonisothermal crystallization of EO LLDPEs, ZN-
HDPE and m-HDPE..................................................................................... 96
Figure 4.2.11: Resin concentrations as a function of branch type and composition
distribution. ................................................................................................ 100
Figure 4.2.12: Concentration of EH-LLDPE as a function of BC. ................................. 101
Figure 4.2.13: Concentration of EB-LLDPE as a function of BC and composition
distribution. ................................................................................................ 102
Figure 4.2.14: Conventional DSC crystallization exotherms of a) m-EB15 and b) ZN-
EB13........................................................................................................... 103
Figure 4.2.15: Conventional DSC crystallization exotherms of a) m-HDPE and b) ZN-
HDPE. ........................................................................................................ 104
Figure 4.2.16: Avrami plots for the nonisothermal crystallization of a) m-EB15 and b)
ZN-EB13 at different cooling rates. ........................................................... 105
Figure 4.2.17: Avrami plots for the nonisothermal crystallization of a) m-HDPE and b)
ZN-HDPE at different cooling rates........................................................... 106
xii
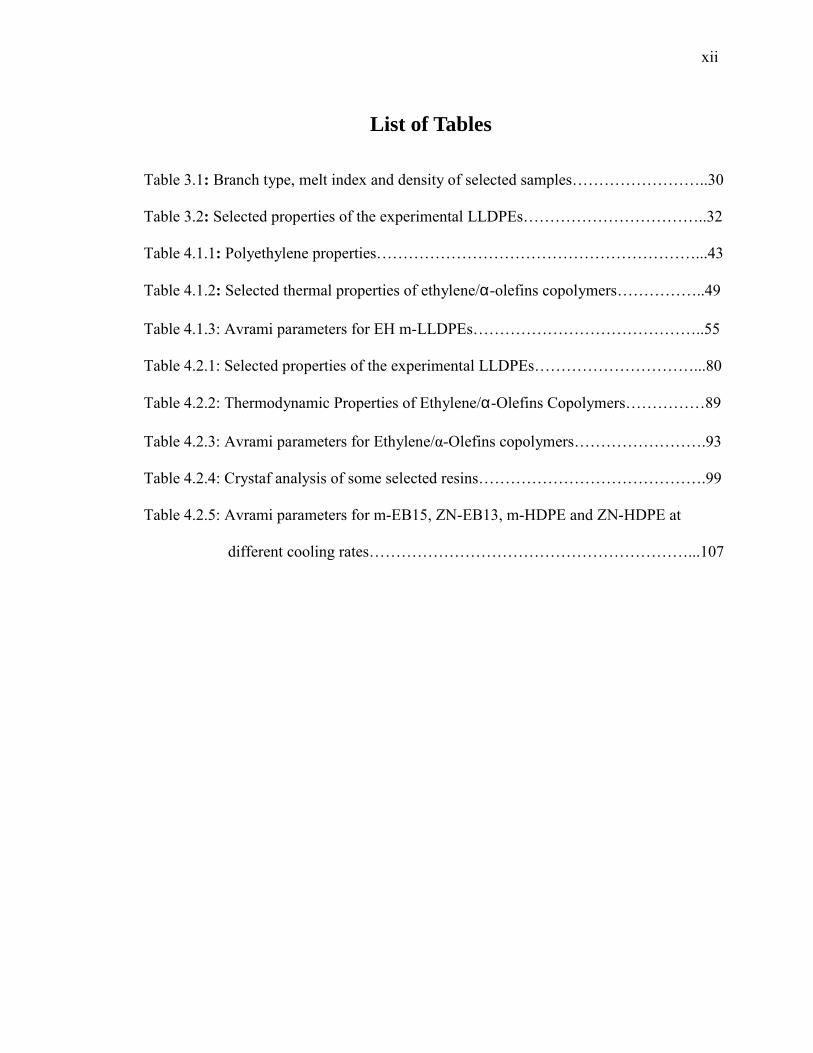
List of Tables
Table 3.1: Branch type, melt index and density of selected samples……………………..30
Table 3.2: Selected properties of the experimental LLDPEs……………………………..32
Table 4.1.1: Polyethylene properties……………………………………………………...43
Table 4.1.2: Selected thermal properties of ethylene/α-olefins copolymers……………..49
Table 4.1.3: Avrami parameters for EH m-LLDPEs……………………………………..55
Table 4.2.1: Selected properties of the experimental LLDPEs…………………………...80
Table 4.2.2: Thermodynamic Properties of Ethylene/α-Olefins Copolymers……………89
Table 4.2.3: Avrami parameters for Ethylene/α-Olefins copolymers…………………….93
Table 4.2.4: Crystaf analysis of some selected resins…………………………………….99
Table 4.2.5: Avrami parameters for m-EB15, ZN-EB13, m-HDPE and ZN-HDPE at
different cooling rates……………………………………………………...107
xiii
THESIS ABSTRACT
Name: MD. ASHRAFUL ISLAM
Title: Structure Property Relationships of Metallocene Linear Low
Density Polyethylene (LLDPE).
Degree: Master of Science
Major Field: Chemical Engineering
Date of Degree: January, 2005
In this study, the structure-property relationships of metallocene linear low
density polyethylene (m-LLDPE) are investigated. Particularly, the influence of the branch content (BC), composition distribution, and comonomer type on the thermal and mechanical properties of m-LLDPEs was studied. The mechanical properties were studied by means of stress/strain experiments. The increase in BC of m-LLDPEs lowered the crystallinity and the modulus. The ultimate mechanical properties of m-LLDPEs were weakly dependent on BC. The comonomer type had no significant effects on the mechanical properties of m-LLDPEs. The Ziegler-Natta LLDPEs (ZN-LLDPEs) were also studied for comparison purposes. However, ZN-LLDPEs showed higher small strain properties but lower ultimate properties than m-LLDPEs of similar Mw, branch type, and BC. In addition, the influence of strain rate on the mechanical properties of m-LLDPEs was examined. For low BC m-LLDPEs, there exists a very narrow strain rate window within which a maximum in modulus and ultimate properties was observed. The strain rate had no influence on the mechanical properties of the highly branched m-LLDPEs.
The nonisothermal crystallization kinetics parameters of m-LLDPEs were measured by modulated differential scanning calorimetry. It was found that BC causes a significant change in the crystallization behavior. Crystallization peak temperature shifts to lower region as BC increases. The secondary crystallization process strongly influenced the nonisothermal crystallization of all resins. The Avrami exponent, n, was in the range of 1.5 to 2.5, suggesting a rod-like growth. The comonomer type had almost no effect on the crystallization kinetics. A strong effect of composition distribution was observed on the crystallization peak and the enthalpy of crystallization. However, similar crystallization mechanism was observed for both m-LLDPEs and ZN-LLDPE. In addition, the effect of cooling rate on the nonisothermal crystallization mechanism of HDPE and LLDPE was examined.
Master of Science Degree
King Fahd University of Petroleum & Minerals
Dhahran, Saudi Arabia

xiv
ملخص البحث
محمد أشرف اإلسالم: اإلســــم .تأثير الترآيب الجزيئي على مواصفات البولي إيثلين الخطي قليل الكثافة: العنـــوان ماجستير العلوم: الدرجـــة هندسة آيميائية: المجـــال
م2005يناير : تاريخ التخرج
البحث دراسة تأثير الترآيب الجزيئي على مواصفات البولي إيثلين الخطي قليل الكثافة المصّنع تم في هذا
تمت دراسة تأثير آمية ونوعية وتوزيع التفرع على الخواص الحرارية والميكانيكية . بواسطة حّفاز الميتالوسين
وجد أن الخواص . عامل قوة البولمروجد أن درجة البلورة تقل مع زيادة آمية التفرع مما يضعف من م. للبولمر
ناتا لها خواص -وجد أن البولمرات المصّنعة بواسطة حّفاز زيقلر. الميكانيكية النهائية ال تعتمد على آمية التفرع
ميكانيكية أفضل من مثيالتها المصّنعة بواسطة حّفاز الميتالوسين عند إستخدام قوة شد قليلة في حين أن البولمرات
.ة أحسن منها في حالة إستخدام قوة شد عاليةالميتالوسيني
وجد أن آمية . أيضًا تمت دراسة حرآية البلورة ومعامالتها وتأثير الخواص الجزيئية في ذلك أما . آما أن البلورة الثانوية تتأثر بشدة بكمية التفرع. التفرع تؤثر تأثيرًا آبيرًا في طريقة البلورة
آذلك وجد أن توزيع . ر على الخواص الميكانيكية أو الحراريةنوعية التفرع فليس لها تأثير آبيالتفرع له تأثير قوي على حرآية البلورة، آذلك تمت دراسة درجة التبريد وسرعة الشد على
.الخواص الحرارية والميكانيكية
ماجستير العلوم جامعة الملك فهد للبترول والمعادن
المملكة العربية السعودية–الظهران

1
CHAPTER 1
INTRODUCTION
The development of polyethylene production technology did not proceed
smoothly. It demanded untiring efforts before the utility of synthetic polymers was
appreciated. Initially, polyethylene was a highly branched low density material with a
limited range of physical properties. In the 1950s, new catalytic polymerization processes
were developed that produced essentially linear polymers with higher densities. In the
1960s, the copolymerization of ethylene with small amounts of other α-olefins produced
linear low density polyethylene (LLDPE). Metallocene catalysts have been known for
several decades. However, their potential as commercial catalysts remained unrealized
until 1980, when Kaminsky and coworkers [1983] discovered that the methylalumoxane
co-catalyst improved their catalytic activity dramatically. Since that discovery, massive
and intense research programs have been undertaken to bring metallocene products to
commercial use. The most remarkable feature of these catalyst systems is the fact that all
metallocene sites produce polymer chains with virtually the same architecture [Gupta,
1997]. It produces polymers with narrow molecular weight distribution, higher
comonomer contents, and good compositional homogeneity [Horton, 1994]. Metallocene
catalyzed elastomeric very low density polyethylene (VLDPE) resins became available
commercially in 1993. The metallocene LLDPE (m-LLDPE) products followed in 1995
[Peacock, 2000].
2
Ziegler-Natta LLDPE resins consist of molecules with linear polyethylene (LPE)
backbones to which are attached short alkyl groups at random intervals. These materials
are produced by the copolymerization of ethylene with 1-alkene comonomers. These
comonomers are typically α-olefins, principally 1-butene, 1-hexene, and 1-octene.
LLDPE resins may also contain small levels of long chain branching as is found in low
density polyethylene (LDPE). Chemically, these resins can be thought of as a
compromise between LPE and LDPE, hence the name LLDPE [Peacock, 2000]. There
are two types of LLDPE available in the market, conventional, Ziegler-Natta (ZN-
LLDPE) and m-LLPDE. Metallocene-type ethylene-α-olefin copolymers are
characterized by their narrow molecular weight distribution (2.0 ≤ polydispersity index ≤
3.5) and almost homogeneous comonomer composition distribution. This is in contrast to
Ziegler-Natta copolymers, which are broadly poly-dispersed in terms of molecular weight
and composition. Here, the longer molecules incorporate a lower percentage of
comonomers than the shorter ones [Stevens, 1996].
The mechanical properties of m-LLDPE resins are better than conventional resins
in many respects, but there are also deficiencies in certain areas. On the positive side, the
impact strength, puncture resistance and tensile strength of m-LLDPE films are all
improved by a considerable level over those of conventional resins 300%, 50%, and 40%,
respectively, according to one resin manufacturer [Vernyi, 1995]. On the other side, m-
LLDPE films have lower tear strengths than the ZN counterparts. When tear strength is
not a crucial factor, the use of m-LLDPE resins permits down gauging, which is always
attractive to film producers [Peacock, 2000].
3
Metallocene-LLDPE has been targeted for film and packaging applications.
Commercial applications of LLDPE are notably in the blown and cast film use, such as
stretch film, as well as can liners and heavy duty sacks [Welch, 1995]. It has provided
end users with many advantages such as: (1) increased packaging speeds due to lower
seal initiation temperature, higher hot tack, and reduced blocking; (2) reduced package
failures due to greater toughness and superior resistance to abuse; (3) improved package
artistic due to lower haze and higher gloss; and (4) improved packaged product quality
due to reduced package-product interactions, lower odor and extractability, etc [Gupta,
1997].
It is well known that the underlying microstructure of polymers plays a critical
role in determining their physical and mechanical properties. For linear polyolefins such
as poly (ethylene/α-olefin) copolymers, both the molecular weight distribution and
comonomer distribution of the polymer chains influence the crystallinity and density of
the samples [Xu et al., 2000]. Above a critical molecular weight, it is sometimes found
that the crystallinity will decrease with increasing molecular weight, due to the inability
of the longer chains to be incorporated in the crystalline structure [Hosoda & Uemura,
1992; Jordens et al., 2000]. More significantly, by increasing the number of short chain
branches via incorporation of α-olefin comonomers such as 1-butene, 1-hexene, 1-octene
etc., the polymer crystallinity and density can be reduced. The reason is that these side
chains do not crystallize and are rejected into the amorphous or interfacial regions of the
polymer [Kale et al., 1995; Simanke et al. 1999]. The interplay between molecular weight
and comonomer composition distribution influences the proportions of crystalline and
amorphous polymer that determine its crystalline microstructure. The crystallinity and

4
crystal structure are not only influenced by the microstructure of the polymer but also by
the processing conditions that dictate the polymer thermal history [Mandelkern et al.,
1997; Jordens et al., 2000]. In terms of mechanical properties, polymer crystallinity
influences its stiffness and toughness. In general, as the polymer crystallinity decreases,
its flexibility increases. By lowering the density with the incorporation of comonomer to
promote short chain branching, the polymer ability to absorb and dissipate energy also
increases [Kale et al., 1995; Bensason et al., 1996].
1.1 Objectives From the above literature review it was observed that the influence of branch
content, comonomer type on the crystallization and mechanical properties of m-LLDPEs
needs to be studied. The objectives of this investigation are as follows:
1) Study the effect of branch content, branch type and the average comonomer
composition on the mechanical properties of m-LLDPEs.
2) Examine the effect of strain rate on the mechanical properties of m-LLDPEs.
3) Study the effect of branch content, branch type, average composition, and
crystallization temperature on crystallization kinetics of m-LLDPEs.
4) Investigate the influence of cooling rate on the crystallization of m-LLDPEs.
5) Correlate the molecular structure of m-LLDPEs to selective thermal and
mechanical properties.
This study was part of a KACST funded project that aims at investigating the
influence of molecular parameters on solution, melt and solid-state properties of m-
LLDPEs.

5
NOTE: This thesis is written in paper format. Hence, the reader can skip the
following two chapters and go directly to the results and discussion part given in Chapter
4. The first paper is entitled “Influence of Branch Content, Comonomer Type, and Strain
Rate on the Mechanical Properties of metallocene LLDPEs”. The second paper is entitled
“Influence of Branch Content, Comonomer Type and Composition Distribution on non-
isothermal Crystallization of Metallocene LLDPEs”.
6
CHAPTER 2
LITERATURE REVIEW
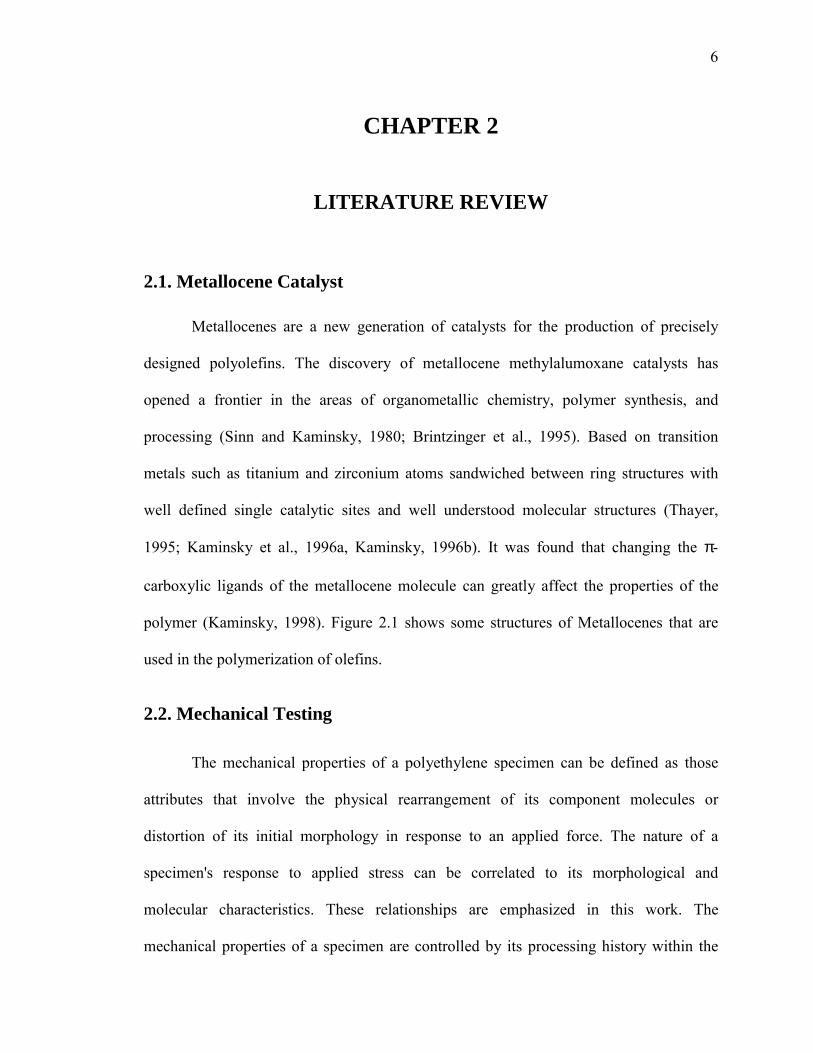
2.1. Metallocene Catalyst
Metallocenes are a new generation of catalysts for the production of precisely
designed polyolefins. The discovery of metallocene methylalumoxane catalysts has
opened a frontier in the areas of organometallic chemistry, polymer synthesis, and
processing (Sinn and Kaminsky, 1980; Brintzinger et al., 1995). Based on transition
metals such as titanium and zirconium atoms sandwiched between ring structures with
well defined single catalytic sites and well understood molecular structures (Thayer,
1995; Kaminsky et al., 1996a, Kaminsky, 1996b). It was found that changing the π-
carboxylic ligands of the metallocene molecule can greatly affect the properties of the
polymer (Kaminsky, 1998). Figure 2.1 shows some structures of Metallocenes that are
used in the polymerization of olefins.
2.2. Mechanical Testing
The mechanical properties of a polyethylene specimen can be defined as those
attributes that involve the physical rearrangement of its component molecules or
distortion of its initial morphology in response to an applied force. The nature of a
specimen's response to applied stress can be correlated to its morphological and
molecular characteristics. These relationships are emphasized in this work. The
mechanical properties of a specimen are controlled by its processing history within the

7
Figure 2.1: structures of Metallocenes that are used in the polymerization of olefins
(Kaminsky, 1998)

8
limits imposed by its molecular characteristics. The typical mode of polyethylene
deformation is one of yielding and necking followed by strain hardening (see Figure 2.2).
Localized yielding is especially noticeable in samples with higher degrees of crystallinity.
The mechanical properties of polyethylene may be divided into two broad
categories: (l) low strain properties such as yield stress and initial modulus and (2) high
strain properties, characterized by ultimate tensile strength and elongation at break. To a
first approximation, the low strain properties are controlled by sample morphological
features and the high strain properties by its molecular characteristics.
2.2.1. Tensile Properties Tensile properties of polymers are measured on instruments that record the force
required to elongate a sample as a function of applied elongation. It is common to plot the
load as "engineering stress", that is, the force per unit area based upon the original cross-
section of the specimen as a function of the engineering strain calculated as the
elongation divided by original gauge length. The polymer chain length and its
distribution are important molecular parameters in controlling the physical, mechanical
and processing characteristics of polymers. Tensile testing of the specimen is carried out
following the ASTM D638 standard. Stress and strain are ‘sample’ dependent. The stress
on any element of the sample is equal to the force experienced by the element divided by
its effective cross-sectional area. If the cross-sectional area of the specimen varies along
its length, the stress will vary accordingly, i.e., stress is not necessarily uniform along the
length or across the width of the specimen.

9
Figure 2.2: Generalized force versus elongation curve for polyethylene illustrating
principal tensile phenomena [Peacock, 2000].

10
The strain and percent strain for any portion of a specimen are defined as
dimension originaldimension original dimension samplecurrent −=Strain (2.1)
100dimension original
dimension original dimension samplecurrent Percent ×−=Strain (2.2)
Most tensile samples start off as a "dog bone" (or dumbbell), the enlarged regions
of which are gripped by the jaws of the tensile tester. Initially, the gauge region elongates
homogenously until it reaches a point at which one cross-sectional slice yields
independently of the rest of the specimen. The onset of heterogeneous elongation
corresponds to the yield point. As elongation continues, the incipient neck becomes better
established until it forms a sharply defined region. Upon further elongation, the neck
propagates, growing to encompass the entire gauge length. The force required for neck
propagation is essentially invariant, resulting in a "plateau" in the force versus elongation
curve (Figure 2.2). Subsequent deformation, termed "strain hardening", is homogenous,
with the necked region elongating uniformly until the sample breaks.
Depending on molecular weight (Mw) and its distribution (MWD), polyethylene
can exist under a variety of formulations, each one with tailored properties for specific
applications. The influence of Mw on mechanical properties is clearly depicted in the
Figure 2.3. It is also important to note that some polymers may have different failure
modes for different modes of deformation. In general, all polymers at temperatures
significantly below their glass transition temperatures (Tg -T >100°C) undergo brittle
fracture. In the region above the brittle fracture regime, but below Tg polymers usually

11
Figure 2.3: Effect of molecular weight on the mechanical properties of polymers. a)
Tensile modulus curve, b) Tensile strength curve, c) Elongation at break curve, d) Impact
strength curve [Ward & Hadley, 1993].
12
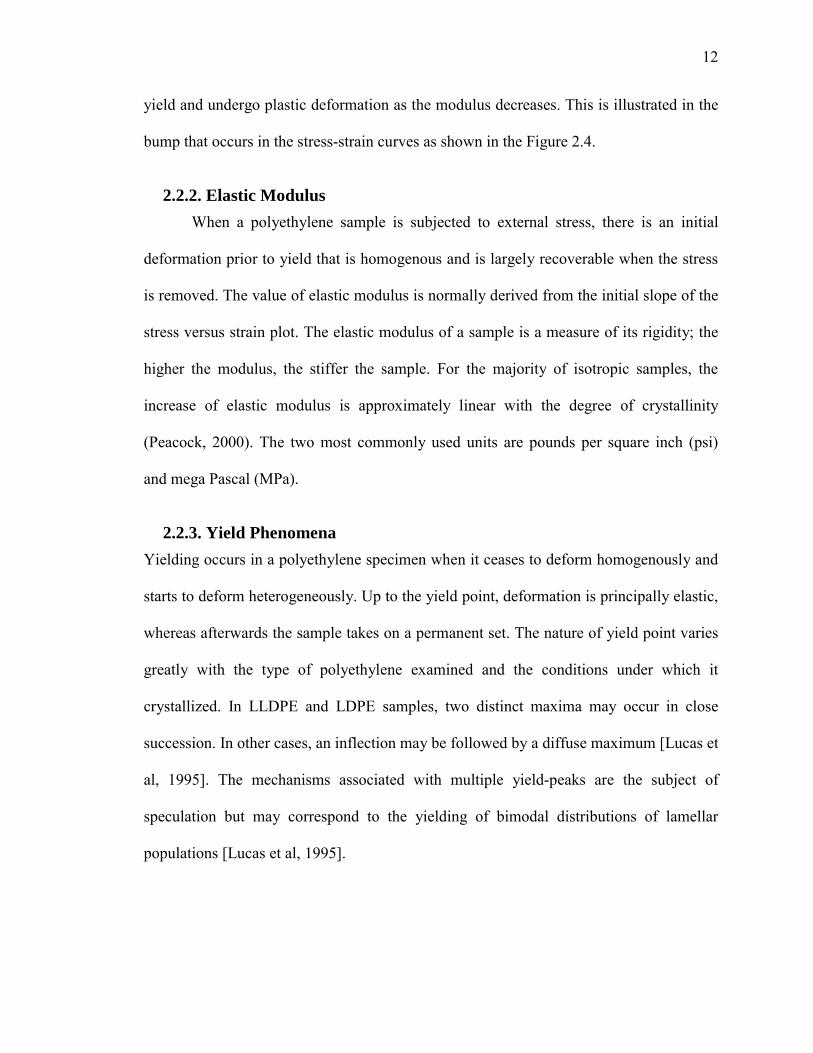
yield and undergo plastic deformation as the modulus decreases. This is illustrated in the
bump that occurs in the stress-strain curves as shown in the Figure 2.4.
2.2.2. Elastic Modulus When a polyethylene sample is subjected to external stress, there is an initial
deformation prior to yield that is homogenous and is largely recoverable when the stress
is removed. The value of elastic modulus is normally derived from the initial slope of the
stress versus strain plot. The elastic modulus of a sample is a measure of its rigidity; the
higher the modulus, the stiffer the sample. For the majority of isotropic samples, the
increase of elastic modulus is approximately linear with the degree of crystallinity
(Peacock, 2000). The two most commonly used units are pounds per square inch (psi)
and mega Pascal (MPa).
2.2.3. Yield Phenomena Yielding occurs in a polyethylene specimen when it ceases to deform homogenously and
starts to deform heterogeneously. Up to the yield point, deformation is principally elastic,
whereas afterwards the sample takes on a permanent set. The nature of yield point varies
greatly with the type of polyethylene examined and the conditions under which it
crystallized. In LLDPE and LDPE samples, two distinct maxima may occur in close
succession. In other cases, an inflection may be followed by a diffuse maximum [Lucas et
al, 1995]. The mechanisms associated with multiple yield-peaks are the subject of
speculation but may correspond to the yielding of bimodal distributions of lamellar
populations [Lucas et al, 1995].
13
Figure 2.4: Schematic of some failure modes of glassy polymers [Swallowe, 1999]

14
The sharpness of the yield peak exhibited during stress versus strain
measurements reflects the distinctness of usually observed neck. Samples with very low
levels of crystallinity exhibit neither localized necking nor a distinct yield peak [Peacock,
1990]. For isotropic samples, the yield stress at room temperature is closely correlated to
the degree of crystallinity and thus to the sample density [Peacock, 1990]. The yield
stress of a specimen is of great interest from a practical point of view. In many cases it
represents the maximum permissible load that a sample can withstand while still
performing its assigned role. Once a sample has yielded, its dimensions are irrevocably
changed, and it may no longer meet the requirements for continued service. In cases,
where there is a distinct yield maximum in the stress-strain curve, the force required to
propagate a neck along the length of a sample is lower than the yield stress. Once such a
sample has yielded, it will continue to elongate unless the applied load is removed
[Peacock, 2000].
2.2.4. Ultimate Tensile Stress The ultimate tensile stress also known as the "tensile strength" of a sample is the
force required to break it divided by its original cross-sectional area. The values of
ultimate strength of LDPE samples are generally lower than that of LLDPE samples
largely because of the higher percent elongation values obtained for the LLDPE samples.
Actually, this is the property that gives LLDPE an advantage over LDPE in blown film
packaging application.
15
2.2.5. Elongation at Break This term refers to the strain of the sample at the point of tensile failure. The
strain at break of the polyethylene sample is a function of its molecular nature and its
initial orientation. The molecular characteristics that facilitate drawing are similar to
those that promote the development of high degrees of crystallinity. Features that hinder
the slippage of chains past one another during crystallization also inhibit the drawing
process. The two principal inhibitors to chain movement are entanglements and branch
points. Thus high molecular weight LPE resins and branched samples have lower strain at
break values than low molecular weight unbranched samples. For ductile samples at a
given Mw, the strains at break values fall as their comonomer content increases (Peacock,
2000). However, these observations were based on small strain data and low comonomer
content PEs. Similarly, for a given comonomer content, the strain at break of ductile
samples falls as the molecular weight increases. The molecular weight corresponding to
the transition between brittle and ductile behavior increases as the comonomer content
increases.
2.3. Modulated Differential Scanning Calorimetry
Several methods are available for the measurement of polymer crystallinity:
dilatometry, microscopy, calorimetry, x-ray diffraction etc. With the exception of
microscopy, all of the above techniques are very difficult to use when crystallinity must
be evaluated as a function of time. DSC has made possible the much wider application of
the calorimetric method to crystallinity studies [Barrall & Johnson, 1970]. The
development of crystallinity in polymers is not instantaneous. Since the time for complete
crystallization is somewhat indefinite, it is customary to define the rate of crystallization

16
at a given temperature as the inverse of the time needed to attain one-half of the total
volume change [Billmeyer, 1984]. The rate of crystallization can be obtained using
Avrami equation [Avrami, 1939-1941]
)exp()(1 nktt −=−φ (2.3)
Where, φ (t) = fractional crystallinity at time t
k = rate of crystallization (temperature dependent)
n = nucleation index (temperature independent).
A plot of ln{-ln[1-φ(t)]} versus ln t will give ‘n’ as slope and ‘lnk’ as intercept.
φ (t), the fractional crystallinity at time t can be determined from the heat evolved as
follows:
∞∆Η∆Η= /)( ttφ (2.4)
where, ∆Ht = heat evolved at time t
∆H∞ = heat evolved at the end of crystallization.
Conventional DSC involves dynamic calorimetric analysis of a sample whose
temperature is being ramped at a controlled rate. This is achieved by measuring
instantaneous heat capacity of a sample as a function of its temperature in a plot known
as a thermogram. Endothermic and exothermic peaks respectively correspond to melting
and crystallization processes, while step changes reflect material transitions, such as the
glass transition. Quantitative information can be obtained with respect to both the
temperature at which events occur and the associated heat flow. Differential scanning

17
calorimeters can also be used to measure transitions involving heat transfer that occur at
fixed temperatures, such as isothermal crystallization.
Two varieties of differential scanning calorimeters exist, both of which are
capable of making accurate measurements on samples in the range of 1-20 mg. Figure 2.5 illustrates the basic features of the two types.
In both cases, specimens are encapsulated in small aluminum sample pans, which are
placed in a chamber for comparison against an empty reference pan. In the first type
(Figure 2.5-a), the flow of heat into the sample chamber via the sample support is kept
constant while the temperature of the sample pan with respect to the reference pan is
recorded. In the second type (Figure 2.5-b), known as the power compensating type, the
temperature of the sample and reference pans are determined to a precision of a few
hundredths of a degree, while the flow of heat into the sample supports must be
monitored and controlled to a similar precision. The net results of both methods are
identical as far as the operator is concerned; each generates a precise plot of heat flow as
a function of temperature.
An interesting recent modification to conventional thermal analysis is “Modulated
DSC”, MDSC. This technique subjects a material to a linear heating method which has a
superimposed sinusoidal temperature oscillation (modulation) resulting in a cyclic
heating profile.

18
Figure 2.5: Schematic diagram of the two types of DSC sample chambers: (a) Constant
heat flow into the chamber; (b) modulated heat flow to maintain specific temperature
ramp [Peacock, 2000].

19
The equation, which describes heat flow in MDSC, is:
),( tTfdtdTCp
dtdQ += (2.5)
(Total) (Reversing) (Non-reversing)
where, dt
dQ= total heat flow,
pC = heat capacity,
dtdT
= heating rate, and
),( tTf = heat flow dependent on absolute temperature and time.
The concept involves the imposition of a sine wave on the normally linear heating ramp
so that portions of each cycle are at different heating and cooling rates, although the
general overall trend is a linear change in average temperature.
The amplitude and period of the modulation, along with the average heating rate,
are set by the operator. A wide range of instantaneous heating and cooling rates are
established within each experiment by such a process. The typical range of operating
parameters would be heating rates of less than 5oC min-1, using a period of 10 to 100
seconds, and amplitude of 0.01 oC to 2.0oC. It is important that there be several, i.e., at
least five, complete cycles of the program over the temperature range of any feature
under investigation, in order for the subsequent deconvolution scheme to function
properly. Higher frequencies can be achieved through radiant heating, but with reduced
amplitudes in the temperature cycle [Wishikawa and Saruyama, 1995].

20
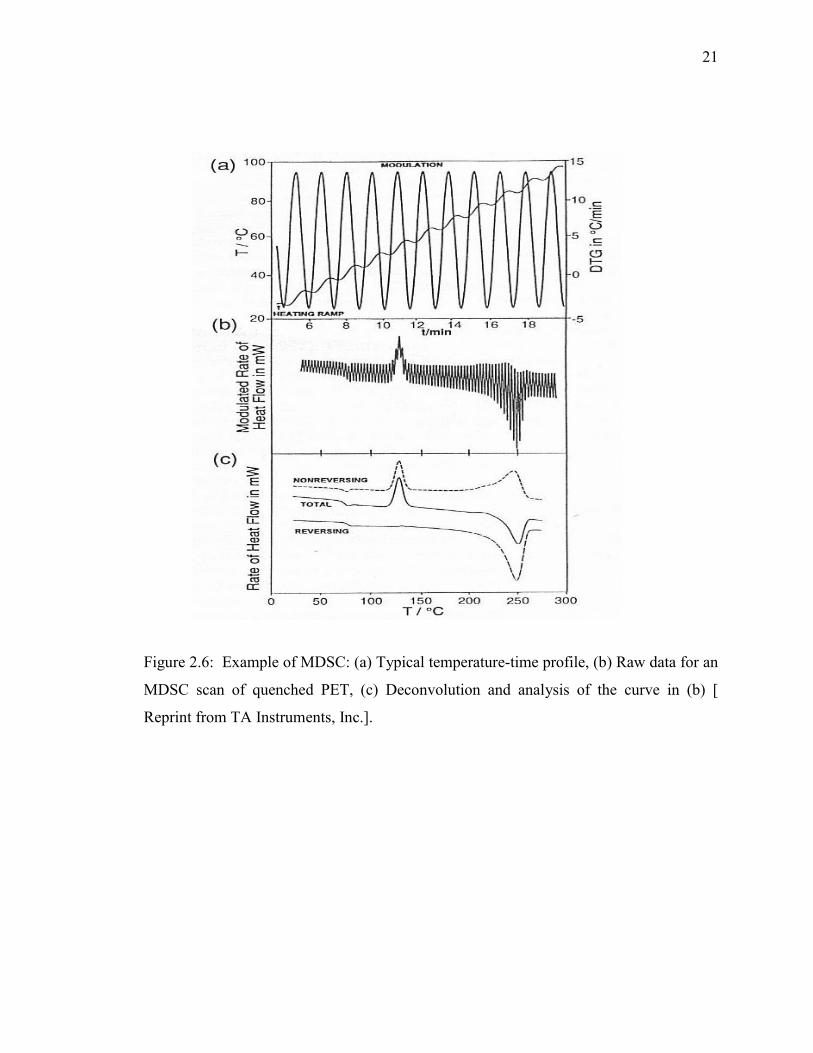
The major contribution of this technique is that the total heat flow rate can be
separated into two additional signals. Deconvolution of the resultant heat flow profile
provides not only the “total” heat flow obtained from conventional DSC, but also
separates that “total” heat flow into its heat capacity-related (reversing) and kinetic (non-
reversing) components [Thomas, TA Instruments Publication]. A typical “raw” curve of
the heat flow rate for MDSC is shown in Figure 2.6(b). Subsequent deconvolution of this
“raw” data using a discrete Fourier transform yields several pieces of information besides
a curve equivalent to the conventional DSC curve; Figure 2.6(c). One of these is a curve,
which represents the component of total rate of heat flow that is heating rate dependent,
i.e., that which is in phase with the modulated heating. The second curve corresponds to
the rate of heat flow that is dependent on only the absolute temperature, i.e., that which is
out of phase with the modulated heating. These two components of the heat flow are
designated as “reversing” and “non-reversing”, respectively. The second major advantage
of MDSC is that, once the instrument has been calibrated at the same amplitude and
period, the heat capacity data can be determined in a single run and with somewhat
greater precision and accuracy [Turi, 1997].
2.4. Literature Review
Amarasinghe et al. [2003] used MDSC to study the melting and crystallization
behavior of various PEs. It was found that all samples of highly branched LDPE, LLDPE,
and VLDPE showed a broad exotherm before the main melting peak in the non-reversing
curve, suggesting crystallization and annealing of crystals to be more stable forms. Other
samples of HDPE, except quickly cooled HDPE, did not show any significant
crystallization and annealing before melting. The crystallinity indicated that dynamically
21
Figure 2.6: Example of MDSC: (a) Typical temperature-time profile, (b) Raw data for an
MDSC scan of quenched PET, (c) Deconvolution and analysis of the curve in (b) [
Reprint from TA Instruments, Inc.].

22
cooled polymers were much more crystalline, which can be attributed to crystal
perfection at the lamellar surface.
Walker et al [2003a] prepared a range of metallocene and Ziegler-Natta catalyzed
LLDPEs by injection moulding to determine the effect of density, molecular weight, MFI
and polydispersity on their mechanical performance. In their work, DSC analysis showed
a progressive increase in melt temperature with increasing density. In this case, hexene
m-LLDPEs exhibited higher elongation at break than the octene m-LLDPEs at similar
densities. The cooling rate had a more pronounced effect on the hexene m-LLDPEs,
illustrated by larger differences in the melting temperature. The results also showed that
the conventional materials have higher melting temperature than the metallocene. They
also found that the tensile modulus was dependent on both density and overall
crystallinity. Dynamic Mechanical Thermal Analysis (DMTA) of the various polymers
showed that both the phase transitions and storage modulus were dependent on
comonomer type and density. The results also tend to suggest that the 1-hexene α-olefin
comonomer m-PE types exhibited a lower storage modulus than the octene α-olefin
comonomer m-PE type for similar density materials.
Walker et al. [2003b] in a similar work discussed the dynamic mechanical
properties. The intensity of tan δ peak increased with the decrease in density. It was
suggested that this increase in the damping of tan δ is associated with increased side
chain branching.
Miller et al. [2002] investigated the effect of quenching conditions in the cast film
extrusion process on the mechanical performance and crystalline development of a range
of commercially available 1-hexene and 1-octene based metallocene PEs. In that
23
investigation, DSC analysis showed increase in crystallinity with increasing quench
temperature and decreasing MFI. The results of tensile test showed an overall increase in
Young’s modulus with increase in quench temperature 30o - 60oC.
Kontou et al [2002] studied a set of commercial m-LLDPEs. The results were
compared with those of traditional ZN-LLDPEs. They found that the type and amount of
comonomer strongly affected the degree of crystallinity and branching, resulting in
different material morphology and macroscopic thermo-mechanical behavior.
Furthermore, the polymers present a gradual decrease in the percentage crystallinity,
position and intensity of β and γ transition, as a function of the comonomer content.
Lovisi et al [2001] synthesized copolymers of propylene/1-hexene and
propylene/1-octene using a highly isospecific metallocene catalyst system. In the study, it
was observed that properties such as enthalpy of crystallization (∆Hc), crystallization
temperature (Tc), melting temperature (Tm), glass transition temperature (Tg), storage
modulus (E′), and density decreased in a linear pattern with increasing comonomer
content in the copolymer. From the study, it was also observed that the longer the alkyl
branch, the less comonomer was necessary to separate the polymer chains and disrupt the
crystalline structure. It, therefore, increased the free volume and the amorphous phase
and reduced the size of crystallites, which then translated into lower densities and rubbery
copolymers.
Bensason et al. [1996] studied ethylene-octene copolymers prepared by Dow’s
INSITETM technology. They found that with the increase of comonomer content, the
accompanying tensile behavior changes from necking and cold drawing typical of a semi-
crystalline thermoplastic to uniform drawing and high recovery characteristic of an

24
elastomer. Although changes in morphological features and tensile properties occur
gradually with increasing comonomer content, the observations related to melting
behavior, morphology, dynamic mechanical response, yielding and large scale
deformation have suggested a classification of scheme with four distinct categories.
Materials with densities higher than 0.93 g/cc exhibit a lamellar morphology with well
developed spherulitic superstructure. Polymers with densities between 0.93 and 0.91 g/cc
have thinner lamellae and smaller spherulities. Materials with densities between 0.91 and
0.89 g/cc have a mixed morphology of small lamellae and bundled crystals. These
materials can form very small spherulities. Copolymers with densities less than 0.89
g/cc have no lamellae or spherulities.
Kontou and Spathis [2003] examined two types of metallocene ethylene-α-olefin
copolymers with some essential differences in their micro morphology that affected their
macroscopic behavior. They studied the viscoelastic behavior of the materials in a wide
temperature range (from -170oC up to the melting temperature) at four different
frequencies (0.2, 1, 10 and 50 Hz) in terms of DMA, and obtained the experimental
curves of E (t). They concluded that using this method, values of E(t) at extremely low
values of time were available. Hereafter, this function satisfactorily predicted the stress-
strain response of the material in the initially linear viscoelastic region in terms of a
single integral constitutive equation without the requirement for any model parameters.
For higher values of deformation, where plastic strain was enhanced, a plasticity theory
of separating the plastic and viscoelastic part of strain was applied, to completely
describe the stress-strain behavior.

25
Soares et al. [2002] synthesized a series of poly (ethylene-co-1-hexene) resins
with very distinct, and in some cases bimodal crystalline distributions. These resins
possess narrow and similar molecular weight distributions (as expected from metallocene
catalysts) but different short chain branch distribution. They found that the tensile
properties of a copolymer could be controlled by regulating the ratio of the crystalline
species present in the sample.
Nitta and Tanaka [2001] examined dynamic mechanical properties of metallocene
Linear PEs with various Mw varying from 20×103 to 260×103 and branched linear
polyethylenes (BPEs) having various degrees of short chain branching. It was found that
the positions of α (crystal) relaxation and melting temperature had similar functional
dependence of the inverse of the lamellar thickness 1/Lc. The β relaxation appeared
around 250 K in the dynamic mechanical spectra for higher molecular weight PEs having
more than about 200×103 of Mw. The molecular mechanism underlying β relaxation for
Linear PEs was different from that for BPEs.
Razavi-Nouri and Hay [2001] made a comprehensive study on a metallocene
polyethylene characterizing the isothermal crystallization kinetics, melting and
crystallization behavior, crystal growth and dynamic mechanical properties to understand
the relationship between molecular structure and mechanical properties of this new class
of polyethylene. The melting behavior after step-wise crystallization showed that m-PE
consisted of molecular fractions with different molecular weight and branch distribution.
Dynamic mechanical property studies showed that three transitions existed in m-PE with
the α-transition increasing in intensity and shifting to higher temperatures in samples
crystallized at higher temperature compared to the rapidly cooled samples.
26
Mauler et al. [2001] studied the influence of comonomer content and type on the
dynamic mechanical behavior of some ethylene/α-olefin (1-hexene, 1-octene, 1-decene,
1-octadecene and 4-methyl-1-pentene) copolymers. It was observed that the comonomer
content greatly influenced α and β transitions, but hardly influenced γ transition. Thus the
α transition intensity decreased and β transition intensity increased as the comonomer
content increased. Only 1-octadecene showed a different behavior. At higher comonomer
content, ethylene/1-octadecene comonomer showed two defined transitions in the α
transition region, suggesting the presence of crystals of different sizes.
Strack and LÖfgren [2002] did similar work using α-olefins such as 1-octene, 1-
tetradecene and 1-octadecene. Their DMA measurements showed the loss modulus
maximum to be a more sensitive value than the loss tangent maximum for the
characterization of the comonomer distribution. The intensity of the β transition of 1-
octadecene did not increase with increasing branching in contrast to the situation for 1-
octene and 1-tetradecene copolymers.
Jordens et al. [2000] synthesized several linear polyethylene homopolymers of
various molecular weights using a metallocene catalyst. They examined the thermal,
morphological, and mechanical behaviors as a function of molecular weight and thermal
treatment. They found that the Young’s modulus, yield stress, and yield strain were
directly related to percent crystallinity and independent of molecular weight. However,
increasing molecular weight suppressed the peak in the stress-strain curves at the yield
point. They also found that thermal treatment had a large influence on the shape of the
mechanical α-relaxation, while the crystal content affected the strength of γ and β
relaxations.

27
Keating and Lee [1999] studied over 20 commercially available PEs of Ziegler-
Natta and Metallocene types. ZN PEs presented a prominent α transition in addition to
the β transition in the tan δ curves. The metallocene PEs did not show the α transition.
The tan δ peak intensities of m-C4 and m-C8 were higher than their ZN counterparts.
Moreover, the β transitions of the m-C4 PEs were 7o - 8oC higher than those of the ZN-C4
PEs at equivalent compositions.
Sacristan et al. [1999] synthesized a series of HDPE via homogeneous
polymerization with metallocene catalyst in two different reactors (glass and stainless
steel). No marked influence was found for the reaction parameters on the mechanical
behavior of the polymers. Their mechanical and dynamic mechanical properties were
close to those of Ziegler-Natta polyethylenes.
Starck [1997] investigated commercial LLDPE and VLDPE produced using
traditional high activity ZN and metallocene catalysts, respectively, using dynamic
mechanical thermal analysis and reported that the intensity of the tan δ maximum peak
increased with the incorporation of more comonomer. Starck did not provide
explanations for these observations. The metallocene polymers, with the exception of the
metallocene LLDPE studied, gave the highest tan δ intensity values which demonstrated
the ease of incorporating higher comonomer amounts in the case of single site polymers.
The studied m-LLDPEs showed a behavior very close to that of LDPE. In many cases,
the study of the maxima of the loss modulus curves gave still more exact information of
the smaller amounts of branching present in the polymer.

28
Woo et al. [1996] performed dynamic mechanical analysis on a series of m-PEs
and results were compared with LDPE and ZN-LLDPE. It was found that the
measurement was in good agreement with the calculated response.
From the above literature review, it can be concluded that most of the researchers
1) compared the mechanical and thermal properties of traditional ZN-
LLDPE with those of m-LLDPE.
2) compared the mechanical and thermal properties of different grades of
mPEs such as HDPE, LDPE, LLDPE, VLDPE, etc.
3) studied the effect of molecular weight and thermal treatment on the
various thermal transitions.
4) examined the effect of comonomer type and branch content on the
different thermal transitions.
5) investigated the effect of quenching condition of the film on the final
properties.
However, the previous work did not isolate the interactions between the different
molecular parameters such as branch content and composition distribution. Also, the
influence of molecular parameters on crystallization kinetics of m-LLDPEs was not
studied before. In this research work, the influence of different molecular parameters
such as branch type and branch content on thermal and mechanical properties of m-
LLDPEs will be studied.
Note: More literature update is available in the actual papers in Chapter 4.
29
CHAPTER 3
EXPERIMENTAL
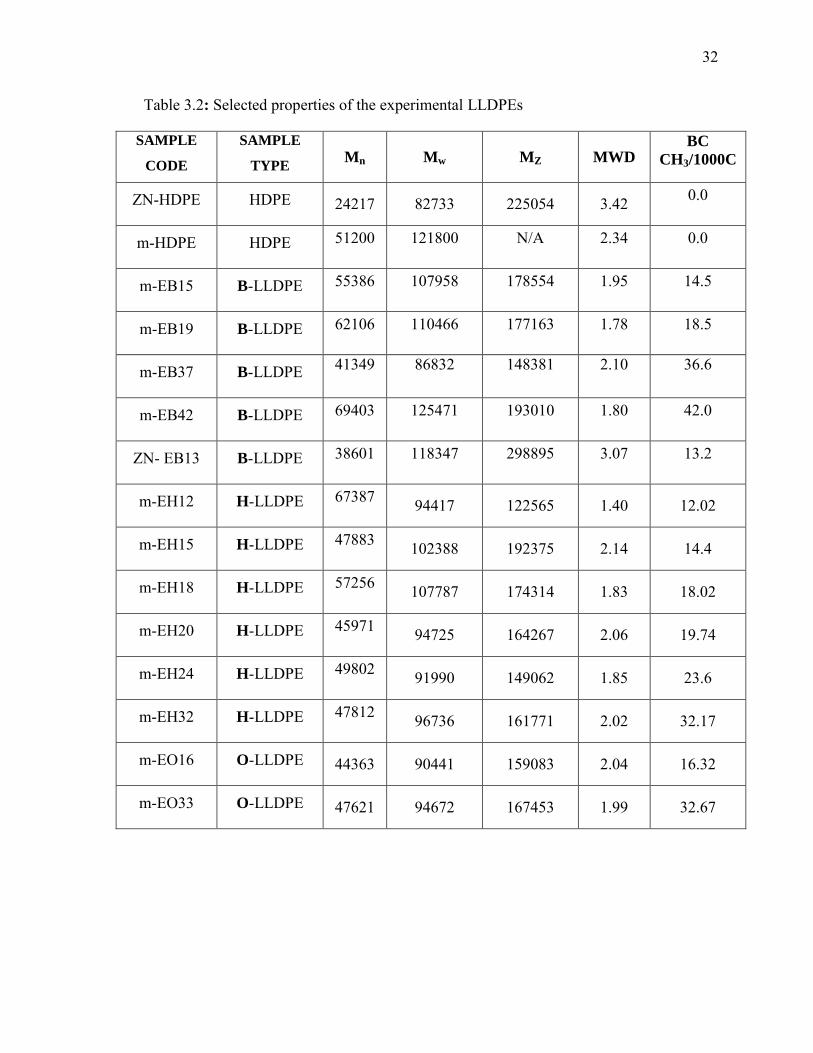
3.1. Materials
Currently the widest range of m-LLDPE is produced by ExxonMobil Chemical
Corporation. Twelve samples of m-LLDPEs, three ZN-LLDPEs, one ZN high density
polyethylene (ZN-HDPE) and one metallocene high density polyethylene (m-HDPE) of
various densities were selected for this research work. The details of branch types, melt
index, and density of these samples are given in Table 3.1. The density and melt index
were supplied by the manufacturer. The m-LLDPEs set contains 4 ethylene-butene
copolymers (m-EB), 6 ethylene-hexene LLDPE (m-EH) and 2 ethylene-octene
copolymers (m-EO). The m-LLDPE resins were selected to include low and high density
LLDPEs (0.880 – 0.918). The MI is directly related to Mw where high MI implies low
Mw. On the other hand, density correlates with branch content (BC) where high branch
content results in low density. Three ZN-LLDPEs were selected from each branch type to
examine the influence of composition distribution. ZN-HDPE and m-HDPE were
included for comparison purpose.
GPC characterization of all these resins was performed to obtained Mn, Mw, Mz,
and MWD of these polymers. GPC data was collected using 1,2,4 trichlorobenzene as
solvent at 150 oC in a WATERS GPC2000 instrument. Polystyrene standards were used
for calibration. Also, 13C NMR was performed to obtain branch content. A sample of
about 50-60 mg was dissolved in 0.4 ml Trichlorobenzene (TCB) solvent. 0.1 mg

30
Table 3.1: Branch type, melt index and density of selected samples
SAMPLE CODE SAMPLE
TYPE
COMMERCIAL NAME DENSITY
ZN-HDPE HDPE HMA-014 0.9600
m-HDPE HDPE N/A N/A
m-EB15 B-LLDPE EXACT-3125 0.9100
m-EB19 B-LLDPE EXACT-3128 0.9000
m-EB37 B-LLDPE EXACT-4011 0.8880
m-EB42 B-LLDPE EXACT-4033 0.8800
ZN- EB13 B-LLDPE LL-1001 X 72 0.9180
m-EH12 H-LLDPE EXCEED-2518CB 0.9180
m-EH15 H-LLDPE EXACT-9107 0.9120
m-EH18 H-LLDPE EXACT-3132 0.9000
m-EH20 H-LLDPE EXACT-9106 0.9020
m-EH24 H-LLDPE EXACT-4151 0.8950
m-EH32 H-LLDPE EXACT-4056 0.8830
m-EO16 O-LLDPE EXACT-0201 0.9020
m-EO33 O-LLDPE EXACT-8201 0.8820

31
deteriorated Benzene (C6D6) was added to get the lock signal from NMR. 2-3 mg Feric
acetile acetate (FAcAc) was added as relaxation agent. The solution then transferred into
a 5 mm NMR tube. Data were collected at 135oC for 2 hours with 2000 scan. Results are
given in Table 3.2.
Polymers were selected to study the influence of molecular parameters one at a
time. For example, comparison of m-EB15 and m-EH15 revealed the influence of
comonomer type (butene vs. hexene) since the two have similar Mw, MWD and BC. The
influence of composition distribution was examined by comparing resins of similar MI,
density and comonomer types such as m-EB15 and ZN-EB13. Further, the influence of
branch density is revealed by comparing resins of similar Mw, branch type and
composition distribution such as m-EO16 vs. m-EO33.
3.2. Experimental Procedure
3.2.1. Mechanical Testing
Sample Preparation: A rectangular plate was prepared by compression molding
from the “as-received” resins in a Carver press. To produce a controlled thermo-
mechanical history, the following procedure was followed. At 170oC, a load of 1 metric
ton (MT) was applied for 2 min., followed by a load of 3 MTs for 3 min., then a load of 5
MTs for 1 min., and a load of 7 MTs for 3 min., and finally the mold was water-cooled
for 7 min. A Pneumatic punch cutter was used to cut ‘dog-bone’ specimens from this
plate according to ASTM D638 (type V). Figure 3.1 shows the photographs of the Carver
press and the Pneumatic Punch Cutter.
32
Table 3.2: Selected properties of the experimental LLDPEs
SAMPLE
CODE
SAMPLE
TYPE Mn Mw MZ MWD BC
CH3/1000C
ZN-HDPE HDPE 24217 82733 225054 3.42 0.0
m-HDPE HDPE 51200 121800 N/A 2.34 0.0
m-EB15 B-LLDPE 55386 107958 178554 1.95 14.5
m-EB19 B-LLDPE 62106 110466 177163 1.78 18.5
m-EB37 B-LLDPE 41349
86832
148381
2.10
36.6
m-EB42 B-LLDPE 69403 125471 193010 1.80 42.0
ZN- EB13 B-LLDPE 38601 118347 298895 3.07 13.2
m-EH12 H-LLDPE 67387 94417 122565 1.40 12.02
m-EH15 H-LLDPE 47883 102388 192375 2.14 14.4
m-EH18 H-LLDPE 57256 107787 174314 1.83 18.02
m-EH20 H-LLDPE 45971 94725 164267 2.06 19.74
m-EH24 H-LLDPE 49802 91990 149062 1.85 23.6
m-EH32 H-LLDPE 47812 96736 161771 2.02 32.17
m-EO16 O-LLDPE 44363 90441 159083 2.04 16.32
m-EO33 O-LLDPE 47621 94672 167453 1.99 32.67

33
Figure 3.1: a) Hydraulic Carver Press; b) Pneumatic Punch Cutter.
34
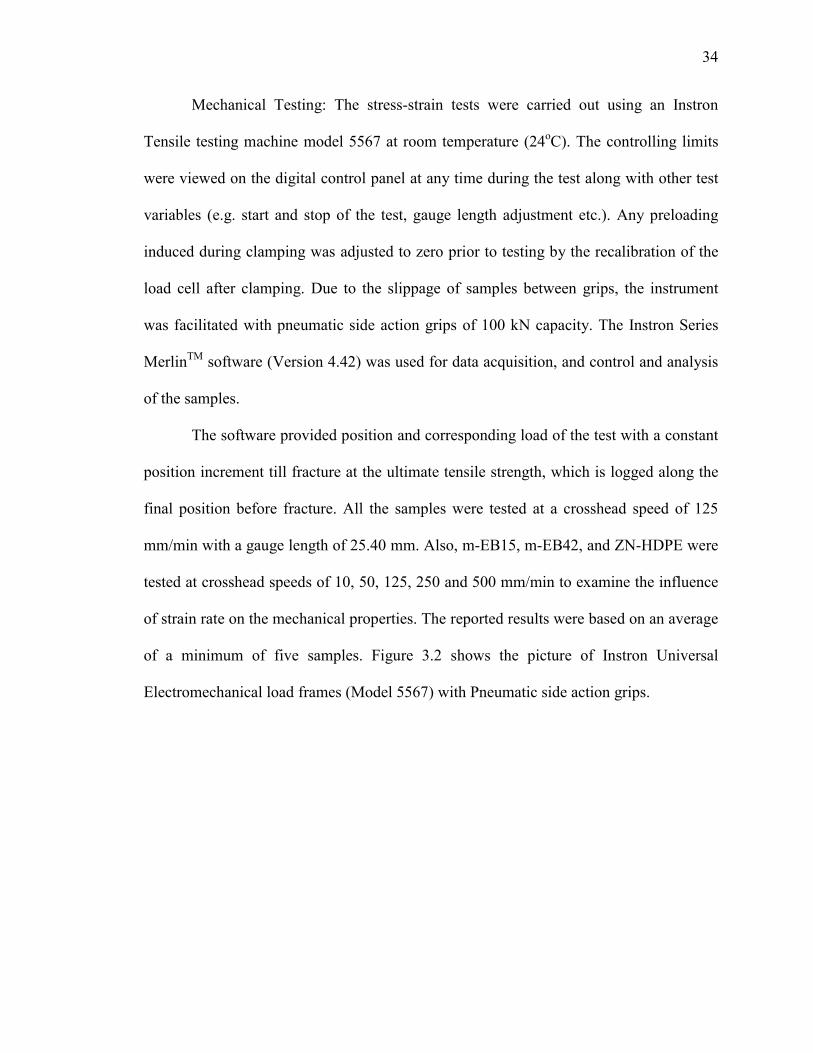
Mechanical Testing: The stress-strain tests were carried out using an Instron
Tensile testing machine model 5567 at room temperature (24oC). The controlling limits
were viewed on the digital control panel at any time during the test along with other test
variables (e.g. start and stop of the test, gauge length adjustment etc.). Any preloading
induced during clamping was adjusted to zero prior to testing by the recalibration of the
load cell after clamping. Due to the slippage of samples between grips, the instrument
was facilitated with pneumatic side action grips of 100 kN capacity. The Instron Series
MerlinTM software (Version 4.42) was used for data acquisition, and control and analysis
of the samples.
The software provided position and corresponding load of the test with a constant
position increment till fracture at the ultimate tensile strength, which is logged along the
final position before fracture. All the samples were tested at a crosshead speed of 125
mm/min with a gauge length of 25.40 mm. Also, m-EB15, m-EB42, and ZN-HDPE were
tested at crosshead speeds of 10, 50, 125, 250 and 500 mm/min to examine the influence
of strain rate on the mechanical properties. The reported results were based on an average
of a minimum of five samples. Figure 3.2 shows the picture of Instron Universal
Electromechanical load frames (Model 5567) with Pneumatic side action grips.

35
Figure 3.2: Instron 5567 equipped with Pneumatic side action grips.
36
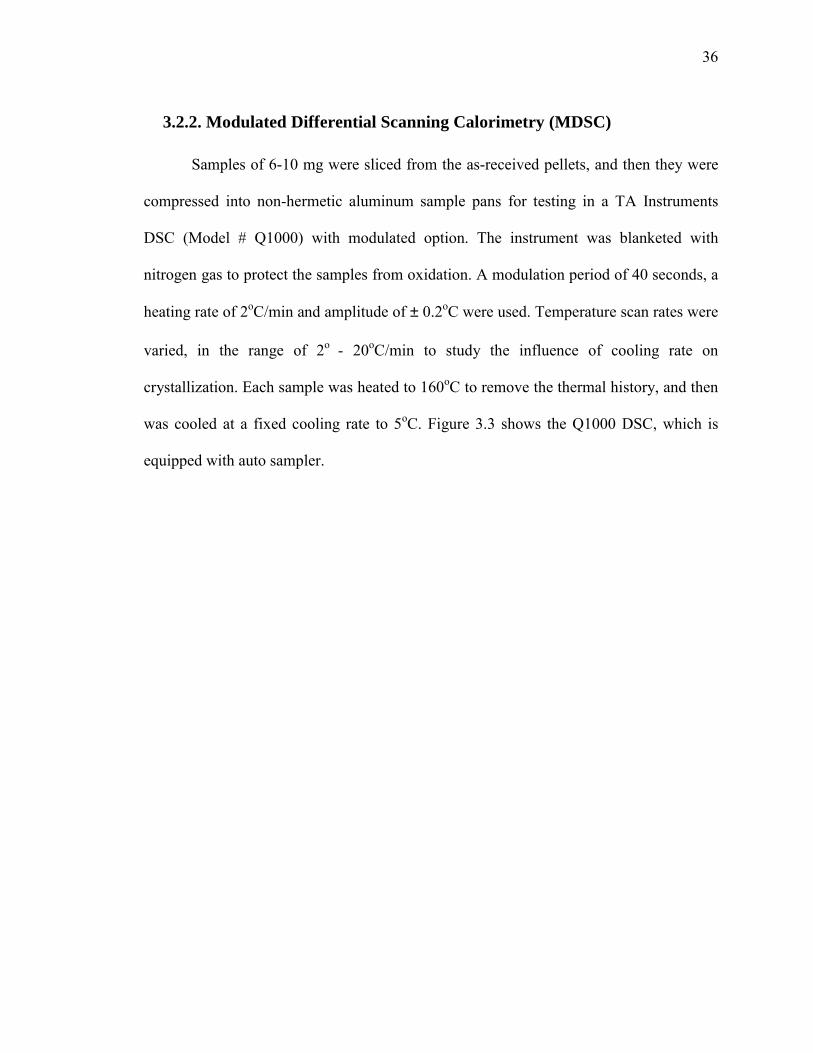
3.2.2. Modulated Differential Scanning Calorimetry (MDSC)
Samples of 6-10 mg were sliced from the as-received pellets, and then they were
compressed into non-hermetic aluminum sample pans for testing in a TA Instruments
DSC (Model # Q1000) with modulated option. The instrument was blanketed with
nitrogen gas to protect the samples from oxidation. A modulation period of 40 seconds, a
heating rate of 2oC/min and amplitude of ± 0.2oC were used. Temperature scan rates were
varied, in the range of 2o - 20oC/min to study the influence of cooling rate on
crystallization. Each sample was heated to 160oC to remove the thermal history, and then
was cooled at a fixed cooling rate to 5oC. Figure 3.3 shows the Q1000 DSC, which is
equipped with auto sampler.

37
Figure 3.3: a) Modulated DSC Q1000, TA Instrument Inc. equipped with Auto sampler
b) Liquid Nitrogen Cooling System (LNCS).
CHAPTER 4
RESULTS AND DISCUSSION
4.1. Influence of Branch Content, Comonomer Type, and Strain Rate on
the mechanical properties of metallocene LLDPEs
4.1.1. Abstract
The influence of branch content (BC) and comonomer type on the mechanical
properties of metallocene linear low density polyethylene (m-LLDPEs) was studied by
means of stress/strain experiment at room temperature. A total of 14 samples of different
BC and comonomer types were used. In addition, the influence of strain rate on the
mechanical properties of m-LLDPEs with different BCs was examined. The degree of
crystallinity of these copolymers was determined by differential scanning calorimetry. In
addition, one Ziegler-Natta LLDPE (ZN-LLDPE) having comonomer type of butene
(ZN-EB) and one Ziegler-Natta HDPE (ZN-HDPE) were also studied for comparison
purposes. The increase in BC of m-LLDPEs lowered the crystallinity and the modulus.
However, having close Mw and BC, ZN-EB13 showed higher small strain properties but
lower ultimate properties than m-EB15. In comparison with low BC resins, m-LLDPEs
with high BC exhibited a stronger strain hardening during stress/strain experiments. The
strain hardening was modeled by a modified Avrami equation, and the order of the
mechanically induced crystal growth is in the range of 1-2 suggesting athermal
nucleation. The strain rate was varied from 10 to 500 mm/min. For low BC m-LLDPEs, a
very narrow strain rate window existed within which a maximum in modulus and
39
ultimate properties was observed. The location of the maximum was independent of BC.
The influence of the strain rate on the mechanical properties of m-LLDPEs is a strong
function of BC. The strain rate did not influence the mechanical properties of highly
branched m-LLDPEs.
4.1.2. Introduction
Metallocene-catalyzed polyethylenes (m-PEs) have attracted great attention from
film manufacturers since their commercial development. Metallocene linear low density
polyethylenes (m-LLDPEs) are now widely used in packaging film applications [1]. The
major advantage of m-LLDPEs over conventional (Ziegler-Natta type) LLDPEs is the
possibility of the synthesis of ethylene copolymers with a narrow molecular weight
distribution (MWD) and homogeneous composition distribution. The lack of high and
low molecular weight tails in these copolymers has significant effects on their processing
characteristics and physical properties [2].
Microstructure of polymers plays an important role in determining their
mechanical properties. A number of structural and morphological factors such as type,
concentration, and distribution of branching; degree of crystallinity; average molecular
weight (Mw); and MWD directly influence the mechanical properties of polyethylenes [3-
10]. Many studies have investigated the effect of branch content and branch type on the
crystallization behavior and mechanical properties of ethylene/α-olefin copolymers [11-
21]. The authors have reported either the small strain behavior or the properties of low
BC ZN-LLDPEs.
Simanke et al. [11] studied the effect of branching on the mechanical properties of
1-hexene, 1-octene, 1-decene, 1-octadecene and 4-methyl-1-pentene and their results

40
were limited to the small strain behavior. They failed to obtain the full stress/strain curves
of these copolymers due to slippage in the grips. The branch distribution and comonomer
type at similar crystallinity had only small effects on the modulus but considerable
variations were found in modulus with increasing branch content [13,22]. The initial
modulus decreased monotonically with the increase in branching, irrespective of the
crystallization mode [22]. Sehanobish et al. [13] also observed similar results and
suggested that the modulus of branched polyethylene was primarily dominated by
crystallinity. On detailed examination, Mandelkern and his coworkers [4,5] clarified that
the influence of crystallinity on modulus was complex.
By increasing the number of short chain branches via incorporation of α-olefin
comonomers such as 1-butene, 1-hexene, 1-octene, etc., the polymer crystallinity and
density can be reduced. These side chains do not crystallize and are rejected into the
amorphous or interfacial regions [11,12]. m-LLDPEs are generally believed to have
homogeneous composition distribution and a narrow MWD. So, m-LLDPEs provide an
opportunity to investigate the roles of short chain branching on the mechanical properties
of these copolymers. So, mechanical properties of LLDPEs are influenced by BC,
comonomer type, as well as other molecular parameters such as Mw and MWD.
However, the previous work that studied the influence of BC and comonomer type on the
mechanical properties was limited to small strain properties. Here, large strain properties
have been investigated.
In addition, mechanical properties of polymers can be influenced by the test
parameters. During mechanical testing, the effect of increasing deformation rate or strain
rate on the low strain portions of the stress-strain curve was suggested to be similar to the

41
effect of increasing a sample’s degree of crystallinity or decreasing the test temperature
[2]. Generally, for polymers, the flow stress (stress needed for plastic flow) increases
with temperature. The sensitive nature of flow stress on strain rate and temperature can
be described by Eyring’s equation [23]. According to Eyring’s equation, the slope of the
linear dependence of yield stress on strain rate is related to materials elemental motion
unit and the testing temperature.
Understanding of the strain rate dependence on the deformation behavior of
polyethylene is important for the end-users. The effect of strain rate on the deformation
of polymers has received wide attention by many researchers [24-30]. In LDPE, till now
no attention has been given to the influence of strain rate on the polymers with different
branch content (BC). The strain rate has a strong effect on the deformation process of
polymers because the energy used during plastic deformation is largely dissipated as heat.
This effect was observed to be more prominent at high strain rates associated with
adiabatic drawing rather than during small strain rates where isothermal drawing
occurred [26,28]. Termonia et al. [29] reported that each molecular weight exhibited a
different temperature or elongation window within which optimum drawing occurred.
Within these windows, the rate of slippage of chains through entanglements reached a
maximum value. Again, the previous work did not study the influence of BC on the strain
rate dependency of the mechanical properties of m-LLDPE.
In the present work, metallocene copolymers of ethylene and 1-butene (m-EB), 1-
hexene (m-EH) and 1-octene (m-EO) were used. The selected m-LLDPEs had similar
Mw and MWD. The objective was to investigate the influence of BC and comonomer
type on the mechanical properties of m-LLDPEs at small and large strains. For the first

42
time, the effect of BC on the large strain properties of m-LLDPEs is measured and
modeled using a modified form of Avrami equation. Some conventional LLDPEs (ZN-
LLDPEs) were examined for comparison with m-LLDPEs of similar BC, comonomer
type, and Mw. The influence of BC was studied using m-LLDPE with BC in the range
14-42 branches/1000 C. To explore the consequences of varying the comonomer type,
butene; hexene; and octene ethylene copolymers of selected BCs were used. In addition,
the impact of strain rate on the mechanical properties of m-LLDPEs of different BCs was
determined.
4.1.3. Experimental
Materials and Sample Preparation
Twelve commercial samples of m-LLDPEs, three ZN-LLDPEs and one high
density polyethylene (HDPE) were used. The types of m-LLDPEs are as follows: four 1-
butene, six 1-hexene and two 1-octene ethylene copolymers. The three ZN-LLDPEs, one
from each comonomer type, were selected for comparison with m-LLDPEs and a ZN-
HDPE was used as a reference. The ZN-HDPE represents a limiting case for LLDPEs
with low BC since it has zero BC. All samples were ExxonMobil products. Weight
average molecular weights (Mw) of all LLDPEs (both metallocene and ZN) are close to
100 kg/mol and the MWD of m-LLDPEs is (≅ 2). Hence, the only primary micro
structural variable is BC. Table 4.1.1 provides characterization data for all of the samples.
Density and Melt Index (MI) values were provided by ExxonMobil. In addition,
information about Mw and BC was determined by gel permeation chromatography
(GPC) and 13C NMR, respectively. Details about the GPC and the NMR
characterizations were given in a previous publication [31]. Resins were named according

43
Table 4.1.1: Polyethylene properties
Resin Density, g/cm3 MI, g/10min Mw, kg/mol Mw/Mn BC *
m-EB15 0.910 1.20 108 1.95 14.50
m-EB19 0.900 1.20 110 1.78 18.50
m-EB37 0.888 2.20 87 2.10 36.62
m-EB42 0.880 0.80 126 1.81 42.00
ZN-EB13 0.918 1.0 118 3.07 13.20
m-EH12 0.918 2.50 94 1.40 12.02
m-EH15 0.912 1.20 102 2.14 14.50
m-EH18 0.900 1.20 108 1.83 18.02
m-EH20 0.902 2.0 95 2.06 19.74
m-EH24 0.895 2.20 92 1.85 23.60
m-EH32 0.883 2.20 97 2.02 32.17
m-EO16 0.902 1.10 90 2.04 16.32
m-EO33 0.882 1.10 95 1.99 32.67
ZN-HDPE 0.961 0.70 102 6.7 0.0
* (CH3/1000C)

44
to their branch type and content. For example, a metallocene ethylene-butene copolymer
with a BC of 14.5 CH3/1000C is named as m-EB15.
Mechanical Testing
Compression molding was used to obtain sheets (about 3 mm thick) in a Carver
press by applying the following thermal history: At 170oC, a load of 1 metric ton (MT)
was applied for 2 min., followed by a load of 3 MTs for 3 min., then a load of 5 MTs for
1 min., and a load of 7 MTs for 3 min., and finally the mold was water-cooled for 7 min.
Pneumatic punch cutter was used to cut ‘dog-bone’ specimens from this plate according
to ASTM D638 (type V). The tensile tests were performed using an Instron 5567 tensile
testing machine at room temperature (24oC). To prevent slippage between regular grips at
higher strains, pneumatic side action grips were used. It should be noted that the previous
work of Simanke et al. [11] faced slippage problem; hence, large strain mechanical
properties were not obtained. All samples were tested at a crosshead speed of 125
mm/min with a gauge length of 25.40 mm. Also, m-EB15, m-EB42 and linear HDPE
were tested at crosshead speeds of 10, 50, 125, 250 and 500 mm/min to examine the
impact of strain rate on mechanical properties. The results reported in this study are based
on an average of a minimum of five samples.
Differential Scanning Calorimetry (DSC)
DSC measurements were performed on a TA Q1000 instrument under nitrogen
atmosphere. The nitrogen flow rate was 50 ml/min. The samples obtained from the
Carver press were used to obtain the crystallinity. Also, the samples of PEs were
collected from the fractured surface of the strained specimens. Samples of 5-10 mg were
sliced and then compressed into non-hermetic aluminum pans. Then, heating from 0 to

45
150oC was carried out at a rate of 10 oC/min. Calculations of the stress-induced
crystallinity were based on a heat of fusion of 290 J/g for a perfect polyethylene crystal
[32].
4.1.4. Results and Discussion
Influence of Branch Content
Figures 4.1.1, 4.1.2 and 4.1.3 show the stress-strain behavior of 1-butene, 1-
hexene -and 1-octene m-LLDPEs with different BC obtained at a crosshead speed of 125
mm/min. In general, the yield stress decreases with increasing BC. At large strains, the
situation is quite different. Strain hardening was observed for almost all samples and it
was more pronounced in high BC resins.
Crystallinity: The crystallinity values were obtained from DSC for all samples before and
after the stress/strain experiments. Results are given in Table 4.1.2. DSC testing of PE
samples before the stress/strain experiment will reveal the initial crystallinity, which
influences the Young’s modulus. On the other hand, the testing of the strained samples
will disclose the influence of strain hardening behavior on final crystallinity. The
objective of testing strained samples is to check for induced crystallization due to the
application of stress. The DSC thermograms of EB before (solid line) and after (dashed
line) mechanical testing are given in Figure 4.1.4. It was found that the crystallinity
changes slightly after deformation for copolymers with high initial crystallinity (low BC).
However, copolymers with BC higher than 30 CH3/1000C exhibit an appreciable increase
in final crystallinity after deformation (see Table 4.1.2). Figure 4.1.4 shows a clear shift
in the melting peak of m-EB15 and m-EB19 resins.

46
0
5
10
15
20
25
30
35
40
45
0 200 400 600 800 1000 1200 1400Engineering Strain (%)
Eng
inee
ring
Stre
ss (M
Pa)
m-EB15m-EB19m-EB37m-EB42
BC = 14.5
18.5
36.6
42.0
Figure 4.1.1: Stress/strain curves for EB m-LLDPEs with different BCs.

47
0
5
10
15
20
25
30
35
40
45
0 200 400 600 800 1000 1200 1400Engineering Strain (%)
Engi
neer
ing
Stre
ss (M
Pa)
m-EH12m-EH15m-EH18m-EH20m-EH24m-EH32
BC = 12.0
14.4
19.7 23.6
18.0
32.2
Figure 4.1.2: Stress/strain curves for EH m-LLDPEs with different BCs.

48
0
5
10
15
20
25
30
35
40
45
0 200 400 600 800 1000 1200 1400
Engineering Strain (%)
Engi
neer
ing
Stre
ss (M
Pa)
m-EO16m-EO33
BC = 16.3
32.7
Figure 4.1.3: Stress/strain curves for EO m-LLDPEs with different BCs.
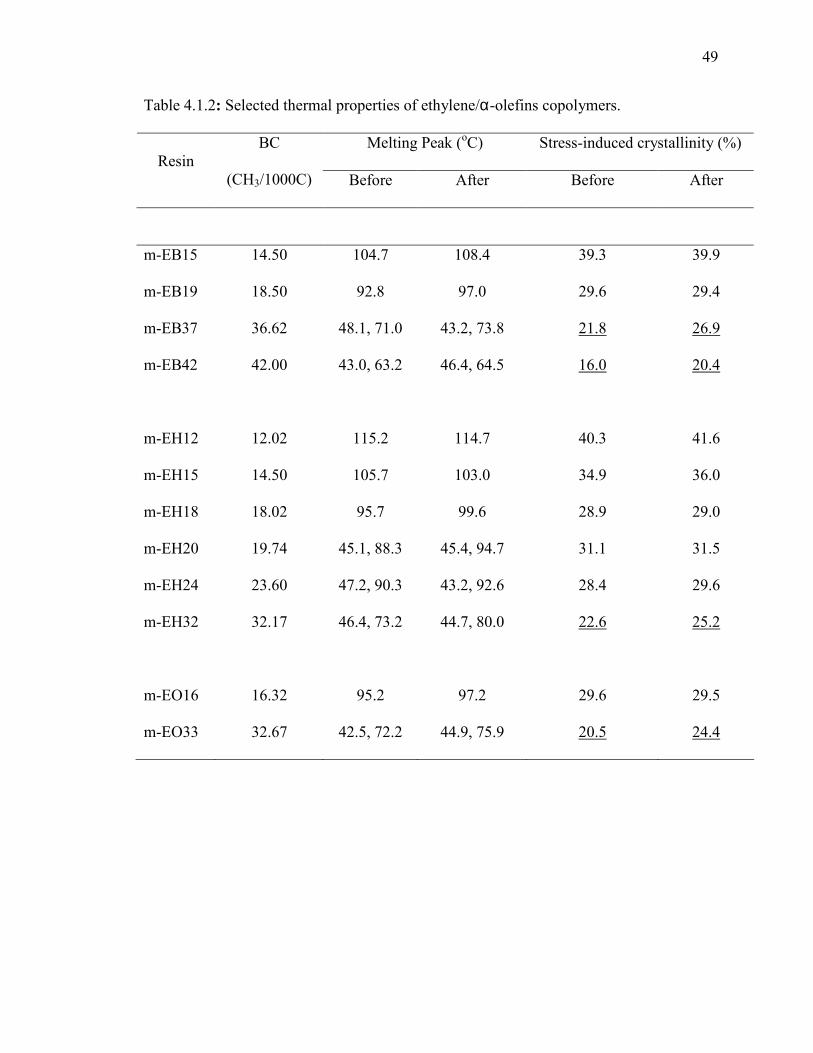
49
Table 4.1.2: Selected thermal properties of ethylene/α-olefins copolymers.
Melting Peak (oC) Stress-induced crystallinity (%) Resin
BC
(CH3/1000C) Before After Before After
m-EB15 14.50 104.7 108.4 39.3 39.9
m-EB19 18.50 92.8 97.0 29.6 29.4
m-EB37 36.62 48.1, 71.0 43.2, 73.8 21.8 26.9
m-EB42 42.00 43.0, 63.2 46.4, 64.5 16.0 20.4
m-EH12 12.02 115.2 114.7 40.3 41.6
m-EH15 14.50 105.7 103.0 34.9 36.0
m-EH18 18.02 95.7 99.6 28.9 29.0
m-EH20 19.74 45.1, 88.3 45.4, 94.7 31.1 31.5
m-EH24 23.60 47.2, 90.3 43.2, 92.6 28.4 29.6
m-EH32 32.17 46.4, 73.2 44.7, 80.0 22.6 25.2
m-EO16 16.32 95.2 97.2 29.6 29.5
m-EO33 32.67 42.5, 72.2 44.9, 75.9 20.5 24.4

50
m-EB15
m-EB19
m-EB37
m-EB42
-2
-1
0
1
2
Hea
t Flo
w (W
/g)
0 20 40 60 80 100 120 140 160
Temperature (°C)Exo Up
Figure 4.1.4: DSC thermograms of EBs before (solid line) and after (dashed line)
mechanical testing at crosshead speed of 125 mm/min. (the arrows show the appearance
of the peaks.)
51
Sumita et al. [33] showed that the increases in both the heat of fusion and melting
temperature of polyethylene were attributed to orientation of the amorphous phase as a
result of drawing (induced crystallization). They proposed that the excess free energy of
the amorphous phase resulting from orientation increases the melting temperature. This is
a direct result of the decrease in ∆S due to orientation; hence, ∆G is more positive
(∆G=∆H-T∆S). Results in Table 4.1.2 show that samples with low BC displayed increase
in Tm without any significant change in total crystallinity. So, it is likely that crystal
perfection rather than induced crystallization might have taken place. The low BC m-
LLDPEs have a high initial crystallinity. So, it is reasonable to assume that most of the
applied stress is used to perfect the crystals. Crystal perfection due to the application of
stress was previously observed for ZN-LLDPE [34]. It was suggested that the more
defective crystals of LLDPEs were destroyed during tensile testing and rebuilt into more
perfect crystals [34]. This assumption is reinforced in our current observation that the
strain hardening for low BC resins was lower than that for the high BC m-LLDPEs.
The stress on samples with high BC (more amorphous) resulted in increased total
crystallinity and a shift in Tm. However, for high BC resins, the peaks are very broad and
more than one melting peak was observed. Both melting peaks in m-EB37 and m-EB42
were shifted to the right. In addition, the applied stress has improved the sharpness of the
peak in high BC resins. This suggests that part of the applied stress was used to perfect
the weak crystal of highly branched m-LLDPEs as well as increase the depth of the peaks
(increase crystallinity) as a result of induced crystallization. For high crystallinity resins
(m-EB15 and m-EB19), the shift in Tm is easy to detect.
52
Now, the presence of two melting peaks in m-LLDPEs with high BC will be
discussed. This is likely due to the poor branch distribution of m-LLDPE with high BC,
which will lead to linear portions and branched parts in the same molecule. Hence,
crystallization of the different parts of the same molecule will take place at different
temperatures with branches being excluded from the crystalline lattice. Similar
observation and explanations were reported by Tanem and Stori [35] for copolymers with
high BC. The interfacial region may have some ordering retained from the crystalline
phase [16]. The DSC results show that stress-induced crystallization is more pronounced
in the more amorphous resins (high BC samples). So, it is likely that high stresses result
in perfection of crystals of low BC samples and induced crystallization in high BC resins.
The stress-induced crystallization has resulted in an increase in stress with time.
The increase in stress beyond the yield point is believed to be a result of orientation or
induced crystallization. The point at which the stress/time curve starts to show increase in
stress is taken as (σo, 0). With time, the polymer crystallinity will increase and the stress
needed to maintain a constant strain rate will increase, too. This increase in stress will
continue till the sample failure at (σf, tf). At any time on the stress/time curve (obtained
from stress/strain curve) the increase in stress (σ-σo) will induce the formation of
crystals. In thermally induced crystallization, ∆T is the driving force for crystallization.
On the other hand, ∆σ is the driving force for mechanically induced crystallization.
Sumita et al. [33] obtained a linear relationship between the heat of fusion (proportional
to crystallinity) and the melting point. Therefore, it is assumed that the increase in stress
is proportional to the increase in crystallinity [∆σ α X].
53
Hence, the fractional increase in stress [(σ-σo)/ (σf -σo)] is equal to the fractional
increase in crystallinity, Xt. The physics of the mechanically and the thermally induced
crystallizations are similar. So, it was found attractive to model the mechanically induced
crystallization by a modified Avrami equation that is widely used in studying the kinetics
of crystallization [36]. The authors are not aware of any previous work that attempted to
use Avrami type equation to model the mechanically induced crystallization.
The well known Avrami equation is defined as [37, 38]:
)exp(1 nt ktX −=− (4.1.1)
Where n is the Avrami crystallization exponent dependent on the mechanism of
nucleation, t is the time taken during the crystallization process, k is the growth rate
constant, and Xt is relative crystallinity of polymers. Both k and n are constants which
denote a given crystalline morphology and type of nucleation at a particular
crystallization condition [39]. The relative crystallinity, Xt is defined as follows:
∫∫
∞= t
t c
t
t c
tdTdTdH
dTdTdHX
ο
ο
)/(
)/( (4.1.2)
where dHc/dT is the rate of heat evolution and to and t∝ are the times at which
crystallization starts and ends, respectively. Eq. (1) was further modified by several
authors to describe non-isothermal crystallization [40-43] for non-isothermal
crystallization at a chosen cooling rate; Xt is a function of the crystallization temperature
(T). That is, Eq. 2 can be rewritten as follows:
∫∫
∞= T
T c
T
T c
tdTdTdH
dTdTdHX
ο
ο
)/(
)/( (4.1.3)

54
Where To and T∝ represent the onset and final temperature of crystallization,
respectively.
Crystallization time, t can be converted from temperature using the following equation
[40].
RTTt O −
= (4.1.4)
where R is the cooling rate (oC/min). Using Eq. (1) in double-logarithmic form
tnkX t lnln]]1ln[ln[ +=−− (4.1.5)
and plotting ln[-ln[1-Xt]] versus ln t for each cooling rate, a straight line is obtained.
From the slope and intercept of the lines, one can determine the Avrami exponent n and
the crystallization rate k. Here, the crystallization rate depends on the cooling rate. Thus,
the crystallization rate constant k should be corrected adequately. At a constant cooling
rate, k can be corrected as follows [40]:
Rkk /ln'ln = (4.1.6)
In the present work, the idea of non-isothermal crystallization was borrowed to
model the crystallization induced by the applied stress during stress/strain experiments.
This method was applied only for EH samples due to availability of a good number of
samples of the same branch type. Therefore, Xt, can be defined as follows:
∫∫
=f ddd
dddX
c
c
t ε
ε
ε
ε
ο
ο
εεσ
εεσ
)/(
)/( (4.1.7)
where εo and εf represent the onset and final point of engineering strain (mm/mm) in
stress/strain curve where increase in stress observed due to strain hardening. From Figure
4.1.2 the beginning of strain hardening was observed for all EH samples about to 150%
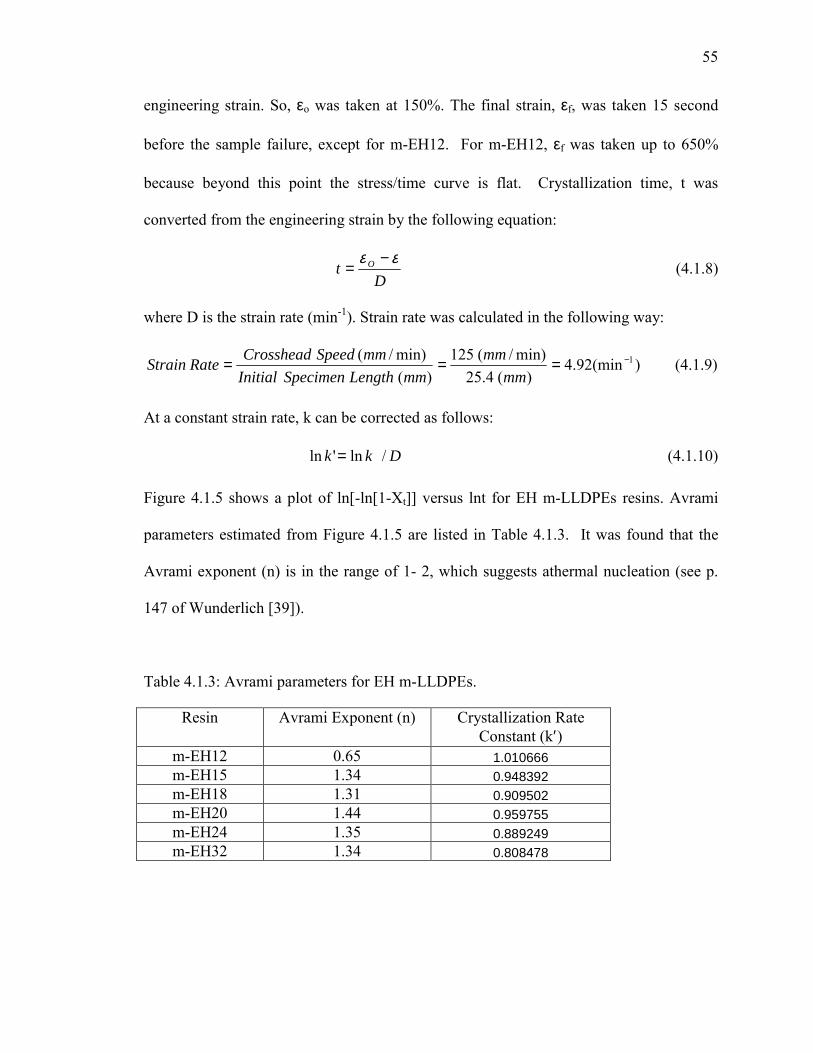
55
engineering strain. So, εo was taken at 150%. The final strain, εf, was taken 15 second
before the sample failure, except for m-EH12. For m-EH12, εf was taken up to 650%
because beyond this point the stress/time curve is flat. Crystallization time, t was
converted from the engineering strain by the following equation:
Dt O εε −
= (4.1.8)
where D is the strain rate (min-1). Strain rate was calculated in the following way:
)(min92.4)(4.25
min)/(125)(
min)/( 1−===mm
mmmmLengthSpecimenInitial
mmSpeedCrossheadRateStrain (4.1.9)
At a constant strain rate, k can be corrected as follows:
Dkk /ln'ln = (4.1.10)
Figure 4.1.5 shows a plot of ln[-ln[1-Xt]] versus lnt for EH m-LLDPEs resins. Avrami
parameters estimated from Figure 4.1.5 are listed in Table 4.1.3. It was found that the
Avrami exponent (n) is in the range of 1- 2, which suggests athermal nucleation (see p.
147 of Wunderlich [39]).
Table 4.1.3: Avrami parameters for EH m-LLDPEs.
Resin Avrami Exponent (n) Crystallization Rate Constant (k′)
m-EH12 0.65 1.010666 m-EH15 1.34 0.948392 m-EH18 1.31 0.909502 m-EH20 1.44 0.959755 m-EH24 1.35 0.889249 m-EH32 1.34 0.808478
56
-10
-8
-6
-4
-2
0
2
-8 -6 -4 -2 0 2 4lnt
ln(-l
n(1-
X t))
m-EH12m-EH15m-EH18m-EH20m-EH24m-EH32
Figure 4.1.5: Avrami plot for EH m-LLDPEs (strain rate 4.92 min-1).
57
Young’s Modulus and Yield Stress: Figure 4.1.6 shows an expanded view of
stress-strain curves in the vicinity of yielding. It was observed that the yield peak
becomes less distinct with increasing BC regardless of the comonomer type. Also, the
yielding region broadens with an increase in BC. Similar observations were reported by
Bensason et al. [14]. A double yield phenomenon is also observed for samples with BC <
20. At the first yield point, temporary plastic deformation was assumed, followed by a
recoverable re-crystallization of the lamellae. The second point is the onset of permanent
plastic deformation in which the lamellae are destroyed [44]. It was postulated that the
double yielding phenomena is due to a partial melting re-crystallization process. With
deformation the melted species will re-crystallize in the draw direction with a
simultaneous reduction in stress [45, 46].
In general, the copolymers with lower α-olefin contents showed higher yield
stress and Young’s modulus. Our results suggest that the yield stress does not depend on
the branch type but rather on BC. This result agrees with the observations of Simanke et
al. [11]. Results of Young’s modulus as a function of BC for all m-LLDPEs are presented
in Figure 4.1.7. The error bars indicate the range of these results for a minimum of 5
samples. In Figure 4.1.7, a relationship (modulus = 15279 BC-1.748) is introduced to fit all
data points. It is clear from Figure 4.1.7 that the modulus decreases with the increase in
BC but the relationship is not linear. For HDPE, the modulus is about 1100 MPa, whereas
m-LLDPEs show a modulus in the range of 30 to 240 MPa depending on BC. The
influence of crystallinity on modulus was suggested to be complex [4]. The modulus is
not a linear function of the degree of crystallinity. Popli and Mandelkern [4] have tried
to describe the plot by an “S” shaped curve. Branched polymers with Young’s modulus

58
0
2
4
6
8
10
12
0 50 100 150 200Engineering Strain (%)
Eng
inee
ring
Stre
ss (M
Pa)
m-EB15m-EB19m-EB37m-EB42
BC = 14.5
18.5
36.6
42.0
a)
0
2
4
6
8
10
12
0 50 100 150 200
Engineering Strain (%)
Eng
inee
ring Stre
ss (M
Pa)
m-EH12m-EH15m-EH18m-EH20m-EH24m-EH32
BC = 12.0
14.4
19.718.0
23.6
32.2
b)
0
2
4
6
8
10
12
0 50 100 150 200
Engineering Strain (%)
Engine
ering Stre
ss (M
Pa)
m-EO16m-EO33
BC = 16.3
32.7
c)
Figure 4.1.6: Effect of BC and branch type on yielding behavior (crosshead speed of 125
mm/min).
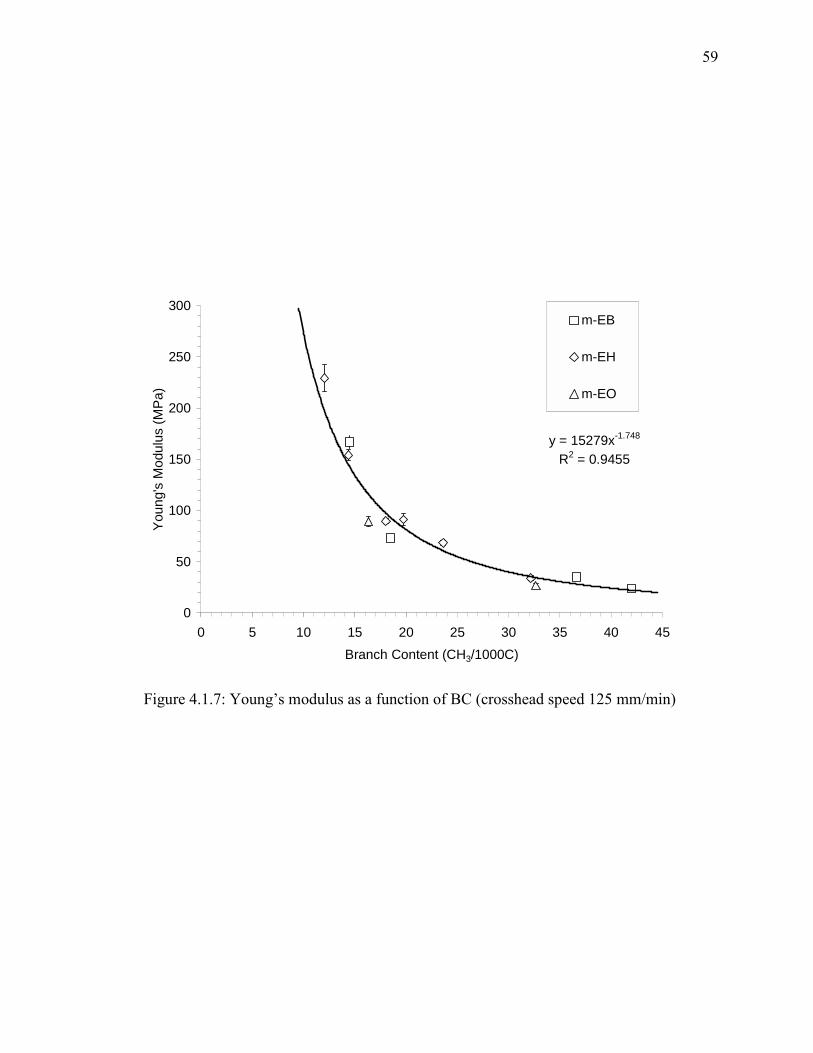
59
y = 15279x-1.748
R2 = 0.9455
0
50
100
150
200
250
300
0 5 10 15 20 25 30 35 40 45Branch Content (CH3/1000C)
You
ng's
Mod
ulus
(MP
a)
m-EB
m-EH
m-EO
Figure 4.1.7: Young’s modulus as a function of BC (crosshead speed 125 mm/min)
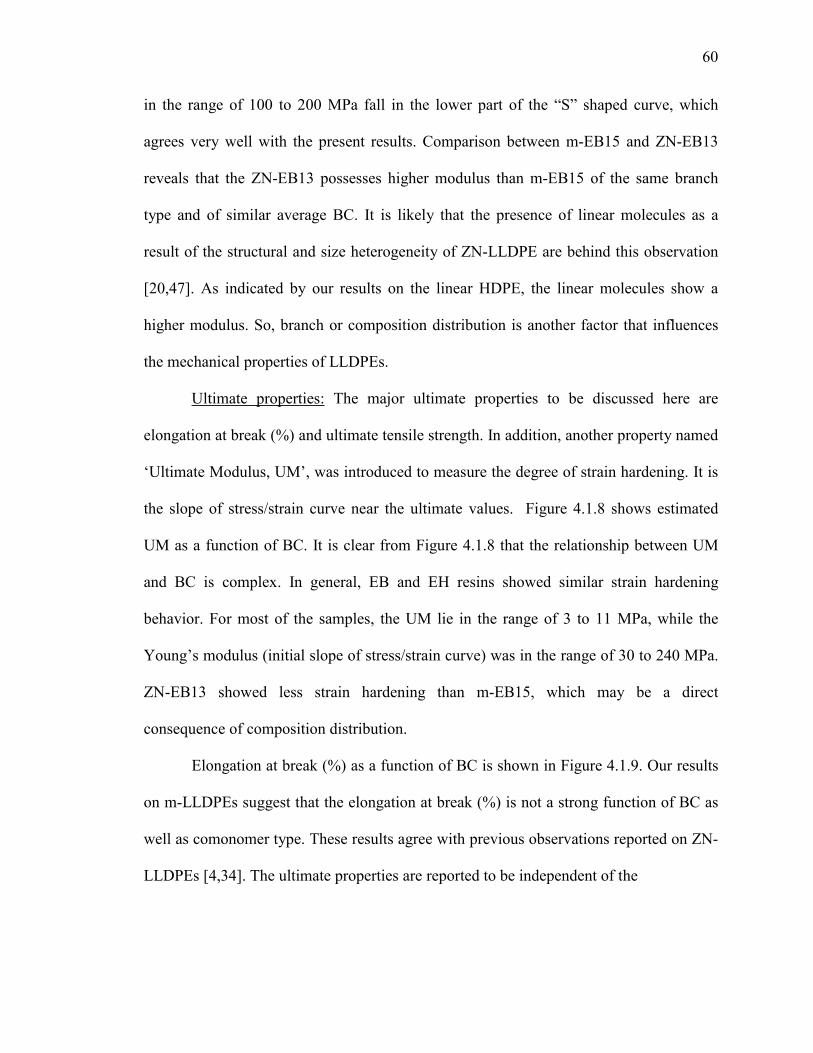
60
in the range of 100 to 200 MPa fall in the lower part of the “S” shaped curve, which
agrees very well with the present results. Comparison between m-EB15 and ZN-EB13
reveals that the ZN-EB13 possesses higher modulus than m-EB15 of the same branch
type and of similar average BC. It is likely that the presence of linear molecules as a
result of the structural and size heterogeneity of ZN-LLDPE are behind this observation
[20,47]. As indicated by our results on the linear HDPE, the linear molecules show a
higher modulus. So, branch or composition distribution is another factor that influences
the mechanical properties of LLDPEs.
Ultimate properties: The major ultimate properties to be discussed here are
elongation at break (%) and ultimate tensile strength. In addition, another property named
‘Ultimate Modulus, UM’, was introduced to measure the degree of strain hardening. It is
the slope of stress/strain curve near the ultimate values. Figure 4.1.8 shows estimated
UM as a function of BC. It is clear from Figure 4.1.8 that the relationship between UM
and BC is complex. In general, EB and EH resins showed similar strain hardening
behavior. For most of the samples, the UM lie in the range of 3 to 11 MPa, while the
Young’s modulus (initial slope of stress/strain curve) was in the range of 30 to 240 MPa.
ZN-EB13 showed less strain hardening than m-EB15, which may be a direct
consequence of composition distribution.
Elongation at break (%) as a function of BC is shown in Figure 4.1.9. Our results
on m-LLDPEs suggest that the elongation at break (%) is not a strong function of BC as
well as comonomer type. These results agree with previous observations reported on ZN-
LLDPEs [4,34]. The ultimate properties are reported to be independent of the
61
0
2
4
6
8
10
0 5 10 15 20 25 30 35 40 45Branch Content (CH3/1000C)
Ultim
ate
Mod
ulus
(MPa)
m-EBa)
0
2
4
6
8
10
0 5 10 15 20 25 30 35 40 45Branch Content (CH3/1000C)
Ultim
ate
Mod
ulus
(MPa
)
m-EHb)
0
2
4
6
8
10
0 5 10 15 20 25 30 35 40 45Branch Content (CH3/1000C)
Ultimate Mod
ulus
(MPa)
m-EOc)
Figure 4.1.8: Ultimate Modulus as a function of BC and branch type (crosshead Speed
125 mm/min).

62
0
200
400
600
800
1000
1200
1400
1600
0 5 10 15 20 25 30 35 40 45Branch Content (CH3/1000C)
Elon
gatio
n at
Bre
ak (%
)
m-EB
a)
0
200
400
600
800
1000
1200
1400
1600
0 5 10 15 20 25 30 35 40 45Branch Content (CH3/1000C)
Elon
gatio
n at
Bre
ak (%
)
m-EH
b)
0
200
400
600
800
1000
1200
1400
1600
0 5 10 15 20 25 30 35 40 45Branch Content (CH3/1000C)
Elong
ation
at B
reak
(%)
m-EO
c)
Figure 4.1.9: Elongation at break as function of BC and branch type (crosshead speed 125
mm/min).
63
morphological and structural variables and do not depend on the Mw, MWD or
comonomer concentration [4].
The influence of BC on the ultimate tensile strength is shown in Figure 4.1.10.
For EB, the BC showed no influence on ultimate tensile strength. For EH and EO resins,
the ultimate tensile strength showed a weak dependency on BC. In general, BC has weak
influence on the ultimate tensile strength. Our current results on the influence of BC of
m-LLDPEs on ultimate properties are in agreement with previous observations on ZN-
LLDPEs [4]. For the influence of comonomer type, ultimate tensile strength decreases
slightly with the increase in BC for EH resins. Also, m-EH resins exhibited higher stress
at break compared to EB. From Figures 4.1.9 and 4.1.10, ZN-LLDPEs displayed lower
elongation at break and tensile strength in comparison to m-LLDPEs. So, comonomer
type and content of m-LLDPEs have weak influence on the ultimate tensile strength and
strain at break. However, there exists a complex relationship with ultimate modulus
(strain hardening behavior).
Influence of Strain Rate
In general, higher strain rates are observed to increase elastic modulus, higher
yield stresses, lower elongation at break, and a better defined neck [2,48]. Figure 4.1.11
shows Young’s modulus as a function of crosshead speed for three resins of different
BCs. Figures 11a-c correspond to PEs with BC of 0 (linear HDPE), 15 (m-EB15) and 42
(m-EB42), respectively. An interesting phenomenon was observed. For all three resins, it
seems that there exists a critical value (near the crosshead speed of 125 mm/min) after
which Young’s modulus was not much influenced by the crosshead speed. It should be
noted that the location of the maximum is independent of BC.
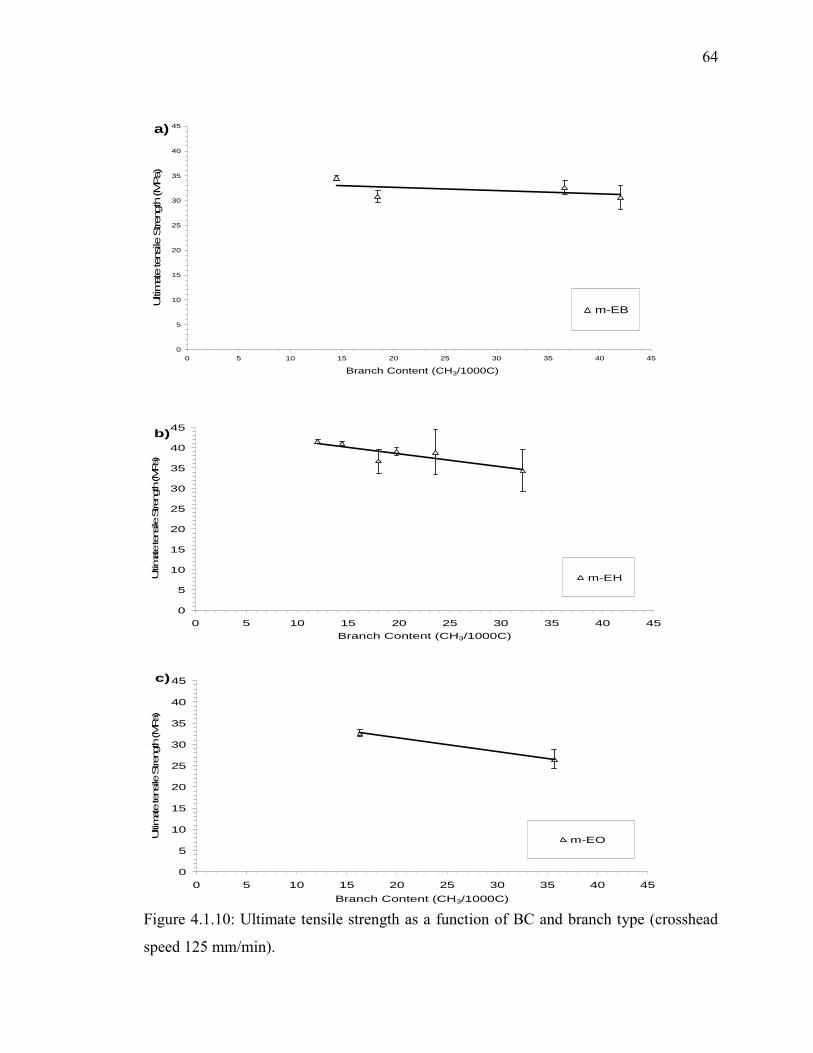
64
0
5
10
15
20
25
30
35
40
45
0 5 10 15 20 25 30 35 40 45
Branch Content (CH3/1000C)
Ultim
ate
tens
ile S
treng
th (M
Pa)
m-EB
a)
0
5
10
15
20
25
30
35
40
45
0 5 10 15 20 25 30 35 40 45Branch Content (CH3/1000C)
Ultimate tens
ile S
treng
th (M
Pa)
m-EH
b)
0
5
10
15
20
25
30
35
40
45
0 5 10 15 20 25 30 35 40 45Branch Content (CH3/1000C)
Ultim
ate
tens
ile S
treng
th (M
Pa)
m-EO
c)
Figure 4.1.10: Ultimate tensile strength as a function of BC and branch type (crosshead
speed 125 mm/min).
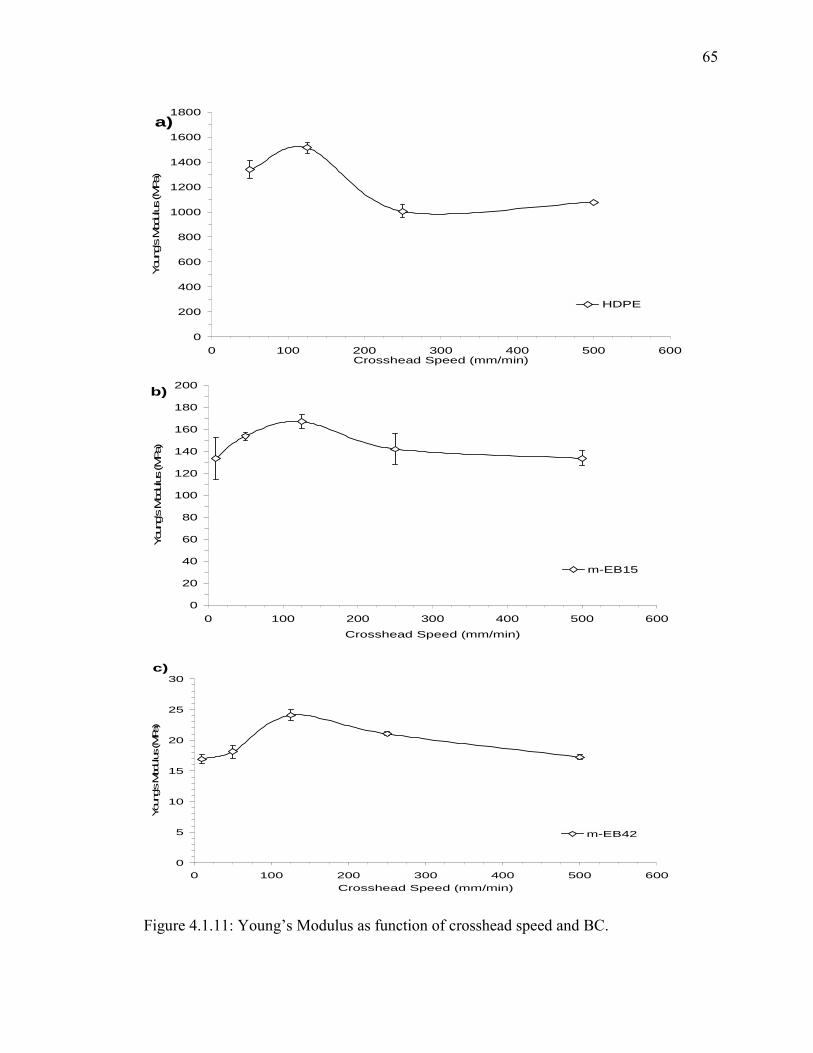
65
0
200
400
600
800
1000
1200
1400
1600
1800
0 100 200 300 400 500 600Crosshead Speed (mm/min)
You
ng's M
odulus
(MPa
)
HDPE
a)
0
20
40
60
80
100
120
140
160
180
200
0 100 200 300 400 500 600Crosshead Speed (mm/min)
Youn
g's M
odulus
(MPa
)
m-EB15
b)
0
5
10
15
20
25
30
0 100 200 300 400 500 600Crosshead Speed (mm/min)
You
ng's M
odulus
(MPa)
m-EB42
c)
Figure 4.1.11: Young’s Modulus as function of crosshead speed and BC.
66
For HDPE, Young’s modulus, yield stress and other parameters associated with the strain
response were reported to decrease rapidly with the increase in strain rate, when strain
rate is larger than a critical value [25]. Liu and Harrison [25] reported this critical value
for polyethylene near a strain rate 100 mm/min (see Figure 14 ref. 25) which is also close
to our critical value (125 mm/min). The normal time-temperature superposition principle
does not appear to hold in this case. It was suggested that this decrease in modulus and
yield stress is not caused by a temperature rise during strain. May be it is caused by void
formation and crazing, which are relatively uniform throughout the sample. They
provided optical microscopic picture of polypropylene (see Figure 7 ref. 25) to support
their assumption.
Elongation at break and ultimate tensile strength as a function of strain rate for m-
LLDPEs with different BC are shown in Figures 4.1.12 and 4.1.13, respectively. The
percent elongation at break of linear HDPE decreased immediately with the increase in
strain rate as shown in Figure 4.1.12. The ultimate tensile strength of HDPE was not
included as it was broken immediately after reaching its yield point. Again a critical
value is observed in Figures 4.1.12 and 4.1.13 (a) for m-EB15 at a strain rate of 125
mm/min. Termonia et al. [29] reported that for each Mw of melt-crystallized
monodispersed PE, there exists a very narrow temperature or elongation rate window
within which maximum drawability occurs. Though it was true for m-EB15 but it does
not hold for m-EB42, where a minimum was observed. Also, increasing the rate from 125
to 250 mm/min did not influence the ultimate tensile strength. These results show that
elongation at break and tensile strength for m-EB42 was almost independent of strain
rates (Figures 4.1.12 and 4.1.13b) over a wide range.

67
0
200
400
600
800
1000
1200
0.00 5.00 10.00 15.00 20.00 25.00
Strain Rate (s-1)
Elo
ngat
ion
at b
reak
(%)
1000
1200
1400
1600
Elo
ngat
ion
at b
reak
(%)
HDPE
m-EB15
m-EB42
Figure 4.1.12: Elongation at break (%) as a function of crosshead speed and BC.

68
0
5
10
15
20
25
30
35
40
45
0 100 200 300 400 500 600Crosshead Speed (mm/min)
Ulti
mat
e te
nsile
Stre
ngth
(MP
a)
m-EB15
a)
0
5
10
15
20
25
30
35
40
45
0 100 200 300 400 500 600Crosshead Speed (mm/min)
Ulti
mat
e te
nsile
Stre
ngth
(MP
a)
m-EB42
b)
Figure 4.1.13: Tensile Strength (MPa) as function of crosshead speed and BC.
69
However, at very high strain rates (500mm/min) ultimate properties drop very fast. This
may be due to the high amorphous portion in m-EB42 which enhances the possibility of
void formation and crazing [25].
Examination of Figures 4.1.11-4.1.13 for the combined influence of strain rate
and BC on the mechanical properties shows some interesting observations. The properties
obtained at very low (10 mm/min) rates were compared with those measured at very high
(500 mm/min) rates. The modulus of linear HDPE showed a decrease of ~30%.
However, the modulus of branched m-LLDPEs at 500 mm/min has almost retained the
same values obtained at 10 mm/min. Hence, the strain rate had no or little effect on the
modulus of m-LLDPEs regardless of their BC. However, it has influenced the modulus of
linear HDPE. It is likely that the high strains have lead to immediate destruction of
crystals. For large strain properties, such as elongation at break, the influence of strain
rate is BC-dependent. The linear HDPE has suffered the highest difference (>500 times)
between the low and high rates due to its high crystallinity. On the other hand, the
elongation at break of m-EB15 was reduced by ~50% and that of the highly branched m-
EB42 was lowered by ~15%. This is likely a result of the rubbery nature of highly
branched (more amorphous) m-LLDPEs. The elongation at break at high strain rates
(short process time; more solid-like behavior) was lower than that obtained at low rate
(long process time; liquid-like behavior). The overall behavior could be explained by a
Deborah number effect.
70
4.1.5. Conclusion
The following conclusions can be drawn from the above discussion:
1. Samples with low BC displayed an increase in melting temperature (Tm) without
any significant change in total crystallinity. An increase in Tm and a significant
increase in total crystallinity were observed for high BC samples. For high BC
samples the peaks were broad and multiple melting peaks were observed.
2. Young’s modulus is directly influenced by the BC and a power relationship (E =
15279BC-1.748) is obtained. Young’s modulus is independent of branch type. ZN-
EB13 show higher values compared to m-EB15, due to the contribution of the
linear components.
3. Yield stress becomes less distinct and broader with the increase of BC regardless
of comonomer type.
4. Ultimate properties of m-LLDPEs have shown weak dependency on BC as well
as comonomer type.
5. An interesting phenomenon is observed due to the influence of strain rate. There
exists a critical value (near the crosshead speed of 125 mm/min) after which
Young’s modulus was not much influenced by the crosshead speed. The position
of the maximum is independent of BC.
6. Elongation at break of linear HDPE decreased immediately with the increase in
strain rate.
7. For low BC m-LLDPE, a maximum value is observed both for elongation at break
and ultimate tensile strength at a crosshead speed of 125 mm/min. However, a
minimum in elongation at break was obtained for high BC m-LLDPE at a

71
crosshead speed of 125 mm/min. At low strain rates (<125 mm/min), a wide
range of ultimate tensile strength behavior was observed for high BC m-LLDPEs
a function of the crosshead speed. However, at higher strain rates ultimate tensile
strength of high BC m-LLDPEs drops very fast.
8. Modified Avrami equation can describe and fits very well the stress-induced
crystallization. The kinetics of the stress-induced crystallization can be fitted by
an order of 1-2 suggesting athermal nucleation.
Acknowledgement
Authors are grateful to King Abdul Aziz City for Science and Technology
(KASCT) for providing financial support for this research under research Grant # AT-22-
16. Authors also acknowledge the support of KFUPM.
4.1.6. References
[1] Miller BG, Nally GM, Murphy WR. ANTEC 2002, 2415.
[2] Peacock AJ. Handbook of Polyethylene: Structures, Properties, and Applications,
1st Ed., New York: Marcel Dekker, Inc.; 2000. p. 516
[3] Mandelkern L. Polym J 1985; 17:337.
[4] Popli R, Mandelkern L. J Polym Sci, Part B: Polym Phys 1987; 25:441.
[5] Kennedy MA, Peacock AJ, Mandelkern L. Macromolecules 1994; 27: 5297.
[6] Kontou E, Niaounakis M, Spathis G, Eur Polym J 2002 ; 38:2477.
[7] Graham JT, Alamo RG, Mandelkern L. J Polym Sci, Part B: Polym Phys
1997;35:213.
72
[8] Sacristan J, Benavente R, Perena JM, Perez E, Bello A, Rojas R, Quijada R,
Rabagliati FM. J Thermal Analysis and Calorimetry 1999;58: 559.
[9] Jordens K, Wilkes GL, Janzen J, Rohlfing DC, Welch MB. Polymer 2000; 41:
7175.
[10] Li Pi Shan C, Soares JBP, Pendelis A. Polymer 2002; 43: 767.
[11] Simanke AG, Galland GB, Baumhardt NR, Quijada R, Mauler RS. J Appl
Polym Sci 1999;74:1194.
[12] Kale L, Plumley T, Patel R, Redwine O, Jain P. J Plas Film and Sheeting
1995;12:27.
[13] Sehanobish K, Patel RM, Croft BA, Chum SP, Kao CI. J Appl Polym Sci
1994;51:887.
[14] Bensason S, Minick J, Moet A, Chum S, Hiltner A, Baer E. J Polym Sci, Part B:
Polym Phys 1996;34:1301.
[15] Alamo RG, Viers BD, Mandelkern L. Macromolecules 1993;26:5740.
[16] Alamo R, Domszy R, Mandelkern L. J Phys Chem 1984;88:6587.
[17] Minick J, Moel A, Hiltner A, Baer E, Chum SP. J Appl Polym Sci
1995;58:1371.
[18] Seguela R, Rietsch F. Polymer 1986;27:703.
[19] Xu X, Xu J, Feng L, Chen W. J Appl Polym Sci 2000;77:1709.
[20] Hussein IA. Polym Int 2004;53:1327; Polym. Int., submitted.
[21] Hussein IA, Hameed T. Macromol Mater Eng 2004;289:198.
[22] Peacock AJ, Mandelkern L. J Polym Sci, Part B: Polym Phys 1990;28:1917.

73
[23] Ward IM, Hadley DW. An Introduction to the Mechanical Properties of Solid
Polymers, 3rd Ed., John Wiley & Sons, New York, 2000. p. 237.
[24] Andrew JM, Ward IM. J Mater Sci 1970;5:411.
[25] Liu T, Harrison IR. Polymer 1988 ;29:233.
[26] Dasari A, Duncan SJ, Misra RDK. Mater Sci Tech 2002;18:1227.
[27] Dasari A, Misra RDK. Mater Sci Eng 2003;A358:356.
[28] Van der Wal A, Mulder JJ, Gaymans R.J. Polymer 1998;39:5477.
[29] Termonia Y, Allen SR, Smith P. Macromolecules 1988;21:3485.
[30] Brooks NW, Unwin AP, Duckett RA, Ward IM. J Polym Sci, Part B: Polym
Phys 1997;35:545.
[31] Hameed T, Hussein IA. Polymer 2002 ;43:6911.
[32] Mark HF, Bikales NM, Overberger CG, Menges G. Encyclopedia of Polymer
Science and Engineering, 2nd Ed., vol 6, John Wiely & Sons; 1986, p. 477.
[33] Sumita M, Miyasaka K, Ishikawa K. J Polym Sci, Part B: Polym Phys
1977;15:837.
[34] Seguela R., Rietsch F. Polymer 1986 ;27:532.
[35] Tanem BS, Stori A. Polymer 2001;42:5389.
[36] Wunderlich B, In: Turi EA, editor. Thermal characterization of Polymeric
Materials, vol. 1, New York: Academic Press; 1997, p. 252.
[37] Avrami M. J Chem Phys 1939;7:1103.
[38] Avrami M. J Chem Phys 1940;8:212.
[39] B. Wunderlich, Macromolecular Physics, Vol 2, New York: Academic Press;
1976, p. 147.

74
[40] Jeziorny A. Polymer 1978;19:1142.
[41] Tobin MC. J Polym Sci, Part B: Polym Phys 1974;12:399.
[42] Juana RD, Jauregui A, Calahora E, Cortazar M. Polymer 1996 ;37:3339.
[43] Herrero CH, Acosta JL. Polymer J 1994;26:786.
[44] Brooks NWJ, Duckett RA, Ward IM. Polymer 1999;40:7367.
[45] Flory PJ, Yoon DY. Nature 1978;272:226.
[46] Lucas JC, Failla MD, Smith FL, Mandelkern L. Polym Eng Sci 1995;35:1117.
[47] Usami T, Gotoh Y, Takayama S. Macromolecules 1986;19:2722.
[48] Freid JR. Polymer Science and Technology, vol 2, New Jersey: Prentice Hall,
Inc.; 2003,

75
4.2. Influence of Branch Content, Comonomer Type and Comonomer Composition Distribution on non-isothermal Crystallization of Metallocene LLDPEs
4.2.1. Abstract
The effect of branch content (BC), comonomer type and comonomer composition
distribution on the non-isothermal crystallization kinetics of metallocene LLDPEs was
studied. The crystallization kinetics parameters were measured by modulated differential
scanning calorimetry. It was found that BC causes a significant change in the
crystallization behavior. Crystallization peak temperature shifts to lower region as BC
increases. Also, the enthalpy of crystallization decreased as BC increased. The secondary
crystallization process strongly influenced the nonisothermal crystallization of all the
experimental resins. The Avrami exponent, n, was in the range of 1.5 to 2.5, suggesting a
rod-like growth. The comonomer type had almost no effect on the crystallization
kinetics. A strong effect of composition distribution was observed on the crystallization
peak and the enthalpy of crystallization. However, similar crystallization mechanism was
observed for both m-LLDPEs and ZN-LLDPE.
4.2.2. Introduction
Study of polymer crystallization kinetics is significant both from theoretical and
practical points of view (Evans, 1945; Ozawa, 1971; Jeziorny, 1978; Hay, 1982;
McHugh, 1986; Parasnis, 1999; Jayakannan, 1999; Sajkiewicz, 2001; Qui, 2003). The
relationship between structure and properties of polymer requires, among other factors,
analysis of melting and crystallization behavior. A number of studies were devoted to the

76
crystallization of ethylene α-olefin copolymers (Kao, 1986; Phillips, 1986; Nordmeier,
1990; Sutton, 1996; Wagner, 1999; Wagner, 2001).
The microstructure of polymers plays an important role in determining their
thermal properties. The influence of molecular weight (Mw), molecular weight
distribution (MWD), the branch type, the branch content (BC), and various crystallization
conditions on the crystallization of ethylene-α-olefin copolymers were investigated for
long time (Mandelkern, 1979; Strobl, 1983; Maderek, 1983; Alamo, 1984; Mandelkern,
1985; Usami, 1986; Alamo, 1989; Fatou, 1990; Alamo, 1993; Shanks, 2000; Zhang,
2001; Rabiej, 2004; Jiao, 2005). Most of the previous studies used ZN-LLDPEs. Due to
the random comonomer sequence distribution of conventional LLDPEs, separation of
effects of the individual factors on the crystallization is difficult. For example, for a given
short chain BC, the super molecular structure becomes more poorly developed with an
increase in the content of high Mw species (Mandelkern, 1979). On the other hand, with
the increase in BC the lamellae first become shorter, then segmented, and eventually
deteriorate into small crystallites (Bensason, 1996). So, previously systematic studies of
ethylene copolymers relied primarily on fractions of conventional heterogeneous
LLDPEs with respect to short chain branch content and/or Mw (Mandelkern, 1979;
Maderek, 1983; Usami, 1986; Voigt-Martin, 1986; Shanks, 2000).
m-LLDPEs are generally believed to have homogeneous composition distribution
and a narrow MWD. The lack of high and low Mw tails in these copolymers opens the
possibility of more controlled structure of m-LLDPEs. Some studies on the thermal
properties and molecular structure of m-LLDPEs were reported by different authors
(Bensason, 1996; Keating, 1999; Starck, 1999; Xu, 1999; Janimak, 1999; Razavi-Nouri,
77
2001; Fu, 2001; Wang, 2001; Zhang, 2001; Chiu, 2002; Starck, 2002; Teng, 2002). Most
of the authors focused on the influence of short chain branch distribution (Keating, 1999;
Starck, 1999; Xu, 1999; Wang, 2001; Zhang, 2001; Teng, 2002), on melting and
crystallization kinetics of a single polymer and its fractions using different fractionation
techniques (Fu, 2001; Razavi-Nouri, 2001; Chiu, 2002; Teng, 2002; Starck, 2002).
Bensason et al. (1996) classified homogeneous ethylene/1-octene copolymers based on
comonomer content and reported the melting phenomena, crystal morphology relating
their results to the tensile and dynamic mechanical properties. However, the influence of
BC and branch type on the crystallization kinetics of m-LLDPEs is yet to be studied.
Modulated Differential Scanning Calorimetry (MDSC) is a relatively new thermal
analysis technique, which applies a sinusoidal temperature oscillation (modulation) on a
linear heating/cooling rate in a conventional DSC and makes the total heat flow (such as
that from conventional DSC) to be separated into the heat capacity-related (reversible)
and kinetic (nonreversible) component (Gill 1993). This makes MDSC a very powerful
technique for the separation of exotherms (including crystallization and re-crystallization)
from glass transitions, reversible melting or other heat capacity-related events (Reading,
1993; Okazaki, 1997; Janimak, 1999; Yuan, 2000; HÖhne, 2001; Qui, 2003).
In the present work, 12 metallocene copolymers of ethylene and 1-butene (m-EB),
1-hexene (m-EH) and 1-octene (m-EO) were used. One metallocene high density
polyethylene (m-HDPE), one Ziegler-Natta HDPE (ZN-HDPE) and one Ziegler-Natta
ethylene 1-butene copolymer (ZN-EB) were selected for comparison purposes. The
objective was to study the relationship between BC and comonomer type and the non-
isothermal crystallization kinetics of m-LLDPEs by using MDSC. All of the resins had
78
similar Mw and MWD and BC ranges from 0-42 branches/1000C. ZN-EB of the same
average BC and Mw as m-EB were used to examine the influence of comonomer
composition distribution on the kinetics of nonisothermal crystallization.
4.2.3. Experimental
Materials and Sample Preparation
Twelve commercial samples of m-LLDPEs, one ZN-LLDPE, one conventional
high density polyethylene (ZN-HDPE) and one metallocene HDPE (m-HDPE) were used
in this study. The types of m-LLDPEs are as follows: four 1-butene, six 1-hexene and
two 1-octene ethylene copolymers. Ziegler-Natta 1-butene ethylene copolymer was
selected for comparison purposes. Both ZN-HDPE and m-HDPE were used as reference.
Weight average molecular weights (Mw) of all LLDPEs (Both metallocene and ZN) are
close to 100 kg/mol and the MWD of m-LLDPEs is ≅ 2. Table 4.2.1 provides selected
properties of the experimental LLDPEs. Density values were provided by ExxonMobil.
In addition, information about Mw and BC was determined (see Table 4.2.1) by gel
permeation chromatography (GPC) and 13C NMR, respectively. Details about the GPC
and NMR characterizations were given in a previous publication (Hameed 2002). Resins
were named according to their branch type and content. For example, a metallocene
ethylene-butene copolymer with a BC of 18.5 CH3/1000C is named as m-EB19.
Modulated Differential Scanning Calorimetry (MDSC)
Instrumentation: MDSC measurements were performed in a TA Q1000 instrument
equipped with a liquid nitrogen cooling system (LNCS). Nitrogen gas (purity 99.99%)
was used as a purge gas and the flow rate was 50 ml/min. Samples of 7.5-9.8 mg were
sliced and then compressed into non-hermetic aluminum pans. To minimize the thermal
79
lag between the sample and pan, samples with flat surface were used. An empty
aluminium pan was used as reference. Previous thermal effects were removed by heating
the samples to 140oC and holding at this temperature for 5 minutes. It was reported that
PEs, at these density ranges, are partially melted at room temperature. So, it is necessary
to choose subambient temperatures for complete evaluation of crystallization (Shanks
2000). The samples were cooled from 140 oC to 5 oC at a rate of 2oC/min. Standard
modulation conditions of oscillation period of 40 seconds and amplitude of 0.2oC were
used. First, the baseline was calibrated using empty crimped aluminum pans, and the
melting temperature and heat of fusion was calibrated using a high purity Indium
standard (156.6oC and 28.45 J/g). A sapphire disc was also used to check heat capacity
measurement in the range of interest. Calculations of absolute crystallinity were based on
a heat of fusion of 290 J/g for a polyethylene crystal (Mark 1986). Another set of
experiments were performed on m-HDPE, HDPE, m-EB15 and ZN-EB13. Conventional
DSC program was used at a rate of 5, 10 and 20 oC/ min to investigate the influence of
cooling rate on the crystallization.
Data analysis: Two approaches are presently available for data analysis. The first is the
reversing and non-reversing heat capacity approach (Gill 1993); the second is the
complex heat capacity, which can be separated into in-phase and out of phase signals
using the phase angle (Schawe 1995). However, the problem associated with complex
heat capacity approach is the lack of interpretation of the out of phase component that is
significantly influenced by the phase angle and thereby by heat transfer effects (Righetti
1999). So, in this work the results are presented and discussed using reversing and non-
reversing curves. Figure 4.2.1 is a typical MDSC thermogram of sample m-EB15

80
Table 4.2.1: Selected properties of the experimental LLDPEs.
Resin Density, g/cm3 Mw, kg/mol Mw/Mn BC *
m-HDPE N/A 122 2.34 0.0
ZN-HDPE 0.961 102 6.7 0.0
m-EB15 0.910 108 1.95 14.50
m-EB19 0.900 110 1.78 18.50
m-EB37 0.888 87 2.10 36.62
m-EB42 0.880 126 1.81 42.00
ZN-EB13 0.918 118 3.07 13.20
m-EH12 0.918 94 1.40 12.02
m-EH15 0.912 102 2.14 14.50
m-EH18 0.900 108 1.83 18.02
m-EH20 0.902 95 2.06 19.74
m-EH24 0.895 92 1.85 23.60
m-EH32 0.883 97 2.02 32.17
m-EO16 0.902 90 2.04 16.32
m-EO33 0.882 95 1.99 32.67

81
0.1W/g
Total heat flow curve
Reversing heat flow curve
Non-reversing heat flow curve
Hea
t Flo
w (W
/g)
10 20 30 40 50 60 70 80 90 100 110 120 130
Temperature (°C)
Exo Up
Figure 4.2.1: MDSC thermograms of m-EB15, the three curves from top to the bottom
are reversing hear flow, total heat flow and non-reversing heat flow, respectively.
82
showing total (middle curve), reversing (top curve) and non-reversing (bottom curve)
heat flow curves. Kinetics data were collected from the non-reversing curve and were
processed using Universal analysis software provided by TA Instruments, Inc.
Theoretical Background
Several analytical methods were developed to describe the nonisothermal
crystallization kinetics of polymers: (1) the modified Avrami analysis (Jeziorny, 1978;
Tobin, 1974; Rychly, 1993; Herrero, 1994); (2) the Ozawa analysis (Ozawa, 1971); (3)
Ziabicki analysis (Ziabicki, 1974; Ziabicki, 1967); and others (Liu, 1997; Caze, 1997;
Nakamura, 1973; Chan, 1994). In this article, the modified Avrami analysis (Jeziorny,
1978) is used to describe the nonisothermal crystallization kinetics of m-LLDPEs since
other approaches require collection of data at different cooling rates.
The well known Avrami equation is defined as follows [Avrami, 1939; 1940;
1941]:
)exp(1 ntt tkX −=− (4.2.1)
where n is the Avrami crystallization exponent dependent on the nucleation mechanism
and growth dimension, t is the time taken during the crystallization process, kt is the
growth rate constant, which is dependent on nucleation and crystal growth and Xt is
relative crystallinity of polymers (Wunderlich, 1976). Relative crystallinity, Xt is defined
as follows:
∫∫
∞= t
t c
t
t c
tdtdtdH
dtdtdHX
ο
ο
)/(
)/( (4.2.2)
where dHc/dt is the rate of heat evolution and to and t∞ are the times at which
crystallization starts and ends, respectively. Equation (1) was further modified to describe
83
non-isothermal crystallization (Jeziorny, 1978; Tobin, 1974). For non-isothermal
crystallization at a chosen cooling rate, relative crystallinity is a function of the
crystallization temperature (T). That is, Equation. 2 can be formulated as:
∫∫
∞= T
T c
T
T c
TdTdTdH
dTdTdHX
c
ο
ο
)/(
)/( (4.2.3)
where To denotes the initial crystallization temperature and Tc and T∞ represent the
crystallization temperature at time t and after the completion of the crystallization
process, respectively. Crystallization time, t, can be converted from crystallization
temperature, Tc, with the well known relationship for nonisothermal crystallization
processes that is strictly valid when the sample experiences the same thermal history by
the following equation (Ziabicki, 1967; Jeziorny, 1978).
R
TTt o −= (4.2.4)
where R is the cooling rate (oC/min). Using Equation. (1) in double-logarithmic form
tnkX tt lnln]]1ln[ln[ +=−− (4.2.5)
and plotting ln[-ln[1-Xt]] versus lnt, a straight line is obtained. From the slope and
intercept of the lines, one can determine the Avrami exponent n and the crystallization
rate kt. Although the physical meanings of kt and n cannot be related to the nonisothermal
case in a simple way, their use provides further insight into the kinetics of nonisothermal
crystallization. Because the rate of nonisothermal crystallization depends on the cooling
rate, the crystallization rate constant, kt, can be properly corrected to obtain the
corresponding rate constant at a unit cooling rate, kR [Jeziorny 1978]:
Rkk tR /lnln = (4.2.6)

84
4.2.4. Results and Discussion
Nonisothermal Crystallization Kinetics
Figures 4.2.2, 4.2.3, 4.2.4 and 4.2.5 are the MDSC nonreversing curves
(crystallization exotherm) for EB, EH and EO LLDPEs and HDPEs, respectively. These
crystallization exotherms are quite similar in appearance. Table 4.2.2 lists the initial
crystallization temperature, To, which is the temperature at the crossing point of the
tangents of the baseline and the higher temperature side of the exotherm, the peak
temperature (Tp), the enthalpy of crystallization (∆Hc) and absolute crystallinity of
nonisothermal crystallization of all the resins. To and Tp both show a strong shift to lower
temperature region as BC increases, indicating that BC influences the crystallization of
LLDPEs. This phenomenon is observed for all of the three comonomer types. Having
similar Mw and BC ZN-EB13 has shown high crystallization temperature than m-EB15.
A decrease in the crystallization enthalpy with increasing BC is also observed.
From the crystallization exotherm, raw data for the relative crystallinity as a
function of temperature can be calculated using Equation 4.2.3. A plot of relative
crystallinity (XT, relative crystallinity calculated based on temperature) versus
temperature is shown in Figure 4.2.6. Figure 4.2.6(a) and 4.2.6(b) represent EB and EH
LLDPE, respectively. EO-LLDPE along with ZN-HDPE and m-HDPE are shown in
Figure 4.2.6(c). All of the curves exhibit a common sigmoid like shape. This indicates
that the principal nonisothermal crystallization goes through two crystallization
processes. After the maximum in the heat flow curves (see Figures 4.2.2, 4.2.3, 4.2.4 and
4.2.5) has passed, a large fraction of crystallinity develops by slower, secondary kinetic
process. In Figure 4.2.6(b) sample m-EH20 did not show the same sharp increase

85
m-EB15
m-EB19m-EB37
m-EB42
ZN-EB13
-0.2
0.0
0.2
0.4
0.6
0.8
Non
rev
Hea
t Flo
w (W
/g)
0 10 20 30 40 50 60 70 80 90 100 110 120 130Temperature (°C)Exo Up
Figure 4.2.2: MDSC crystallization exotherms of EB m-LLDPEs and ZN-LLDPE.

86
m-EH24
m-EH20
m-EH18
m-EH15
m-EH12
m-EH32
-0.2
0.0
0.2
0.4
0.6
Non
rev
Hea
t Flo
w (W
/g)
0 10 20 30 40 50 60 70 80 90 100 110 120 130
Temperature (°C)Exo Up
Figure 4.2.3: MDSC crystallization exotherms of EH m-LLDPEs.

87
m-EO16
m-EO33
-0.1
0.0
0.1
0.2
0.3
Non
rev
Hea
t Flo
w (W
/g)
0 10 20 30 40 50 60 70 80 90 100 110 120 130
Temperature (°C)Exo Up
Figure 4.2.4: MDSC crystallization exotherms of EO m-LLDPEs.
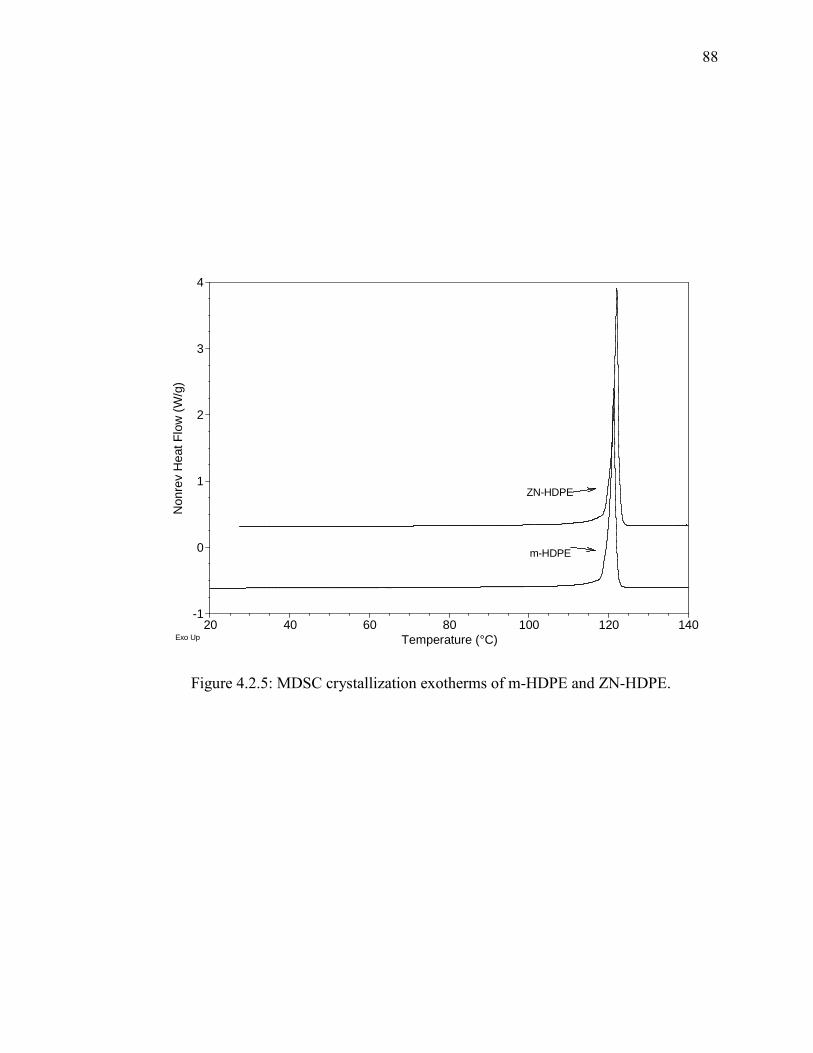
88
ZN-HDPE
m-HDPE
-1
0
1
2
3
4
Non
rev
Hea
t Flo
w (W
/g)
20 40 60 80 100 120 140Temperature (°C)Exo Up
Figure 4.2.5: MDSC crystallization exotherms of m-HDPE and ZN-HDPE.

89
Table 4.2.2: Thermodynamic Properties of Ethylene/α-Olefins Copolymers.
Resin To (oC)
Tp (oC)
∆Hc (J/g) Crystallinity (%)
ZN-HDPE 122.79 122.11 239.3 82.52
m-HDPE 122.05 121.34 198.6 68.48
m-EB15 94.04 91.93 86.51 29.83
m-EB19 80.22 76.22 65.25 22.5
m-EB37 58.06 56.40 43.78 15.10
m-EB42 53.88 52.04 36.19 12.48
ZN-EB13 117.77 115.16 89.83 30.98
m-EH12 108.70 106.26 99.33 34.25
m-EH15 102.95 99.56 74.12 25.56
m-EH18 87.95 85.09 69.83 24.08
m-EH20 99.43 92.95 66.78 23.03
m-EH24 78.93 75.82 63.66 21.95
m-EH32 64.95 61.86 45.23 15.60
m-EO16 89.86 86.88 71.48 24.65
m-EO33 67.62 63.80 40.38 13.92

90
0
0.1
0.2
0.3
0.4
0.5
0.6
0.7
0.8
0.9
1
0 10 20 30 40 50 60 70 80 90 100 110 120 130
Tc (oC)
XT
m-EB15m-EB19m-EB37m-EB42ZN-EB13
a)
0
0.1
0.2
0.3
0.4
0.5
0.6
0.7
0.8
0.9
1
0 10 20 30 40 50 60 70 80 90 100 110 120
Tc (OC)
XT
m-EH12m-EH15m-EH18m-EH20m-EH24m-EH32
b)
0
0.1
0.2
0.3
0.4
0.5
0.6
0.7
0.8
0.9
1
0 10 20 30 40 50 60 70 80 90 100 110 120 130
Tc (OC)
XT
m-EO16m-EO-33m-HDPEZN-HDPE
c)
Figure 4.2.6: Relative crystallinity as a function of crystallization temperature for EB,
EH, and EO LLDPE, ZN-HDPE and m-HDPE.
91
observed in other resins. The crystallization process was more gradual and the onset of
crystallization was closer to that of m-EH15. The exotherm of m-EH20 in Figure 4.2.3
also showed a broad distribution. This anomalous behavior of m-EH20 was further
investigated using Crystaf technique. In general, each sample first shows a dominant
sharp exothermic peak, followed by a shallow tail at lower temperatures. This result
confirms the previous report (Fu 2001) that metallocene short chain branched PEs
possess both inter- and intramolecular heterogeneity.
Once XT is obtained from Equation 4.2.3, its conversion into Xt (relative
crystallinity based on time) can be carried out by transforming the temperature axis to the
time axis using Equation 4.2.4, as shown in Figure 4.2.7. An ‘S’ shaped curve was
expected which is consistent for a nucleation and growth process. But in the present work
due to involvement of two consequent crystallization process with a large portion of
secondary crystallization mechanism, the curve was not a uniform ‘S’ shaped curve.
From these curves, the half-life of crystallization, t1/2, can be directly determined as the
time elapsed from the onset of crystallization to the point where the crystallization is half
completed. All the t1/2 values are summarized in Table 4.2.3.
Figures 4.2.8, 4.2.9 and 4.2.10 are the plots of ln(-ln(1-Xc)) versus lnt for EB, EH
and EO LLDPEs and HDPE, respectively. Notice here that in the fitting, only the relative
crystallinity data in the range 5-95% were used. From these plots it was found that almost
all of the curves are divided into two linear parts, which means that there exist two
crystallization processes. Similar observation was reported by Jiao et al. (2005) (see
Figure 6a of ref Jiao 2005) for LLDPE. Janimak and stevens (1999) have shown similar
curve in the Avrami plot (see Figure 5 of Janimak) for m-LLDPE. A line of best fit was

92
0
0.1
0.2
0.3
0.4
0.5
0.6
0.7
0.8
0.9
1
0 10 20 30 40 50 60
t (min)
X(t)
m-EB15m-EB19m-EB37m-EB42ZN-EB13
a)
0
0.1
0.2
0.3
0.4
0.5
0.6
0.7
0.8
0.9
1
-5 5 15 25 35 45 55
t (min)
X(t) m-EH12m-EH15m-EH18m-EH20m-EH24m-EH32
b)
0
0.1
0.2
0.3
0.4
0.5
0.6
0.7
0.8
0.9
1
0 10 20 30 40 50
t (min)
X(t)
m-EO16m-EO33m-HDPEZN-HDPE
c)
Figure 4.2.7: Relative crystallinity as a function of crystallization time for EB, EH, and
EO LLDPE, ZN-HDPE and m-HDPE.

93
Table 4.2.3: Avrami parameters for Ethylene/α-Olefins copolymers
Primary crystallization stage Secondary crystallization stage Resin
n1 kt1 kR1 R2 n2 kt2 kR2 R2
Half-life, t1/2, (min-1)
ZN-HDPE 2.70 1.781 1.334 0.989 0.47 1.206 1.098 0.978 0.69
m-HDPE 3.87 0.879 0.937 0.984 0.46 1.194 1.093 0.977 0.92
m-EB15 2.41 0.156 0.395 0.991 0.42 0.630 0.794 0.954 1.82
m-EB19 2.02 0.119 0.346 0.998 0.49 0.572 0.756 0.969 2.38
m-EB37 2.52 0.158 0.398 0.991 0.53 0.473 0.688 0.958 1.94
m-EB42 1.69 0.272 0.521 0.999 0.66 0.339 0.583 0.946 3
ZN-EB13 1.55 0.078 0.279 0.990 0.89 0.123 0.351 0.995 7.5
m-EH12 2.09 0.077 0.278 0.994 0.8 0.194 0.44 0.987 5.08
m-EH15 1.85 0.05 0.225 0.999 1 0.103 0.322 0.996 6.87
m-EH18 2.02 0.1 0.317 0.996 0.67 0.332 0.576 0.982 3.06
m-EH20 1.39 0.026 0.161 0.998 10.71
m-EH24 2.09 0.093 0.306 0.993 0.56 0.461 0.679 0.952 2.53
m-EH32 2.35 0.049 0.222 0.995 0.76 0.258 0.508 0.958 3.17
m-EO16 2.36 0.039 0.199 0.996 0.76 0.235 0.485 0.988 4
m-EO33 1.65 0.056 0.237 0.997 1.02 0.110 0.332 0.985 6.2
n = nucleation Index;
kt = Crystallization rate constant;
kR = Corrected crystallization rate constant for a specific cooling rate;
R = Coefficient of determination;

94
-3
-2
-1
0
1
-2 -1 0 1 2 3 4
lnt
ln[-l
n{1-
X(t)}
]
m-EB15m-EB19m-EB37m-EB42ZN-EB13
Figure 4.2.8: Avrami plots for the nonisothermal crystallization of EB LLDPEs.
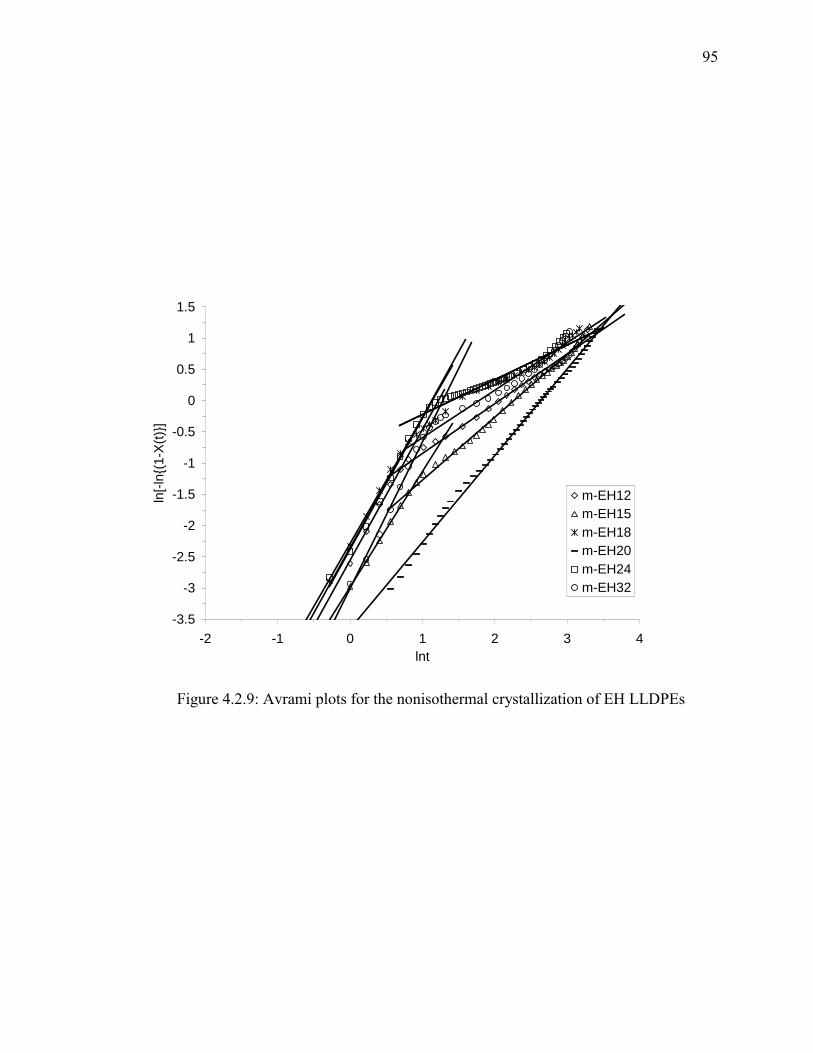
95
-3.5
-3
-2.5
-2
-1.5
-1
-0.5
0
0.5
1
1.5
-2 -1 0 1 2 3 4lnt
ln[-l
n{(1
-X(t)
}]
m-EH12m-EH15m-EH18m-EH20m-EH24m-EH32
Figure 4.2.9: Avrami plots for the nonisothermal crystallization of EH LLDPEs

96
-6
-5
-4
-3
-2
-1
0
1
2
3
-3 -2 -1 0 1 2 3 4lnt
ln[-l
n{(1
-X(t)
}]
m-EO16
m-EO33
m-HDPE
ZN-HDPE
Figure 4.2.10: Avrami plots for the nonisothermal crystallization of EO LLDPEs, ZN-
HDPE and m-HDPE.

97
presented using the least square method. It is more realistic to divide the curve into two
portions and fit the data rather than poorly fit the whole data with one line. In these plots,
two straight lines were observed for every BC (R2 > 0.98). The Avrami parameters, n and
k obtained from the slope and the intercept of the Avrami plots are summarized in Table
4.2.3. For primary crystallization process, n values were in the range of 1.7-2.5, 1.4-2.4,
and 1.6-2.4 for EB, EH and EO m-LLDPE, respectively. For ZN-EB13, ZN-HDPE and
m-HDPE, n values were 1.55, 2.7, and 3.87, respectively. It has been reported in the
literature that linear polyethylene exhibits spherulitic growth with the n values in the
range of 3-4 (Buchdahl, 1959), while branched polyethylene has rod like growth with n
values between 1 and 2 (Mandrek, 1983). In the secondary crystallization process n
values fall in the range of 0.4-0.7, 0.5-1.0 and 0.75-1.0 for EB, EH and EO LLDPE,
respectively. For ZN-EB13, ZN-HDPE and m-HDPE, n values were 0.89, 0.47 and 0.46,
respectively. The value of n is usually an integer between 1 and 4 for different
crystallization mechanisms and it is a fraction due to the secondary crystallization (Chen
2004). Wunderlich (1976) suggested that the mechanism of secondary crystallization is
either a crystal perfection process or a crystal thickness growth. But this was opposed by
Strobl et al (1983). They suggested that BC hinder longitudinal chain diffusion through
the crystals, thus suppresses crystal thickness growth. So, a very slow further lateral
extension of lamellae was suggested to occur during secondary crystallization. Storbi et
al. (1983) observations were confirmed by SAXS experiments.
For further investigation of the branch distribution crystaf technique was used.
The results were summarized in Table 4.2.4. It was observed that resins having BC
higher than 30 did not precipitate at room temperature regardless of branch types. Figure
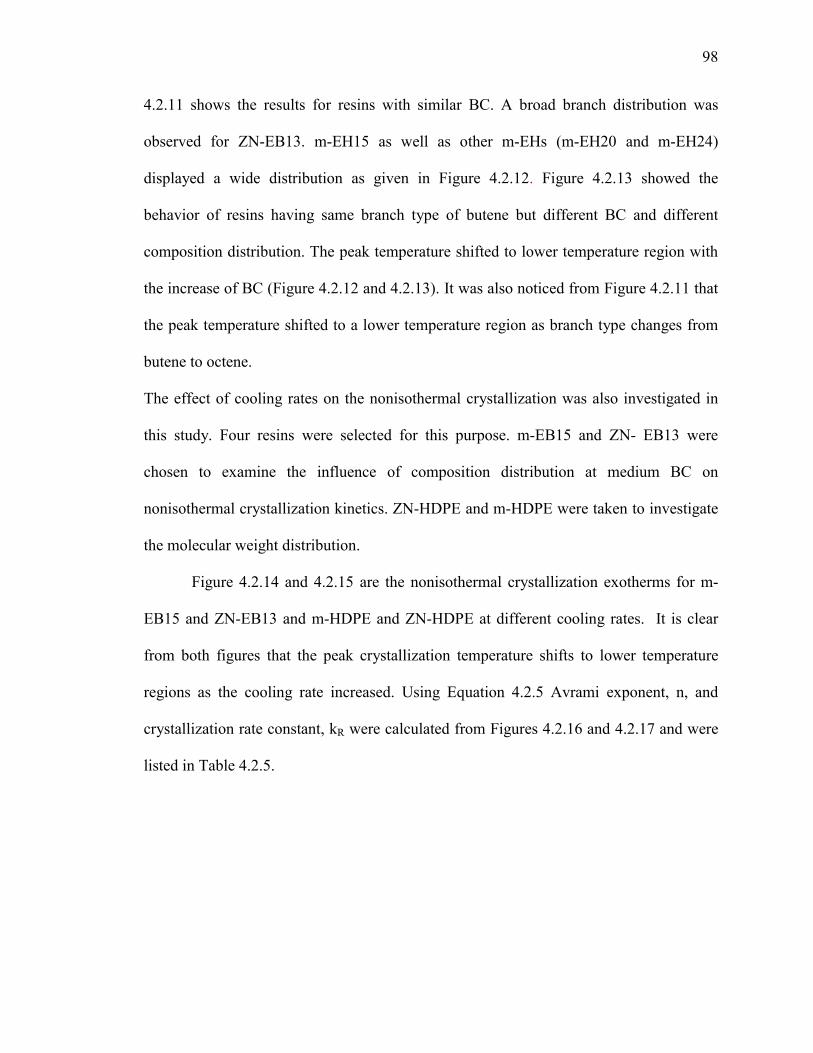
98
4.2.11 shows the results for resins with similar BC. A broad branch distribution was
observed for ZN-EB13. m-EH15 as well as other m-EHs (m-EH20 and m-EH24)
displayed a wide distribution as given in Figure 4.2.12. Figure 4.2.13 showed the
behavior of resins having same branch type of butene but different BC and different
composition distribution. The peak temperature shifted to lower temperature region with
the increase of BC (Figure 4.2.12 and 4.2.13). It was also noticed from Figure 4.2.11 that
the peak temperature shifted to a lower temperature region as branch type changes from
butene to octene.
The effect of cooling rates on the nonisothermal crystallization was also investigated in
this study. Four resins were selected for this purpose. m-EB15 and ZN- EB13 were
chosen to examine the influence of composition distribution at medium BC on
nonisothermal crystallization kinetics. ZN-HDPE and m-HDPE were taken to investigate
the molecular weight distribution.
Figure 4.2.14 and 4.2.15 are the nonisothermal crystallization exotherms for m-
EB15 and ZN-EB13 and m-HDPE and ZN-HDPE at different cooling rates. It is clear
from both figures that the peak crystallization temperature shifts to lower temperature
regions as the cooling rate increased. Using Equation 4.2.5 Avrami exponent, n, and
crystallization rate constant, kR were calculated from Figures 4.2.16 and 4.2.17 and were
listed in Table 4.2.5.

99
Table 4.2.4: Crystaf analysis of some selected resins
Resin Soluble Fraction (SF)
Standard Deviation (σ)
Peak Temperature (OC)
Short Chain Branching Distribution Index (SDBI)
m-EB15 0.1 3.6 57.3 7.2
m-EB19 1.7 3.9 43.0 8.1
m-EB37 97.6 - - -
ZN-EB13 9.3 15.1 79.6, 67.7 18.8
m-EH15 1.8 8.7 51.3 12.3
m-EH20 13.3 8.4 41.5 14.1
m-EH24 6.2 6.1 40.7 11.7
m-EH32 94.5 - - -
m-EO16 2.2 3.9 46.1 7.9
m-EO33 96.9 - - -

100
0
0.01
0.02
0.03
0.04
0.05
0.06
0.07
0.08
0.09
0.1
20 30 40 50 60 70 80 90Tª (ºC)
Conc:
m-EB15m-EH15m-EO16ZN-EB13
Figure 4.2.11: Resin concentrations as a function of branch type and composition
distribution.
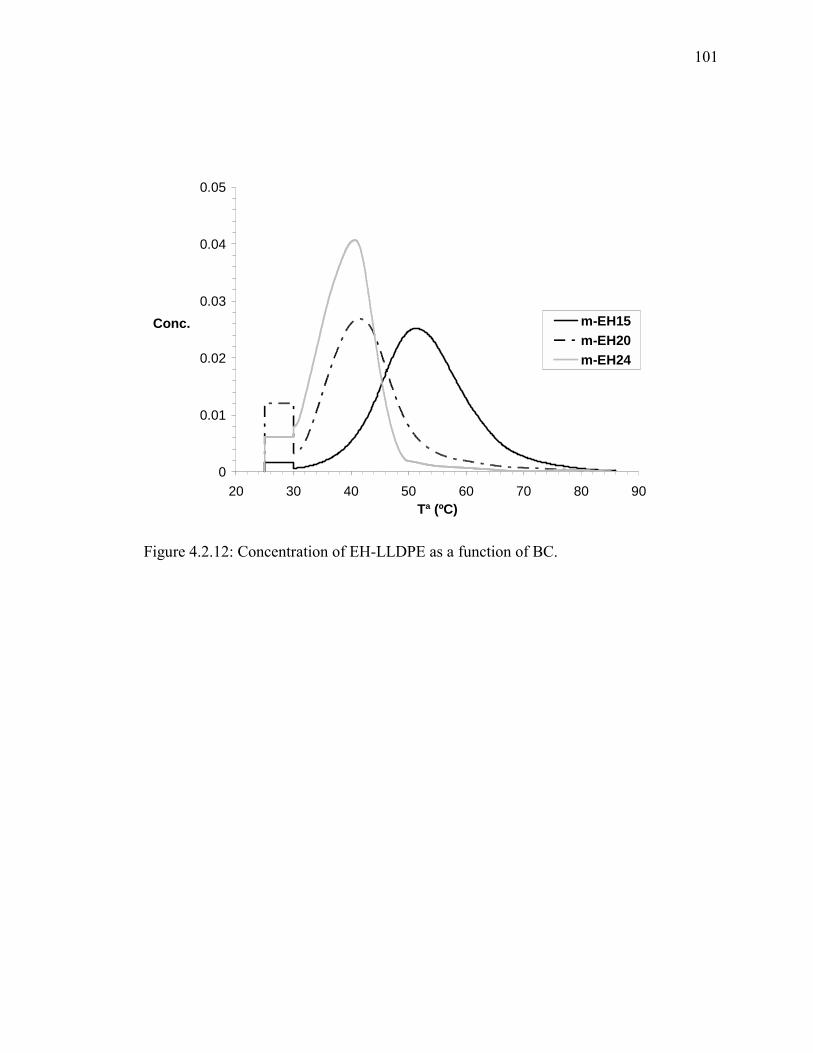
101
0
0.01
0.02
0.03
0.04
0.05
20 30 40 50 60 70 80 90Tª (ºC)
Conc. m-EH15m-EH20m-EH24
Figure 4.2.12: Concentration of EH-LLDPE as a function of BC.

102
0
0.01
0.02
0.03
0.04
0.05
0.06
0.07
0.08
0.09
0.1
20 30 40 50 60 70 80 90Tª (ºC)
Conc.
m-EB15m-EB19ZN-EB13
Figure 4.2.13: Concentration of EB-LLDPE as a function of BC and composition
distribution.

103
20ºC/min
10ºC/min
5ºC/min
2ºC/min
m-EB15a)
-2
0
2
4
6H
eat F
low
(W/g
)
20 30 40 50 60 70 80 90 100 110 120Temperature (°C)Exo Up
20ºC/min
10ºC/min
2ºC/min
5ºC/min
ZN-EB13b)
-1
0
1
2
3
4
Hea
t Flo
w (W
/g)
40 60 80 100 120Temperature (°C)Exo Up
Figure 4.2.14: Conventional DSC crystallization exotherms of a) m-EB15 and b) ZN-
EB13.
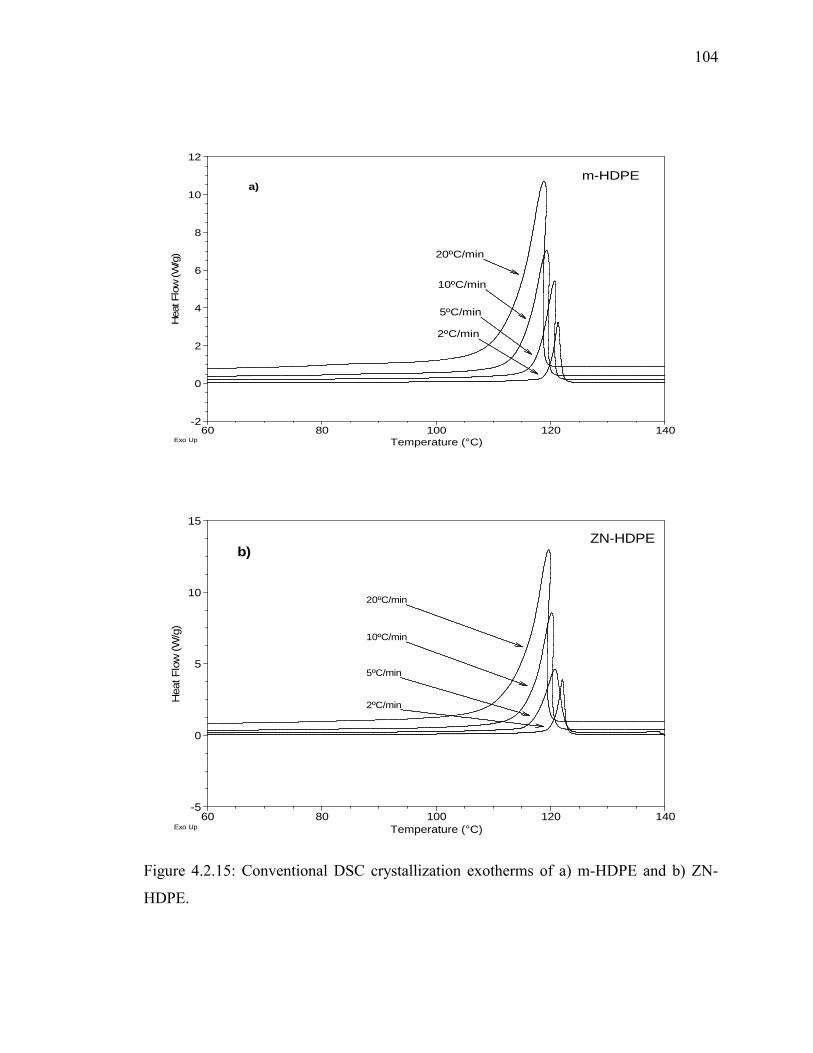
104
20ºC/min
10ºC/min
5ºC/min
2ºC/min
m-HDPEa)
-2
0
2
4
6
8
10
12
Hea
t Flo
w (W
/g)
60 80 100 120 140Temperature (°C)Exo Up
20ºC/min
10ºC/min
5ºC/min
2ºC/min
ZN-HDPEb)
-5
0
5
10
15
Hea
t Flo
w (W
/g)
60 80 100 120 140Temperature (°C)Exo Up
Figure 4.2.15: Conventional DSC crystallization exotherms of a) m-HDPE and b) ZN-
HDPE.
105
-5
-4
-3
-2
-1
0
1
2
0 0.5 1 1.5 2 2.5 3 3.5lnt
ln(-
ln(1
-Xt))
2ºC/min5ºC/min10ºC/min20ºC/min
a)
-2.5
-2
-1.5
-1
-0.5
0
0.5
1
1.5
2
0 1 2 3 4 5lnt
ln(-l
n(1-
Xt))
2ºC/min5ºC/min10ºC/min20ºC/min
b)
Figure 4.2.16: Avrami plots for the nonisothermal crystallization of a) m-EB15 and b)
ZN-EB13 at different cooling rates.
106
-3.5
-3
-2.5
-2
-1.5
-1
-0.5
0
0.5
1
1.5
2
0 0.5 1 1.5 2 2.5 3 3.5lnt
ln(-l
n(1-
X t))
2ºC/min5ºC/min10ºC/min20ºC/min
a)
-6
-5
-4
-3
-2
-1
0
1
2
3
0 0.5 1 1.5 2 2.5 3lnt
ln(-l
n(1-
Xt))
2ºC/min5ºC/min10ºC/min20ºC/min
b)
Figure 4.2.17: Avrami plots for the nonisothermal crystallization of a) m-HDPE and b)
ZN-HDPE at different cooling rates.
107
Table 4.2.5: Avrami parameters for m-EB15, ZN-EB13, m-HDPE and ZN-HDPE at
different cooling rates
Primary
Crystallization Stage
Secondary
Crystallization Stage
Resin Cooling
rates
(ºC/min) n1 kt1 kR1 n2 kt2 kR2
m-EB15 2 2.38 0.0565 0.2376 0.51 0.4456 0.6675
5 2.84 0.0220 0.1482 0.55 0.4009 0.6332
10 2.74 0.0282 0.1679 0.55 0.4234 0.6507
20 2.34 0.0443 0.2106 0.58 0.4050 0.6365
ZN-EB13 2 1.05 0.0757 0.2751
5 1.02 0.0888 0.2980
10 1.04 0.0854 0.2922
20 1.04 0.0953 0.3088
m-HDPE 2 6.50 0.0583 0.2416 0.57 0.8167 0.9037
5 1.72 0.4879 0.6985 0.52 0.7999 0.8944
10 1.87 0.1166 0.3415 0.70 0.5332 0.7302
20 0.88 0.5251 0.7246 0.60 0.6550 0.8093
ZN-HDPE 2 10.08 0.0004 0.0210 0.7 0.6983 0.8356
5 6.71 0.0006 0.0262 0.97 0.3703 0.6085
10 2.07 0.3476 0.5895 0.70 0.6579 0.8111
20 0.89 0.6203 0.7876 0.68 0.6678 0.8172
n = nucleation Index;
kt = Crystallization rate constant;
kR = Corrected crystallization rate constant for a specific cooling rate;

108
Acknowledgement
Authors are grateful to King Abdul Aziz City for Science and Technology
(KASCT) for providing financial support for this research under research Grant # AT-22-
16. Authors also acknowledge the support of KFUPM. We are also thankful to
ExxonMobil for providing PE samples.
4.2.5. Conclusion
The following conclusions can be drawn from the above discussions:
1. The nonisothermal crystallization of LLDPEs goes through two crystallization
processes. After passing the maximum heat flow in the exotherm, a large fraction of
crystallinity was developed by slower, secondary kinetic process.
2. The Avrami exponent, n, for primary crystallization was in the range of 1.5 to 2.5,
suggesting a rodlike growth. Usually, the Avrami exponent was expected to be an integer.
Due to the association of secondary crystallization fractional values were observed (Chen
2004). The variation of BC did not affect the crystallization mechanism significantly, as
seen by invariance of the Avrami exponent. However, HDPEs show a higher n value than
LLDPEs. The Avrami exponent was found to be 3.9 and 2.7 for m-HDPE and ZN-HDPE,
respectively. This suggests a three dimensional spherulitic growth process for linear
HDPE.
3. The peak crystallization temperature, Tc, and was strongly influenced by the BC.
It moved to a lower temperature region as BC increased. Comonomer type did not
influence Tc strongly. However, the comonomer composition distribution affects Tc
significantly. ZN-EB13 show higher Tc than m-EB15. Nevertheless, comonomer
composition distribution did not affect the Tc of HDPEs.

109
4. The enthalpy of crystallization, ∆Hc, was influenced by BC. Increase in BC has
lowered ∆Hc means absolute crystallinity. Comonomer type did not affect the ∆Hc but it
was slightly influenced by comonomer composition distribution. ZN-EB13 show higher
enthalpy of crystallization compared to m-EB15, even this was also observed in case of
linear HDPEs.
4.2.6. References
1. Miller BG, Nally GM, Murphy WR. ANTEC 2002, 2415.
2. Peacock AJ. Handbook of Polyethylene: Structures, Properties, and
Applications, 1st Ed., New York: Marcel Dekker, Inc.; 2000. p. 516
3. Evans UR. Trans Faraday Soc 1945,41,365
4. Ozawa T. Polymer 1971, 12, 150
5. Jeziorny A. Polymer 1978, 19, 1142
6. Jayakannan M., Ramakrishnan S., J Appl Polym Sci 1999, 74, 59
7. Sajkiewicz P., Carpaneto L., Wasiak A., Polymer 2001, 42, 5365
8. Qui Z., Ikehara T., Nishi T., Polymer 2003, 44, 5429
9. Hay JN, Mills PJ, Polymer 1982, 23, 1380
10. McHugh AJ, Burghardt WR, Holland DA, Polymer 1986, 27, 1585
11. Parasnis NC, Ramani K., J Thermal analysis and Calorimetry 1999, 55, 709
12. Kao YH, Phillips PJ, Polymer 1986, 27, 1669
13. Phillips PJ, Kao YH, Polymer 1986, 27, 1679
14. Nordmeier E, Lanver U., Lechner MD, Macromolecules 1990, 23, 1072
15. Sutton SJ, Vaughan AS, Bassett DC, 1996, 37 (25), 5735
16. Wagner J, Abu-Iqyas S., Monar K., Phillips PJ, Polymer 1999, 40, 4717

110
17. Wagner J, Phillips PJ, Polymer 2001, 42, 8999
18. Mandelkern L, Maxfield J, J Polym Sci, Part B: polym phy ed, 1979, 17, 1913
19. Strobl GR, Engelke T, Maderek E, Urban G, Polymer 1983, 24, 1585
20. Maderek E, Strobl GR, Colloid & polymer Sci, 1983, 261, 471
21. Alamo R, Domszy R, Mandelkern L, J Phys Chem, 1984, 88, 6587
22. Mandelkern L, Polym J, 1985, 17,(1), 337
23. Usami T, Gotoh Y, Takayama S, Macromolecules 1986, 19, 2722
24. Alamo RG, Mandelkern L, Macromolecules 1989, 22 (3), 1273
25. Fatou JG, Marco C, Mandelkern L, Polymer 1990, 31, 1685
26. Alamo RG, Viers BD, Manselkern L, Macromolecules 1993, 26, 5740
27. Shanks RA, Amarasinghe G, J thermal analysis and Calorimetry 2000, 59, 471
28. Wang C, Chu MC, Lin TL, Lai SM, Shih HH, Polymer 2001, 42, 1733
29. Zhang M, Lynch DT, Wanke SE, 2001, 42, 3067
30. Teng H, Shi Y, Jin X, J Polym Sci, Part B: Polym Phys 2002, 40, 2107
31. Rabiej S, Goderis B, Janicki J, Mathot VBF, Koch MHJ, Groeninckx G,
Reymaers H, Gelan J, Wlochowicz A, Polymer 2004, 45, 8761
32. Jiao C, Wang Z, Liang X, Hu Y, Polymer Testing 2005, 24, 71
33. Voigt-Martin IG, Alamo R, Mandelkern L, J Polym Sci, Part B: Polym Phys
1986, 24, 1283
34. Bensason S, Minick J., Moet A, Chum S, Hiltner A, Baer E, J Polym Sci, Part
B: Polym Phys 1996, 34, 1301
35. Keating MY, Lee IH J. macromol sci.- Phys 1999, B38(4), 379
36. Starck P, Lehmus P, Seppala V, Polym Eng Sci 1999, 39, 1444
111
37. Xu J, Xu X, Feng L Eur Polym J 1999, 36, 685
38. Janimak JJ, Stevens GC Termochimica acta 1999, 332, 125
39. Razavi-Nouri M, Hay JN Polymer 2001, 42, 8621
40. Fu Q, Chiu F, He T, Liu J, Hsieh ET Macromol Chem Phys 2001, 202, 927
41. Chiu F, Fu Q, Peng Y, Shih H J Polym Sci, Part B: Polym Phys 2002, 40, 325
42. Starck P, LÖfgren B Eur Polym J 2002,38, 97
43. Gill PS, Sauerbrunn SR, Reading M J Thermal analysis 1993,40, 931
44. Reading M, Elliott D, Hill VL J Thermal analysis 1993,40, 949
45. Qui ZB, Ikehara T, Nishi T Polymer 2003, 44, 3095
46. Okazaki I, Wunderlich B, Macromol Rapid Commun 1997, 18,313
47. Yuan ZH, Song R, Shen DY Polym Int 2000, 49, 1377
48. Hameed T, Hussein IA. Polymer 2002 ;43:6911.
49. Tobin MC. J Polym Sci, Part B: Polym Phys 1974;12:399.
50. Rychly J, Janigova I, Thermochimica acta 1993, 215, 211.
51. Herrero CH, Acosta JL. Polymer J 1994;26:786.
52. Ziabbicki A, Colloid Polym Sci 1974, 6, 252
53. Ziabbicki A, Appl Polym Symp 1967, 6, 1
54. Liu TX, Mo ZS, Wang SE, Zhang HF, Polym Eng Sci 1997, 37, 568
55. Caze C, Devaux E, Crespy A, Cavrot JP, Polymer 1997, 38, 497
56. Nakamura K, Katayama K, Amano T, J Appl Polym Sci 1973, 17, 1031.
57. Chan TW, Isayev AI, Polym Eng Sci 1994, 34, 461.
58. Avrami M, J Chem Phys 1939, 7, 1103
59. Avrami M, J Chem Phys 1940, 8, 212
112
60. Avrami M, J Chem Phys 1941, 9, 177
61. B. Wunderlich, Macromolecular Physics, vol 2, New York: Academic Press;
1976, p. 147.
62. Buchdahl R, Miller RL, Newman S, J Polym Sci 1959, 36, 215
63. Chen K, Tang X, Shen J, Zhou Y, Zhang B, Macromol Mat Eng, 2004, 289, 539

113
CHAPTER 5
CONCLUSIONS AND RECOMMENDATIONS
5.1. Conclusions
In this work, the influences of BC, branch type of metallocene LLDPEs on the
mechanical and thermal properties were studied. To examine the effect of composition
distribution some ZN-LLDPEs were selected (one from each branch type).
The influences of branch content (BC) and branch type on the mechanical
properties of m-LLDPEs were investigated by means of stress/strain experiment at room
temperature. The degree of crystallinity of these copolymers before and after the test was
determined by differential scanning calorimetry. It was found that samples with low BC
displayed an increase in Tm without any significant change in total crystallinity. An
increase in Tm and a significant increase in total crystallinity were observed for high BC
samples. The BC strongly affects the low strain properties such as Young’s modulus and
yield stress. A power series relationship is observed for Young’s modulus due to the
influence of BC. Yield stress becomes less distinct and broader with the increase of BC.
In this investigation it was also found that the ultimate properties of m-LLDPEs were not
strong function of BC. However, ZN-LLDPEs showed higher small strain properties but
lower ultimate properties than m-LLDPEs of similar Mw and BC. In comparison with
low BC resins, m-LLDPEs with high BC exhibit a stronger strain hardening during
stress/strain experiments. The strain hardening was modeled by a modified Avrami
114
equation, and the order of the mechanically induced crystal growth is in the range of 1-2
suggesting athermal nucleation. The branch type did not affect any of the mechanical
properties. In this study, the effect of strain rate was also investigated. The strain rate was
varied in the range 10-500 mm/min. For low BC m-LLDPEs, a very narrow strain rate
window was found, within which a maximum in modulus and ultimate properties were
observed. The location of the maximum was independent of BC. The influence of the
strain rate on the mechanical properties of m-LLDPEs is a strong function of BC. The
strain rate has no influence on the mechanical properties of highly branched m-LLDPEs.
The influence of branch content (BC), Comonomer type and composition
distribution on the crystallization kinetics of metallocene LLDPEs has been examined by
nonisothermal crystallization kinetics by using modulated differential scanning
Calorimetry. It was found that branch causes a significant change in the crystallization
behavior. Crystallization peak temperature shifts to lower region as BC increases. Also,
the enthalpy of crystallization decreased as BC increased. The secondary crystallization
process strongly influences the nonisothermal crystallization of all resins. The Avrami
exponent, n, was found close to 2 (between 1.5 and 2.5), suggesting a rodlike growth.
The influence of comonomer type has very small/ no effect on the crystallization kinetics.
A strong effect of composition distribution was found on crystallization peak and the
enthalpy of crystallization. However, similar crystallization mechanism was observed
both for m-LLDPEs and ZN-LLDPEs. The influence of cooling rate on the nonisothermal
crystallization kinetics was also examined in this study. m-EB15 and ZN-EB13 were
selected for similar BC but for different composition distribution. m-EB15 have shown
involvement of two crystallization processes, whereas ZN-EB13 have shown only a

115
broad single crystallization process. Avrami exponent, n for m-EB15 and ZN-EB13 were
found around 2.5 and 1 respectively. m-HDPE and ZN-HDPE have shown very narrow
exotherm, which indicates very fast crystallization processes. Secondary crystallization
process was observed for both of these resins. However, the proportion was not
significant as in m-EB15.
5.2. Recommendations for Future Work
Following are some of the recommendations for any future work to be done:
1. The effect of temperature on the tensile properties can be a useful extension to the
present work.
2. The effect of molecular weight on the mechanical properties of these m-LLDPEs
can be investigated.
3. MDSC can be used for investigating isothermal crystallization kinetics of m-
LLDPEs.

116
References
[1] Alamo R., Domszy R., Mandelkern L., (1984), “Thermodynamic and structural
properties of copolymers of ethylene”, Journal of Physical Chemistry, 88: 6587-
6595.
[2] Alamo R. G., Mandelkern L., (1989), “Thermodynamic and structural properties
of ethylene copolymers”, Macromolecules, 22 (3): 1273-1277.
[3] Alamo R. G., Viers B. D., Mandelkern L., (1993), “ Phase structure of random
ethylene copolymers: a study of counit content and molecular weight as
independent variables”, Macromolecules, 26 (21): 5740-5747.
[4] Amarasinghe G., Chen F., Genovese A., Shanks R. A., (2003), “Thermal Memory
of Polyethylenes Analyzed by Temperature Modulated Differential Scanning
Calorimetry”, Journal of Applied Polymer Science, 90: 681-692.
[5] Andrew J. M., Ward I.M., (1970), Journal of Material Science, 5: 411.
[6] Avrami M., (1939), Journal of Chemical Physics, 7 : 1103.
[7] Avrami M., (1940), Journal of Chemical Physics, 8 : 212.
[8] Avrami M., (1941), Journal of Chemical Physics, 9 : 177.
[9] Barrall E. M., Johnson J. F., (1970), “Differential scanning calorimetry theory
and applications ”, Technical Methods of Polymer Evaluation, 2: 1-39.
[10] Bensason S., Minick J., Moet A., Chum S., Hiltner A., Baer E., (1996),
“Classification of Homogeneous Ethylene-Octene Copolymers Based on
Comonomer Content”, Journal of Polymer Science: Part B: Polymer Physics
Edition, 34: 1301-1315.
[11] Billmeyer F. W., (1984), “Textbook of Polymer Science”, 3rd edition, John
Wiley & Sons.

117
[12] Brintzinger H. H., Fischer D., Mifflaupt R., Rieger B., Waymouth R., (1995),
“Stereospecific olefin polymerization with chiral metallocene catalysts”,
Angewandte Chemie, International Edition in English, 34(11): 1143-1170.
[13] Brooks N. W., Unwin A. P., Duckett R. A., Ward I. M., (1997), “Temperature
and Strain Rate Dependence of Yield Strain and Deformation Behavior in
Polyethylene”, Journal of Polymer Science: Part B: Polymer Physics Edition,
35: 545-552.
[14] Brooks N. W. J., Duckett R. A., Ward I.M., (1999), “Effects of crystallinity and
stress state on the yield strain of polyethylene”, Polymer, 40: 7367-7372.
[15] Buchdahl R., Miller R. L., Newman S., (1959), “Crystallization kinetics and
mechanical properties of polyethylene”, Journal of Polymer Science, 36: 215-
231.
[16] Caze C., Devaux E., Crespy A., Cavrot J. P., (1997), “ A new method to
determine the Avrami exponent by DSC studies of non-isothermal
crystallization from the molten state”, Polymer, 38 : 497-502
[17] Chan T. W., Isayev A. I., (1994), “Quiescent polymer crystallization: modeling
and measurements”, Polymer Engineering and Science, 34: 461-471.
[18] Chen K., Tang X., Shen J., Zhou Y., Zhang B., (2004), “Non-Isothermal
Crystallization Behavior of Poly(trimethylene terephthalate) Synthesized with
Different Catalysts”, Macromolecular Materials and Engineering, 289: 539-547
[19] Chiu F., Fu Q., Peng Y., Shih H., (2002), “Crystallization kinetics and Melting
Behavior of Metallocene Short-Chain Branched Polyethylene Fractions”,
Journal of Polymer Science: Part B: Polymer Physics Edition, 40: 325-337.

118
[20] Dasari A., Duncan S. J., Misra R. D. K., (2002), “Atomic force microscopy of
scratch damage in polypropylene”, Materials Science and Technology, 18: 1227-
1234.
[21] Dasari A., Misra R. D. K., (2003), “On the strain rate sensitivity of high density
polyethylene and polypropylenes”, Materials Science and Engineering, A358:
356-371.
[22] Evans U. R., (1945), “Laws of expanding circles and spheres in relation to the
lateral growth of surface films and the grain size of metals” Transactions of the
Faraday Society, 41: 365-374.
[23] Fatou J. G., Marco C., Mandelkern L., (1990), “The influence of molecular
weight on the regime crystallization of linear polyethylene”, Polymer, 31: 1685-
1693
[24] Flory P. J., Yoon D. Y., (1978), Nature, 272: 226.
[25] Freid J. R., (2003), Polymer Science and Technology, vol 2, New Jersey:
Prentice Hall, Inc.
[26] Fu Q., Chiu F., He T., Liu J., Hsieh E. T., (2001), “Molecular Heterogeneity of
Metallocene Short-Chain Branched Polyethylenes and Their Fractions ”,
Macromolecular Chemistry and Physics, 202: 927-932.
[27] Gill P. S., Sauerbrunn S. R., Reading M., (1993), “Modulated Differential
scanning calorimetry”, Journal of Thermal analysis,40: 931-939.
[28] Graham J.T., Alamo R.G., Mandelkern L., (1997), “The Effect of Molecular
Weight and Crystallite Structure on Yielding in Ethylene Copolymers”, Journal
of Polymer Science: Part B: Polymer Physics Edition, 35:213-223.

119
[29] Gupta V.K., (1997), “Handbook of Engineering Polymeric Materials”, Marcel
Dekker, Inc.
[30] Hameed T., Hussein I. A., (2002), “Rheological study of the influence of Mw
and comonomer type on the miscibility of m-LLDPE and LDPE blends”,
Polymer, 43: 6911-6929.
[31] Hameed T., Hussein I. A., (2004), “Effect of short chain branching of LDPE on
its miscibility with linear HDPE”, Macromolecular Materials and Engineering,
289(2): 198-203.
[32] Hay J. N., Mills P. J., (1982), “The use of differential scanning calorimetry to
study polymer crystallization kinetics”, Polymer, 23: 1380-1384.
[33] Herrero CH, Acosta JL. Polymer J 1994; 26:786.
[34] Horton A. D., (1994), “Metallocene catalysis: polymers by design?”, Trends in
Polymer Science, 2(5): 158-166.
[35] Hosoda S., Uemura A., (1992), “Effect of the structural distribution on the
mechanical properties of linear low-density polyethylenes” Polymer Journal, 24
(9): 939-949.
[36] Hussein I. A., (2004), “Implications of melt compatibility/incompatibility on
thermal and mechanical properties of metallocene and Ziegler-Natta linear low
density polyethylene (LLDPE) blends with high density polyethylene (HDPE):
Influence of composition distribution and branch content of LLDPE”, Polymer
International, 53: 1327-1335.
[37] Janimak J. J., Stevens G. C., (1999), “Structure correlated properties of
metallocene catalyzed polyethylenes by modulated temperature differential
scanning calorimetry”, Termochimica Acta, 332: 125-142.

120
[38] Jayakannan M., Ramakrishnan S., (1999), “Effect of Branching on the
Crystallization kinetics of Poly(ethylene terephthalate), Journal of Applied
Polymer Science, 74: 59-66.
[39] Jeziorny A., (1978), “Parameters Characterizing the kinetics of the non-
isothermal crystallization of poly(ethylene terephthalate) determined by d.s.c.”,
Polymer, 19: 1142-1144.
[40] Jiao C., Wang Z., Liang X., Hu Y., (2005), “Non-isothermal crystallization
kinetics of silane crosslinked polyethylene”, Polymer Testing, 24: 71-80.
[41] Jordens K., Wilkes G.L., Janzen J., Rohlfing D.C., Welch M.B., (2000), “The
influence of molecular weight and thermal history on the thermal, rheological and
mechanical properties of metallocene-catalyzed linear polyethylenes”, Polymer,
41: 7175-7192.
[42] Juana R. D., Jauregui A., Calahora E., Cortazar M., (1996), « Non-isothermal
crystallization of poly(hydroxy ether of bisphenol-A)/poly(ε-caprolactone),
PH/PCL blends, Polymer, 37: 3339-3345.
[43] Kale L., Plumley T., Patel R., Redwine O., Jain P., (1995), Journal of Plastic
Film and Sheeting, 12: 27.
[44] Kaminsky W., Miri M., Sinn H., Woldt R., (1983),
“Bis(cyclopentadienyl)zirconium compounds and aluminoxane as Ziegler
catalysts for the polymerization and copolymerization of olefins”,
Macromolecular Chemistry Rapid Communication, 4(6): 417-421.
[45] Kaminsky W., Schauwienold A. M., Freidanck F., (1996), “Photoinduced
rac/meso interconversions of bridged bis(indenyl) zirconium dichlorides”, Journal
of.Molecular. Catalysis A: Chemical, 112: 37-42.

121
[46] Kaminsky W., (1996), “New polymers by metallocene catalysis”,
Macromolecular Chemistry and Physics, 197(12): 3907-3945.
[47] Kaminsky W., (1998) “New polyolefins by metallocene catalysts”, Pure
&Applied Chemistry, 70: 1229-1233
[48] Kao Y. H., Phillips P. J., (1986), “Crystallinity in chemically crosslinked low
density polyethylenes: 1. Structural and fusion studies”, Polymer 27: 1669-
1678.
[49] Keating M. Y., Lee I H. (1999), “Glass Transition, Crystallinity, Resin
Stiffness, and Branch Distribution in Metallocene and Ziegler-Natta Ethylene 1-
Olefins”, Journal of Macromolecular Science- Physics, B38 (4): 379-401.
[50] Kennedy M. A., Peacock A. J., Mandelkern L., (1994), “Tensile Properties of
Crystalline Polymers: Linear Polyethylene”, Macromolecules, 27: 5297-5310.
[51] Kontou E., Niaounakis M., Spathis G., (2002), “Thermomechanical behavior of
metallocene ethylene-α-olefin copolymers”, European Polymer Journal, 38:
2477-2487.
[52] Kontou E., Spathis G., (2003), “Interrelation between long-term viscoelasticity
and viscoelastic responses of semicrystalline polymers”, Journal of Applied
Polymer Science, 88: 1942-1950.
[53] Li Pi Shan C, Soares J.B.P., Pendelis A., (2002), “Mechanical properties of
ethylene/1-hexene copolymers with tailored short chain branching distributions”,
Polymer, 43: 767-773.
[54] Liu T and Harrison I.R., (1988), “Effect of draw rate on the stress-strain
behaviour of polymers” Polymer, 29: 233-239.
122
[55] Liu T. X., Mo Z. S., Wang S. E., Zhang H. F., (1997), “Nonisothermal melt and
cold crystallization kinetics of poly(aryl ether ether ketone ketone)”, Polymer
Engineering and Science, 37(3): 568-575.
[56] Lovisi H., Tavares M. I. B., Silva N. M., Menezes S. M. C., Maria L. C. S.,
Coutinho F. M. B., (2001), “Influence of comonomer content and short branch
length on the physical properties of metallocene propylene copolymers”,
Polymer, 42: 9791-9799.
[57] Lucas J. C., Failla M. D., Smith F. L., Mandelkern L., (1995), “The double
Yield in the Tensile Deformation of the Polyethylene”, Polymer Engineering and
Science, 35: 1117-1123.
[58] Maderek E., Strobl G. R., (1983), “Crystallization and melting of fractions of
branched polyethylene”, Colloid & polymer Science, 261: 471-476
[59] Mandelkern L., Maxfield J., (1979), “Morphology and Properties of Low-
Density (Branched) Polyethylene”, Journal of Polymer Science: Part B:
Polymer Physics Edition, 17: 1913-1927.
[60] Mandelkern L., (1985), “The Relation between Structure and Properties of
Crystalline Polymers”, Polymer Journal, 17: 337-350.
[61] Mark H. F., Bikales N. M., Overberger C. G., Menges G., (1986), Encyclopedia
of Polymer Science and Engineering, 2nd Ed., vol 6, John Wiely & Sons.
[62] Mauler R. S., Simanke A. G., Galland G. B., Freitas L. L., Jornada J. A. H.,
Quijada R., (2001), “Dynamic-Mechanical Properties of Ethylene/α-Olefin
Copolymers Prepared by a Metallocene Catalyst”, Macromolecular Chemistry
and Physics, 202: 172-179.
[63] McHugh A. J., Burghardt W. R., Holland D. A., (1986), “The kinetics and
morphology of polyethylene solution crystallization”, Polymer, 27: 1585-1594.

123
[64] Miller B. G., Nally G. M., Murphy W. R., (2002), “ The effect of Extrution
Processing Conditions on the Thermal and Mechanical Performance of
Extrusion Cast Metallocene Polyethylene Films”, Annual Technical
Conference, 2415-2419.
[65] Minick J., Moel A., Hiltner A., Baer E., Chum S. P., (1995), “Crystallization of
Very Low Density Copolymers of Ethylene with α-Olefins”, Journal of Applied
Polymer Science, 58: 1371-1384.
[66] Nakamura K., Katayama K., Amano T., (1973), “Nonisothermal crystallization
of polymers. II. Consideration of the isokinetic condition” Journal of Applied
Polymer Science, 17(4): 1031-1041.
[67] Nitta K. H., Tanaka A., (2001), “Dynamic mechanical properties of metallocene
catalyzed linear polyethylenes”, Polymer, 42: 1219-1226.
[68] Nordmeier E., Lanver U., Lechner M. D., (1990), “The Molecular Structure of
Low-Density Polyethylene. 1. Long-Chain Branching and Solution Properties”,
Macromolecules, 23: 1072-1076.
[69] Okazaki I., Wunderlich B., (1997), “Reversible local melting in polymer
crystals”, Macromolecular Rapid Communications, 18: 313-318.
[70] Ozawa T., (1971), “Kinetics of non-isothermal crystallization”, Polymer, 12:
150-158.
[71] Parasnis N. C., Ramani K., (1999), “Non-isothermal crystallization of
UHMWPE”, Journal of Thermal analysis and Calorimetry, 55: 709-719.
[72] Peacock A.J., Mandelkern L., (1990), “The Mechanical Properties of Random
Copolymers of Ethylene: Force-Elongation Relations”, Journal of Polymer
Science: Part B: Polymer Physics Edition, 28: 1917-1941.

124
[73] Peacock A. J., (2000), “Handbook of Polyethylene: Structures, Properties, and
Applications”, 1st Ed., New York: Marcel Dekker, Inc.
[74] Phillips P. J., Kao Y. H., (1986), “Crystallinity in chemically crosslinked low
density polyethylenes: 2. Crystallization kinetics”, Polymer, 27: 1679-1686
[75] Popli R., Mandelkern L., (1987), “Influence of Structural and Morphological
Factors on the Mechanical Properties of the Polyethylenes”, Journal of Polymer
Science: Part B: Polymer Physics Edition, 25:441-483.
[76] Qui Z., Ikehara T., Nishi T., (2003), “Crystallization behaviour of biodegradable
poly(ethylene succinate) from the amorphous state”, Polymer, 44 : 5429-5437.
[77] Qui Z., Ikehara T., Nishi T., (2003), “Melting behaviour of poly(butylene
succinate) in miscible blends with poly(ethylene oxide) ” Polymer, 44 : 3095-
3099.
[78] Rabiej S., Goderis B., Janicki J., Mathot V. B. F., Koch M. H.J., Groeninckx G.,
Reymaers H., Gelan J., Wlochowicz A., (2004), “Characterization of the dual
crystal polulation in an isothermally crystallizaed homogeneous ethylene-1-
octene copolymer ”, Polymer, 45: 8761-8778.
[79] Razavi-Nouri M., Hay J. N., (2001), “Thermal and dynamic mechanical
properties of metallocene polyethylene”, Polymer, 42: 8621-8627.
[80] Reading M., Elliott D., Hill V. L., (1993), “A new approach to the calorimetric
investigation of physical and chemical transitions”, Journal of Thermal analysis,
40: 949-955.

125
[81] Rychly J., Janigova I., (1993), “Avrami equation and nonisothermal
crystallization of polyethylene investigated by DSC”, Thermochimica Acta,
215: 211-218.
[82] Sacristan J., Benavente R., Perena J. M., Perez E., Bello A., Rojas R., Quijada
R., Rabagliati F. M., (1999), “ Thermal and Mechanical Properties of
Polyethylene Synthesized with Metallocene Catalysts”, Journal of Thermal
Analysis and Calorimetry, 58: 559-568.
[83] Sajkiewicz P., Carpaneto L., Wasiak A., (2001), “Application of the Ozawa
model to non-isothermal crystallization of poly(ethylene terephthalate)”
Polymer, 42: 5365-5370.
[84] Seguela R., Rietsch F., (1986), “Tensile drawing behavior of ethylene/α-olefin
copolymers: influence of the co-unit concentration”, Polymer, 27: 703-708.
[85] Seguela R., Rietsch F., (1986), “Tensile drawing behavior of a linear low-
density polyethylene: Change in Physical and mechanical properties”, Polymer,
27: 532-536.
[86] Sehanobish K., Patel R. M., Croft B. A., Chum S. P., Kao C. I., (1994), “Effect
of Chain Microstructure on Modulus of Ethylene-α-Olefin Copolymers”, Journal
of Applied Polymer Science, 51: 887-894.
[87] Shanks R. A., Amarasinghe G., (2000), “Comonomer distribution in
polyethylenes analyzed by DSC after thermal fractionation”, Journal of
Thermal Analysis and Calorimetry, 59: 471-482.
[88] Simanke A. G., Galland G. B., Baumhardt N. R., Quijada R., Mauler R. S.,
(1999), “Influence of the Type and the Comonomer Contents on the Mechanical

126
Behavior of Ethylene/α-Olefin Copolymers”, Journal of Applied Polymer
Science, 74: 1194-1200.
[89] Sinn H., Kaminsky W., Adv. Organomet Chem 18, 99, 1980.
[90] Slade Jr. P. E. & Jenkins L. T., (1970), “Techniques and methods of Polymer
Evaluation”, Vol 02, Marcel Dekker, Inc. New York.
[91] Soares J. B. P., Shan C. L. P., Penlidis A., (2002 ), “Mechanical properties of
ethylene/1-hexene copolymers with tailored short chain branching
distributions.”, Polymer, 43: 767-773.
[92] Starck P., (1997), “Dynamic Mechanical Thermal Analysis on Ziegler-Natta
and Metallocene type ethylene copolymers, European Polymer Journal, 33:
339-348.
[93] Starck P., Lehmus P., Seppala V., (1999), “Thermal Characterization of
Ethylene Polymers Prepared with Metallocene Catalysts”, Polymer Engineering
and Science, 39: 1444-11454.
[94] Starck P., LÖfgren B., (2002), „Thermal properties of ethylene/long chain α-
olefin copolymers produced by metallocenes“, European Polymer Journal, 38:
97-107.
[95] Stevens J. C., (1996), “Constrained geometry and other single site metallocene
polyolefin catalysts: A revolution in olefin polymerization”, Studies in Surface
Science & Catalysis, 101: 11-20.
[96] Strobl G. R., Engelke T., Maderek E., Urban G., (1983), “On the kinetics of
isothermal crystallization of branched polyethylene”, Polymer, 24: 1585-1589
[97] Sumita M., Miyasaka K., Ishikawa K., (1977), “Effect of Drawing on the
Melting Point and Heat of Fusion of Polyethylene”, Journal of Polymer
Science: Part B: Polymer Physics Edition, 15:837-846.

127
[98] Sutton S. J., Vaughan A. S., Bassett D. C., (1996), “On the morphology and
crystallization kinetics of monodisperse polyethylene oligomers crystallizaed
from the melt”, Polymer, 37(25): 5735-5738.
[99] Swallowe G. M., (1999) “Mechanical Properties and Testing of Polymers: An
A-Z Reference”, Polymer Science and Technology.
[100] Tanem B.S., Stori A., (2001), “Blends of single-site linear and branched
polyethylene. I. Thermal characterization”, Polymer, 42:5389-5399.
[101] Teng H., Shi Y., Jin X., (2002), “Novel Characterization of the Crystalline
Segment Distribution and Its Effect on the Crystallization of Branched
Polyethylene by Differential Scanning Calorimetry”, Journal of Polymer
Science: Part B: Polymer Physics Edition, 40: 2107-2118.
[102] Termonia Y., Allen S. R., Smith P., (1988), “Kinetic Model for Tensile
Deformation of Polymers. 3. Effects of Deformation Rate and Temperature”,
Macromolecules 21: 3485-3489.
[103] Thayer A. M., Chemical & Engineering News, Washington, 11 Sept. 1995, p.
15
[104] Thomas L. C., “Characterization of melting phenomena in linear low density
polyethylene by Modulated DSC”, Thermal Analysis and Rheology.
[105] Tobin M. C., (1974), “Theory of phase transition kinetics with growth site
impingement. I. Homogeneous nucleation” Journal of Polymer Science: Part B:
Polymer Physics Edition, 12: 399-406.
[106] Turi edith A., (1997), “Thermal characterization of polymeric materials”, 2nd
edition, Vol 1, Academic Press, New York.
128
[107] Usami T., Gotoh Y., Takayama S., (1986), “Generation Mechanism of Short-
Chain Branching Distribution in Linear Low-Density Polyethylenes”,
Macromolecules, 19: 2722-2726.
[108] Van der Wal A., Mulder J. J., Gaymans R. J., (1998), “Fracture of
polypropylene: 2. The effect of crystallinity”, Polymer, 39: 5477-5481..
[109] Vernyi B., Plastic News, Sept 18, pp 1, 1995
[110] Voigt-Martin I. G., Alamo R., Mandelkern L., (1986), “A quantitative electron
microscopic study of the crystalline structure of ethylene copolymers ”, Journal
of Polymer Science: Part B: Polymer Physics Edition, 24(6): 1283-1302
[111] Wagner J., Abu-Iqyas S., Monar K., Phillips P. J., (1999), “Crystallization of
ethylene-octene copolymers at high cooling rates”, Polymer, 40: 4717-4721.
[112] Wagner J., Phillips P. J., (2001), “The mechanism of crystallization of linear
polyethylene, and its copolymers with octane, over a wide range of
supercoolings”, Polymer, 42: 8999-9013.
[113] Walker S., Nally G. M., Martin P.J., (2003a), “Effect of material properties on
the mechanical and thermal performance of metallocene catalyzed LLDPEs”,
Annual Technical Conference paper, pp 3638-3642.
[114] Walker S., Nally G. M., Martin P.J., (2003b)“The influence of mould
temperature and polymer structure on the mechanical and thermal properties of
metallocene catalyzed LLDPEs”, Annual Technical Conference paper, pp 671-
675.
[115] Wang C., Chu M. C., Lin T. L., Lai S. M., Shih H. H., Yang J. C., (2001),
“Microstructure of a highly short-chain branched polyethylene”, Polymer, 42:
1733-1741.
129
[116] Ward I. M., Hadley D. W., (2000), An Introduction to the Mechanical
Properties of Solid Polymers, 3rd Ed., John Wiley & Sons, New York.
[117] Welch M. B., Palackal S. J., Geerts R. L., Fahey D. R., (1995) “Polyethylene
produced in Phillips slurry loop reactors with metallocene catalysts”, MetCon
95 Proceedings, USA.
[118] Woo L., Ling M. T. K., Westphal S. P., (1996), “Dynamic mechanical analysis
(DMA) and low temperature impact properties of metallocene polyethylenes”,
Thermochimica Acta, 272: 171-179.
[119] Wunderlich B., In: Turi EA, editor. (1997), Thermal characterization of
Polymeric Materials, vol. 1, Academic Press, New York.
[120] Wunderlich B., (1976), Macromolecular Physics, Vol 2, Academic Press, New
York.
[121] Xu X., Xu J., Feng L., Chen W., (2000), “Effect of Short Chain-Branching
Distribution on Crystallinity and Modulus of Metallocene-Based Ethylene-Butene
Copolymers”, Journal of Applied Polymer Science, 77: 1709-1715.
[122] Xu J., Xu X., Feng L., (1999), “Short chain branching distribution of
metallocene-based ethylene copolymers”, European Polymer Journal, 36: 685-
693.
[123] Yuan Z., Song R., Shen D., (2000), “Study of multiple melting behavior of
syndiotactic polystyrene in �-crystalline form”, Polymer International, 49(11):
1377-1382
[124] Zhang M., Lynch D. T., Wanke S. E., (2001), „Effect of molecular structure
distribution on melting and crystallization behavior of 1-butene/ethylene
copolymers“, Polymer, 42: 3067-3075.
130
[125] Ziabbicki A., (1974), “Network structure, kinematics of deformation, and
constitutive equations of rubber elasticity”, Colloid and Polymer Science,
252(10): 767-783.
[126] Ziabbicki A., (1967), “Kinetics of polymer crystallization and molecular
orientation in the course of melt spinning”, Applied Polymer Symposia, 6: 1-18.
VITA
Name: Md. Ashraful Islam
Faher’s Name: Md. Abdul Wahed
Place of Birth: Natore, Bangladesh
E-mail: [email protected]
Education: B.S. in Chemical Engineering from Bangladesh
University of Engineering & Technology (BUET),
Dhaka, Bangladesh. August, 2001.
M.S. in Chemical Engineering from King Fahd
University of Petroleum & Minerals (KFUPM),
Dhahran, Saudi Arabia. January, 2005.


