Persistent link: http://hdl.handle.net/2345/3935 This work is posted on eScholarship@BC, Boston College University Libraries. Boston College Electronic Thesis or Dissertation, 2013 Copyright is held by the author, with all rights reserved, unless otherwise noted. A Novel in vitro PDE7 Inhibitor Inhibits IL-2 Gene Expression in Activated T Cells and Induces Apoptosis in a B-cell Line and Monocytic Cell Line Author: Chenjia Xu
Transcript
Persistent link: http://hdl.handle.net/2345/3935
This work is posted on eScholarship@BC,Boston College University Libraries.
Boston College Electronic Thesis or Dissertation, 2013
Copyright is held by the author, with all rights reserved, unless otherwise noted.
A Novel in vitro PDE7 Inhibitor InhibitsIL-2 Gene Expression in Activated TCells and Induces Apoptosis in a B-cellLine and Monocytic Cell Line
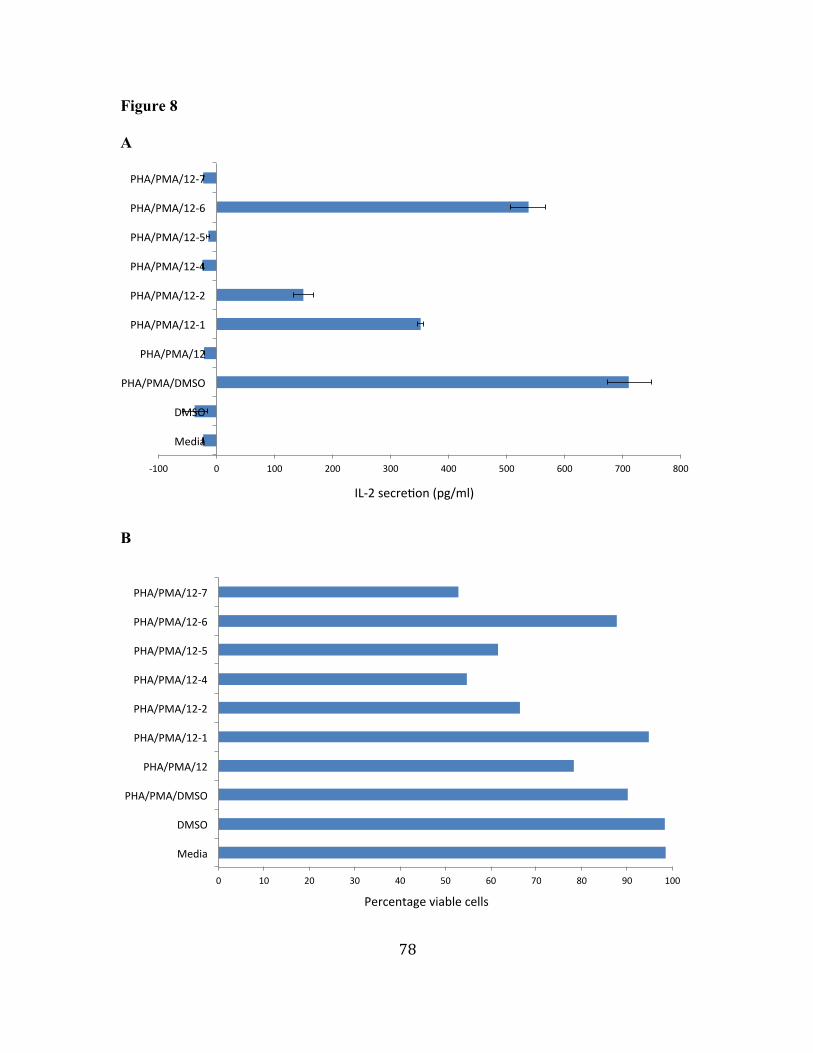
7. BC12 and its derivatives have different PDE7A and 7B inhibitory 74 activity. 8. BC12 and its derivatives have various effects on IL-2 secretion. 77
9. BC12 inhibits IL-2 expression not through PDE. 79
10. BC12 augments activation signal towards AP-1 pathway. 81
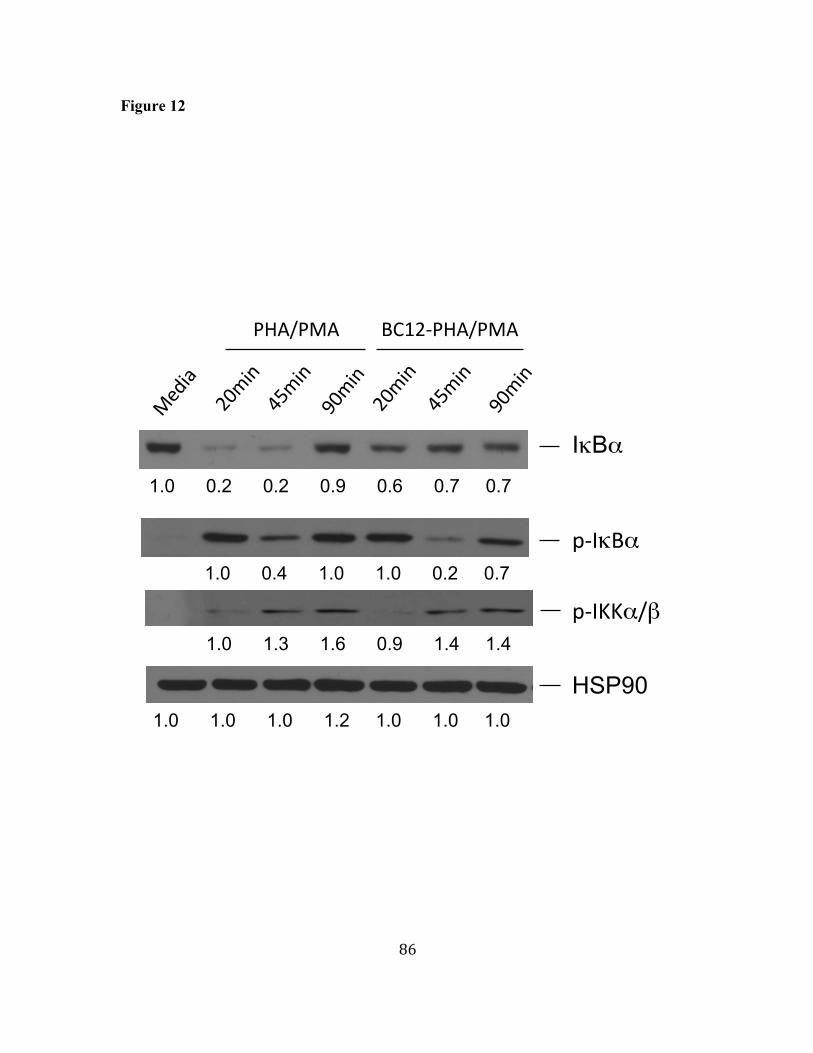
11. Microarray analysis of IL-2 gene regulators suggests NFκB the most 83 likely transcription factor responsible for down-regulation of IL-2 gene. 12. BC12 inhibits IκBα turnover at early time points. 85
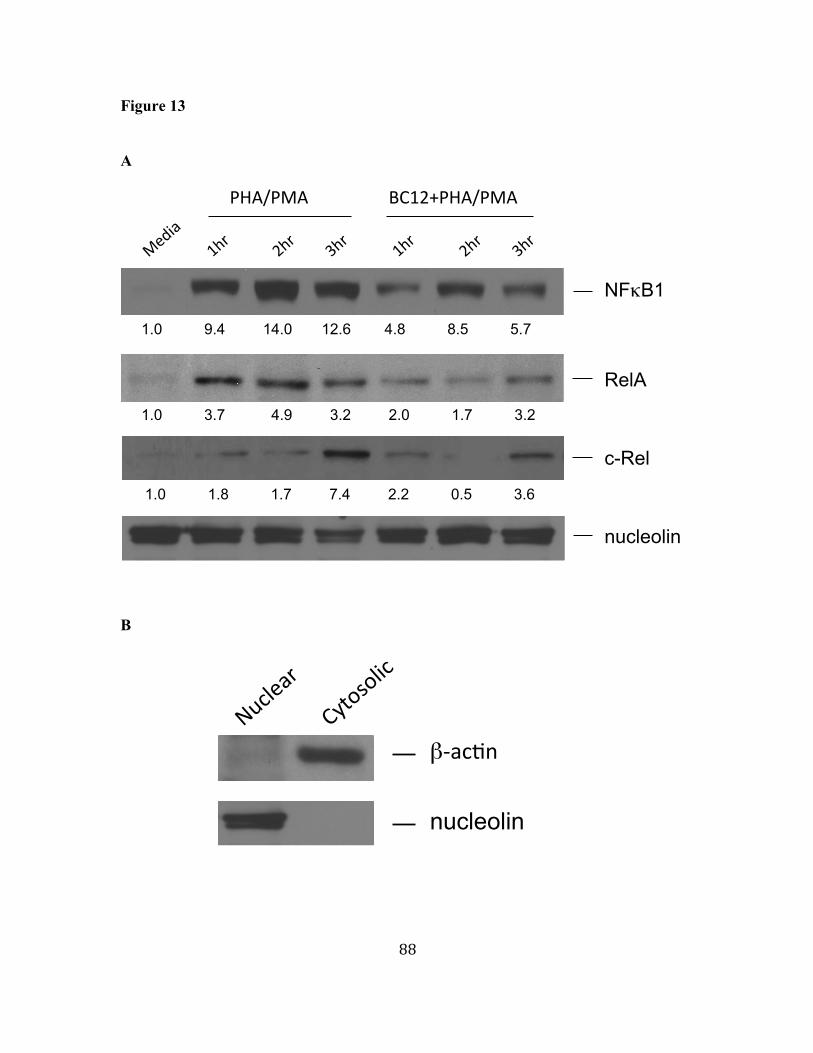
13. BC12 inhibits nuclear translocation of some NFκB family proteins. 87
14. BC12 does not affect nuclear translocation of NFAT and AP-1 family. 89
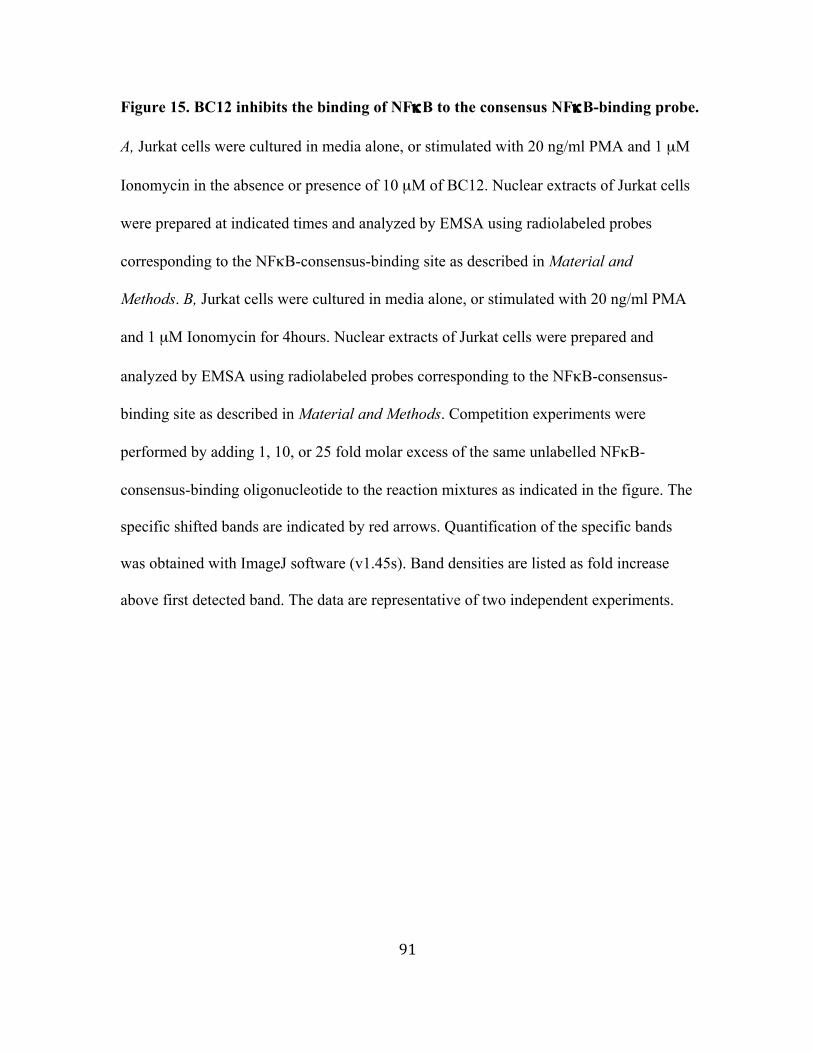
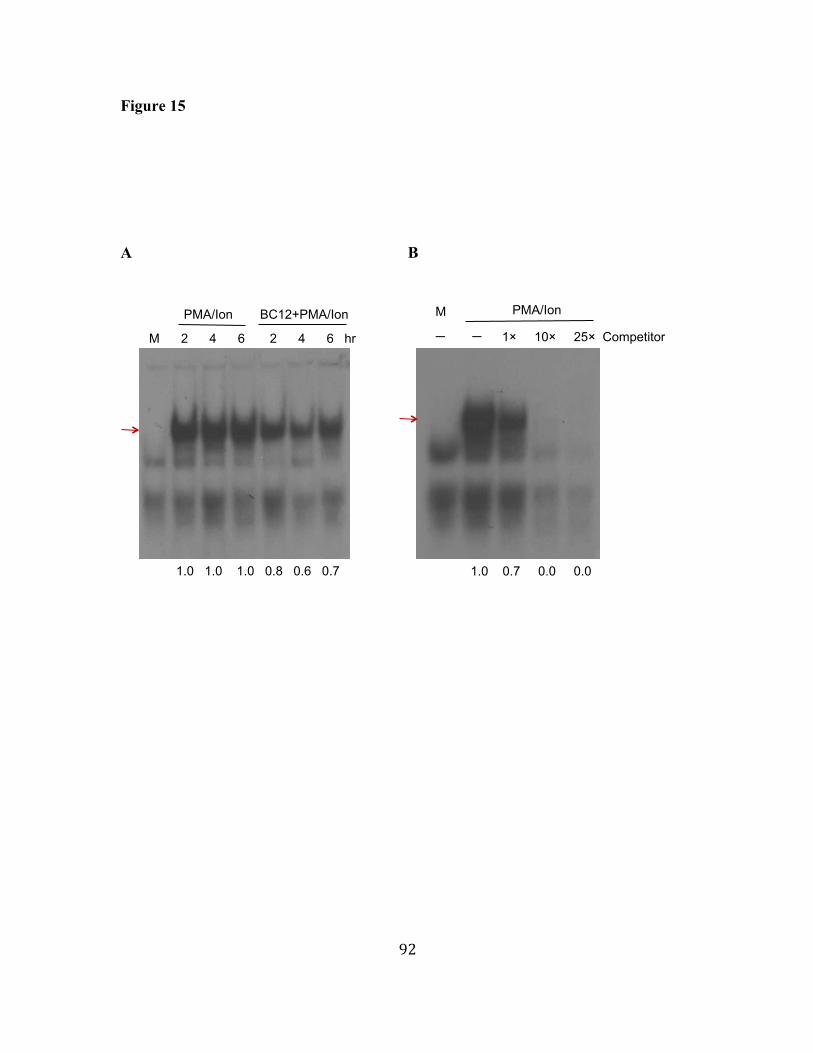
15. BC12 inhibits the binding of NFκB to the consensus NFκB-binding 91 probe. 16. BC12 inhibits the binding of NFAT to the NFAT-binding probes. 93
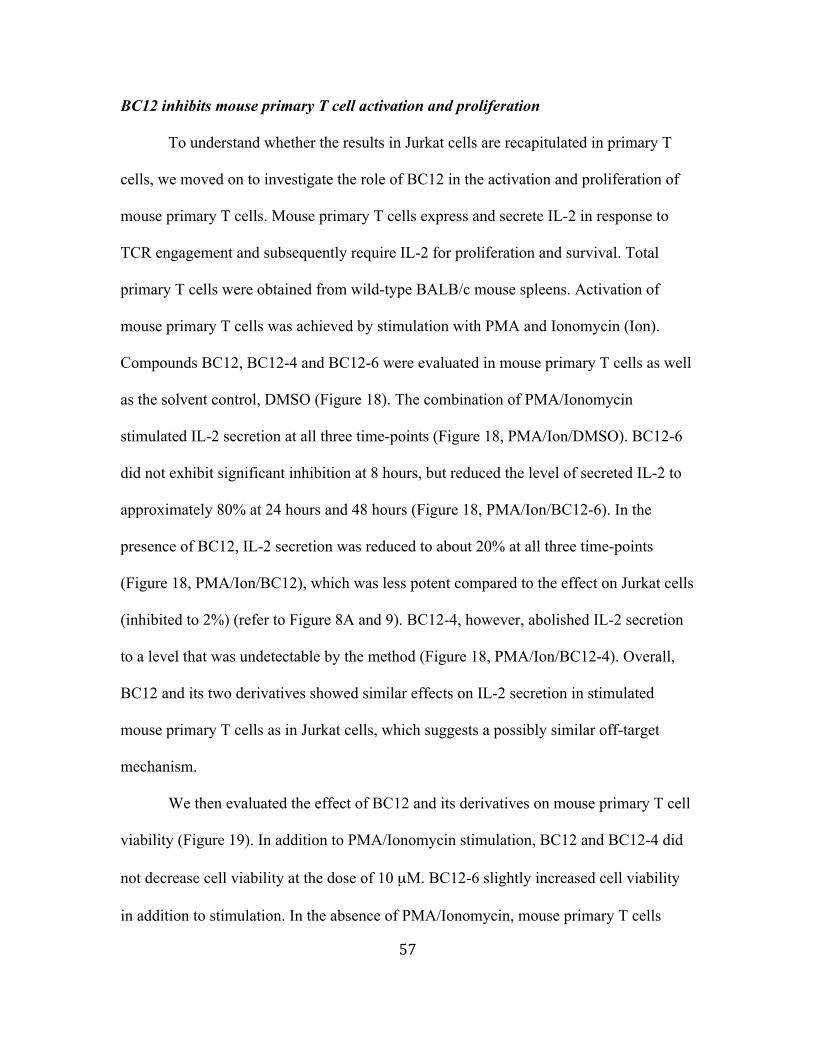
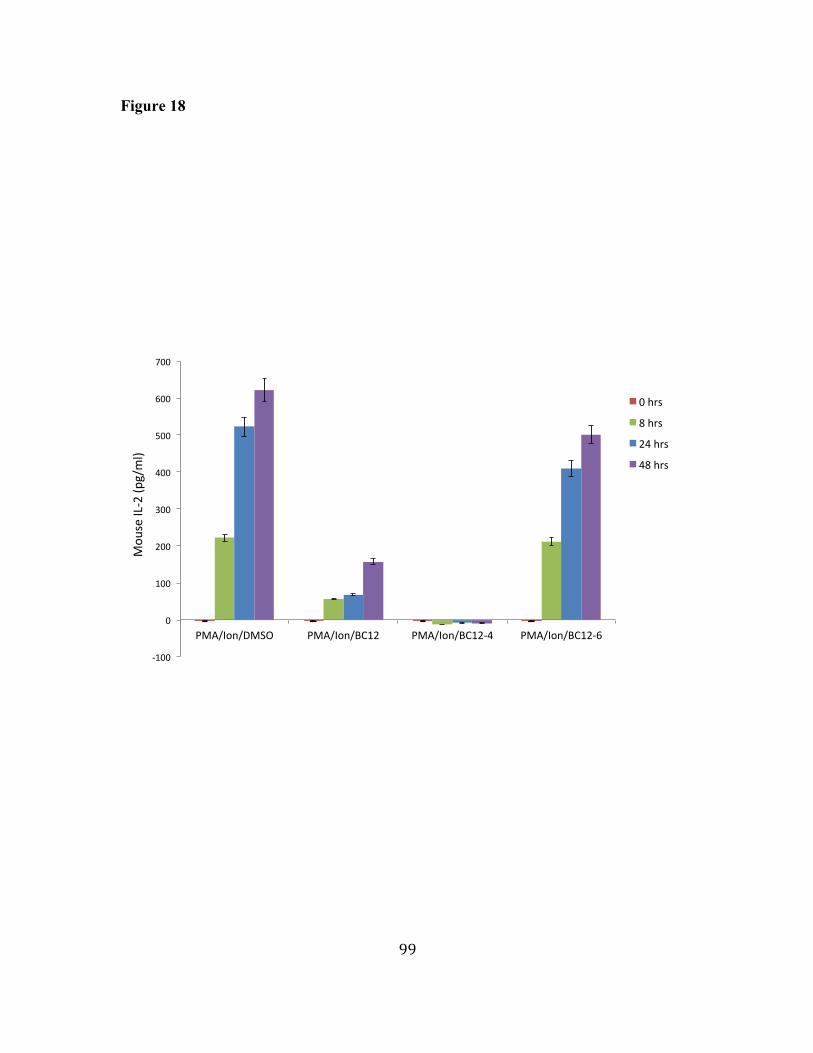
17. BC12 and its analogs have different effects on Transcription factor 96 binding activity. 18. BC12 and BC12-4 inhibit IL-2 secretion in activated mouse primary 98 T cells.
vi
19. BC12, BC12-4 and BC12-6 do not significantly reduce mouse 100 primary T cell viability. 20. BC12 inhibits mouse primary T cell proliferation. 102
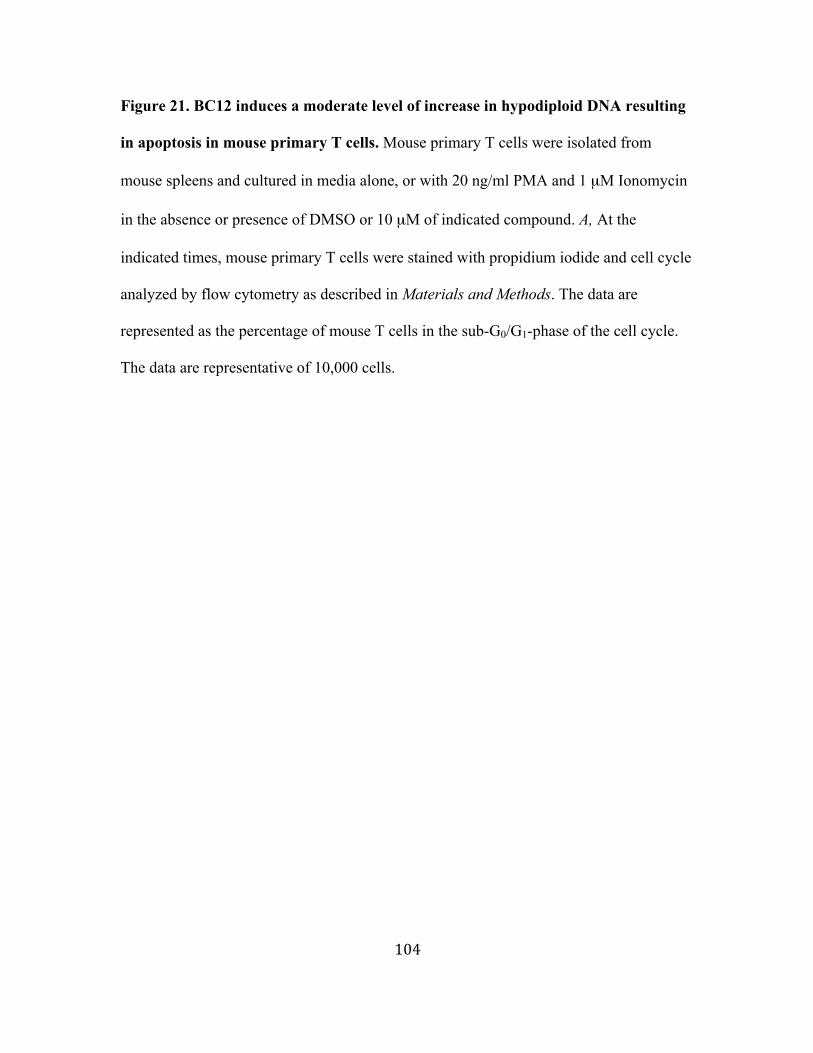
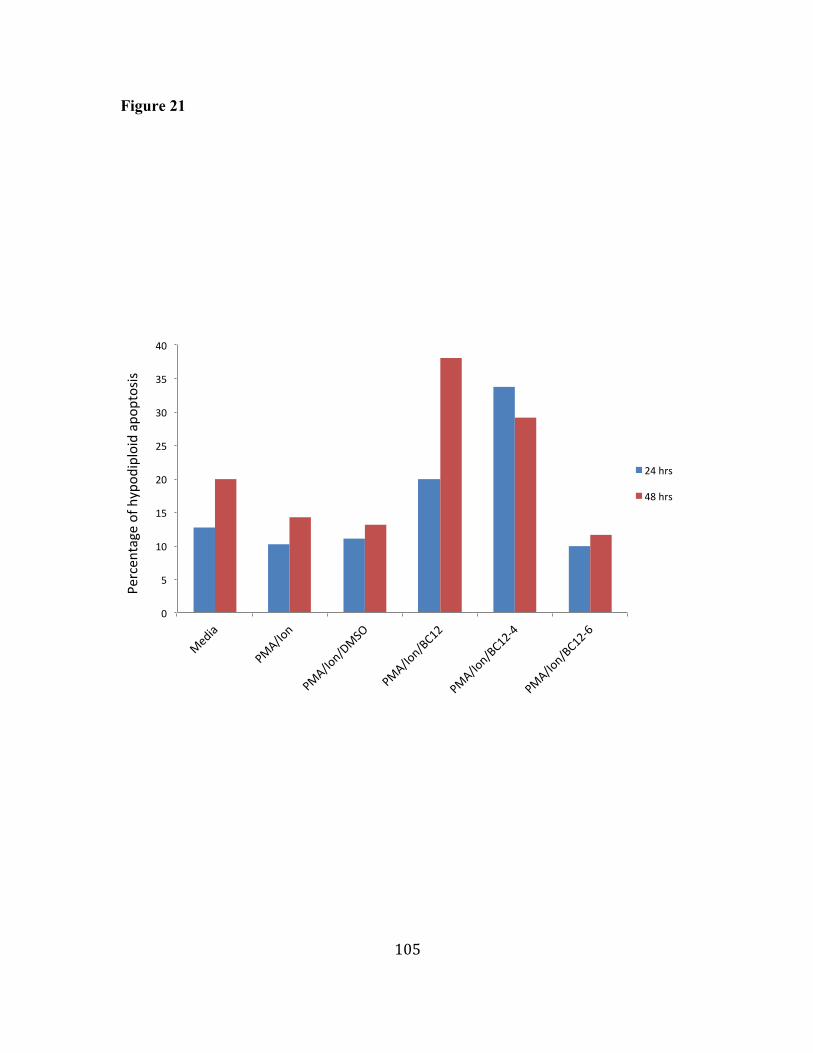
21. BC12 induces a moderate level of increase in hypodiploid DNA 104 resulting in apoptosis in mouse primary T cells. 22. BC12 augments activation signals in activated mouse primary T 106 cells. 23. BC12 inhibits IL-2 secretion in activated human primary T cells. 108
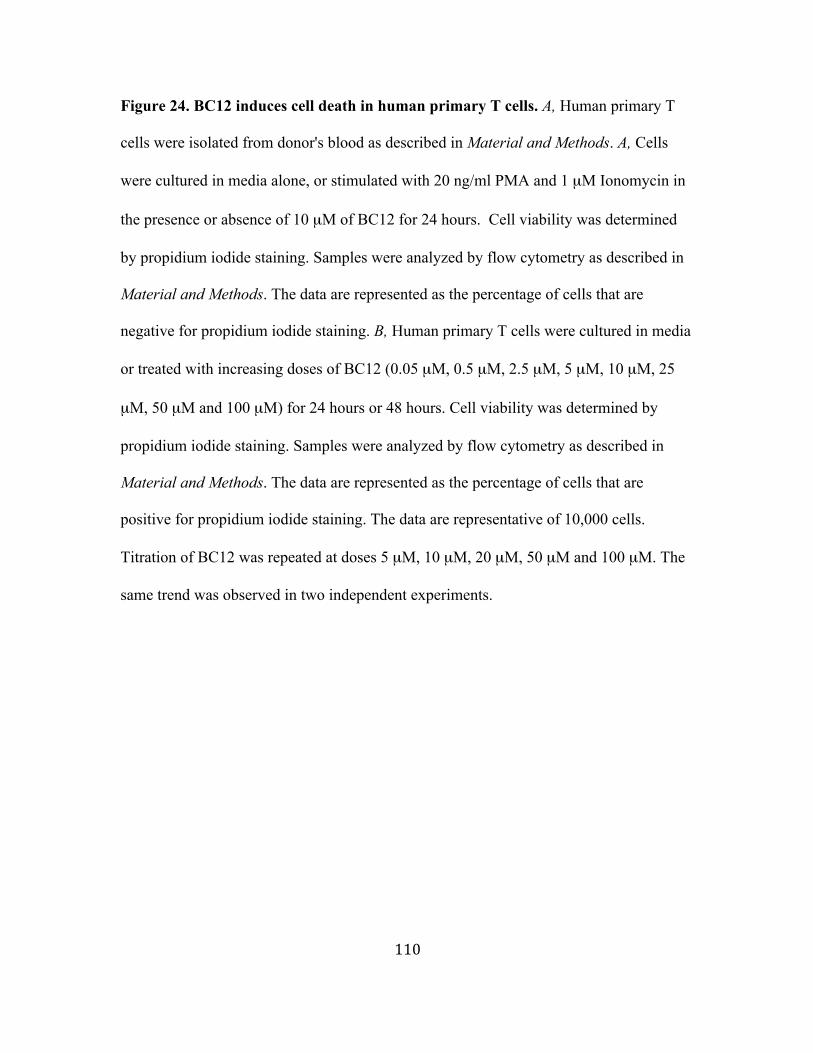
24. BC12 induces cell death in human primary T cells. 110
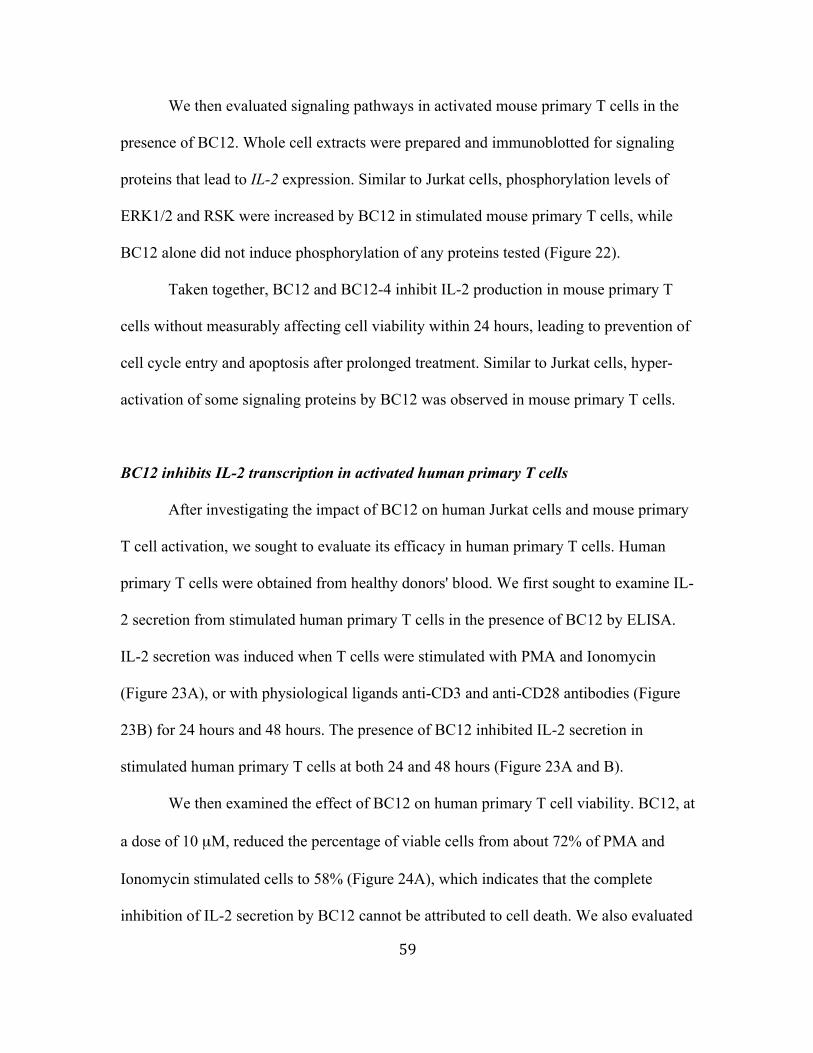
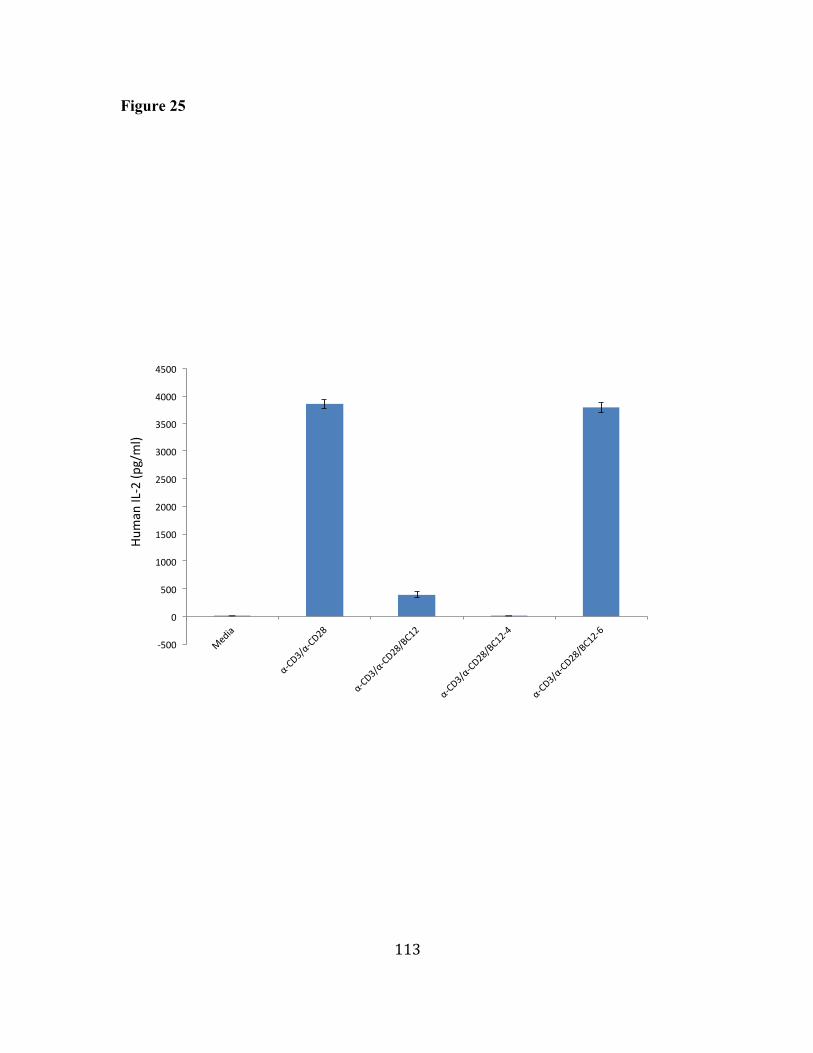
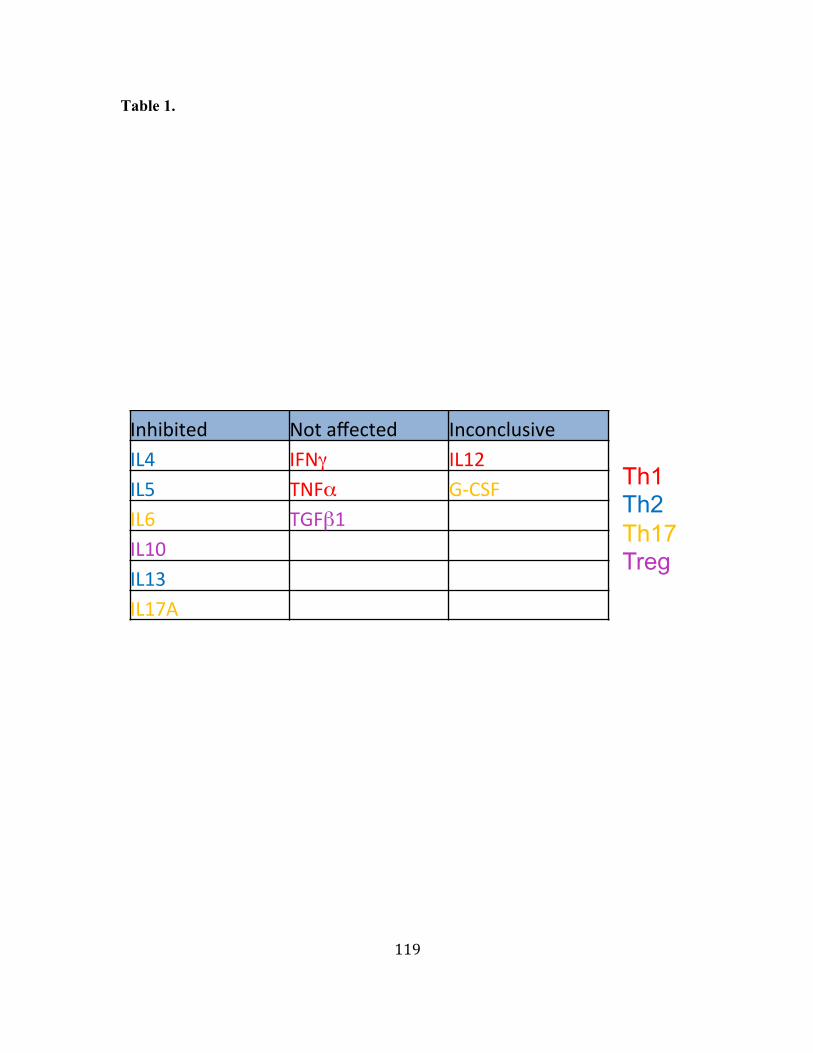
25. BC12 and BC12-4, but not BC12-6, inhibit IL-2 secretion in activated 112 human primary T cells. 26. BC12 decreases the IL-2 mRNA level in activated human primary T 114 cells. 27. BC12 selectively inhibits Th2 cytokines over Th1. 116
28. In vitro PDE7 inhibitors have various effects on LY18 cell viability. 128
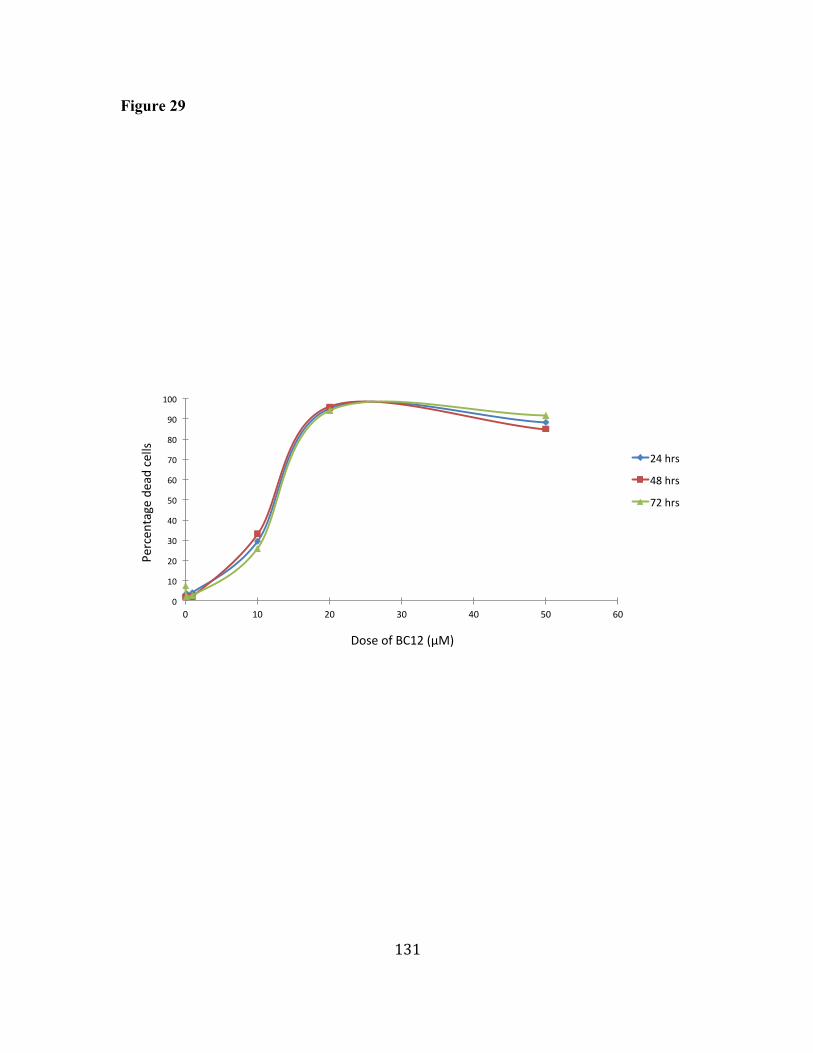
29. BC12 induces dose-dependent decrease of cell viability in LY18 cells. 130
30. BC12 induces apoptosis in LY18 cells. 132
31. BC12 activates caspase pathway in LY18 cells. 134
32. BC12 induces PARP cleavage and activation in LY18 cells. 136
33. BC12 analogs have various effects on LY18 cell viability. 138
34. BC12 does not inhibit cell cycle progression in LY18 cells. 140
35. BC12 induces cell death in human primary B cells. 142
36. In vitro PDE7 inhibitors have various effects on U937 cell viability. 144
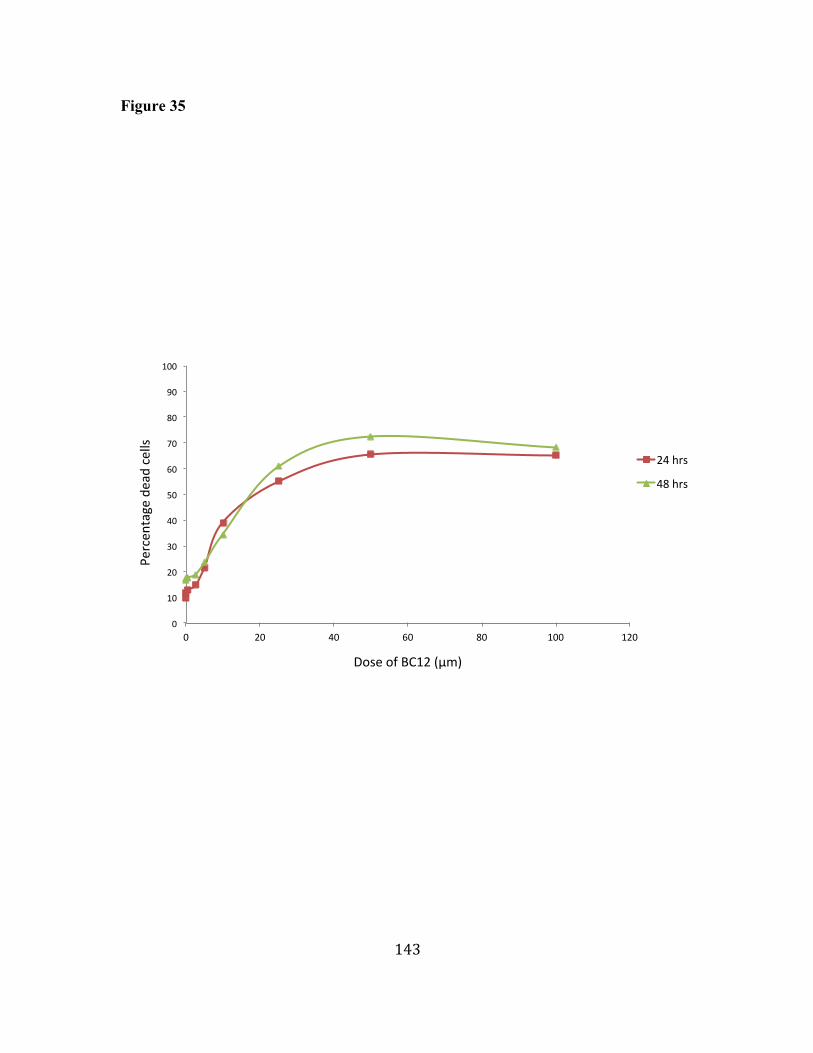
37. BC12 induces dose-dependent decrease of cell viability in U937 cells. 146
38. BC12 induces apoptosis in U937 cells. 148
vii
39. BC12 activates caspase pathway in U937 cells. 150
40. BC12 induces PARP cleavage and activation in U937 cells. 152
41. BC12 does not inhibit cell cycle progression in U937 cells. 154
42. BC12 does not inhibit DNA synthesis in U937 cells. 156
viii
LIST OF ABBREVIATIONS
5-FOA 5-fluoroorotic acid
AC Adenylyl cyclase
AICD Activation-induced cell death
ALL Acute lymphoblastic leukemia
AP-1 Activator protein 1
APC Antigen presenting cells
ARE AU-rich element
at-RA all-trans retinoic acid
BCR B cell receptor
cAMP Adenosine 3', 5'-cyclic monophosphate
CBP CREB binding protein
CCR2 CC-chemokine Receptor 2
CD28RE CD28 responsive element
C/EBP CCAAT/enhancer-binding protein
CLL Chronic lymphocytic leukemia
CLP Common lymphoid progenitor
CMP Common myeloid progenitor
COPD Chronic obstructive pulmonary disease
CRE cAMP-response element
CREB cAMP response element-binding protein
CREM cAMP response element modulator
CsA Cyclosporin A
cSMAC Central supramolecular activation cluster
CtBP C-terminal-binding protein
CTL Cytotoxic T lymphocyte
DAG Diacylglycerol
DLBCL Diffuse large B-cell lymphoma
DN Double negative
DP Double positive
ix
ECL Enhanced chemiluminescence
Egr-1 Early growth response protein-1
ELISA Enzyme-Linked Immunosorbent Assay
EMSA Nuclear Extraction and Electrophoretic Mobility-Shift Assay
NURD Nucleosome remodeling and DNA methylation complex
OCI-LY18 Ontario Cancer Institute-LY18
Oct Octamer-binding protein
PARP Poly ADP Ribose Polymerase
PBMC Peripheral blood mononuclear cell
PDE Phosphodiesterase
PDK Phosphoinositide-dependent protein kinase
PHA Phytohaemagglutanin
PI3K Phosphatidylinositol 3-kinase
PIP2 Phosphatidylinositol 3,4-phosphate
PIP3 Phosphatidylinositol 3,4,5-phosphate
PKA Protein kinase A
PKB Protein kinase B
PKC Protein kinase C
PLC Phospholipase C
PMA Phorbol myristate acetate
PTK Protein tyrosine kinase
RA Rheumatoid arthritis
RAR Retinoic acid receptor
ROR Retinoic acid-related orphan receptor
SLE Systemic lupus erythematosus
Sos Son of sevenless
Stat Signal transducer and activator of transcription
xi
Syk Spleen tyrosine kinase
TCR T-cell receptor
TGF Tumor growth factor
TNF Tumor necrosis factor
TUNEL Terminal Deoxynucleotidyltransferase dUTP Nick End Labeling
UTR Untranslated region
ZAP-70 Z-chain associated protein kinase-70
ZEB Zinc finger E-box-binding protein
1
INTRODUCTION
I. Cyclic Nucleotide Phosphodiesterases and Their Roles in Immune System
A. cAMP Signaling in Immune System
Adenosine 3', 5'-cyclic monophosphate (cAMP) is a ubiquitous second messenger
that plays a central role in signal transduction and regulation of cellular responses. It is
generated by adenylyl cyclase (AC) and hydrolyzed by phosphodiesterase (PDE) [1, 2].
The intracellular level of cAMP is precisely controlled and organized spatially and
temporally. Adenylyl cyclases are activated through occupation of respective upstream G
protein receptors by their ligands. There are at least ten isoforms of adenylyl cyclase and
eleven families of phosphodiesterases in mammalian cells that allow tissue and
differentiation specific regulation and compartmentalization of cAMP signaling [2].
Protein kinase A (PKA) and exchange protein directly activated by cAMP (EPAC) are
the major effector enzymes of cAMP signaling [1]. Binding of cAMP to PKA releases
catalytic domains of the kinase from regulatory domains. These catalytic domains are
free to translocate and phosphorylate enzymes, transcription factors and ion channels, and
therefore regulate a large scale of cellular response and gene expression [2]. Targeting
cAMP pathway can be achieved through respective G-protein coupled receptors, adenylyl
cyclases, phosphodiesterases, and downstream PKA activity. However, increasing of
adenylyl cyclase activity only results in transient change of cAMP level due to
compensation of increased downstream PDE activity [3].
2
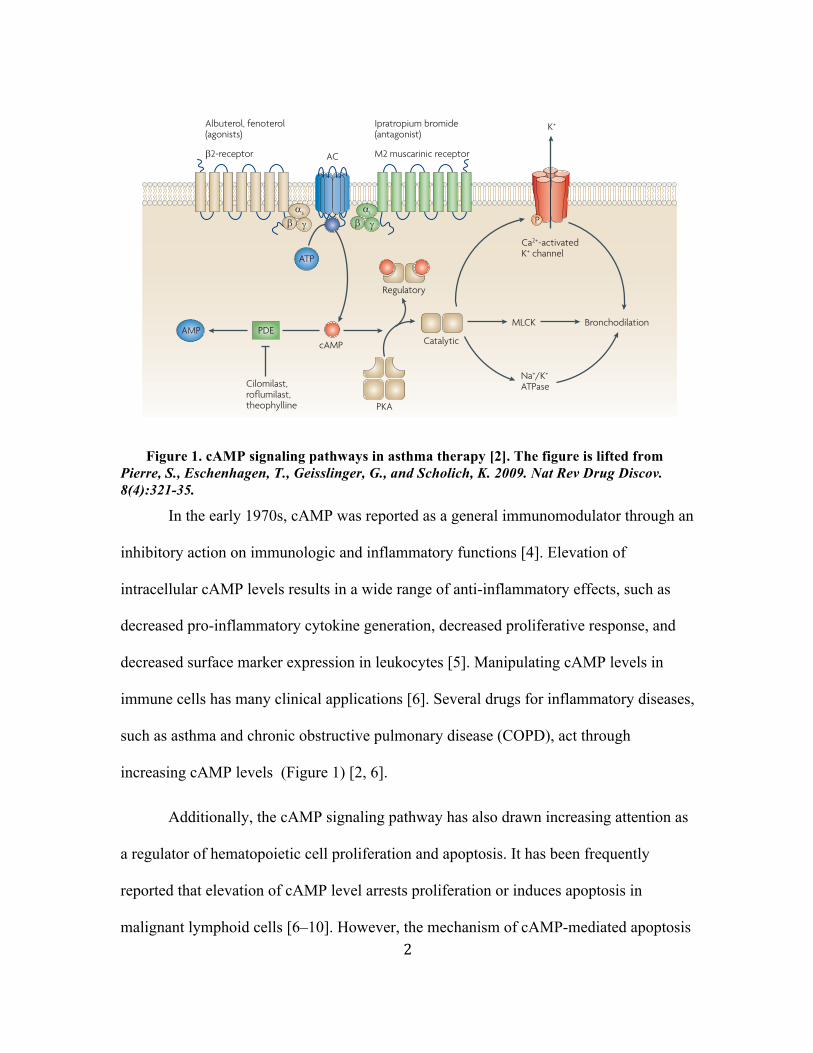
Figure 1. cAMP signaling pathways in asthma therapy [2]. The figure is lifted from Pierre, S., Eschenhagen, T., Geisslinger, G., and Scholich, K. 2009. Nat Rev Drug Discov. 8(4):321-35.
In the early 1970s, cAMP was reported as a general immunomodulator through an
inhibitory action on immunologic and inflammatory functions [4]. Elevation of
intracellular cAMP levels results in a wide range of anti-inflammatory effects, such as
decreased pro-inflammatory cytokine generation, decreased proliferative response, and
decreased surface marker expression in leukocytes [5]. Manipulating cAMP levels in
immune cells has many clinical applications [6]. Several drugs for inflammatory diseases,
such as asthma and chronic obstructive pulmonary disease (COPD), act through
increasing cAMP levels (Figure 1) [2, 6].
Additionally, the cAMP signaling pathway has also drawn increasing attention as
a regulator of hematopoietic cell proliferation and apoptosis. It has been frequently
reported that elevation of cAMP level arrests proliferation or induces apoptosis in
malignant lymphoid cells [6–10]. However, the mechanism of cAMP-mediated apoptosis
s i
ATP
AMPcAMP
PKA
Catalytic
Regulatory
AC2-receptor M2 muscarinic receptor
Albuterol, fenoterol(agonists)
Ipratropium bromide(antagonist)
Ca2+-activatedK+ channel
K+
Nature Reviews | Drug Discovery
MLCK Bronchodilation
Na+/K+ ATPase
P
PDE
Cilomilast, roflumilast,theophylline
pathogenic and immunogenic potential of the adeno-virus backbone, two or more genomic regions are deleted in the newer generations of adenovirus vectors (‘double-deleted’ or ‘gutless’ adenovirus, respectively). Despite the use of these new generations of adenovirus vectors or cardiotropic subtypes of adeno-associated virus, in our opinion, the possibility of routine gene therapy is not a likely alternative to drug treatment in the near future.
AC activators in heart failure. Colforsin daropate hydrochloride, a direct AC activator with some selec-tivity for AC5 compared with AC2 and AC3 (REF 85) but unknown affinity for AC6, shows potent inotropic and vasodilatory effects and is approved in Japan for the treatment of acute heart failure86. Given its action downstream of β-adrenoceptors, inotropic effects could be expected even in the presence of catecholamine refractoriness, but data in rabbits suggest that colforsin daropate hydrochloride loses its inotropic effect in animals treated chronically with isoprenaline, and even induces desensitization itself 87. Furthermore, to achieve the same stimulation of force in dogs as seen with dobu-tamine or a PDE inhibitor, colforsin daropate hydro-chloride exerted markedly more vasodilatation and tachycardia, a profile that is not well suited for the treat-ment of heart failure88. The compound is not approved for the treatment of chronic heart failure and, given the detrimental effects of cAMP-increasing compounds in this condition, will probably never be.
Activation of ACs during asthma treatmentcAMP pathways in asthma. Asthma is a complex inflam-matory disease that affects ~10% in the population in the Western world89. Classical anti-obstructive drugs for the treatment of asthma, such as β2-adrenergic recep-tor agonists (that is, fenoterol or albuterol) or theophylline act through increased levels of cAMP (FIG. 2). Due to the necessity to increase cAMP levels to produce broncho-dilatation and the fact that theophylline inhibits PDEs unselectively, inhibitors of cAMP-degrading PDEs are currently investigated for their use in asthma treatment90. PDE4 inhibitors specifically prevent the hydrolysis of cAMP in inflammatory cells and lung cells, thereby simul-taneously decreasing the inflammatory response to the allergen and acting as a bronchodilator90,91. The second generation of PDE4 inhibitors, cilomilast and roflumi-last, reached stage III clinical trials and showed beneficial effects in asthma and chronic obstructive pulmonary dis-ease, although their effectiveness is limited by the need to use doses that can cause nausea and vomiting91. Human airway smooth muscle cells express several isoforms of
adenylyl cyclases, including AC5, AC6 and AC9 (REF. 92), and direct activation of one of these isoforms could serve as alternative therapeutic approach to limit the adverse side effects reported with PDE inhibitors. Previous studies using the unselective AC activator forskolin could serve as proof-of-concept. For example, forskolin was shown to lower airway resistance after tracheal intubation95, fentanyl-induced bronchoconstriction96 and to induce bronchodilatation in patients with asthma97.
Figure 2 | cAMP signalling pathways in asthma therapy. Several bronchodilatator drugs act by increasing cyclic AMP (cAMP) levels. Treatment with β2-adrenergic receptor agonists (such as albuterol and fenoterol) stimulates cAMP generation by adenylyl cyclases (ACs) through the stimulatory G-protein G
s. Antagonists of the M2-muscarinic receptor
(such as ipratropium bromide) can prevent the inhibitory G-protein (Gi)-mediated inhibition of ACs. Unselective
phosphodiesterase (PDE) inhibitors (theophylline) and selective PDE4 inhibitors (such as cilomilast and roflumilast) increase intracellular cAMP levels by preventing the degradation of cAMP. Increased intracellular cAMP concentrations activate through protein kinase A (PKA) multiple target proteins including myosin light chain kinase (MLCK), Na+/K+-ATPase or Ca2+-activated K+ channels.
REVIEWS
328 | APRIL 2009 | VOLUME 8 www.nature.com/reviews/drugdisc
3
remains largely undiscovered. Although PKA is believed to be required in mediating
apoptosis in most cases, the cAMP-mediated apoptosis in diffuse large B-cell lymphoma
was reported to be associated with inhibition of the phosphatidylinositol 3-kinase
(PI3K)/Akt pathway [10]. The expression level of the pro-apoptotic protein, Bim, from
Bcl-2 family, is up-regulated in response to cAMP/PKA activation in lymphoid cells,
which may be the link between PKA and caspase activation [8].
B. PDE and Immune Cells
The multigenic family of cyclic nucleotide phosphodiesterase (PDE) hydrolyze
the 3' ribose phosphate bond of cAMP or cGMP to their respective 5' -monophosphate
and is the only way to degrade these cyclic nucleotides [1]. PDEs that hydrolyze cyclic
pyrimidine monophosphates have also been discovered but have received little attention
[11]. PDEs with homology greater than 65% in their catalytic cores are considered as the
same family [1, 11]. There are at least 21 PDE genes expressed in mammalian cells that
are divided into 11 families [1, 12]. Each gene produces one or more protein products due
to splicing variation, yielding at least 80 different PDE proteins [1, 12]. Different PDE
families share some structural similarity, including a conserved catalytic domain, and
also own specificity in the respects of biochemical properties, substrate specificity,
cellular localization, tissue-specific expression, and their sensitivity to pharmacological
agents. PDE4, PDE7 and PDE8 are cAMP specific [1, 6]. Among the large PDE
superfamily, PDE 3B, 4A, 4B, 4D and 7A1 are predominant in immune cells [5, 13].
Besides tissue-specific expression, PDE isoenzymes display remarkable specific
cellular and subcellular localization. Subsequent compartmentalization of PDE activity in
4
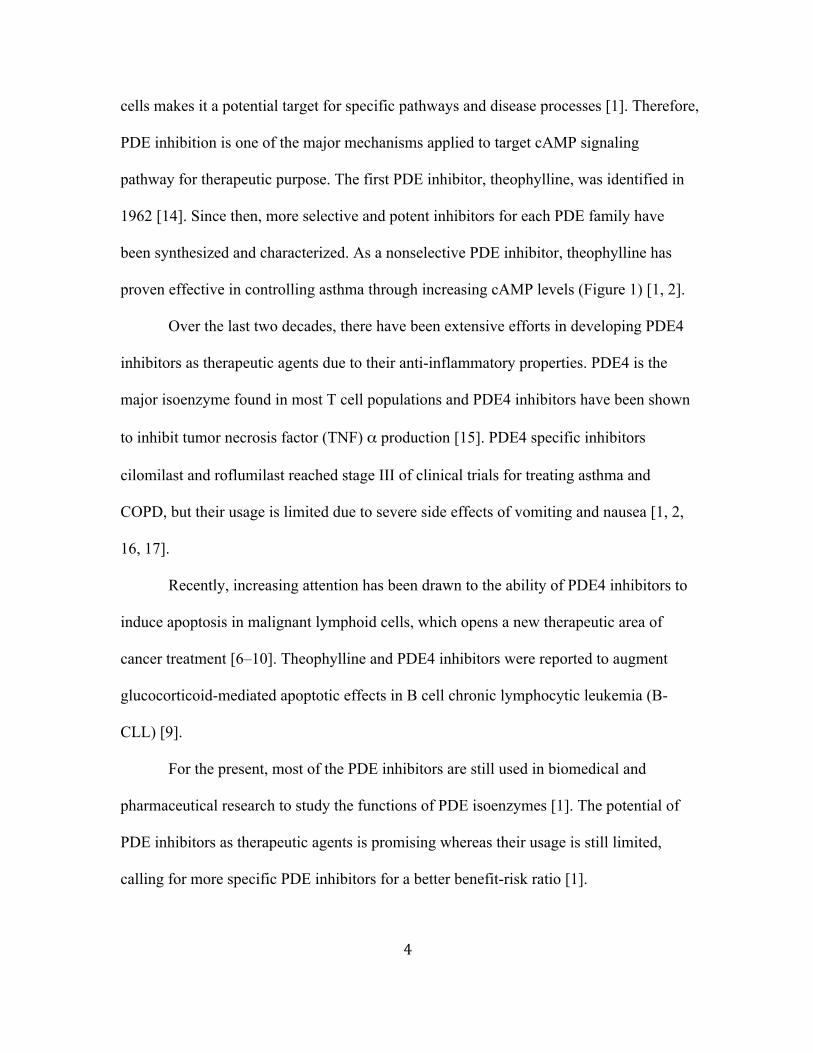
cells makes it a potential target for specific pathways and disease processes [1]. Therefore,
PDE inhibition is one of the major mechanisms applied to target cAMP signaling
pathway for therapeutic purpose. The first PDE inhibitor, theophylline, was identified in
1962 [14]. Since then, more selective and potent inhibitors for each PDE family have
been synthesized and characterized. As a nonselective PDE inhibitor, theophylline has
proven effective in controlling asthma through increasing cAMP levels (Figure 1) [1, 2].
Over the last two decades, there have been extensive efforts in developing PDE4
inhibitors as therapeutic agents due to their anti-inflammatory properties. PDE4 is the
major isoenzyme found in most T cell populations and PDE4 inhibitors have been shown
to inhibit tumor necrosis factor (TNF) α production [15]. PDE4 specific inhibitors
cilomilast and roflumilast reached stage III of clinical trials for treating asthma and
COPD, but their usage is limited due to severe side effects of vomiting and nausea [1, 2,
16, 17].
Recently, increasing attention has been drawn to the ability of PDE4 inhibitors to
induce apoptosis in malignant lymphoid cells, which opens a new therapeutic area of
cancer treatment [6–10]. Theophylline and PDE4 inhibitors were reported to augment
glucocorticoid-mediated apoptotic effects in B cell chronic lymphocytic leukemia (B-
CLL) [9].
For the present, most of the PDE inhibitors are still used in biomedical and
pharmaceutical research to study the functions of PDE isoenzymes [1]. The potential of
PDE inhibitors as therapeutic agents is promising whereas their usage is still limited,
calling for more specific PDE inhibitors for a better benefit-risk ratio [1].
5
C. PDE7 Family: Expression and Function in Immune Cells
PDE7 is a cAMP-specific PDE family characterized as high affinity for cAMP
(Km=0.2 µM) and low Vmax, but no sensitivity to PDE4 inhibitors such as rolipram [1]. It
was first isolated at the gene level from a human glioblastoma cDNA library in 1993
[18]. Since then, two genes have been identified in the PDE7 family, PDE7A and
PDE7B, in mouse, rat and human [11, 18–21]. Although these two genes share structural
similarity, they exhibit distinct distribution patterns [21, 22].
PDE7A mRNA is highly expressed in human proinflammatory and immune cells,
as well as in endothelial cells [22]. Three splice variants derived from the same gene have
been identified. PDE7A1, the most well understood splice variant, is abundant in T
fibroblasts, and eosinophils. PDE7A2 has only been detected in cardiac myocytes at the
protein level. PDE7A3 was found expressed in human CD4+ T cells after stimulation
with anti-CD3/CD28 antibodies but not naive T cells [11, 22, 23]. PDE7A was also
reported to be expressed in human B-lymphocytes and its expression is up-regulated by
elevation of intracellular cAMP as a compensatory feedback mechanism [24]. The overall
expression of PDE7A mirrors the distribution of PDE4, which leads to a reasonable
speculation of its potential to be another anti-inflammatory target [22].
PDE7B was cloned and characterized using a bioinformatics approach in 2000.
The deduced amino acid sequence of human PDE7B is 64% identical to that of PDE7A,
with 67.1% identity in the catalytic domain and almost identical cAMP binding sites [19,
20]. PDE7B mRNA is most abundantly expressed in the brain, heart, skeletal muscle and
6
pancreas, with little overlapping in distribution compared to PDE7A, indicating tissue-
specific functions of these two isoenzymes [19, 21, 24]. Three PDE7B splice variants
were identified in rats, with PDE7B1 most widely distributed and PDE7B2 restricted to
testis. PDE7B1 was proposed to play a role in neural activity and memory function [19–
21, 24]. It is notable that PDE7B mRNA is also detected in a low transcriptional level in
T-lymphocytes [24].
In addition to the ubiquitous expression of PDE7A in immune cells, accumulating
evidence support that PDE7A plays a role in regulating inflammatory responses. Both
PDE7A1 and 7A3 are up-regulated in T cells after stimulation [23, 25]. Li et al. reported
that PDE7A antisense oligonucleotides inhibited cell proliferation and IL-2 production in
both Hut78 T cell line and primary CD4+ T lymphocytes. The inhibition was associated
with an increase in the cAMP level and could be reversed by a PKA antagonist [25].
However, PDE7A deficient mice were reported to have functional T cells, but
unexpectedly exhibit a significantly enhanced antibody response, opposing the role of
PDE7A in T cell activation but suggesting its potential role in B cell function [26].
Although PDE7B was considered not present at an appreciable level in immune
cells, it was recently reported that B-CLL cells overexpressed PDE7B [7]. Both selective
inhibition of PDE7 and dual inhibition of PDE4/7 kill CLL cells at concentrations that
have little effects on normal B cells, suggesting PDE7B as a potential therapeutic target
for CLL [7]. However, inhibitors that selectively and potently inhibit PDE7B are in need
to confirm its role in CLL malignancy.
7
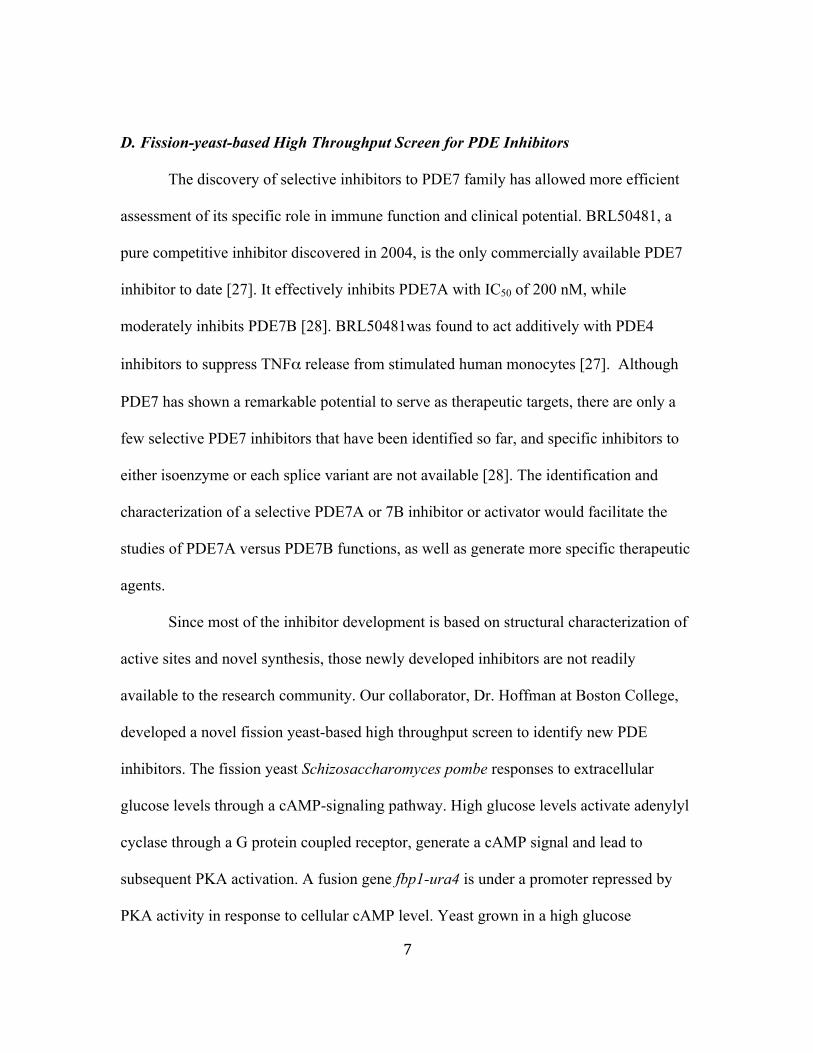
D. Fission-yeast-based High Throughput Screen for PDE Inhibitors
The discovery of selective inhibitors to PDE7 family has allowed more efficient
assessment of its specific role in immune function and clinical potential. BRL50481, a
pure competitive inhibitor discovered in 2004, is the only commercially available PDE7
inhibitor to date [27]. It effectively inhibits PDE7A with IC50 of 200 nM, while
moderately inhibits PDE7B [28]. BRL50481was found to act additively with PDE4
inhibitors to suppress TNFα release from stimulated human monocytes [27]. Although
PDE7 has shown a remarkable potential to serve as therapeutic targets, there are only a
few selective PDE7 inhibitors that have been identified so far, and specific inhibitors to
either isoenzyme or each splice variant are not available [28]. The identification and
characterization of a selective PDE7A or 7B inhibitor or activator would facilitate the
studies of PDE7A versus PDE7B functions, as well as generate more specific therapeutic
agents.
Since most of the inhibitor development is based on structural characterization of
active sites and novel synthesis, those newly developed inhibitors are not readily
available to the research community. Our collaborator, Dr. Hoffman at Boston College,
developed a novel fission yeast-based high throughput screen to identify new PDE
inhibitors. The fission yeast Schizosaccharomyces pombe responses to extracellular
glucose levels through a cAMP-signaling pathway. High glucose levels activate adenylyl
cyclase through a G protein coupled receptor, generate a cAMP signal and lead to
subsequent PKA activation. A fusion gene fbp1-ura4 is under a promoter repressed by
PKA activity in response to cellular cAMP level. Yeast grown in a high glucose
8
environment require uracil to survive unless cAMP signaling is inhibited. Defects in
glucose signaling pathway result in constitutive expression of fbp1-ura4 fusion gene,
allowing yeast strains grow in high glucose environment lacking uracil, while conferring
sensitivity to 5-fluoroorotic acid (5-FOA) [28].
Fission yeast strains with defects in glucose signaling were constructed with
mammalian PDE genes as the only PDE activity. PDE inhibitors augment intracellular
cAMP level and confer 5-FOA-resistant growth. Therefore, this platform can be used to
screen for compounds with PDE inhibitory activity in a high-throughput fashion [28].
E. Identification, Structure and In-vitro Characterization of BC12 and Related
Compounds
A series of novel compounds were identified as PDE7A or 7B inhibitors by the
Hoffman lab based on their ability to stimulate 5-FOA-resistant growth in PDE7A or
PDE7B recombinant fission yeast stains. In vitro PDE assays confirmed the PDE7
inhibitory activity of these compounds. Among them, BC12 is one of the best PDE7A
inhibitors in both high-throughput screening and in vitro assay. The IC50 on purified
PDE7A catalytic domain is 1 µM, compared to 0.2 µM of BRL50481. Interestingly,
BC12 acts as an activator on PDE7B catalytic domain with AC200= 0.1 µM. To further
confirm, PDE7B from rat cell extracts was used as a substrate. BC12 acts as an inhibitor
of full-length rat PDE7B with IC50 of 200 nM (Thomas Rich, personal communication).
Based on the high throughput screening and in vitro PDE assay, BC12 is a potent in vitro
PDE7A and 7B inhibitor.
9
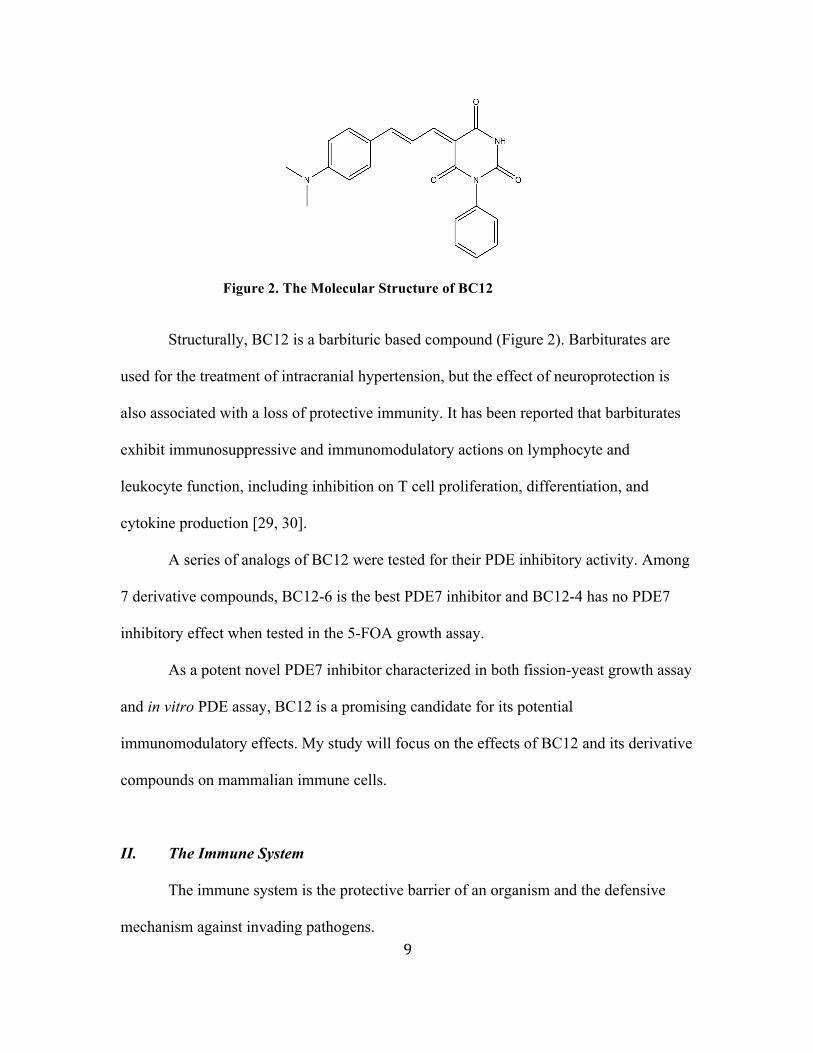
Figure 2. The Molecular Structure of BC12
Structurally, BC12 is a barbituric based compound (Figure 2). Barbiturates are
used for the treatment of intracranial hypertension, but the effect of neuroprotection is
also associated with a loss of protective immunity. It has been reported that barbiturates
exhibit immunosuppressive and immunomodulatory actions on lymphocyte and
leukocyte function, including inhibition on T cell proliferation, differentiation, and
cytokine production [29, 30].
A series of analogs of BC12 were tested for their PDE inhibitory activity. Among
7 derivative compounds, BC12-6 is the best PDE7 inhibitor and BC12-4 has no PDE7
inhibitory effect when tested in the 5-FOA growth assay.
As a potent novel PDE7 inhibitor characterized in both fission-yeast growth assay
and in vitro PDE assay, BC12 is a promising candidate for its potential
immunomodulatory effects. My study will focus on the effects of BC12 and its derivative
compounds on mammalian immune cells.
II. The Immune System
The immune system is the protective barrier of an organism and the defensive
mechanism against invading pathogens.
10
The immune system has two branches: innate immune system and adaptive
immune system. The cells and molecules of both branches work as an integrated host
defense system. Innate immunity serves as the first line of defense, which acts within
minutes of infection and is followed later by early-induced responses. These responses
can keep the infection under control in the early stages as well as influence the
development of the adaptive immune response that will take several days. The innate
immune system recognizes the common features of pathogens, and does not provide
lasting protective immunity [31].
When the innate immune system fails to eliminate infectious organisms, an
adaptive immune response is triggered, which is a stronger response with highly specific
recognition of diverse foreign pathogens. The adaptive immune system comprises T
lymphocytes, including CD8+ cytotoxic T lymphocytes and CD4+ T helper cells, and B
lymphocytes, which mediate humoral responses. Both T and B lymphocytes develop
through clonal expansion and differentiation into antigen-specific effector lymphocytes,
and also generates memory lymphocytes that allow more rapid and efficient response
upon re-infection [31].
III. T Lymphocytes
A. The Development of T Lymphocytes
Like all other blood cells, T lymphocytes derive from self-renewing
hematopoietic stem cells (HSC) in bone marrow. The fate determination of a pluripotent
progenitor cell requires specific inductive signals and specified microenvironment. T cell
progenitors migrate at a very early stage to thymus to develop into mature T cells [31].
11
The developmental process in thymus can be distinguished by distinctive expression of
cell-surface markers, and are divided into: double negative (DN) CD4-CD8- stage, double
positive (DP) CD4+CD8+ stage and single positive (SP) CD4+ or CD8+ stage (Figure 3)
[32]. DN stage can be further broken down into four sub-stages based on the differential
expression of surface protein CD44 and CD25 [33]. Immature DN thymocytes undergo
receptor gene rearrangement that produces a diverse repertoire of T-cell receptors (TCRs)
of individually unique antigen specificity. Rearrangement of two sets of receptor genes
gives rise to two distinct T-cell lineages: more than 95% α:β T cells and the rest
γ:δ T cells [31]. After successful rearrangement of β-chain gene in α:β lineage cells,
subsequently formed pre-T-cell receptor (preTCR) signals cells to proliferate, upregulate
CD4 and CD8 expression, and initiate the rearrangement of the α-chain gene [31]. These
developing cells go through positive selection by engagement of their TCR by self- major histocompatibility complex (MHC) molecules and negative selection by
eliminating self-reactive cells [31]. T cells expressing receptors that recognize self MHC
II are positively selected to the CD4+ lineage and those expressing receptors that
recognize self MHC I are selected to the CD8+ lineage [32]. In the specific environment
of the thymus, T cells are selected to generate a repertoire of self-MHC restricted and
self-tolerant mature T cells.
Mature T cells leave the thymus and recirculate between the bloodstream and
peripheral lymphoid tissues where they may encounter foreign antigens. They remain
naive T cells until they encounter antigens in lymphoid tissues [31].
12
Figure 3. The stages of T cell development [32]. The figure is lifted from E. Sebzda, S. Mariathasan, T. Ohteki, R. Jones, M. F. Bachmann, and P. S. Ohashi, Annual review of immunology, vol. 17, no. 3, pp. 829–874, 1999.
B. Activation and Differentiation
Naive T cells are activated to proliferate and differentiate into effector T cells
when they encounter their specific antigen presented in the form of peptide: MHC by
antigen presenting cells (APC) in peripheral lymphoid tissues. Both ligation of TCR and
costimulatory signals are required to trigger activation of naive T cells. Upon activation,
T cells re-enter G1 phase of cell cycle and express an essential cytokine interleukin-2 (IL-
2) along with the α chain of IL-2 receptor (IL-2R). The α chain assembles with IL-2Rβ
chain and common receptor γ chain to form a high-affinity IL-2 receptor, which binds to
IL-2 to trigger the progression of cell cycle and following activation events [31].
Naive CD8+ T cells are determined to become cytotoxic T lymphocytes (CTL),
while naive CD4+ T cells can be induced by distinct cytokine cues from innate immune
cells to different effector T-cell subsets, including Th1, Th2 and Th17 cells. Th1 cells,
13
which predominately produce IL-2, interferon (IFN) γ, and tumor-necrosis factor (TNF)
β, are primarily responsible for initiating cell-mediated immunity [34]. Th2 cells produce
IL-4, IL-5, IL-6 and IL-13, promote humoral immunity mediated by B lymphocytes, and
stimulate the differentiation and activation of eosinophils [34]. Th17 cells are
characterized by the production of pro-inflammatory cytokines IL-17A, IL-17F and IL-
22. They reside mainly at barrier surfaces and play an important role in autoimmunity
[35]. The function of these effector cells is limited by another subset of T cells,
regulatory T cells, including natural Treg cells (nTregs) and induced Treg cells (iTregs)
[36]. nTreg cells develop in thymus during positive selection and suppress function of
autoreactive T lymphocytes that have escaped negative selection. iTregs are generated in
periphery after antigen-specific stimulation from naive CD4+ T cells [36]. Treg cells
produce high level of inhibitory cytokines IL-10 and tumor growth factor (TGF) β and
suppress effector T cell and dendritic cell function [37].
The decision to differentiate into which effectors or regulatory cells is determined
mainly by cytokines naive CD4+ T cells are exposed to during activation, and controlled
by specific transcription factors. IL-12, produced by dendritic cells and macrophages,
and IFNγ produced by activated T cells are the principal cytokines to induce Th1
development [36]. Activation of signal transducer and activator of transcription 4 (Stat4)
by IL-12 and Stat1 by IFNγ leads to expression of the central transcription factor for Th1
programming, T-bet [36]. IL-4 is the main cytokine that directs Th2 differentiation. Stat6,
activated by IL-4, drives production of GATA-3, the central transcription factor for Th2
programming [36]. The differentiation of Th1 and Th2 effector cells are self-reinforcing
and counter-inhibiting [36]. Development of Th17 and extrathymic iTreg cells share the
14
requirement of TGF β, while differentiation into either Th17 or iTregs depends on the
dominance of signaling by IL-6 or all-trans retinoic acid (at-RA) [38, 39]. Binding of at-
RA to the retinoic acid receptor (RAR) can potently inhibit Th17 development and
promote Treg development [40–43], whereas signaling via IL-6 activates Stat3 and the
lineage-determining transcription factor for Th17, an isoform of retinoic acid-related
orphan receptor γ (RORγ), which is expressed in T cells (RORγt) [44].
C. Signaling Events to T cell Activation: the TCR and CD28 Costimulatory Signals
T lymphocyte activation requires two signals, engagement of the TCR/CD3
complex with antigen peptide/MHC molecule, and an additional signal from
costimulatory molecules present on antigen-presenting cells (APC). The major
costimulatory signal is provided by ligation of the T cell surface molecule CD28 with its
ligands CD80/CD86 (B7-1/B7-2) [45]. Signaling from the TCR in the absence of
costimulation renders a long lasting hyporesponsive state known as T cell anergy, which
is important for peripheral tolerance.
The TCR/CD3 complex is comprised of the polymorphic α and β subunits (γ
and δ subunits in γ:δ lineage T cells) in association with the invariant TCR ζ chain, and
γ, δ, and ε chains of CD3 molecule [46]. Signals from the TCR are transduced by ζ chain
and all three CD3 chains, which contain the immunoreceptor tyrosine-based activation
motif (ITAM) [46]. Phosphorylation of ITAM by membrane-bound Src family kinases
Fyn and lymphocyte protein-tyrosine kinase (Lck) recruits additional protein tyrosine
kinases (PTKs) to the TCR, such as z-chain associated protein kinase-70 (ZAP-70) [47].
15
Figure 4. Signaling pathways activated by the TCR and CD28 molecules that lead to IL-2 production in T helper cells [48]. The figure is lifted from S. L. Gaffen and K. D. Liu, Cytokine, vol. 28, no. 3, pp. 109–23, Nov. 2004.
ZAP-70 phosphorylates a series of downstream adaptor proteins such as LAT, and also
phospholipase Cγ 1 (PLCγ 1), which catalyzes the hydrolysis of phophatidylinositol
intracellular calcium release, which in turn activates calcineurin, and together with DAG,
activates protein kinase C (PKC). LAT recruits growth factor receptor-bound protein 2
(Grb2) and guanine nucleotide exchange protein son of sevenless (Sos), which activates
Ras/ extracellular-signal-regulated kinase (ERK) pathway (Figure 4) [47]. Calcineurin is
upstream of nuclear factor of activated T-cells (NFAT), PKC can activate c-Jun N-
terminal kinase (JNK) and nuclear factor kappa B (NFκB) pathways, and ERK activates
the transcription factor c-Fos. All these components regulate the expression of the IL-2
gene [48].
control of message stability is a characteristic feature ofmultiple cytokines including IL-6, GM-CSF and IL-3[39]. The IL-2 message contains several AU-richelements (AREs) that target transcripts for rapiddegradation [40]. The half life of IL-2 mRNA is only30e60 min, but this doubles in response to T cellsignaling. The IL-2 gene contains at least two ciselements that regulate transcript stability, located inboth the 3# and 5# untranslated regions (UTRs) [41,42].The stability element in the 5# UTR appears to bea target of the JNK pathway, and both act ina combinatorial manner to regulate message turnover.
2.3. Cells and tissues that express the gene
By far the majority of IL-2 is derived from activatedCD4C T cells. Flow cytometry studies analyzing IL-2production by intracellular staining indicate that ap-proximately 60% of activated CD4C T cells secrete IL-2following non-specific stimulation (i.e., treatment withphorbol 12-myristate 13 acetate (PMA) and a calciumionophore or antibodies that crosslink CD3 and CD28).Whereas most or all T cells produce IL-2 immediatelyfollowing antigen stimulation, only the Th1 subsetproduces it in large amounts after T helper celldifferentiation [43]. In addition, CD8C T cells alsosecrete substantial quantities of IL-2 after stimulation oftheir T cell receptors.
Minor amounts of IL-2 are also produced by certainantigen-presenting cells. For example, several B cell lineshave been shown to produce small amounts of thiscytokine [23,44]. More recently, dendritic cells (DCs)were found to produce IL-2 transiently followingmicrobial challenge [45]. In these cases, IL-2 may serveto enhance T cell activation, a hypothesis supported bythe finding that DCs derived from IL-2!/! mice areimpaired in the ability to promote T cell proliferation. Incontrast, however, macrophages apparently do notproduce IL-2 upon bacterial activation [46], so not allmodes of T cell activation require IL-2 from APC.
3. Protein
3.1. Description
The primary translation product of human IL-2contains 153 amino acids, and is processed to a matureform by cleavage of a 20 amino acid, hydrophobicleader sequence. The N-terminal 20 amino acids areessential for interaction with the IL-2 receptor, and anIL-2 mimetic peptide has been developed that iscomprised of its N-terminal 30 amino acids (Fig. 5) [47].
From a structural standpoint, IL-2 is typical ofthe short-chain Type I cytokines, despite a lack ofmajor sequence homology among these proteins [5,48].
PKC
CD4
PLCγ
NF-κB
Calcineurin
NF-AT
DAG
Ins(1,4,5)P3
PtdIns(4,5)P2
LAT
Ca2+
Lck
Raf
Ras
MEK
Vav
Rac cdc42
ERK
TCR
CD3CD3
ZAP70
LAT
Gads
SLP76
Grb2Sos
AP-1
JNK
IKK
Fig. 4. Signaling pathways activated by the T cell receptor and CD28 molecules that lead to IL-2 production in T helper cells. After engaging MHCClass II and antigen (not shown), the T cell receptor (TCR)/CD3 complex recruits CD4C and its associated kinase p56-Lck. Subsequently, thecytoplasmic tails of various CD3 components become phosphorylated by p56-Lck, leading to recruitment of the kinase ZAP70, which proceeds tophosphorylate various adaptors (e.g., LAT, SLP-76, Gads, and Vav) and also phospholipase C (PLC)g. LAT engages the Ras-Raf pathway, whichcontributes to AP-1 formation. PLCg activity leads to production of diacylglycerol (DAG) and intracellular calcium (Ca2C), which in turn activatesprotein kinase C (PKC) and calcineurin, respectively. PKC is upstream of both the JNK and NF-kB pathways, whereas calcineurin is upstream ofNFAT. Together, NFAT, AP-1, NF-kB and Oct-1 regulate the IL-2 proximal promoter (see Fig. 3). Figure kindly provided by Dr. Xin Lin,University at Buffalo, State University of New York.
114 S.L. Gaffen, K.D. Liu / Cytokine 28 (2004) 109e123
16
CD28 signal is required in most cases for optimal IL-2 production and T cell
activation, and for preventing the induction of anergy [49]. The function of CD28 can be
partially attributed to augmentation of the TCR mediated signaling and therefore lower
the TCR activation threshold, by facilitating the clustering of lipid rafts and formation of
the immunological synapse (IS) [50]. However, the molecular basis of CD28 signaling is
still largely controversy [50].
CD28 is a 44-kDa homo-dimeric protein expressed on the cell surface of resting
and activated T cells [51]. The cytoplasmic domain of CD28 molecule lacks catalytic
activity, and instead, it signals through binding to other signaling proteins via consensus
motifs [51]. The phosphorylated YMNM motif in the cytoplasmic tail of CD28 can bind
to adaptor protein Grb2 and the Src homology 2 (SH2) domain of PI3K [51]. In addition
to Sos/Ras pathway, Grb2 can also recruit guanine nucleotide exchange factor Vav1,
which activates Rho family protein such as Rac1, and subsequently JNK pathway [51].
PI3K catalyzes the production of phosphatidylinositol 3,4-phosphate (PIP2) and
phosphatidylinositol 3,4,5-phosphate (PIP3), which associate with phosphoinositide-
dependent protein kinase 1 (PDK1) that in turn activates protein kinase B (PKB, or
known as Akt). CD28 mediated PI3K/PKB pathway can provide survival signal to T cells
by directly inhibiting apoptotic machinery [51], and control protein synthesis, cell
metabolism and proliferation.
Downstream of YMNM motif, CD28 possesses two proline-rich motifs that can
bind to additional signaling proteins, including PKCθ and an actin-binding scaffold
protein Filamin A (FLNA) [51]. FLNA is reported to be important for the movement of
PKCθ to the central supramolecular activation cluster (cSMAC) [51]. PKCθ provides the
17
bridge between CD28 signaling to NFκB pathway, which is considered to be the most
relevant CD28 biochemical target [52].
D. Acute lymphoblastic leukemia and Jurkat cells
Acute lymphoblastic leukemia (ALL) is a malignant disorder of lymphoid
progenitor cells that are committed to differentiate into T- or B-cell lineage [53]. It is the
most common childhood malignancies [53]. Although the cure rate in children is higher
than 80%, relapsed ALL remains a leading cause of childhood mortality [53]. T precursor
ALL comprises about 25% of ALL [54].
Jurkat cells were established from the peripheral blood of a 14-year-old boy with
ALL during the first relapse in 1977 [54]. It was originally designated JM cell line after
the patient's name [54]. It is a CD4+ T cell line and carries leukemia properties identical
to fresh leukemic cells [54]. It is used in research as a producer of cytokine IL-2 [55]. IL-
2 is only produced by Jurkat cells treated with stimuli, such as phorbol esters with either
lectins or monoclonal antibodies directly ligating TCR. My study will focus on Jurkat
cells as a model system for IL-2 production and T cell activation.
IV. The Cytokine Interleukin-2
A. Biological Function of IL-2
IL-2 was discovered in 1976 as a growth-promoting activity for T lymphocytes,
and was the first Type I cytokine identified at the molecular level [56]. IL-2 is a four
α−helical, secreted glycoprotein with a molecular weight of 15.5 kDa [48]. De novo
synthesis of IL-2, followed by the ligand specific IL-2 receptor α chain (IL-2Rα), is the
18
immediate consequence of T cell activation [57]. IL-2Rα itself binds IL-2 with low
affinity. IL-2Rβ combined with the common cytokine receptor γ chain (γc), binds with
IL-2 with intermediate affinity. IL-2Rα/β/γc complex form a high affinity IL-2 receptor,
and transduce IL-2 signals through the cytoplasmic domains of IL-2Rβ and γc [57]. IL-2
signals activate at least three main signaling pathways, including PI3K/Akt, Ras-MAP
kinase, and Janus kinase (Jak)/Stat5 pathways [57].
The in vitro function of IL-2 as a potent T cell growth factor has been well
recognized. IL-2 is the most potent growth factor to stimulate T cell proliferation,
survival and activation, and using monoclonal antibodies specific for IL-2 or IL-2R can
efficiently inhibit T cell proliferation in vitro [58]. IL-2 also sensitizes activated T cells
for activation-induced cell death (AICD) by Fas and Fas ligand induced apoptosis [59].
Later studies have revealed IL-2 as a pleiotropic cytokine that influences
lymphocyte differentiation, immune responses and homeostasis [66, 67]. IL-2 or IL-2R
knock-out mice develop severe autoimmunity instead of immune deficiency diseases [68,
69] , indicating a crucial role of IL-2 in peripheral T cell tolerance. It has been proven
that a failure of production of CD4+CD25+(also known as IL-2Rα) regulatory T cells is
the underlying cause of the lethal autoimmunity in IL-2 deficient mice [70, 71]. Treg
cells do not produce IL-2, but consistently express a high affinity IL-2 receptor [65] and
depend highly on IL-2 signaling for their generation and homeostasis [66–68].
Recent reports reevaluated the complex roles of IL-2 as a broad regulator of CD4+
T helper cell differentiation [67, 75, 76]. Although IL-2 does not specifically induce one
type of helper T cells to differentiate, it modulates expression of cytokine receptors and
transcription factors to either promote or inhibit helper T cell differentiation [69]. IL-2
19
induces the expression of IL-12 receptor β2 subunit (IL-12Rβ2) and of T-bet via Stat5
accessibility of IL4 gene chromatin [70] and increases the expression level of IL-4
receptor α chain (IL-4Rα) [71]. However, the generation of Th17 cells is inhibited by IL-
2 signals [67, 70]. Since Treg and Th17 cells share a common requirement of cytokine
TGF β for differentiation, IL-2 signals play a crucial role in the reciprocal balance
between Th17 and Treg cells [73].
B. Regulation of IL-2 Expression
IL-2 is produced primarily by CD4+ T lymphocytes upon activation by antigen,
although activated CD8+ cells and dendritic cells can also secrete small amounts of it [74].
The production of IL-2 is regulated at multiple levels, with most research emphasis on
transcriptional regulation. Chromatin structure and epigenetic modification also play an
important role in IL-2 gene regulation. In addition, posttranscriptional regulation,
especially IL-2 mRNA stability, is also tightly controlled [46, 72, 73].
Figure 5. The known regulatory elements and corresponding transcription factors identified in the IL-2 gene [74]. The figure is lifted from H. P. Kim, J. Imbert, and W. J. Leonard, Cytokine & growth factor reviews, vol. 17, no. 5, pp. 349–66, Oct. 2006.
regulatory T cells. In a patient with T # B + NK-SCID (i.e.,where NK cells are absent and T cells diminished), expressionof the IL-2Rb chain was markedly decreased, but expressionof gc, Jak3, IL-15, and IL-15a all appeared normal [30].
2.3. gc-Deficient mice
Mice lacking expression of gc exhibit markedlydiminished thymic development, with thymuses only 1–5% of normal size [31,32]. At birth, NK cells are absent andmature B and T lymphocytes are markedly diminished,indicating that gc is indispensable for the development of allmurine lymphocyte classes. Although activated CD4+ Tcells accumulate over time in gc-deficient mice, the CD8+
population remains extremely small [31,33], suggesting thatmature CD4+ T cells respond to gc-independent mitogens,whereas mature CD8+ T cells are dependent on gc forproliferation and survival. B cells are greatly diminished,and NK cells, gd intestinal intraepithelial lymphocytes,dendritic epidermal T cells, peripheral lymph nodes, andgut-associated lymphoid tissue are all absent in gc-deficientmice. gc mutations in humans result in X-linked severecombined immunodeficiency (XSCID), a disease that ischaracterized by a profound decrease in circulating Tlymphocytes and NK cells [15,34,35].
The IL-2/IL-2R system is one in which responses aredynamically regulated. This in part results from theregulation of the components of this ligand/receptor system.In the next sections, we describe the molecular mechanismsthat regulate expression of IL-2/IL-2 receptor components atthe transcriptional and post-transcriptional levels.
3. Regulation of the IL-2 gene
The majority of IL-2 is produced by activated CD4+ Tcells, although some IL-2 is secreted from CD8+ T cells aswell as at least transiently by dendritic cells [20,36]. Theexpression of IL-2 is controlled at multiple levels, with mostinvestigation having focused on transcriptional regulation.Multiple regulatory elements have been located in a minimalenhancer region of approximately 300 bp that is located
immediately upstream of the transcription initiation site(Fig. 2). This region is highly conserved (86% identical)between humans and mice. Several important positiveregulatory elements have been identified in the IL-2 gene(Fig. 2), and there is evidence that all binding sites in the IL-2 promoter/enhancer need to be occupied by appropriatetranscription factors to ensure optimal transcription [37].
3.1. NFAT
Nuclear factor of activated T cell (NFAT) family proteinsserve as the critical transducers of the Ca2+ signal that isassociated with T-cell activation via the T cell receptor. NFATproteins are expressed constitutively but only enter thenucleus after their release from a cytoplasmic tethering site, aprocess that requires the catalytic action of the Ca2+-dependent phosphatase calcineurin. Five NFAT familyproteins have been identified, each of which is encoded bya distinct gene. Four of these (NFATc1, NFATc2, NFATc3 andNFATc4) are calcium regulated, whereas NFAT5 is not.NFATc1, NFATc2, NFATc3 and NFAT5 are expressed by cellsof the immune system, whereas NFATc4 is mainly expressedoutside of the immune system. A total of four NFAT bindingsites have been identified in the IL-2 promoter (Fig. 2) [38].
IL-2 gene expression was not altered in mice deficient ineither NFATc1 [39] or NFATc2 [40], suggesting the potentialredundancy of NFAT isoforms and the possible compensa-tion by other NFAT family proteins in individual NFATknockout mice. Indeed, T cells lacking both NFATc1 andNFATc2 cannot produce IL-2 [41], whereas T cells lackingboth NFATc1 and NFATc3 produce markedly less IL-2 [42],indicating that NFATc1, NFATc2, and NFATc3 all positivelyregulate IL-2 gene transcription.
3.2. AP-1
The AP-1 transcription factor is a dimer, composed of Junand Fos family proteins, most typically c-Jun and c-Fosthemselves. Activation of T cells through TCR-CD3engagement leads to the activation of PKC-SEK1-JNK,RAC-JNK, and RAS-RAF-ERK signaling pathways andconsequently the induction of AP-1. The RAS-ERK pathway
H.P. Kim et al. / Cytokine & Growth Factor Reviews 17 (2006) 349–366 353
Fig. 2. The known regulatory elements and corresponding transcription factors identified in the IL2 gene. The antigen receptor response elements (ARRE-1 and
ARRE-2) originally described by Durand et al. [83] are located, respectively,!95 to!60 and!283 to!243 relative to the transcription start site and contains
binding sites for NFAT, AP-1, Oct-1 [38].
20
An approximately 300bp minimal enhancer region upstream of the IL-2 gene
transcription start site possesses consensus binding sites for several transcription factors,
including NFAT, the activator protein 1 (AP-1), NFκB, and Octamer-binding protein
(Oct), as well as additional regulatory sites such as the CD28 responsive element
(CD28RE) [76]. All these positive regulatory elements need to be occupied by
corresponding transcription factors for optimal IL-2 transcription (Figure 5) [74].
a. NFAT
The IL-2 promoter contains four binding sites for NFAT family transcription
factors. Five NFAT family members have been identified, NFATc1 (also known as
NFAT2 or NFATc), NFATc2 (also known as NFAT1 or NFATp), NFATc3, NFATc4
and NFATc5, among which NFATc1, NFATc2 and NFATc3 all contribute to IL-2 gene
regulation, with NFATc1 and NFATc2 the major players. Except NFATc5, the other four
members are regulated by intracellular calcium levels. Calcium influx activates
calcineurin, which dephosphorylates NFAT, leading to its nuclear translocation [77].
NFATc2 accounts for 80-90% of NFAT in resting T cells, and rapidly
translocates to the nucleus following activation, thus playing an essential role in
regulating an early stage response [78]. NFATc1 expression is induced following T cell
activation, therefore regulating a later stage of IL-2 gene transcription. IL-2 gene
expression was minimally altered in mice deficient in either NFATc1 [79] or NFATc2
[80], while severely impaired in mice deficient in both [81].
b. AP-1
AP-1 is a dimer of two basic region-leucine zipper proteins (bZIP), typically
composed of Fos and Jun family proteins. c-Fos and c-Jun are the major components to
21
form AP-1 in the context of regulating IL-2 gene [74]. c-Jun is the most potent
transcriptional activator in the Jun family, and like other Jun proteins, can form both
homo- and hetero- dimers. The Fos protein cannot homodimerize; they instead form
heterodimers with Jun proteins and thereby enhance their DNA binding affinity [82].
Both c-Fos and c-Jun contain transactivation potency after stimulation, and Fos-Jun
heterodimers are more effective at DNA binding and transcriptional activation than Jun-
Jun homodimers [76].
Signaling from TCR and CD28 activates JNK through both PKC and Rac
mediated pathways [74]. JNK translocates to the nucleus and phosphorylates c-Jun at N-
terminal transactivation domain and results in a robust induction of c-Jun transactivation
activity [83]. In addition to post-translational regulation, c-Jun activity is also regulated at
the expression level. The promoter region of both c-Jun and c-Fos contain AP-1 binding
sites, and are therefore regulated by AP-1 itself as a feed-forward mechanism [83]. The
expression level of c-Fos is very low in naive T cells and T cell activation requires its de
novo synthesis [84]. Signaling from TCR activates the Ras-Raf-ERK pathway and leads
to the nuclear translocation of ERK to phosphorylate transcription factors, such as Elk1,
to initiate the transcription of c-Fos [82].
AP-1 tends to cooperate with other transcription factors, such as NFAT, NFκB
and Oct-1, to enhance their DNA binding affinity [46, 72]. Overexpression of Fos and
Jun family protein augments NFAT-driven transcription [76], and a dominant -negative
mutant of c-Jun inhibits NFAT transcriptional activity and prevents IL-2 gene
transcription [85].
22
c. NFκB
The IL-2 promoter contains two NFκB binding sites, with one located in the
CD28RE, which is responsible for the responsiveness of IL-2 gene to CD28
costimulation signal [74]. NFκB is the major target of CD28 signaling to activate IL-2
transcription.
NFκB family is composed of two groups of proteins, NFκB proteins NFκB1 (p50)
and NFκB2 (p52), and Rel proteins RelA (p65), RelB and c-Rel. NFκB1 and NFκB2 are
synthesized as precursor proteins p105 and p100, respectively, and processed to yield
mature proteins. The mature NFκB proteins contain Rel homology region (RHR), which
is responsible for dimerization, DNA binding and interaction with inhibitors of κB (IκB),
and also contains a nuclear localization signal (NLS) [86]. In addition to RHR, Rel
proteins also contain transcriptional activation domains. Members of the two groups of
proteins can form homo- or hetero-dimers as functional NFκB transcription factors [87].
p50-p50 and p52-p52 homo-dimers that lack transcriptional activation domains appear to
repress transcription [86].
In the resting state, NFκB dimers are sequestered by IκB proteins in the
cytoplasm. Nuclear translocation of NFκB requires liberation from IκB, which depends
on degradation of IκB by the proteasome [86]. Phosphorylation of IκB by the IκB kinase
(IKK) complex marks it for ubiquitination. IKK is a multi-subunit complex with three
core components, an adaptor protein IKKγ (ΝΕΜΟ), and a dimer of catalytic subunits
IKKα/β [88]. Signaling from both TCR and CD28 merges to activate PKCθ, which
directly phosphorylates Carma1, resulting in recruitment of Bcl10 and Malt1 to the
23
plasma membrane [89–91]. Carma1, Bcl10 and Malt1, often referred to as the CBM
complex, mediate the activation of IKK complex through a mechanism that has not been
fully understood [92], which at least involves ubiquitination of IKKγ [93] and
phosphorylation of the catalytic subunit IKKβ [90, 91].
Besides the canonical IκB inhibitory mechanism, a non-canonical pathway
depends on IKKα−mediated phosphorylation and processing of p100 associated with
RelB, generating mature p52/RelB complex that is able to translocate to the nucleus [95].
T cell activation mainly depends on the canonical pathway, with p50, RelA and c-Rel
demonstrated targets of TCR or CD28 signaling [88]. Independent of IκB activity,
phosphorylation of RelA is also important for its transcriptional activity, partially due to
increased association with co-activators such as CREB binding protein (CBP)/p300 [96].
Activated NFκB is generally composed of p50-p65 and p50-c-Rel. p65 probably
mediates early time points of IL-2 gene transcription, and c-Rel contributes to later. c-Rel
may be the major NFκB component mediating activation of the CD28RE [97].
d. Oct
The IL-2 promoter contains two binding sites for Oct family proteins, and both
sites contribute to IL-2 promoter activity [98]. The proximal Oct binding site is a
composite element, to which Oct and AP-1 bind cooperatively [99]. Oct-1 is
constitutively expressed, while Oct-2 is lymphocyte specific and its expression is induced
by stimulation. The Jurkat T cell line was reported to lack Oct-2 protein but completely
capable of IL-2 gene transcription [98].
24
e. CREB/CREM
The cAMP response element-binding protein (CREB) family consists of CREB,
the cAMP response element modulator (CREM) and the activating transcription factor-1
(ATF-1) [96, 97]. CREB family proteins bind to DNA as a dimer through the cAMP-
response element (CRE) [100]. IL-2 gene contains a CRE site at -180 region and
mutation of this site almost completely abolishes IL-2 transcription [102]. T cells from
transgenic mice expressing a dominant-negative form of CREB have a remarkable defect
in proliferation and IL-2 production following activation [103].
Although sharing a high level of sequence homology with CREB, CREM either
forms a homodimer or heterodimer with CREB and functions as a transcriptional
repressor [104]. Increased expression of CREMα protein is proposed as the central cause
of decreased IL-2 production in systemic lupus erythematosus (SLE) T cells [105].
Antisense CREM enhanced the accessibility of the IL-2 promoter to endonucleases and
prevents the condensation of chromatin [106]. CREB transcriptional activity depends on
phosphorylation of serine 133. Once phosphorylated, pCREB associates with its co-
activator, CBP, or its paralogue p300, to initiate transcription of target genes [100]. Later,
pCREB is dephosphorylated, and CREM is produced and gradually replaces CREB to
bind to the CRE site, resulting in downregulation of IL-2 gene [107].
f. Sp1/Egr-1
An overlapping binding site for two zinc finger transcription factors, Sp1 and the
early growth response protein-1 (Egr-1) is located immediately upstream of the distal
NFAT/AP-1 binding site within the minimal IL-2 promoter [108]. In resting cells, only
the constitutively expressed Sp1 protein binds to this region, whereas upon stimulation
25
the inducible protein Egr-1 replaces Sp1 and regulates IL-2 transcription via synergistic
interaction with NFATc1 [109]. NGFI-A-binding protein 2 (NAB2) is recruited by Egr-1
to IL-2 promoter and acts as a co-activator of T cell function by promoting Egr-1-
mediated IL-2 production [110].
g. GABP
The Ets family transcription factor GA binding protein (GABP) is a heterodimer
of GABP α and β that binds to a distal enhancer of the IL-2 gene upstream of the 300bp
minimal promoter region [111]. GABP contributes to IL-2 transcriptional activation
through the ERK and JNK/SAPK pathways [111].
h. Transcriptional Repressors
Besides CREMα mentioned above, several other transcriptional repressors have
been identified that contribute to restriction of IL-2 production and induction of T cell
anergy.
The zinc finger E-box-binding protein (ZEB) 1 binds to the negative regulatory
element NRE-A located at -100 upstream from the TSS [112]. ZEB1 recruits C-terminal-
binding protein (CtBP) 2 and histone deacetylase 1 (HDAC1) to repress IL-2 gene
expression [113]. ZEB1 mediated transcriptional repression has been shown to contribute
to the IL-2 gene silencing in activated Th2 cells [114].
The IL-2 promoter has two consensus binding sites for Ikaros, a component of the
nucleosome remodeling and DNA methylation complex (NURD) [115]. Ikaros has been
shown to repress IL-2 gene expression in CD4+ T cells through recruiting chromatin
remodeling complexes [115] and therefore is required for anergy induction in CD4+ T
cells [111, 112].
26
NFκB p50-p50 homodimers lack transactivation domains and act as
transcriptional repressors [86]. In tolerant CD4+ T cells that do not produce IL-2, the
intracellular level of p50 protein is increased [117] and predominant p50-p50
homodimers bind to the NFκB binding site of the IL-2 promoter instead of p50-p65
[118].
i. Epigenetic Modification and Chromatin Remodeling
Epigenetic modifications of the IL-2 promoter region regulate the accessibility of
the DNA to transcription factors and serve as a memory of the regulatory event [119].
Anti-CD3/CD28 stimulation of human CD4+ T cells induces active demethylation of a
specific CpG site in the NFAT/Oct-1 binding element, and this modification is required
for transcription factors binding to DNA and subsequent histone modification [119].
Upstream of the 300bp minimal enhancer, additional CpG methylation sites are also
demethylated [120]. CpG demethylation seems to be stable once initiated, and therefore
acts as an epigenetic memory to contribute to a more rapid response upon re-activation
[115, 116].
Chromatin structure at the IL-2 promoter region is also dynamically remodeled to
become more accessible upon activation. The human IL-2 promoter can assemble a
positioned nucleosome that occludes the binding of transcription factors to functional
elements in resting state. The region becomes remodeled upon activation in Jurkat T cells
[121]. Costimulation through both TCR and CD28 leads to histone acetylation and loss of
cytosine methylation at the IL-2 promoter, accompanied by extensive remodeling of the
chromatin [122].
27
j. Post-transcriptional Regulation
IL-2 mRNA level is not only regulated at the level of transcriptional initiation, but
also mRNA stability. IL-2 mRNA contains several AU-rich (AUUUA) elements (AREs)
in its 3' untranslated region (UTR), which is known as a common indicator of mRNA
instability [123]. After stimulation with anti-CD3/CD28 antibodies, the relatively short
half-life of IL-2 mRNA is significantly prolonged [124]. TCR and CD28 costimulation
mediated regulation of mRNA stability requires the 3' [125] and 5' -UTR [126] as well as
sequences within the coding region [127].
ARE directed mRNA decay can be positively or negatively regulated in response
to extracellular stimuli. NF90 is an RNA binding protein that recognizes and binds AREs
in 3'-UTR region and therefore decelerates IL-2 mRNA degradation [125]. NF90
localizes in the nucleus in resting Jurkat cells, and translocates to the cytoplasm in
response to stimulation where it binds to mRNA [125]. Nuclear export of NF90,
mediated by Akt-dependent phosphorylation in response to CD28 costimulation, is
required for IL-2 mRNA stabilization [121, 124].
Another signaling pathway that contributes to IL-2 mRNA stabilization is the
JNK pathway [126], which functions through a JNK response element (JRE) in the 5'-
UTR that binds to two RNA binding proteins, nucleolin and YB-1 [129]. CD28 signaling
also acts through sequences within the coding region of exon 2 and exon 4 to stabilize the
IL-2 mRNA [127]. In contrast, CD28 signaling, at later times, enhances IL-2 mRNA
decay through sequences localized between exon 3 and the stop codon [127], ensuring a
tightly regulated response.
28
C. Diseases Related to Abnormal Activation of T Cells
Autoimmunity is a loss of tolerance to multiple self-antigens. SLE is an
autoimmune disease characterized as autoantibody production and inflammatory cell
infiltration into target organs [130]. T cells play a critical role in the pathogenesis of SLE
as they regulate and assist autoreactive B cells. T cells from SLE patients resemble naive
or anergic T cells in certain ways, but at same time carry characteristics reminiscent of
activated T cells [130]. In SLE T cells, the TCR ζ chain is replaced by the Fc receptor
(FcR) γ chain, which recruits spleen tyrosine kinase (Syk) instead of ZAP-70 [131]. Syk
is a more efficient signal transducer and results in a hyper-phosphorylation of
downstream signaling molecules [132] and increased calcium influx [133]. Increased
calcium influx leads to abnormally high NFAT dephosphorylation, which accounts for
enhanced transcription of multiple target genes such as CD40L (CD154). The interaction
of CD40L on the surface of T cells and CD40 on B cells activates B cells and facilitates
autoantibody production in SLE [131]. However, SLE T cells have a reduced ability to
produce IL-2, despite the increased NFAT activity [130]. Several key transcription
factors that regulate IL-2 expression have decreased expression levels in SLE T cells,
including Rel-A [134], c-Fos [135] and CREB [136], while the transcription repressor,
CREMα, has increased activity [106]. Impaired IL-2 production is responsible for
decreased activation-induced cell death and extensive survival of autoreactive
lymphocytes [137], as well as reduced Treg cell function [138].
Treg cells are essential for the maintenance of self-tolerance and immune
homeostasis, and therefore play a protective role in autoimmune diseases. Defects in Treg
numbers and function have been shown in human autoimmunity and a restoration in
29
model systems can prevent and reverse disease [139]. Another subset of T helper cells,
Th17 cells, and their effector molecules, actively participate in the pathogenesis of
multiple autoimmune diseases, such as SLE and rheumatoid arthritis (RA) [140].
Allergic diseases are characterized as a hypersensitive response toward an
innocuous antigen, which comprise two main components of the immune response: an
abnormal polarization of naive Th0 cells to differentiate into Th2 phenotype and class
switching to IgE in B lymphocytes [31]. T cell activation and cytokine secretion are
essential mediators in allergy. A preferential skewing to expansion of the Th2
lymphocytes is the crucial forerunner to the pathogenesis of allergic diseases [141].
Excessive Th2 cytokine expression and a reduced production of Th1 cytokine IFNγ is
noted in atopic disease [141]. Therefore, preventing or reversing the process of abnormal
Th2 polarization has been a focus for the development of new therapeutic strategies to
control allergies and asthma [141]. Recently, IL17-producing Th17 cells have been
shown to play a role in driving cytokine production, neutrophil recruitment and airway
hyperresponsiveness in steroid-resistant asthma [142]. The cytokine IL-17 family has
increased levels in asthma and COPD and promotes airway neutrophilia and allergic
responses [142]. In contrast, Tregs have shown reductions in numbers and capacity to
suppress effector T cells and Th2 cytokine production in asthma [143], implicating their
role in modulation and suppression of allergic airway responses.
D. Inhibitors of T cell Activation and Their Therapeutic Uses
Inhibitors of T cell activation are commonly used as immunosuppressants in
transplantation, autoimmune diseases, and allergic asthma. Glucocorticoids (GCs) are the
30
first immunosuppressants used in transplantation [144]. By binding to GC receptors, GCs
inhibit AP-1 and NFκB pathways, thus blocking IL-2 production in T cells [144].
Although very potent, they are the least selective inhibitors that affect lymphocytes as
well as non-lymphoid cells, therefore causing severe side effects [145].
The most well characterized inhibitors specific for T cell activation are
cyclosporin A (CsA) and tarolimus (FK506). They bind to specific immunophilins in T
cells and the drug-immunophilin complexes block activation of the calcium calmodulin-
post-receptor signaling by targeting mTOR [144]. PDE4/7 dual inhibitors, such as T-
2585, inhibit human T cell proliferation and cytokine production [182]. Our compound
BC12 inhibits T cell activation by targeting NFAT and NFκB pathways. It is important to
note that BC12 does not completely block either pathway; instead, partially reduces the
activity of both pathways, resulting in suppression of IL-2 expression. Recently, therapies
that target multiple pathways have been increasingly designed to achieve a collective
effect to treat complex diseases such as cancer [192]. It has been suggested that partial
inhibition of multiple targets can be more efficient than the complete inhibition of a
single target [193]. Therefore, BC12 can be a very promising multi-target drug that
inhibits T cell activation.
An interesting finding from our study is that BC12 augments phosphorylation
status of signaling proteins in the AP-1 signaling pathway in stimulated Jurkat cells,
while BC12 alone does not induce activation of signaling pathway. In agreement with the
Western blotting data, EMSA result suggests that BC12 considerably increases the
binding of AP-1 proteins to their specific DNA probe. We also conducted ChIP
164
experiment using antibody specific to c-Jun (data not shown), which showed increased
occupation of c-Jun to IL-2 promoter region when treated with BC12 along with stimuli.
Microarray data also indicate that the expression levels of several AP-1 regulated genes
are increased by BC12 in the presence of stimuli. Taken together, BC12 augments AP-1
signaling pathway, resulting in increased binding of AP-1 to its corresponding regulatory
elements in DNA, which may be responsible for increased expression of c-Fos, c-Jun and
IL-8 as revealed by microarray data. However, the relation between increased AP-1
activation and inhibited IL-2 expression has not been resolved. Feedback loops
commonly exist to regulate signaling pathways. It has been reported that IL-2
transcription is transient and self-limited by an auto-regulatory feedback loop, in which
IL-2 inhibits its own expression [58]. We can speculate that a novel feedback loop may
exist such that repressed downstream IL-2 expression resulted in hyper-activation of
upstream signaling pathways. Further experiments need to be conducted to validate this
hypothesis.
We further investigated the effects of BC12 and its derivative compounds in
activated mouse and human primary T cells. Our findings in Jurkat cells were well
recapitulated in both primary T cell cultures. Specifically, BC12 and BC12-4 both inhibit
IL-2 production in activated mouse and human primary T cells, whereas BC12-6 does not
exhibit a significant effect. It was confirmed in human primary T cells that inhibition of
IL-2 production is attributable to transcriptional repression by real-time PCR. It is
important to note that BC12 alone, or in combination of stimuli does not induce
significant cell death at the dose that inhibits IL-2 production. Therefore, the
165
immunosuppressive activity of BC12 is not limited to transformed cell line, but also
effective in primary T cells.
CD4+ helper T cells are divided into distinct subsets based on cytokine production
and immune function. Th1 cells produce IL-12 and IFNγ, promoting cell-mediated
immune response. Th2 cells produce IL-4, IL-5 and IL-13, promoting humoral immunity.
Th17 cells produce IL-17, IL-22 and IL-6, which mediate neutrophil inflammation and
are increasingly implicated in steroid-insensitive asthma [194]. We sought to investigate
the effect of BC12 on T helper cell specific cytokine secretion in activated human
primary CD4+ T cells. Our data indicate that BC12 selectively inhibits Th2 cytokine and
some of the Th17 cytokine secretions. Production of the key Th1 cytokine IFNγ is not
significantly affected by BC12. These findings, although preliminary, are very promising.
Abnormal polarization of Th2 response is a key event in allergic diseases. Predominant
Th2 profile cytokine expression and a reduced production of Th1 cytokine IFNγ is noted
[141]. Th2 cytokines drive the differentiation and function of B cells and mast cells. IL-4
promotes antibody class-switching in B cells, leading to the secretion of IgE. IgE binds to
receptors on mast cells, resulting in release of mediators such as histamines that lead to
tissue inflammation. IL-5 stimulates B cell growth and antibody secretion and mediates
eosinophil activation [195]. Immunomodulatory compounds such as suplatast tosilate,
which inhibits IL-4 and IL-5 production but not IFNγ [196], have been proven effective
in clinical application [32, 33]. The potential of BC12 on selectively inhibiting Th2
cytokines is a very interesting and promising direction for developing novel therapeutic
agents to treat allergic diseases. Further experiments need to be carried out to confirm the
effects of BC12 on key cytokine production and gene expression such as IL-4, IL-5 and
166
IFNγ. Instead of total CD4+ T cells, Th1 and Th2 cells can be induced for more specific
analysis. Furthermore, in addition to cytokine inhibition, BC12 can be tested for its
potential to inhibit Th2 cell differentiation and to increase Th1/Th2 ratio.
In summary, our studies report that BC12, a novel in vitro PDE7 inhibitor,
inhibits IL-2 expression in activated Jurkat cells, mouse and human primary T cells, by
targeting NFAT and NFκB-mediated pathways as summarized in Figure 7. Moreover,
our findings also suggest that BC12 has a potential to selectively inhibit Th2 cytokines.
The immunosuppressive and potential immunomodulatory effects mark BC12 a
promising therapeutic agent that worth further investigation.
Figure 7. Summary of mechanism of inhibition of BC12.
TCR$ CD28$
IL"2$$
NFAT$ Fos$
NFκB$IκB$
Oct21$
CREB$
BC12%
Jun$
AP21$
P
P U
U
PU
U
degrada>on$
IKK$BC12%
MHC2pep>de$ B7$
IL"2$mRNA$$AAAAAA$m7G$
NFAT$ NFκB$CREB$
167
II. Chapter Two
Elevating intracellular cAMP levels can result in growth arrest and apoptosis in
cancer cells, marking PDEs as potential targets for cancer treatment [199]. The
development of family-specific PDE inhibitors allows insight into the therapeutic effects
of targeting specific PDEs. PDE inhibitors have been shown to induce apoptosis in
hematological malignant cells, either alone or in synergy with glucocorticoids [6–10]. It
was reported that PDE4B overexpression correlates with higher risk of relapse of DLBCL
and limits cAMP-associated apoptosis in DLBCL [10]. PDE7B overexpression was
observed in B-CLL [7]. Both inhibitors of PDE7 and a dual inhibitor of PDE4/7
selectively induce apoptosis in CLL cells compared to normal B cells, suggesting PDE7B
as a potential therapeutic target for CLL [7]. However, inhibitors that selectively and
potently inhibit PDE7B are in need to confirm its role in CLL malignancy. As the only
commercially available PDE7 specific inhibitor, BRL50481 is a potent PDE7A inhibitor
with IC50 of 150 nM, but poor PDE7B inhibitor with IC50 of 12 µM [28]. Our novel in
vitro PDE7 inhibitor BC12 inhibits PDE7A catalytic domain with IC50 of 1 µM and full-
length rat PDE7B with IC50 of 200 nM, exhibiting significantly stronger PDE7B
inhibitory activity than BRL50481.
Using human LY18 cell line and U937 cell line as models for human DLBCL
cells and malignant monocytes, we characterized the ability of several PDE4 and/or
PDE7 inhibitors to induce cell death in human malignant B cells and monocytes. Our
data demonstrate that BC12 is the most potent compound among several in vitro PDE
inhibitors to induce cell death in both cell lines. BC12 induces cell death in a dose-
dependent manner. With a dose of 20 µM, BC12 results in approximately 90% cell death.
168
To compare the effect of BC12 on normal B cells and malignant LY18 cells, we also
titrated BC12 on human primary B cell viability. At 20 µM, BC12 induces significantly
less cell death in primary B cells than in LY18 cells, suggesting that BC12 has selectivity
in killing DLBCL cells over normal B cells. Of note, cell lines usually derive from high-
grade malignancies that carry greater abnormalities than primary tumor samples for its
ability to survive in cell culture environment. Therefore, BC12 has the potential to be
more effective in killing primary DLBCL cells than LY18 cell line.
We also confirm that BC12 induces apoptosis in both LY18 and U937 cells,
evidenced by DNA fragmentation and caspase pathway activation, which results in the
decreased viability. There are two main pathways of apoptosis in vertebrates, the
extrinsic and intrinsic pathways [200]. Extrinsic signals ligate death receptors such as Fas
receptor to activate initiator caspases such as caspase 8. Initiator caspases cleave and
activate effector caspases, such as caspase 3 and caspase 7. In the intrinsic pathway, a
BH3-only protein such as Bid triggers mitochondria permeabilization and cytochrome c
release to cytosol. Cytochrome c triggers the oligomerization of Apaf-1 and formation of
the apoptosome, where caspase 9 is activated. Caspase 9 cleaves and activates effector
caspases such as caspase 3 and caspase 7 [200]. Our data revealed that caspase 8 and
caspase 3 are activated in both cell lines treated with BC12, suggesting an involvement of
extrinsic pathway in BC12 induced apoptosis. The contribution of intrinsic pathway
cannot be ruled out and needs to be further investigated. Inhibition of cell cycle
progression can ultimately lead to apoptosis. Cell cycle analysis and BrdU staining
revealed that BC12 does not cause cell cycle arrest; instead, directly induces apoptosis
while cells are still proliferating.
169
To decipher the correlation of in vitro PDE7 inhibitory activity and apoptotic
effects in LY18 cells, derivative compounds of BC12 were tested on LY18 cell viability
for structural-activity analysis. BC12-4, which has no PDE7 inhibitory activity, reduces
LY18 cell viability to the similar level as BC12. In contrast, BC12-6, which is the most
potent PDE7 inhibitor among the derivatives except BC12, does not decrease LY18
viability. In addition, BC54, the most potent PDE4/7 dual inhibitor, does not exhibit any
effect on LY18 viability up to a dose of 100 µM. These data all together suggest that the
in vivo target of BC12 that induces apoptotic effects in LY18 cells is not PDE7. It is
important to note that the apoptotic effects of BC12 derivative compounds in LY18 cells
coincide with the IL-2 inhibitory effects in Jurkat cells as investigated in Chapter One.
Specifically, BC12, BC12-7, BC12-4 and BC12-5 all displayed potent effects in both cell
lines, whereas BC12-1, BC12-2 and BC12-6 did not. Based on these findings, we can
speculate that the in vivo targets that lead to either IL-2 inhibition in Jurkat cells or
apoptosis in LY18 cells may be the same.
In Chapter One, we demonstrate that NFκB pathway is inhibited by BC12 in
human Jurkat cells. NFκB factors regulate a vast series of genes in immune cells that
control inflammation, cell growth, differentiation or apoptosis [201]. Aberrant activation
of NFκB pathway has been frequently observed in hematologic malignancies and NFκB-
blocking approaches have been investigated as anti-caner strategies [201]. A compound
specifically targeting NFκB activity by inhibiting IκB phosphorylation induces apoptosis
of CLL cells in a dose-dependent manner [202]. The pro-apoptotic effect of NFκB
inhibitor rely on the block of NFκB-mediated expression of apoptosis-modulating genes,
170
such as BCL-2 family genes [201]. Moreover, NFκB and tumor suppressor p53 can
inhibit each other's transactivation possibly through competing for binding to the
p300/CBP coactivator [203]. It is important to note that LY18 cells carry rearranged p53,
BCL-2 and MYC genes [160]. MYC promotes cell growth activity, whereas p53 and
BCL-2 mutation permit the cells to escape apoptotic death and are responsible for the
resistance of the cell line to anti-cancer treatment [160]. Taken together, we can
hypothesize that inhibiting p53 and BCL-2 activity by targeting NFκB pathway can
induce a differential apoptotic effect between LY18 cells and human normal B cells,
which is a reasonable mechanism of action by BC12. Further experiments need to be
conducted to confirm this hypothesis.
In summary, our data demonstrate that BC12 induces apoptosis in human LY18
and U937 cell lines in a dose-dependent manner. Titration of BC12 on LY18 cells and
human primary B cells revealed that BC12 induces cell death more effectively in DLBCL
LY18 cell line than normal B cells, which merits this compound further investigation as
an anti-cancer agent.
171
REFERENCES
[1] C. Lugnier, “Cyclic nucleotide phosphodiesterase (PDE) superfamily: a new target for the development of specific therapeutic agents.,” Pharmacology & therapeutics, vol. 109, no. 3, pp. 366–98, Mar. 2006.
[2] S. Pierre, T. Eschenhagen, G. Geisslinger, and K. Scholich, “Capturing adenylyl cyclases as potential drug targets.,” Nature reviews. Drug discovery, vol. 8, no. 4, pp. 321–35, Apr. 2009.
[3] D. M. Essayan, “Cyclic nucleotide phosphodiesterases.,” The Journal of allergy and clinical immunology, vol. 108, no. 5, pp. 671–80, Nov. 2001.
[4] H. R. Bourne, L. M. Lichtenstein, K. L. Melmon, C. S. Henney, Y. Weinstein, and G. M. Shearer, “Modulation of inflammation and immunity by cyclic AMP.,” Science (New York, N.Y.), vol. 184, no. 4132, pp. 19–28, Apr. 1974.
[5] A. Castro, M. J. Jerez, C. Gil, and A. Martinez, “Cyclic nucleotide phosphodiesterases and their role in immunomodulatory responses: advances in the development of specific phosphodiesterase inhibitors.,” Medicinal research reviews, vol. 25, no. 2, pp. 229–44, Mar. 2005.
[6] J. A. Meyers, D. W. Su, and A. Lerner, “Chronic lymphocytic leukemia and B and T cells differ in their response to cyclic nucleotide phosphodiesterase inhibitors.,” Journal of immunology (Baltimore, Md. : 1950), vol. 182, no. 9, pp. 5400–11, May 2009.
[7] L. Zhang, F. Murray, A. Zahno, J. R. Kanter, D. Chou, R. Suda, M. Fenlon, L. Rassenti, H. Cottam, T. J. Kipps, and P. A. Insel, “Cyclic nucleotide phosphodiesterase profiling reveals increased expression of phosphodiesterase 7B in chronic lymphocytic leukemia.,” Proceedings of the National Academy of Sciences of the United States of America, vol. 105, no. 49, pp. 19532–7, Dec. 2008.
[8] L. Zhang and P. A. Insel, “The pro-apoptotic protein Bim is a convergence point for cAMP/protein kinase A- and glucocorticoid-promoted apoptosis of lymphoid cells.,” The Journal of biological chemistry, vol. 279, no. 20, pp. 20858–65, May 2004.
[9] S. Tiwari, H. Dong, E. J. Kim, L. Weintraub, P. M. Epstein, and A. Lerner, “Type 4 cAMP phosphodiesterase (PDE4) inhibitors augment glucocorticoid-mediated apoptosis in B cell chronic lymphocytic leukemia (B-CLL) in the absence of exogenous adenylyl cyclase stimulation.,” Biochemical pharmacology, vol. 69, no. 3, pp. 473–83, Feb. 2005.
[10] P. G. Smith, F. Wang, K. N. Wilkinson, K. J. Savage, U. Klein, D. S. Neuberg, G. Bollag, M. A. Shipp, and R. C. T. Aguiar, “The phosphodiesterase PDE4B limits cAMP-associated PI3K/AKT-dependent apoptosis in diffuse large B-cell lymphoma.,” Blood, vol. 105, no. 1, pp. 308–16, Jan. 2005.
172
[11] M. A. Giembycz and S. J. Smith, “Phosphodiesterase 7A: a new therapeutic target for alleviating chronic inflammation?,” Current pharmaceutical design, vol. 12, no. 25, pp. 3207–20, Jan. 2006.
[12] K.-E. Andersson, S. Uckert, C. Stief, and P. Hedlund, “Phosphodiesterases (PDEs) and PDE inhibitors for treatment of LUTS.,” Neurourology and urodynamics, vol. 26, no. 6 Suppl, pp. 928–33, Oct. 2007.
[13] M. A. Giembycz, C. J. Corrigan, J. Seybold, R. Newton, and P. J. Barnes, “Identification of cyclic AMP phosphodiesterases 3, 4 and 7 in human CD4+ and CD8+ T-lymphocytes: role in regulating proliferation and the biosynthesis of interleukin-2.,” British journal of pharmacology, vol. 118, no. 8, pp. 1945–58, Aug. 1996.
[14] R. W. BUTCHER and E. W. SUTHERLAND, “Adenosine 3’,5'-phosphate in biological materials. I. Purification and properties of cyclic 3',5'-nucleotide phosphodiesterase and use of this enzyme to characterize adenosine 3',5'-phosphate in human urine.,” The Journal of biological chemistry, vol. 237, pp. 1244–50, Apr. 1962.
[15] K. Fan Chung, “Phosphodiesterase inhibitors in airways disease.,” European journal of pharmacology, vol. 533, no. 1–3, pp. 110–7, Mar. 2006.
[16] C. Kroegel and M. Foerster, “Phosphodiesterase-4 inhibitors as a novel approach for the treatment of respiratory disease: cilomilast.,” Expert opinion on investigational drugs, vol. 16, no. 1, pp. 109–24, Jan. 2007.
[17] S. G. Dastidar, D. Rajagopal, and A. Ray, “Therapeutic benefit of PDE4 inhibitors in inflammatory diseases.,” Current opinion in investigational drugs (London, England : 2000), vol. 8, no. 5, pp. 364–72, May 2007.
[18] T. Michaeli, T. J. Bloom, T. Martins, K. Loughney, K. Ferguson, M. Riggs, L. Rodgers, J. A. Beavo, and M. Wigler, “Isolation and characterization of a previously undetected human cAMP phosphodiesterase by complementation of cAMP phosphodiesterase-deficient Saccharomyces cerevisiae.,” The Journal of biological chemistry, vol. 268, no. 17, pp. 12925–32, Jun. 1993.
[19] T. Sasaki, J. Kotera, K. Yuasa, and K. Omori, “Identification of human PDE7B, a cAMP-specific phosphodiesterase.,” Biochemical and biophysical research communications, vol. 271, no. 3, pp. 575–83, May 2000.
[20] T. Sasaki, J. Kotera, and K. Omori, “Novel alternative splice variants of rat phosphodiesterase 7B showing unique tissue-specific expression and phosphorylation.,” The Biochemical journal, vol. 361, no. Pt 2, pp. 211–20, Jan. 2002.
[21] J. M. Hetman, S. H. Soderling, N. A. Glavas, and J. A. Beavo, “Cloning and characterization of PDE7B, a cAMP-specific phosphodiesterase.,” Proceedings of the National Academy of Sciences of the United States of America, vol. 97, no. 1, pp. 472–6, Jan. 2000.
173
[22] S. J. Smith, S. Brookes-Fazakerley, L. E. Donnelly, P. J. Barnes, M. S. Barnette, and M. A. Giembycz, “Ubiquitous expression of phosphodiesterase 7A in human proinflammatory and immune cells.,” American journal of physiology. Lung cellular and molecular physiology, vol. 284, no. 2, pp. L279–89, Feb. 2003.
[23] N. A. Glavas, C. Ostenson, J. B. Schaefer, V. Vasta, and J. A. Beavo, “T cell activation up-regulates cyclic nucleotide phosphodiesterases 8A1 and 7A3.,” Proceedings of the National Academy of Sciences of the United States of America, vol. 98, no. 11, pp. 6319–24, May 2001.
[24] R. Lee, S. Wolda, E. Moon, J. Esselstyn, C. Hertel, and A. Lerner, “PDE7A is expressed in human B-lymphocytes and is up-regulated by elevation of intracellular cAMP.,” Cellular signalling, vol. 14, no. 3, pp. 277–84, Mar. 2002.
[25] L. Li, “CD3- and CD28-Dependent Induction of PDE7 Required for T Cell Activation,” Science, vol. 283, no. 5403, pp. 848–851, Feb. 1999.
[26] G. Yang, K. W. McIntyre, R. M. Townsend, H. H. Shen, W. J. Pitts, J. H. Dodd, S. G. Nadler, M. McKinnon, and A. J. Watson, “Phosphodiesterase 7A-deficient mice have functional T cells.,” Journal of immunology (Baltimore, Md. : 1950), vol. 171, no. 12, pp. 6414–20, Dec. 2003.
[27] L. Macrophages, C. D. T-lymphocytes, S. J. Smith, L. B. Cieslinski, R. Newton, L. E. Donnelly, P. S. Fenwick, A. G. Nicholson, P. J. Barnes, M. S. Barnette, and M. A. Giembycz, “Discovery of BRL 50481 [ 3- ( N , N-dimethylsulfonamido ) -4- methyl-nitrobenzene ], a Selective Inhibitor of Phosphodiesterase 7 : In Vitro Studies in Human Monocytes ,” vol. 66, no. 6, pp. 1679–1689, 2004.
[28] M. A. Alaamery, A. R. Wyman, F. D. Ivey, C. Allain, D. Demirbas, L. Wang, O. Ceyhan, C. S. Hoffman, B. College, C. Ave, and H. H. Rm, “New classes of PDE7 inhibitors identified by a fission yeast-based HTS,” J Biomol Screen, vol. 15, no. 4, pp. 359–367, 2011.
[29] M. Humar, S. E. Pischke, T. Loop, A. Hoetzel, R. Schmidt, C. Klaas, H. L. Pahl, K. K. Geiger, and B. H. J. Pannen, “Barbiturates directly inhibit the calmodulin/calcineurin complex: a novel mechanism of inhibition of nuclear factor of activated T cells.,” Molecular pharmacology, vol. 65, no. 2, pp. 350–61, Feb. 2004.
[30] M. Humar, N. Andriopoulos, S. E. Pischke, T. Loop, R. Schmidt, A. Hoetzel, M. Roesslein, H. L. Pahl, K. K. Geiger, and B. H. J. Pannen, “Inhibition of activator protein 1 by barbiturates is mediated by differential effects on mitogen-activated protein kinases and the small G proteins ras and rac-1.,” The Journal of pharmacology and experimental therapeutics, vol. 311, no. 3, pp. 1232–40, Dec. 2004.
[31] C. A. J. Janeway, P. Travers, M. Walport, and M. J. Shlomchik, Immunobiology the immune system in health and disease 6th edition. Garland Science, 2005.
174
[32] E. Sebzda, S. Mariathasan, T. Ohteki, R. Jones, M. F. Bachmann, and P. S. Ohashi, “Selection of the T cell repertoire,” Annual review of immunology, vol. 17, no. 3, pp. 829–874, 1999.
[33] E. V Rothenberg, “T-lineage specification and commitment : a gene regulation perspective,” vol. 14, no. 02, pp. 431–440, 2002.
[34] C. a London, a K. Abbas, and a Kelso, “Helper T cell subsets: heterogeneity, functions and development.,” Veterinary immunology and immunopathology, vol. 63, no. 1–2, pp. 37–44, May 1998.
[35] D. R. Littman and A. Y. Rudensky, “Th17 and regulatory T cells in mediating and restraining inflammation.,” Cell, vol. 140, no. 6, pp. 845–58, Mar. 2010.
[36] Y. K. Lee, R. Mukasa, R. D. Hatton, and C. T. Weaver, “Developmental plasticity of Th17 and Treg cells.,” Current opinion in immunology, vol. 21, no. 3, pp. 274–80, Jun. 2009.
[37] S. Chapoval, P. Dasgupta, N. J. Dorsey, and A. D. Keegan, “Regulation of the T helper cell type 2 (Th2)/T regulatory cell (Treg) balance by IL-4 and STAT6.,” Journal of leukocyte biology, vol. 87, no. 6, pp. 1011–8, Jun. 2010.
[38] E. Bettelli, Y. Carrier, W. Gao, T. Korn, T. B. Strom, M. Oukka, H. L. Weiner, and V. K. Kuchroo, “Reciprocal developmental pathways for the generation of pathogenic effector TH17 and regulatory T cells.,” Nature, vol. 441, no. 7090, pp. 235–8, May 2006.
[39] C. T. Weaver and R. D. Hatton, “Interplay between the TH17 and TReg cell lineages: a (co-)evolutionary perspective.,” Nature reviews. Immunology, vol. 9, no. 12, pp. 883–9, Dec. 2009.
[40] D. Mucida, Y. Park, G. Kim, O. Turovskaya, I. Scott, M. Kronenberg, and H. Cheroutre, “Reciprocal TH17 and regulatory T cell differentiation mediated by retinoic acid.,” Science (New York, N.Y.), vol. 317, no. 5835, pp. 256–60, Jul. 2007.
[41] J. L. Coombes, K. R. R. Siddiqui, C. V Arancibia-Cárcamo, J. Hall, C.-M. Sun, Y. Belkaid, and F. Powrie, “A functionally specialized population of mucosal CD103+ DCs induces Foxp3+ regulatory T cells via a TGF-beta and retinoic acid-dependent mechanism.,” The Journal of experimental medicine, vol. 204, no. 8, pp. 1757–64, Aug. 2007.
[42] C.-M. Sun, J. A. Hall, R. B. Blank, N. Bouladoux, M. Oukka, J. R. Mora, and Y. Belkaid, “Small intestine lamina propria dendritic cells promote de novo generation of Foxp3 T reg cells via retinoic acid.,” The Journal of experimental medicine, vol. 204, no. 8, pp. 1775–85, Aug. 2007.
[43] M. J. Benson, K. Pino-Lagos, M. Rosemblatt, and R. J. Noelle, “All-trans retinoic acid mediates enhanced T reg cell growth, differentiation, and gut homing in the face of high
175
levels of co-stimulation.,” The Journal of experimental medicine, vol. 204, no. 8, pp. 1765–74, Aug. 2007.
[44] I. I. Ivanov, B. S. McKenzie, L. Zhou, C. E. Tadokoro, A. Lepelley, J. J. Lafaille, D. J. Cua, and D. R. Littman, “The orphan nuclear receptor RORgammat directs the differentiation program of proinflammatory IL-17+ T helper cells.,” Cell, vol. 126, no. 6, pp. 1121–33, Sep. 2006.
[45] S. G. Ward, “CD28: a signalling perspective.,” The Biochemical journal, vol. 318, pp. 361–77, Sep. 1996.
[46] D. Cantrell, “T cell antigen receptor signal transduction pathways.,” Annual review of immunology, vol. 14, pp. 259–74, Jan. 1996.
[47] R. J. Salmond, A. Filby, I. Qureshi, S. Caserta, and R. Zamoyska, “T-cell receptor proximal signaling via the Src-family kinases, Lck and Fyn, influences T-cell activation, differentiation, and tolerance.,” Immunological reviews, vol. 228, no. 1, pp. 9–22, Mar. 2009.
[48] S. L. Gaffen and K. D. Liu, “Overview of interleukin-2 function, production and clinical applications.,” Cytokine, vol. 28, no. 3, pp. 109–23, Nov. 2004.
[49] J. D. Powell, J. a Ragheb, S. Kitagawa-Sakakida, and R. H. Schwartz, “Molecular regulation of interleukin-2 expression by CD28 co-stimulation and anergy.,” Immunological reviews, vol. 165, pp. 287–300, Oct. 1998.
[50] O. Acuto, S. Mise-Omata, G. Mangino, and F. Michel, “Molecular modifiers of T cell antigen receptor triggering threshold: the mechanism of CD28 costimulatory receptor.,” Immunological reviews, vol. 192, pp. 21–31, Apr. 2003.
[51] C. E. Rudd, A. Taylor, and H. Schneider, “CD28 and CTLA-4 coreceptor expression and signal transduction.,” Immunological reviews, vol. 229, no. 1, pp. 12–26, May 2009.
[52] N. Isakov and A. Altman, “Protein kinase C(theta) in T cell activation.,” Annual review of immunology, vol. 20, pp. 761–94, Jan. 2002.
[54] U. Schneider, H. U. Schwenk, and G. Bornkamm, “Characterization of EBV-genome negative ‘null’ and ‘T’ cell lines derived from children with acute lymphoblastic leukemia and leukemic transformed non-Hodgkin lymphoma.,” International journal of cancer. Journal international du cancer, vol. 19, no. 5, pp. 621–6, May 1977.
[55] G. Pawelec, A. Borowitz, P. H. Krammer, and P. Wernet, “Constitutive interleukin 2 production by the JURKAT human leukemic T cell line.,” European journal of immunology, vol. 12, no. 5, pp. 387–92, May 1982.
176
[56] D. A. Morgan, F. W. Ruscetti, and R. Gallo, “Selective in vitro growth of T lymphocytes from normal human bone marrows.,” Science, vol. 193, no. 4257, pp. 1007–8, Sep. 1976.
[57] W. Liao, J.-X. Lin, and W. J. Leonard, “IL-2 family cytokines: new insights into the complex roles of IL-2 as a broad regulator of T helper cell differentiation.,” Current opinion in immunology, vol. 23, no. 5, pp. 598–604, Oct. 2011.
[58] T. R. Malek, “The biology of interleukin-2.,” Annual review of immunology, vol. 26, pp. 453–79, Jan. 2008.
[59] L. Van Parijs and A. K. Abbas, “Homeostasis and self-tolerance in the immune system: turning lymphocytes off.,” Science, vol. 280, no. 5361, pp. 243–8, Apr. 1998.
[60] T. R. Malek and A. L. Bayer, “Tolerance, not immunity, crucially depends on IL-2.,” Nature reviews. Immunology, vol. 4, no. 9, pp. 665–74, Sep. 2004.
[61] O. Boyman and J. Sprent, “The role of interleukin-2 during homeostasis and activation of the immune system.,” Nature reviews. Immunology, vol. 12, no. 3, pp. 180–90, Jan. 2012.
[62] W. Strober and R. O. Ehrhardt, “Chronic intestinal inflammation: an unexpected outcome in cytokine or T cell receptor mutant mice.,” Cell, vol. 75, no. 2, pp. 203–5, Oct. 1993.
[63] B. Sadlack, J. Löhler, H. Schorle, G. Klebb, H. Haber, E. Sickel, R. J. Noelle, and I. Horak, “Generalized autoimmune disease in interleukin-2-deficient mice is triggered by an uncontrolled activation and proliferation of CD4+ T cells.,” European journal of immunology, vol. 25, no. 11, pp. 3053–9, Nov. 1995.
[64] M. Wolf, A. Schimpl, and T. Hünig, “Control of T cell hyperactivation in IL-2-deficient mice by CD4(+)CD25(-) and CD4(+)CD25(+) T cells: evidence for two distinct regulatory mechanisms.,” European journal of immunology, vol. 31, no. 6, pp. 1637–45, Jun. 2001.
[65] T. R. Malek, A. Yu, V. Vincek, P. Scibelli, and L. Kong, “CD4 regulatory T cells prevent lethal autoimmunity in IL-2Rbeta-deficient mice. Implications for the nonredundant function of IL-2.,” Immunity, vol. 17, no. 2, pp. 167–78, Aug. 2002.
[66] M. A. Burchill, C. A. Goetz, M. Prlic, J. J. O’Neil, I. R. Harmon, S. J. Bensinger, L. A. Turka, P. Brennan, S. C. Jameson, and M. A. Farrar, “Distinct effects of STAT5 activation on CD4+ and CD8+ T cell homeostasis: development of CD4+CD25+ regulatory T cells versus CD8+ memory T cells.,” Journal of immunology (Baltimore, Md. : 1950), vol. 171, no. 11, pp. 5853–64, Dec. 2003.
[67] J. W. Snow, N. Abraham, M. C. Ma, B. G. Herndier, A. W. Pastuszak, and M. A. Goldsmith, “Loss of tolerance and autoimmunity affecting multiple organs in STAT5A/5B-deficient mice.,” Journal of immunology (Baltimore, Md. : 1950), vol. 171, no. 10, pp. 5042–50, Nov. 2003.
177
[68] A. Antov, L. Yang, M. Vig, D. Baltimore, and L. Van Parijs, “Essential role for STAT5 signaling in CD25+CD4+ regulatory T cell homeostasis and the maintenance of self-tolerance.,” Journal of immunology (Baltimore, Md. : 1950), vol. 171, no. 7, pp. 3435–41, Oct. 2003.
[69] W. Liao, J.-X. Lin, L. Wang, P. Li, and W. J. Leonard, “Modulation of cytokine receptors by IL-2 broadly regulates differentiation into helper T cell lineages.,” Nature immunology, vol. 12, no. 6, pp. 551–9, Jun. 2011.
[70] J. Cote-Sierra, G. Foucras, L. Guo, L. Chiodetti, H. A. Young, J. Hu-Li, J. Zhu, and W. E. Paul, “Interleukin 2 plays a central role in Th2 differentiation.,” Proceedings of the National Academy of Sciences of the United States of America, vol. 101, no. 11, pp. 3880–5, Mar. 2004.
[71] W. Liao, D. E. Schones, J. Oh, Y. Cui, K. Cui, T.-Y. Roh, K. Zhao, and W. J. Leonard, “Priming for T helper type 2 differentiation by interleukin 2-mediated induction of interleukin 4 receptor alpha-chain expression.,” Nature immunology, vol. 9, no. 11, pp. 1288–96, Nov. 2008.
[72] X.-P. Yang, K. Ghoreschi, S. M. Steward-Tharp, J. Rodriguez-Canales, J. Zhu, J. R. Grainger, K. Hirahara, H.-W. Sun, L. Wei, G. Vahedi, Y. Kanno, J. J. O’Shea, and A. Laurence, “Opposing regulation of the locus encoding IL-17 through direct, reciprocal actions of STAT3 and STAT5.,” Nature immunology, vol. 12, no. 3, pp. 247–54, Mar. 2011.
[73] A. Laurence, C. M. Tato, T. S. Davidson, Y. Kanno, Z. Chen, Z. Yao, R. B. Blank, F. Meylan, R. Siegel, L. Hennighausen, E. M. Shevach, and J. J. O’shea, “Interleukin-2 signaling via STAT5 constrains T helper 17 cell generation.,” Immunity, vol. 26, no. 3, pp. 371–81, Mar. 2007.
[74] H. P. Kim, J. Imbert, and W. J. Leonard, “Both integrated and differential regulation of components of the IL-2/IL-2 receptor system.,” Cytokine & growth factor reviews, vol. 17, no. 5, pp. 349–66, Oct. 2006.
[75] J. C. Crispín and G. C. Tsokos, “Transcriptional regulation of IL-2 in health and autoimmunity.,” Autoimmunity reviews, vol. 8, no. 3, pp. 190–5, Jan. 2009.
[76] J. Jain, C. Loh, and A. Rao, “Transcriptional regulation of the IL-2 gene.,” Current opinion in immunology, vol. 7, no. 3, pp. 333–42, Jun. 1995.
[77] C. Loh, K. T. Shaw, J. Carew, J. P. Viola, C. Luo, B. A. Perrino, and A. Rao, “Calcineurin binds the transcription factor NFAT1 and reversibly regulates its activity.,” The Journal of biological chemistry, vol. 271, no. 18, pp. 10884–91, May 1996.
[78] F. Macian, “NFAT proteins: key regulators of T-cell development and function.,” Nature reviews. Immunology, vol. 5, no. 6, pp. 472–84, Jun. 2005.
178
[79] H. Yoshida, H. Nishina, H. Takimoto, L. E. Marengère, A. C. Wakeham, D. Bouchard, Y. Y. Kong, T. Ohteki, A. Shahinian, M. Bachmann, P. S. Ohashi, J. M. Penninger, G. R. Crabtree, and T. W. Mak, “The transcription factor NF-ATc1 regulates lymphocyte proliferation and Th2 cytokine production.,” Immunity, vol. 8, no. 1, pp. 115–24, Jan. 1998.
[80] M. R. Hodge, A. M. Ranger, F. Charles de la Brousse, T. Hoey, M. J. Grusby, and L. H. Glimcher, “Hyperproliferation and dysregulation of IL-4 expression in NF-ATp-deficient mice.,” Immunity, vol. 4, no. 4, pp. 397–405, Apr. 1996.
[81] S. L. Peng, A. J. Gerth, A. M. Ranger, and L. H. Glimcher, “NFATc1 and NFATc2 together control both T and B cell activation and differentiation.,” Immunity, vol. 14, no. 1, pp. 13–20, Jan. 2001.
[82] E. Shaulian and M. Karin, “AP-1 as a regulator of cell life and death.,” Nature cell biology, vol. 4, no. 5, pp. E131–6, May 2002.
[83] Q. Meng and Y. Xia, “c-Jun, at the crossroad of the signaling network.,” Protein & cell, vol. 2, no. 11, pp. 889–98, Nov. 2011.
[84] K. J. Kovács, “c-Fos as a transcription factor: a stressful (re)view from a functional map.,” Neurochemistry international, vol. 33, no. 4, pp. 287–97, Oct. 1998.
[85] D. Petrak, S. A. Memon, M. J. Birrer, J. D. Ashwell, and C. M. Zacharchuk, “Dominant negative mutant of c-Jun inhibits NF-AT transcriptional activity and prevents IL-2 gene transcription.,” Journal of immunology, vol. 153, no. 5, pp. 2046–51, Sep. 1994.
[86] M. Karin and Y. Ben-Neriah, “Phosphorylation meets ubiquitination: the control of NF-[kappa]B activity.,” Annual review of immunology, vol. 18, pp. 621–63, Jan. 2000.
[87] D. Thanos and T. Maniatis, “NF-kappa B: a lesson in family values.,” Cell, vol. 80, no. 4, pp. 529–32, Feb. 1995.
[88] L. P. Kane, J. Lin, and A. Weiss, “It’s all Rel-ative: NF-kappaB and CD28 costimulation of T-cell activation.,” Trends in immunology, vol. 23, no. 8, pp. 413–20, Aug. 2002.
[89] O. Gaide, B. Favier, D. F. Legler, D. Bonnet, B. Brissoni, S. Valitutti, C. Bron, J. Tschopp, and M. Thome, “CARMA1 is a critical lipid raft-associated regulator of TCR-induced NF-kappa B activation.,” Nature immunology, vol. 3, no. 9, pp. 836–43, Sep. 2002.
[90] D. Wang, Y. You, S. M. Case, L. M. McAllister-Lucas, L. Wang, P. S. DiStefano, G. Nuñez, J. Bertin, and X. Lin, “A requirement for CARMA1 in TCR-induced NF-kappa B activation.,” Nature immunology, vol. 3, no. 9, pp. 830–5, Sep. 2002.
[91] O. Gaide, F. Martinon, O. Micheau, D. Bonnet, M. Thome, and J. Tschopp, “Carma1, a CARD-containing binding partner of Bcl10, induces Bcl10 phosphorylation and NF-kappaB activation.,” FEBS letters, vol. 496, no. 2–3, pp. 121–7, May 2001.
179
[92] J. Cheng, A. Montecalvo, and L. P. Kane, “Regulation of NF-κB induction by TCR/CD28.,” Immunologic research, vol. 50, no. 2–3, pp. 113–7, Aug. 2011.
[93] H. Sebban, S. Yamaoka, and G. Courtois, “Posttranslational modifications of NEMO and its partners in NF-kappaB signaling.,” Trends in cell biology, vol. 16, no. 11, pp. 569–77, Nov. 2006.
[94] H. Häcker and M. Karin, “Regulation and function of IKK and IKK-related kinases.,” Science’s STKE : signal transduction knowledge environment, vol. 2006, no. 357, p. re13, Oct. 2006.
[95] A. Oeckinghaus, M. S. Hayden, and S. Ghosh, “Crosstalk in NF-κB signaling pathways.,” Nature immunology, vol. 12, no. 8, pp. 695–708, Aug. 2011.
[96] S. Ghosh and M. Karin, “Missing pieces in the NF-kappaB puzzle.,” Cell, vol. 109 Suppl, pp. S81–96, Apr. 2002.
[97] V. S. Shapiro, K. E. Truitt, J. B. Imboden, and a Weiss, “CD28 mediates transcriptional upregulation of the interleukin-2 (IL-2) promoter through a composite element containing the CD28RE and NF-IL-2B AP-1 sites.,” Molecular and cellular biology, vol. 17, no. 7, pp. 4051–8, Jul. 1997.
[98] M. P. Kamps, L. Corcoran, J. H. LeBowitz, and D. Baltimore, “The promoter of the human interleukin-2 gene contains two octamer-binding sites and is partially activated by the expression of Oct-2.,” Molecular and cellular biology, vol. 10, no. 10, pp. 5464–72, Oct. 1990.
[99] I. Pfeuffer, S. Klein-Hessling, A. Heinfling, S. Chuvpilo, C. Escher, T. Brabletz, B. Hentsch, H. Schwarzenbach, P. Matthias, and E. Serfling, “Octamer factors exert a dual effect on the IL-2 and IL-4 promoters.,” Journal of immunology, vol. 153, no. 12, pp. 5572–85, Dec. 1994.
[100] B. Mayr and M. Montminy, “Transcriptional regulation by the phosphorylation-dependent factor CREB.,” Nature reviews. Molecular cell biology, vol. 2, no. 8, pp. 599–609, Aug. 2001.
[101] A. Y. Wen, K. M. Sakamoto, and L. S. Miller, “The role of the transcription factor CREB in immune function.,” Journal of immunology (Baltimore, Md. : 1950), vol. 185, no. 11, pp. 6413–9, Dec. 2010.
[102] E. E. Solomou, Y. T. Juang, and G. C. Tsokos, “Protein kinase C-theta participates in the activation of cyclic AMP-responsive element-binding protein and its subsequent binding to the -180 site of the IL-2 promoter in normal human T lymphocytes.,” Journal of immunology (Baltimore, Md. : 1950), vol. 166, no. 9, pp. 5665–74, May 2001.
[103] K. Barton, N. Muthusamy, M. Chanyangam, C. Fischer, C. Clendenin, and J. M. Leiden, “Defective thymocyte proliferation and IL-2 production in transgenic mice expressing a dominant-negative form of CREB.,” Nature, vol. 379, no. 6560, pp. 81–5, Jan. 1996.
180
[104] D. De Cesare, G. M. Fimia, and P. Sassone-Corsi, “Signaling routes to CREM and CREB: plasticity in transcriptional activation.,” Trends in biochemical sciences, vol. 24, no. 7, pp. 281–5, Jul. 1999.
[105] C. M. Hedrich, T. Rauen, and G. C. Tsokos, “cAMP-responsive element modulator (CREM)α protein signaling mediates epigenetic remodeling of the human interleukin-2 gene: implications in systemic lupus erythematosus.,” The Journal of biological chemistry, vol. 286, no. 50, pp. 43429–36, Dec. 2011.
[106] K. Tenbrock, Y.-T. Juang, M. F. Gourley, M. P. Nambiar, and G. C. Tsokos, “Antisense cyclic adenosine 5’-monophosphate response element modulator up-regulates IL-2 in T cells from patients with systemic lupus erythematosus.,” Journal of immunology, vol. 169, no. 8, pp. 4147–52, Oct. 2002.
[107] K. Tenbrock, Y.-T. Juang, M. Tolnay, and G. C. Tsokos, “The cyclic adenosine 5’-monophosphate response element modulator suppresses IL-2 production in stimulated T cells by a chromatin-dependent mechanism.,” Journal of immunology (Baltimore, Md. : 1950), vol. 170, no. 6, pp. 2971–6, Mar. 2003.
[108] C. Skerka, E. L. Decker, and P. F. Zipfel, “A regulatory element in the human interleukin 2 gene promoter is a binding site for the zinc finger proteins Sp1 and EGR-1.,” The Journal of biological chemistry, vol. 270, no. 38, pp. 22500–6, Sep. 1995.
[109] E. L. Decker, C. Skerka, and P. F. Zipfel, “The early growth response protein (EGR-1) regulates interleukin-2 transcription by synergistic interaction with the nuclear factor of activated T cells.,” The Journal of biological chemistry, vol. 273, no. 41, pp. 26923–30, Oct. 1998.
[110] S. Collins, L. A. Wolfraim, C. G. Drake, M. R. Horton, and J. D. Powell, “Cutting Edge: TCR-induced NAB2 enhances T cell function by coactivating IL-2 transcription.,” Journal of immunology (Baltimore, Md. : 1950), vol. 177, no. 12, pp. 8301–5, Dec. 2006.
[111] A. Avots, A. Hoffmeyer, E. Flory, A. Cimanis, U. R. Rapp, and E. Serfling, “GABP factors bind to a distal interleukin 2 (IL-2) enhancer and contribute to c-Raf-mediated increase in IL-2 induction.,” Molecular and cellular biology, vol. 17, no. 8, pp. 4381–9, Aug. 1997.
[112] T. M. Williams, D. Moolten, J. Burlein, J. Romano, R. Bhaerman, A. Godillot, M. Mellon, F. J. Rauscher, and J. A. Kant, “Identification of a zinc finger protein that inhibits IL-2 gene expression.,” Science, vol. 254, no. 5039, pp. 1791–4, Dec. 1991.
[113] J. Wang, S. Lee, C. E.-Y. Teh, K. Bunting, L. Ma, and M. F. Shannon, “The transcription repressor, ZEB1, cooperates with CtBP2 and HDAC1 to suppress IL-2 gene activation in T cells.,” International immunology, vol. 21, no. 3, pp. 227–35, Mar. 2009.
[114] D. H. Yasui, T. Genetta, T. Kadesch, T. M. Williams, S. L. Swain, L. V Tsui, and B. T. Huber, “Transcriptional repression of the IL-2 gene in Th cells by ZEB.,” Journal of immunology (Baltimore, Md. : 1950), vol. 160, no. 9, pp. 4433–40, May 1998.
181
[115] R. M. Thomas, N. Chunder, C. Chen, S. E. Umetsu, S. Winandy, and A. D. Wells, “Ikaros enforces the costimulatory requirement for IL2 gene expression and is required for anergy induction in CD4+ T lymphocytes.,” Journal of immunology (Baltimore, Md. : 1950), vol. 179, no. 11, pp. 7305–15, Dec. 2007.
[116] S. Bandyopadhyay, M. Duré, M. Paroder, N. Soto-Nieves, I. Puga, and F. Macián, “Interleukin 2 gene transcription is regulated by Ikaros-induced changes in histone acetylation in anergic T cells.,” Blood, vol. 109, no. 7, pp. 2878–86, Apr. 2007.
[117] A. Sundstedt, M. Sigvardsson, T. Leanderson, G. Hedlund, T. Kalland, and M. Dohlsten, “In vivo anergized CD4+ T cells express perturbed AP-1 and NF-kappa B transcription factors.,” Proceedings of the National Academy of Sciences of the United States of America, vol. 93, no. 3, pp. 979–84, Feb. 1996.
[118] S. Grundström, P. Anderson, P. Scheipers, and A. Sundstedt, “Bcl-3 and NFkappaB p50-p50 homodimers act as transcriptional repressors in tolerant CD4+ T cells.,” The Journal of biological chemistry, vol. 279, no. 9, pp. 8460–8, Feb. 2004.
[119] A. Murayama, K. Sakura, M. Nakama, K. Yasuzawa-Tanaka, E. Fujita, Y. Tateishi, Y. Wang, T. Ushijima, T. Baba, K. Shibuya, A. Shibuya, Y. Kawabe, and J. Yanagisawa, “A specific CpG site demethylation in the human interleukin 2 gene promoter is an epigenetic memory.,” The EMBO journal, vol. 25, no. 5, pp. 1081–92, Mar. 2006.
[120] D. Bruniquel and R. H. Schwartz, “Selective, stable demethylation of the interleukin-2 gene enhances transcription by an active process.,” Nature immunology, vol. 4, no. 3, pp. 235–40, Mar. 2003.
[121] J. L. Attema, R. Reeves, V. Murray, I. Levichkin, M. D. Temple, D. J. Tremethick, and M. F. Shannon, “The human IL-2 gene promoter can assemble a positioned nucleosome that becomes remodeled upon T cell activation.,” Journal of immunology (Baltimore, Md. : 1950), vol. 169, no. 5, pp. 2466–76, Sep. 2002.
[122] R. M. Thomas, L. Gao, and A. D. Wells, “Signals from CD28 induce stable epigenetic modification of the IL-2 promoter.,” Journal of immunology (Baltimore, Md. : 1950), vol. 174, no. 8, pp. 4639–46, Apr. 2005.
[123] C. Y. Chen and A. B. Shyu, “AU-rich elements: characterization and importance in mRNA degradation.,” Trends in biochemical sciences, vol. 20, no. 11, pp. 465–70, Nov. 1995.
[124] T. Lindstein, C. H. June, J. A. Ledbetter, G. Stella, and C. B. Thompson, “Regulation of lymphokine messenger RNA stability by a surface-mediated T cell activation pathway.,” Science (New York, N.Y.), vol. 244, no. 4902, pp. 339–43, Apr. 1989.
[125] J. Shim, H. Lim, J. R Yates, and M. Karin, “Nuclear export of NF90 is required for interleukin-2 mRNA stabilization.,” Molecular cell, vol. 10, no. 6, pp. 1331–44, Dec. 2002.
182
[126] C. Y. Chen, F. Del Gatto-Konczak, Z. Wu, and M. Karin, “Stabilization of interleukin-2 mRNA by the c-Jun NH2-terminal kinase pathway.,” Science (New York, N.Y.), vol. 280, no. 5371, pp. 1945–9, Jun. 1998.
[127] J. A. Ragheb, M. Deen, and R. H. Schwartz, “CD28-Mediated regulation of mRNA stability requires sequences within the coding region of the IL-2 mRNA.,” Journal of immunology (Baltimore, Md. : 1950), vol. 163, no. 1, pp. 120–9, Jul. 1999.
[128] Y. Pei, P. Zhu, Y. Dang, J. Wu, X. Yang, B. Wan, J. O. Liu, Q. Yi, and L. Yu, “Nuclear export of NF90 to stabilize IL-2 mRNA is mediated by AKT-dependent phosphorylation at Ser647 in response to CD28 costimulation.,” Journal of immunology (Baltimore, Md. : 1950), vol. 180, no. 1, pp. 222–9, Jan. 2008.
[129] C. Y. Chen, R. Gherzi, J. S. Andersen, G. Gaietta, K. Jürchott, H. D. Royer, M. Mann, and M. Karin, “Nucleolin and YB-1 are required for JNK-mediated interleukin-2 mRNA stabilization during T-cell activation.,” Genes & development, vol. 14, no. 10, pp. 1236–48, May 2000.
[130] V. R. Moulton and G. C. Tsokos, “Abnormalities of T cell signaling in systemic lupus erythematosus.,” Arthritis research & therapy, vol. 13, no. 2, p. 207, Jan. 2011.
[131] V. C. Kyttaris and G. C. Tsokos, “Targeting lymphocyte signaling pathways as a therapeutic approach to systemic lupus erythematosus.,” Current opinion in rheumatology, vol. 23, no. 5, pp. 449–53, Sep. 2011.
[132] S. N. Liossis, X. Z. Ding, G. J. Dennis, and G. C. Tsokos, “Altered pattern of TCR/CD3-mediated protein-tyrosyl phosphorylation in T cells from patients with systemic lupus erythematosus. Deficient expression of the T cell receptor zeta chain.,” The Journal of clinical investigation, vol. 101, no. 7, pp. 1448–57, Apr. 1998.
[133] D. Vassilopoulos, B. Kovacs, and G. C. Tsokos, “TCR/CD3 complex-mediated signal transduction pathway in T cells and T cell lines from patients with systemic lupus erythematosus.,” Journal of immunology (Baltimore, Md. : 1950), vol. 155, no. 4, pp. 2269–81, Aug. 1995.
[134] H. K. Wong, G. M. Kammer, G. Dennis, and G. C. Tsokos, “Abnormal NF-kappa B activity in T lymphocytes from patients with systemic lupus erythematosus is associated with decreased p65-RelA protein expression.,” Journal of immunology (Baltimore, Md. : 1950), vol. 163, no. 3, pp. 1682–9, Aug. 1999.
[135] V. C. Kyttaris, Y.-T. Juang, K. Tenbrock, A. Weinstein, and G. C. Tsokos, “Cyclic adenosine 5’-monophosphate response element modulator is responsible for the decreased expression of c-fos and activator protein-1 binding in T cells from patients with systemic lupus erythematosus.,” Journal of immunology (Baltimore, Md. : 1950), vol. 173, no. 5, pp. 3557–63, Sep. 2004.
[136] C. G. Katsiari, V. C. Kyttaris, Y.-T. Juang, and G. C. Tsokos, “Protein phosphatase 2A is a negative regulator of IL-2 production in patients with systemic lupus erythematosus.,” The Journal of clinical investigation, vol. 115, no. 11, pp. 3193–204, Nov. 2005.
183
[137] B. Kovacs, D. Vassilopoulos, S. A. Vogelgesang, and G. C. Tsokos, “Defective CD3-mediated cell death in activated T cells from patients with systemic lupus erythematosus: role of decreased intracellular TNF-alpha.,” Clinical immunology and immunopathology, vol. 81, no. 3, pp. 293–302, Dec. 1996.
[138] D. A. Horwitz, J. D. Gray, and S. G. Zheng, “The potential of human regulatory T cells generated ex vivo as a treatment for lupus and other chronic inflammatory diseases.,” Arthritis research, vol. 4, no. 4, pp. 241–6, Jan. 2002.
[139] S. A. Long and J. H. Buckner, “CD4+FOXP3+ T regulatory cells in human autoimmunity: more than a numbers game.,” Journal of immunology (Baltimore, Md. : 1950), vol. 187, no. 5, pp. 2061–6, Sep. 2011.
[140] C. M. Wilke, K. Bishop, D. Fox, and W. Zou, “Deciphering the role of Th17 cells in human disease.,” Trends in immunology, vol. 32, no. 12, pp. 603–11, Dec. 2011.
[141] R. G. Stirling and K. F. Chung, “New immunological approaches and cytokine targets in asthma and allergy.,” The European respiratory journal : official journal of the European Society for Clinical Respiratory Physiology, vol. 16, no. 6, pp. 1158–74, Dec. 2000.
[142] J. F. Alcorn, C. R. Crowe, and J. K. Kolls, “TH17 cells in asthma and COPD.,” Annual review of physiology, vol. 72, pp. 495–516, Jan. 2010.
[143] A. N. Thorburn and P. M. Hansbro, “Harnessing regulatory T cells to suppress asthma: from potential to therapy.,” American journal of respiratory cell and molecular biology, vol. 43, no. 5, pp. 511–9, Nov. 2010.
[144] M. D. Duncan and D. S. Wilkes, “Transplant-related immunosuppression: a review of immunosuppression and pulmonary infections.,” Proceedings of the American Thoracic Society, vol. 2, no. 5, pp. 449–55, Jan. 2005.
[145] “ScienceDirect.com - Steroids - Novel insights into mechanisms of glucocorticoid action and the development of new glucocorticoid receptor ligands.” [Online]. Available: http://www.sciencedirect.com.proxy.bc.edu/science/article/pii/S0039128X07002383#. [Accessed: 12-Dec-2012].
[146] J. Liu, J. D. Farmer, W. S. Lane, J. Friedman, I. Weissman, and S. L. Schreiber, “Calcineurin is a common target of cyclophilin-cyclosporin A and FKBP-FK506 complexes.,” Cell, vol. 66, no. 4, pp. 807–15, Aug. 1991.
[147] J. Chung, C. J. Kuo, G. R. Crabtree, and J. Blenis, “Rapamycin-FKBP specifically blocks growth-dependent activation of and signaling by the 70 kd S6 protein kinases.,” Cell, vol. 69, no. 7, pp. 1227–36, Jun. 1992.
[148] C. S. Cho, “Rapamycin antagonizes cyclosporin A- and tacrolimus (FK506)-mediated augmentation of linker for activation of T cell expression in T cells,” International Immunology, vol. 15, no. 11, pp. 1369–1378, Nov. 2003.
184
[149] G. R. Ingle, T. M. Sievers, and C. D. Holt, “Sirolimus: continuing the evolution of transplant immunosuppression.,” The Annals of pharmacotherapy, vol. 34, no. 9, pp. 1044–55, Sep. 2000.
[150] C. Sommerer and M. Zeier, “AEB071--a promising immunosuppressive agent.,” Clinical transplantation, vol. 23 Suppl 2, pp. 15–8, Dec. 2009.
[151] G.-M. Deng, L. Liu, F. R. Bahjat, P. R. Pine, and G. C. Tsokos, “Suppression of skin and kidney disease by inhibition of spleen tyrosine kinase in lupus-prone mice.,” Arthritis and rheumatism, vol. 62, no. 7, pp. 2086–92, Jul. 2010.
[152] M. Fuxa and J. A. Skok, “ScienceDirect.com - Current Opinion in Immunology - Transcriptional regulation in early B cell development.” [Online]. Available: http://www.sciencedirect.com.proxy.bc.edu/science/article/pii/S0952791507000106#. [Accessed: 20-Jan-2013].
[153] R. J. Benschop and J. C. Cambier, “B cell development: signal transduction by antigen receptors and their surrogates.,” Current opinion in immunology, vol. 11, no. 2, pp. 143–51, Apr. 1999.
[154] K. S. Campbell, “Signal transduction from the B cell antigen-receptor.,” Current opinion in immunology, vol. 11, no. 3, pp. 256–64, Jun. 1999.
[155] A. A. Alizadeh, M. B. Eisen, R. E. Davis, C. Ma, I. S. Lossos, A. Rosenwald, J. C. Boldrick, H. Sabet, T. Tran, X. Yu, J. I. Powell, L. Yang, G. E. Marti, T. Moore, J. Hudson, L. Lu, D. B. Lewis, R. Tibshirani, G. Sherlock, W. C. Chan, T. C. Greiner, D. D. Weisenburger, J. O. Armitage, R. Warnke, R. Levy, W. Wilson, M. R. Grever, J. C. Byrd, D. Botstein, P. O. Brown, and L. M. Staudt, “Distinct types of diffuse large B-cell lymphoma identified by gene expression profiling.,” Nature, vol. 403, no. 6769, pp. 503–11, Feb. 2000.
[156] L. M. Staudt, “Molecular Diagnosis of the Hematologic Cancers — NEJM.” [Online]. Available: http://www.nejm.org/doi/full/10.1056/NEJMra020067. [Accessed: 21-Jan-2013].
[157] P. Tsang, E. Cesarman, A. Chadburn, Y. F. Liu, and D. M. Knowles, “Molecular characterization of primary mediastinal B cell lymphoma.,” The American journal of pathology, vol. 148, no. 6, pp. 2017–25, Jun. 1996.
[158] M. Sánchez-Beato, A. Sánchez-Aguilera, and M. A. Piris, “Cell cycle deregulation in B-cell lymphomas.,” Blood, vol. 101, no. 4, pp. 1220–35, Feb. 2003.
[159] H. Chang, H. A. Messner, X. H. Wang, C. Yee, L. Addy, J. Meharchand, and M. D. Minden, “A human lymphoma cell line with multiple immunoglobulin rearrangements.,” The Journal of clinical investigation, vol. 89, no. 3, pp. 1014–20, Mar. 1992.
185
[160] H. Chang, J. A. Blondal, S. Benchimol, M. D. Minden, and H. A. Messner, “p53 mutations, c-myc and bcl-2 rearrangements in human non-Hodgkin’s lymphoma cell lines.,” Leukemia & lymphoma, vol. 19, no. 1–2, pp. 165–71, Sep. 1995.
[161] A. D. Friedman, “Transcriptional control of granulocyte and monocyte development.,” Oncogene, vol. 26, no. 47, pp. 6816–28, Oct. 2007.
[162] D. Strauss-Ayali, S. M. Conrad, and D. M. Mosser, “Monocyte subpopulations and their differentiation patterns during infection.,” Journal of leukocyte biology, vol. 82, no. 2, pp. 244–52, Aug. 2007.
[163] C. Shi and E. G. Pamer, “Monocyte recruitment during infection and inflammation.,” Nature reviews. Immunology, vol. 11, no. 11, pp. 762–74, Nov. 2011.
[164] N. V Serbina, T. Jia, T. M. Hohl, and E. G. Pamer, “Monocyte-mediated defense against microbial pathogens.,” Annual review of immunology, vol. 26, pp. 421–52, Jan. 2008.
[165] F. Geissmann, M. G. Manz, S. Jung, M. H. Sieweke, M. Merad, and K. Ley, “Development of monocytes, macrophages, and dendritic cells.,” Science (New York, N.Y.), vol. 327, no. 5966, pp. 656–61, Feb. 2010.
[166] C. Sundström and K. Nilsson, “Establishment and characterization of a human histiocytic lymphoma cell line (U-937).,” International journal of cancer. Journal international du cancer, vol. 17, no. 5, pp. 565–77, May 1976.
[167] H. S. Koren, S. J. Anderson, and J. W. Larrick, “In vitro activation of a human macrophage-like cell line.,” Nature, vol. 279, no. 5711, pp. 328–31, May 1979.
[168] J. W. Larrick, D. G. Fischer, S. J. Anderson, and H. S. Koren, “Characterization of a human macrophage-like cell line stimulated in vitro: a model of macrophage functions.,” Journal of immunology (Baltimore, Md. : 1950), vol. 125, no. 1, pp. 6–12, Jul. 1980.
[169] C. Härtel, G. Bein, H. Kirchner, and H. Klüter, “A human whole-blood assay for analysis of T-cell function by quantification of cytokine mRNA.,” Scandinavian journal of immunology, vol. 49, no. 6, pp. 649–54, Jun. 1999.
[170] A. M. Hidalgo-Estévez, E. González, C. Punzón, and M. Fresno, “Human immunodeficiency virus type 1 Tat increases cooperation between AP-1 and NFAT transcription factors in T cells.,” The Journal of general virology, vol. 87, no. Pt 6, pp. 1603–12, Jun. 2006.
[171] J. M. Trevillyan, X. G. Chiou, Y. W. Chen, S. J. Ballaron, M. P. Sheets, M. L. Smith, P. E. Wiedeman, U. Warrior, J. Wilkins, E. J. Gubbins, G. D. Gagne, J. Fagerland, G. W. Carter, J. R. Luly, K. W. Mollison, and S. W. Djuric, “Potent inhibition of NFAT activation and T cell cytokine production by novel low molecular weight pyrazole compounds.,” The Journal of biological chemistry, vol. 276, no. 51, pp. 48118–26, Dec. 2001.
186
[172] J. E. Kay, “Mechanisms of T lymphocyte activation.,” Immunology letters, vol. 29, no. 1–2, pp. 51–4, Jul. 1991.
[173] M. Sanchez-Lockhart and J. Miller, “Engagement of CD28 outside of the immunological synapse results in up-regulation of IL-2 mRNA stability but not IL-2 transcription.,” Journal of immunology (Baltimore, Md. : 1950), vol. 176, no. 8, pp. 4778–84, Apr. 2006.
[174] X. Shan, M. J. Czar, S. C. Bunnell, P. Liu, Y. Liu, P. L. Schwartzberg, and R. L. Wange, “Deficiency of PTEN in Jurkat T cells causes constitutive localization of Itk to the plasma membrane and hyperresponsiveness to CD3 stimulation.,” Molecular and cellular biology, vol. 20, no. 18, pp. 6945–57, Sep. 2000.
[175] S. Merluzzi, O. D’Orlando, A. Leonardi, G. Vitale, and C. Pucillo, “TRAF2 and p38 are involved in B cells CD40-mediated APE/Ref-1 nuclear translocation: a novel pathway in B cell activation.,” Molecular immunology, vol. 45, no. 1, pp. 76–86, Jan. 2008.
[176] M.-H. Cheong, S.-R. Lee, H.-S. Yoo, J.-W. Jeong, G.-Y. Kim, W.-J. Kim, I.-C. Jung, and Y. H. Choi, “Anti-inflammatory effects of Polygala tenuifolia root through inhibition of NF-κB activation in lipopolysaccharide-induced BV2 microglial cells.,” Journal of ethnopharmacology, vol. 137, no. 3, pp. 1402–8, Oct. 2011.
[177] A. M. Hidalgo-Estévez, E. González, C. Punzón, and M. Fresno, “Human immunodeficiency virus type 1 Tat increases cooperation between AP-1 and NFAT transcription factors in T cells.,” The Journal of general virology, vol. 87, no. Pt 6, pp. 1603–12, Jun. 2006.
[178] J. Park, N. R. Yaseen, P. G. Hogan, A. Rao, and S. Sharma, “Phosphorylation of the transcription factor NFATp inhibits its DNA binding activity in cyclosporin A-treated human B and T cells.,” The Journal of biological chemistry, vol. 270, no. 35, pp. 20653–9, Sep. 1995.
[179] A. Truneh, F. Albert, P. Golstein, and A. M. Schmitt-Verhulst, “Early steps of lymphocyte activation bypassed by synergy between calcium ionophores and phorbol ester.,” Nature, vol. 313, no. 6000, pp. 318–20.
[180] D. W. Nicholson, A. Ali, N. A. Thornberry, J. P. Vaillancourt, C. K. Ding, M. Gallant, Y. Gareau, P. R. Griffin, M. Labelle, and Y. A. Lazebnik, “Identification and inhibition of the ICE/CED-3 protease necessary for mammalian apoptosis.,” Nature, vol. 376, no. 6535, pp. 37–43, Jul. 1995.
[181] M. A. Giembycz, “Phosphodiesterase 4 inhibitors and the treatment of asthma: where are we now and where do we go from here?,” Drugs, vol. 59, no. 2, pp. 193–212, Feb. 2000.
[182] A. Nakata, K. Ogawa, T. Sasaki, N. Koyama, K. Wada, J. Kotera, H. Kikkawa, K. Omori, and O. Kaminuma, “Potential role of phosphodiesterase 7 in human T cell function: comparative effects of two phosphodiesterase inhibitors.,” Clinical and experimental immunology, vol. 128, no. 3, pp. 460–6, Jun. 2002.
187
[183] M. Delhase, M. Hayakawa, Y. Chen, and M. Karin, “Positive and negative regulation of IkappaB kinase activity through IKKbeta subunit phosphorylation.,” Science (New York, N.Y.), vol. 284, no. 5412, pp. 309–13, Apr. 1999.
[184] J. A. DiDonato, M. Hayakawa, D. M. Rothwarf, E. Zandi, and M. Karin, “A cytokine-responsive IkappaB kinase that activates the transcription factor NF-kappaB.,” Nature, vol. 388, no. 6642, pp. 548–54, Aug. 1997.
[185] F. Mercurio, H. Zhu, B. W. Murray, A. Shevchenko, B. L. Bennett, J. Li, D. B. Young, M. Barbosa, M. Mann, A. Manning, and A. Rao, “IKK-1 and IKK-2: cytokine-activated IkappaB kinases essential for NF-kappaB activation.,” Science (New York, N.Y.), vol. 278, no. 5339, pp. 860–6, Oct. 1997.
[186] A. Israël, “NF-kappaB activation: Nondegradative ubiquitination implicates NEMO.,” Trends in immunology, vol. 27, no. 9, pp. 395–7, Sep. 2006.
[187] D. M. Rothwarf, E. Zandi, G. Natoli, and M. Karin, “IKK-gamma is an essential regulatory subunit of the IkappaB kinase complex.,” Nature, vol. 395, no. 6699, pp. 297–300, Sep. 1998.
[188] Z. Ren, J. Cui, Z. Huo, J. Xue, H. Cui, B. Luo, L. Jiang, and R. Yang, “Cordycepin suppresses TNF-α-induced NF-κB activation by reducing p65 transcriptional activity, inhibiting IκBα phosphorylation, and blocking IKKγ ubiquitination.,” International immunopharmacology, vol. 14, no. 4, pp. 698–703, Dec. 2012.
[189] C. Corrêa-Sales, C. E. Tosta, and L. V Rizzo, “The effects of anesthesia with thiopental on T lymphocyte responses to antigen and mitogens in vivo and in vitro.,” International journal of immunopharmacology, vol. 19, no. 2, pp. 117–28, Feb. 1997.
[190] K. Nishina, H. Akamatsu, K. Mikawa, M. Shiga, N. Maekawa, H. Obara, and Y. Niwa, “The inhibitory effects of thiopental, midazolam, and ketamine on human neutrophil functions.,” Anesthesia and analgesia, vol. 86, no. 1, pp. 159–65, Jan. 1998.
[191] T. Loop, Z. Liu, M. Humar, A. Hoetzel, A. Benzing, H. L. Pahl, K. K. Geiger, and B. H. J Pannen, “Thiopental inhibits the activation of nuclear factor kappaB.,” Anesthesiology, vol. 96, no. 5, pp. 1202–13, May 2002.
[192] L. Gossage and T. Eisen, “Targeting multiple kinase pathways: a change in paradigm.,” Clinical cancer research : an official journal of the American Association for Cancer Research, vol. 16, no. 7, pp. 1973–8, Apr. 2010.
[193] P. Csermely, V. Agoston, and S. Pongor, “The efficiency of multi-target drugs: the network approach might help drug design.,” Trends in pharmacological sciences, vol. 26, no. 4, pp. 178–82, Apr. 2005.
[194] L. McKinley, J. F. Alcorn, A. Peterson, R. B. Dupont, S. Kapadia, A. Logar, A. Henry, C. G. Irvin, J. D. Piganelli, A. Ray, and J. K. Kolls, “TH17 cells mediate steroid-resistant
188
airway inflammation and airway hyperresponsiveness in mice.,” Journal of immunology (Baltimore, Md. : 1950), vol. 181, no. 6, pp. 4089–97, Sep. 2008.
[195] W. C. Rowan, J. L. Smith, K. Affleck, and A. Amour, “Targeting phosphoinositide 3-kinase δ for allergic asthma.,” Biochemical Society transactions, vol. 40, no. 1, pp. 240–5, Feb. 2012.
[196] N. Oda, K. Minoguchi, T. Yokoe, T. Hashimoto, K. Wada, M. Miyamoto, A. Tanaka, Y. Kohno, and M. Adachi, “Effect of suplatast tosilate (IPD-1151T) on cytokine production by allergen-specific human Th1 and Th2 cell lines.,” Life sciences, vol. 65, no. 8, pp. 763–70, Jan. 1999.
[197] M. Yoshida, H. Aizawa, H. Inoue, K. Matsumoto, H. Koto, M. Komori, S. Fukuyama, M. Okamoto, and N. Hara, “Effect of suplatast tosilate on airway hyperresponsiveness and inflammation in asthma patients.,” The Journal of asthma : official journal of the Association for the Care of Asthma, vol. 39, no. 6, pp. 545–52, Sep. 2002.
[198] S. Yoshihara, H. Fukuda, and O. Arisaka, “Usefulness of suplatast tosilate, a Th2 cytokine inhibitor based on the Th1/Th2 ratio for allergic disease in children: a retrospective study.,” Arzneimittel-Forschung, vol. 61, no. 7, pp. 421–4, Jan. 2011.
[199] R. Savai, S. S. Pullamsetti, G.-A. Banat, N. Weissmann, H. A. Ghofrani, F. Grimminger, and R. T. Schermuly, “Targeting cancer with phosphodiesterase inhibitors.,” Expert opinion on investigational drugs, vol. 19, no. 1, pp. 117–31, Jan. 2010.
[200] C. Muñoz-Pinedo, “Signaling pathways that regulate life and cell death: evolution of apoptosis in the context of self-defense.,” Advances in experimental medicine and biology, vol. 738, pp. 124–43, Jan. 2012.
[201] M. C. Turco, M. F. Romano, A. Petrella, R. Bisogni, P. Tassone, and S. Venuta, “NF-kappaB/Rel-mediated regulation of apoptosis in hematologic malignancies and normal hematopoietic progenitors.,” Leukemia : official journal of the Leukemia Society of America, Leukemia Research Fund, U.K, vol. 18, no. 1, pp. 11–7, Jan. 2004.
[202] M. Kanduri, G. Tobin, A. Aleskog, K. Nilsson, and R. Rosenquist, “The novel NF-κB inhibitor IMD-0354 induces apoptosis in chronic lymphocytic leukemia.,” Blood cancer journal, vol. 1, no. 3, p. e12, Mar. 2011.
[203] G. A. Webster and N. D. Perkins, “Transcriptional cross talk between NF-kappaB and p53.,” Molecular and cellular biology, vol. 19, no. 5, pp. 3485–95, May 1999.