AD-A239 274 ICUMENTATION PAGEM Fo.m Appro01ed I Ill 1 'I! esn~ateoto . " Cu' u oer resPr-'. -1,' .. :'9 thCne ,m o rv,ew,n9~ ihtruCItCn%, .stn I Iii~IIIihIil;ompt n and res (-weq the collection of iorm~ation %end COM. enms re arling this burden 04188t rnwihf ~et fti )r redUceg this buroec to Washington Hea0Q.&rtes SersCei. L:recorate fo nfl-ration ove'al',ond kroc,1s 1115 ;efler SH.9h~.J . .. . 302. a nd to the Of I Ie )f Ma~nagement and Budget. Paperwork Aeounion Project (0704-0188Y.WAsh, ,on. DC 10503 1f. AGENCY USE ONLY (Leave ba) 2.RPORT DATE 3. REPORT TYPE AND DATES COVERED 1 THESISn 4. TITLE AND SUBTITLE 5. FUNDING NUMBERS Retrofit Strengthening of a seismically Inadequate Reinforced Concrete Frame Using Pre- stressed Cable Bracing Systems and Beam Alteratihn 6. AUTHOR(S) James E. Welter, Captain 7. PERFORMING ORGANIZATION NAME(S) AND ADDRESS(ES) 8. PERFORMING ORGANIZATION REPORT NUM8ER AFIT Student Attending: University of Oklahoma AFIT/GI/GIA-' 91-020 9. SPONSORING/I MONITORING AGENCY NAME(S) AND ADDRESS(ES) 10. SPONSORING / MONITORING AGENCY REPORT NUMBER AFIT/CI Wright-Patterson AFB OH 45433-6583 11. SUPPLEMENTARY NOTES 12a. DISTRIBUTION /AVAILABILITY STATEMENT 12b. DISTRIBUTION CODE Approved for Public Release IAW 190-1 Distributed Unlimited ERNEST A. HAYGOOD, 1st Lit, USAF Executive Officer 13. ABSTRACT (Maximum 200 words) DTIC S 'CL ECTE0 91-07318 AUo 19 14. SUBJECT TERMS 15. NUMBER OF PAGES 190 6. PRICE CODE 17. SECURITY CLASSIFICATION 18. SECURITY CLASSIFICATION 19. SECURITY CLASSiFICATION 20. LIMITATION OF ABSTRACT OF REPORT OF THIS PAGE OF ABSTRACT1 __________ %.SN 751-01-21t30-5500J 3:',!rdo!c.' t ,, : -rv Z-9
Transcript
AD-A239 274 ICUMENTATION PAGEM Fo.m Appro01ed
I Ill 1 'I! esn~ateoto . " Cu' u oer resPr-'. -1,' .. :'9 thCne ,m o rv,ew,n9~ ihtruCItCn%, .stnI Iii~IIIihIil;ompt n and res (-weq the collection of iorm~ation %end COM. enms re arling this burden 04188t rnwihf ~et fti)r redUceg this buroec to Washington Hea0Q.&rtes SersCei. L:recorate fo nfl-ration ove'al',ond kroc,1s 1115 ;efler
SH.9h~.J . .. . 302. a nd to the Of I Ie )f Ma~nagement and Budget. Paperwork Aeounion Project (0704-0188Y.WAsh, ,on. DC 10503
1f. AGENCY USE ONLY (Leave ba) 2.RPORT DATE 3. REPORT TYPE AND DATES COVERED1 THESISn4. TITLE AND SUBTITLE 5. FUNDING NUMBERS
Retrofit Strengthening of a seismically
Inadequate Reinforced Concrete Frame Using Pre-stressed Cable Bracing Systems and Beam Alteratihn
6. AUTHOR(S)
James E. Welter, Captain
7. PERFORMING ORGANIZATION NAME(S) AND ADDRESS(ES) 8. PERFORMING ORGANIZATIONREPORT NUM8ER
AFIT Student Attending: University of Oklahoma AFIT/GI/GIA-' 91-020
12a. DISTRIBUTION /AVAILABILITY STATEMENT 12b. DISTRIBUTION CODEApproved for Public Release IAW 190-1Distributed UnlimitedERNEST A. HAYGOOD, 1st Lit, USAFExecutive Officer
13. ABSTRACT (Maximum 200 words)
DTICS 'CL ECTE0
91-07318 AUo 19
14. SUBJECT TERMS 15. NUMBER OF PAGES190
6. PRICE CODE
17. SECURITY CLASSIFICATION 18. SECURITY CLASSIFICATION 19. SECURITY CLASSiFICATION 20. LIMITATION OF ABSTRACTOF REPORT OF THIS PAGE OF ABSTRACT1 __________
%.SN 751-01-21t30-5500J 3:',!rdo!c.' t ,, : -rv Z-9
THE UNIVERSITY OF OKLAHOMA
GRADUATE COLLEGE
RETROFIT STRENGTHENING OF A SEISMICALLY INADEQUATE REINFORCED CONCRETE
FRAME USING PRESTRESSED CABLE BRACING SYSTEMS AND BEAM ALTERATION
A THESIS
SUBMITTED TO THE GRADUATE FACULTY
in partial fulfillment of the requirements for the
degree of
MASTER OF SCIENCE
By
JAMES E. WELTER
Norman, Oklahoma
1991
RETROFIT STRENGTHENING OF A SEISMICALLY INADEQUATE REINFORCED CONCRETE
FRAME USING PRESTRESSED CABLE BRACING SYSTEMS AND BEAM ALTERATION
A THESIS
APPROVED FOR THE SCHOOL OF
CIVIL ENGINEERING AND ENVIRONMENTAL SCIENCE
if - -
r.ak k rim ,'.'[
Di:t g ; ,:
7 1,'
Di A
BY
Dedicated to My Three Girls
Leslie, Amber, and Ashleigh
ACKNOWLEDGXMENTS
The author expresses his heartfelt gratitude to Dr. Thomas D. Bushfor his instruction, ideas, guidance, insight, and advise during thecourse of this research effort. Sincere appreciation is expressed to mycommittee members, Dr. Benjamin J. Wallace, and Dr. M. R. Tahari as wellas Dr. A. Kukreti and Dr. M. Harajali who all offered advise andsuggestions when they were needed most.
Special thanks goes to the United States Air Force and the AirForce Institute of Technology for making this experience possible byselecting the author to pursue a M.S. in Civil Engineering. The AirForce provided the time and financial support required to complete thiswork. Equally important to the author was the support of his wife,Leslie. Written words cannot adequately convey how much her hard work,understanding, companionship, and love contributed to the authorthroughout the pursuit of this degree as well as every day of his life.
Finally, the author wishes to thank the Lord God for sitting in thechair beside him and never getting up until it was all finished.
iv
TABLE OF CONTENTS
Page
LIST OF TABLES .......... .......................... ix
LIST OF FIGURES ............. .......................... x
ABSTRACT ............ ............................. .. xv
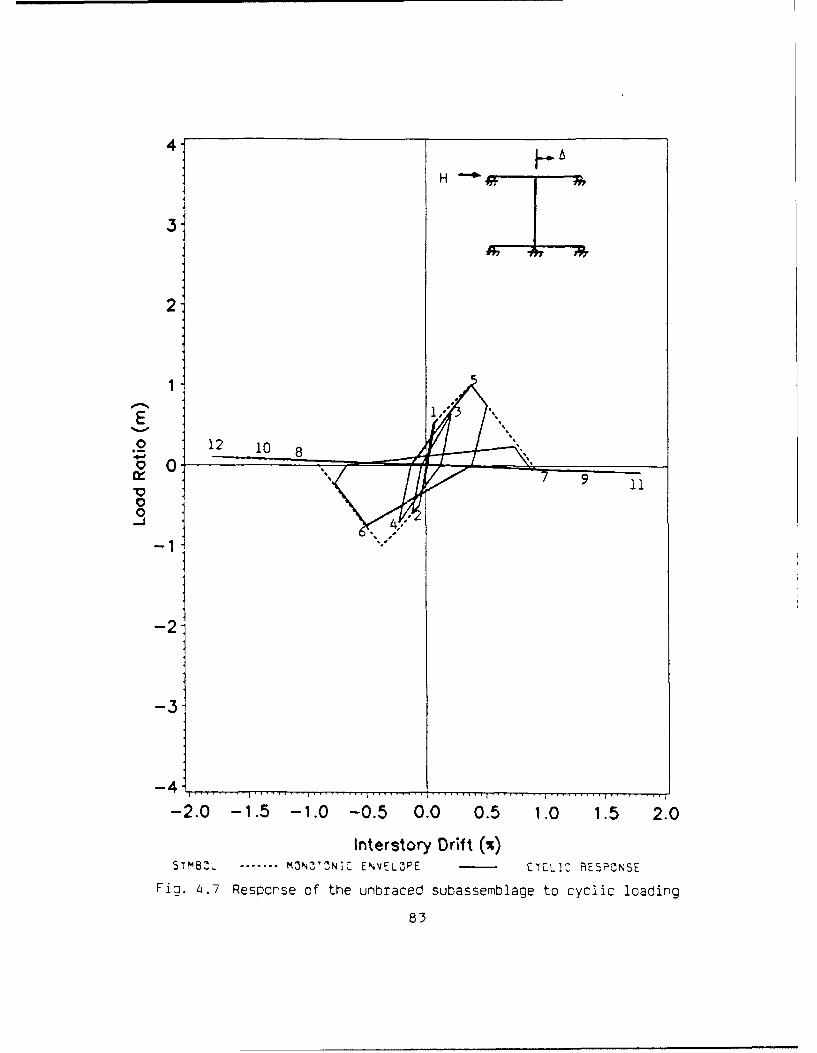
Fig. 4.1i Cyclic response of the subassemblaoce with prestressed cablebraces only. Ultimate desion approach with, n=2, brace area=0.88 in , and 0.5Py prestress force.
90
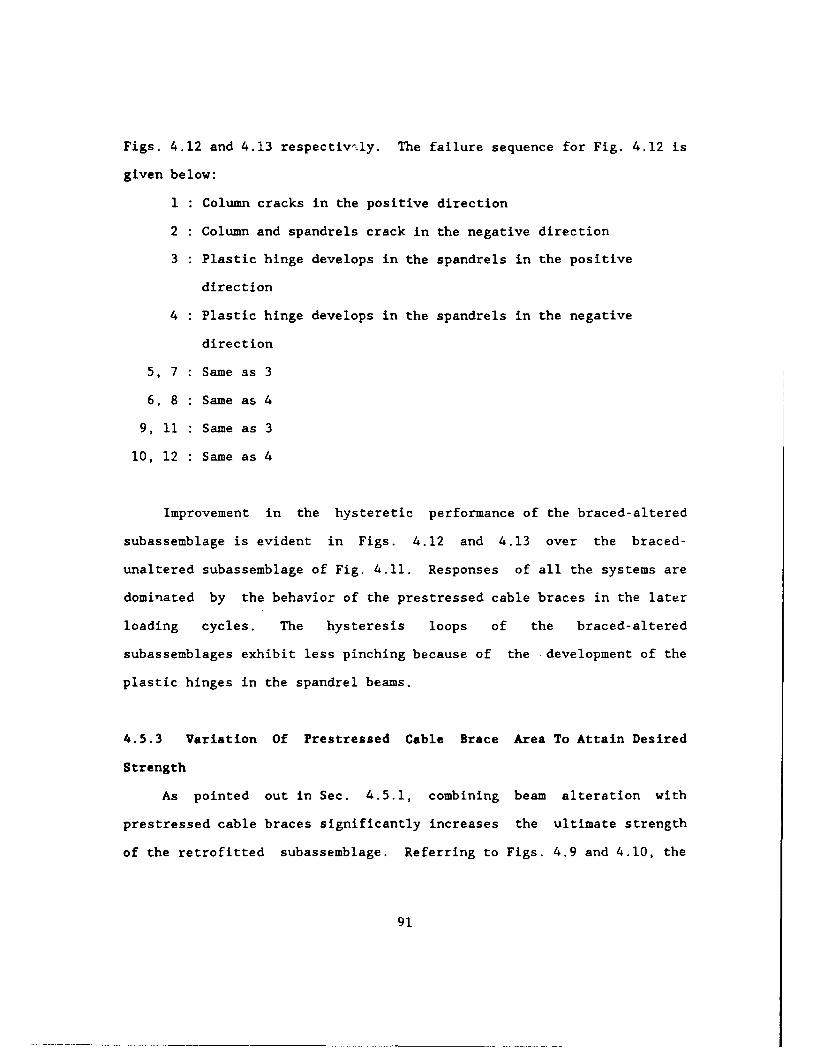
Figs. 4.12 and 4.13 respectivr-ly. The failure sequence for Fig. 4.12 is
given below:
1 : Column cracks in the positive direction
2 : Column and spandrels crack in the negative direction
3 : Plastic hinge develops in the spandrels in the positive
direction
4 : Plastic hinge develops in the spandrels in the negative
direction
5, 7 : Same as 3
6, 8 : Same as 4
9, 11 : Same as 3
10, 12 : Same as 4
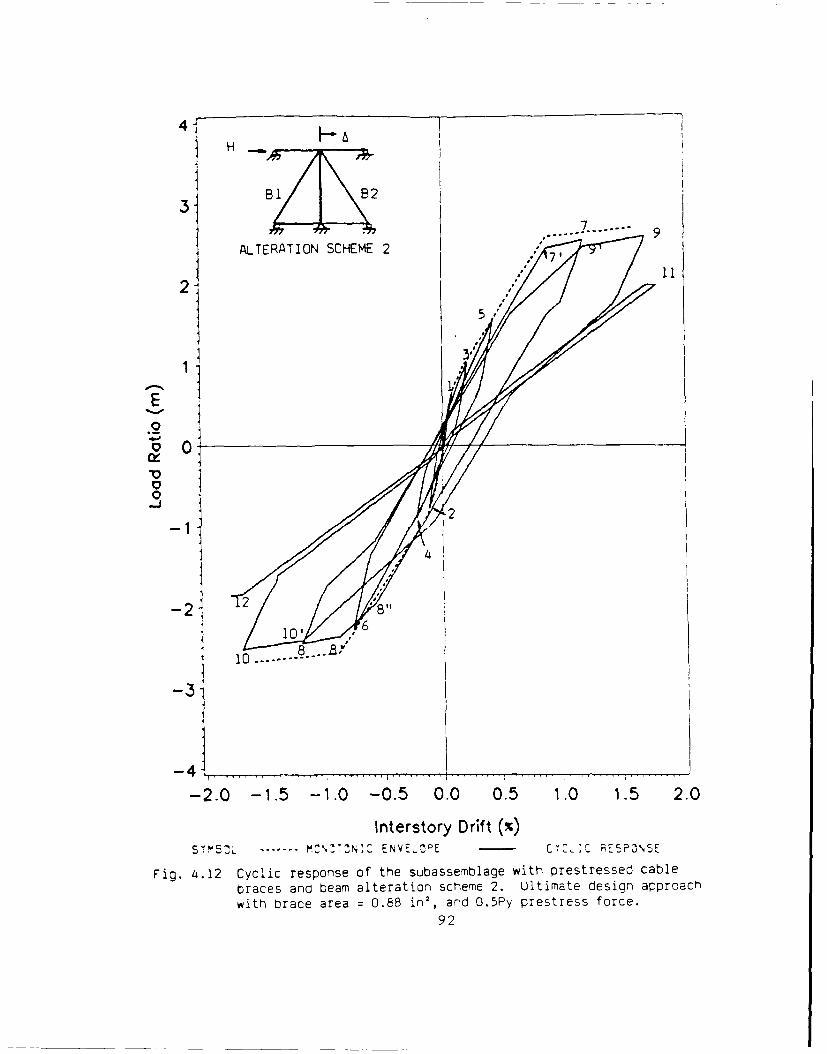
Improvement in the hysteretic performance of the braced-altered
subassemblage is evident in Figs. 4.12 and 4.13 over the braced-
unaltered subassemblage of Fig. 4.11. Responses of all the systems are
dominated by the behavior of the prestressed cable braces in the later
loading cycles. The hysteresis loops of the braced-altered
subassemblages exhibit less pinching because of the development of the
plastic hinges in the spandrel beams.
4.5.3 Variation Of Prestressed Cable Brace Area To Attain Desired
Strength
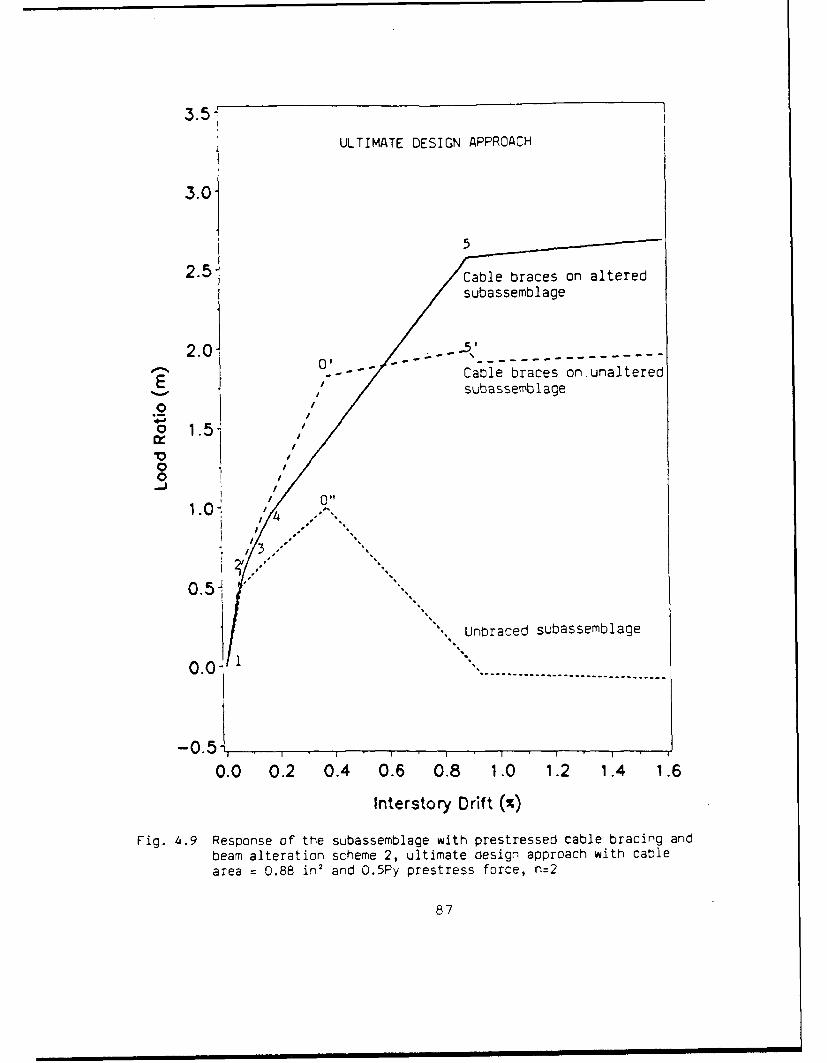
As pointed out in Sec. 4.5.1, combining beam alteration with
prestressed cable braces significantly increases the ultimate strength
of the retrofitted subassemblage. Referring to Figs. 4.9 and 4.10, the
Fig. 4.13 Cyclic response of the subassemblage with prestressedcable braces and beam alteration scheme 2. Serviceabilitydesign approach with bTace area = 0.98 in2 and 0.5Pyprestress force. 93
ultimate strength, however, is not reached until the structure reaches
an interstory drift in excess of .9%. Possibly more significant to the
designer might be the fact that the braced-unaltered subassemblage
provides higher strength at low drifts than does the braced-altered
subassemblage with the same cable brace area. Weakening the spandrel
beams does, however, favorably alter the frame's failure mechanism.
This important benefit of beam alteration cannot be overlooked. But is
an improved failure mechanism worth sacrificing stiffness and strength
at low drift levels ?
As discussed in Sec. 2.4.2, using the serviceability design
approach, the designer strives to limit drift in the structure by
designing the retrofitted frame to attain a desired strength at a
specified drift level. In Fig. 4.10, the cable brace area was
calculated using equation 2.3. The aim is to achieve a retrofitted
strength of twice that of the original unstrengthened frame at a drift
of 0.39%. This point is labeled 0' in Fig. 4.10. The cable brace area
used is 0.98 in2 . At this drift, the braced-altered subassemblage
attains a strength of only 1.5 times that of the original frame.
It is still possible to achieve twice the strength of the original
structure in the braced-altered frame at 0.39% drift by simply
increasing the area of the cable braces. Assuming beam alteration
scheme 2, Eqn 2.3 can be modified to predict the brace area required,
Ac - [(n-0.6)(Vu)(L)]/[(C)(E)(deltafu)(Cos2 )I (4.3)
94
Similar expressions can be derived for beam alteration schemes 1, 3, and
4. The variables Vu and deltafu refer to the lateral strength and
drift, respectively, of the original frame at ultimate. Expressions can
be developed similarly to predict brace area required at any specified
drift level.
Using Eqn 4.3 and n-2, the cable brace area required is 1.4 in2 .
The response of the braced-altered subassemblage with brace cross
sectional areas of 1.4 in2 is plotted in Fig. 4.14. For comparison, the
response of the braced-unaltered subassemblage of Fig. 4.10 is repeated
in Fig. 4.14. At a drift of 0.39%, both the braced-altered and braced-
unaltered curves reach the desired strength of twice that of the
original unaltered subassemblage. To achieve the desired stiffness and
strengt- at 0.39% drift, the area of the cable braces was increased by
nearly 43%. The additional brace area in effect increases the stiffness
of the braced-altered frame by nearly 25%. The ultimate strength of the
braced-altered subassemblage increases to nearly four times the strength
of the original structure at drifts in excess of 0.9%. The overall
objective of the retrofitting project as well as specific design
criteria given by the user and governing building codes will weigh
heavily on the designer when deciding whether increased cable brace area
is a just trade off for increased frame stiffness.
95
SERVICEABILITY DESIGN APPROACH
4.0- Cable braces on altered]subasse mbl1a ge3.0-
2.5 Cable braces on unaltered
NI subassemblage
S2.0- (Ac= 0.98 in')00
0-
0-5- Unbraced-unalteredsubassemblage
A fu
0 .0 1 T
00 02 0.4 0.6 0.8 1.0 1.2 1.4 1.6
t Interstory Drift (%)
Fig. 4~.14 matching response of the altered subassemblace withresponse of the braced only subassemblage at aspecified drift. Serviceability design approach,O.5Py prestress force, n=2, cable area = .4~ in'
96
CHAPTER 5
PRESTRESSED CABLE BRACES APPLIED TO A SIX STORY SUBASSEMBLAGE OF THE
PROTOTYPE FRAME
In this chapter the focus of the study is expanded to examine the
global behavior of a six story version of the prototype frame to
retrofit strengthening. The investigation is limited to the response of
the frame along a typical column line. The design of the prototype
frame introduced in Sec. 2.3 was first completed. The frame design was
conducted in such a way as to represent common design practice in effect
when such structures were originally designed. Applicable design codes
as well as typical hand calculation techniques of the time were
utilized.
Once the prototype frame was designed, unique single story
subassemblages were developed for each level of the frame. A typical
six story subassemblage was also introduced to model the global behavior
of the frame along a typical interior column line of the perimeter
frame.
The single story subassemblages were useful in studying the
response of the six story prototype frame on a story by story basis.
The purpose of studying the six story subassemblage is as follows. The
hypothesis was developed in references 2 and 3 that for geometrically
uniform frames, the global behavior of the retrofitted frame can be
predicted by analysis of a generic single story subassemblage. To
evaluate this hypothesis the response curves obtained from the six story
subassemblage under several bracing schemes were compared to those
97
obtained from analysis of a generic single-story subassemblage. The
advantages and limitations of the hypothesis are discussed. Finally a
discussion is presented on how one might develop a practical design
strength ratio scheme for the prototype frame based on the requirements
of current building codes.
5.1 MODELING THE SIX STORY SUBASSEMBLAGE
5.1.1 Design Of The Prototype Frame
The prototype frame was introduced in Sec. 3.2 as being seven
stories high and eleven bays long. For the purpose of conducting the
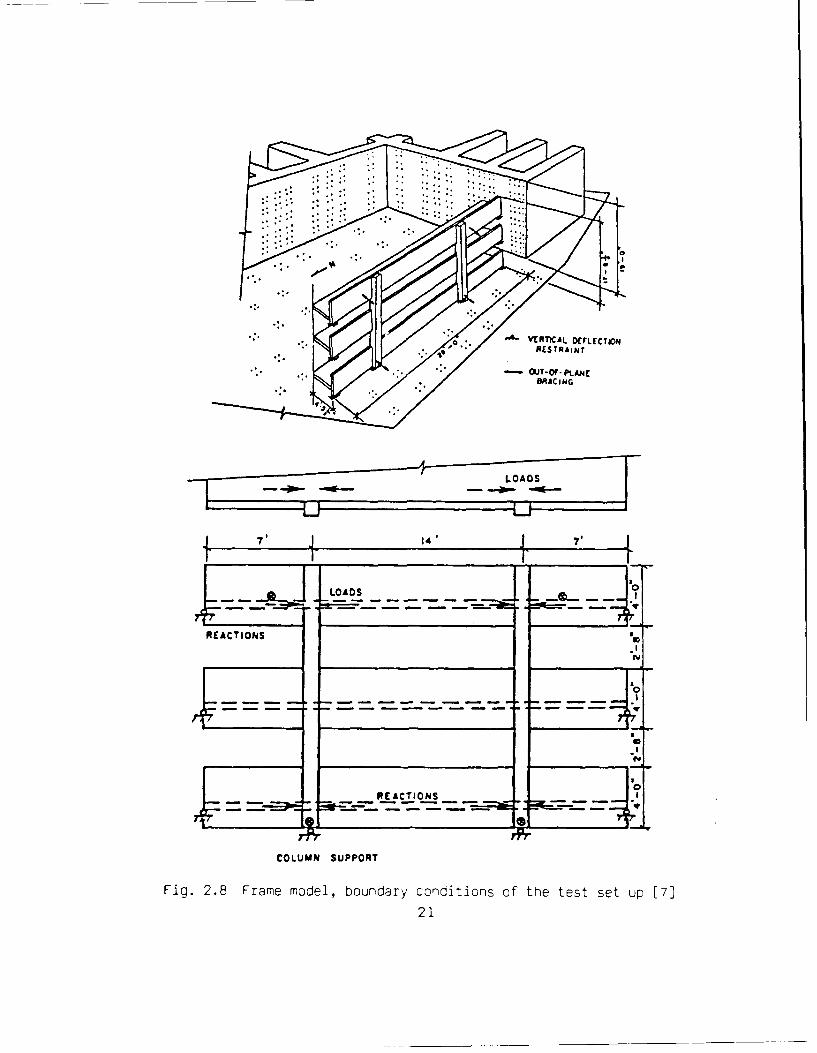
experimental tests discussed in Sec. 2.3 [7], only the third, fourth,
and fifth levels of the frame were fully designed (see Fig. 2.8). In
order to examine the behavior of a multi-story version of the prototype
frame to retrofit strengthening, the frame design for the remaining
floors had to be completed.
Gravity and seismic loads for the design were obtained from the
1955 edition of the Uniform Building Code [12]. The portal method was
used for frame analysis, and design was carried out using working stress
design in accordance with the 1951 edition of the ACI Building Code
[10]. Gravity and seismic loads were the same as those utilized by the
designers of the original prototype frame shown in Figs. 2.7 and 3.2.
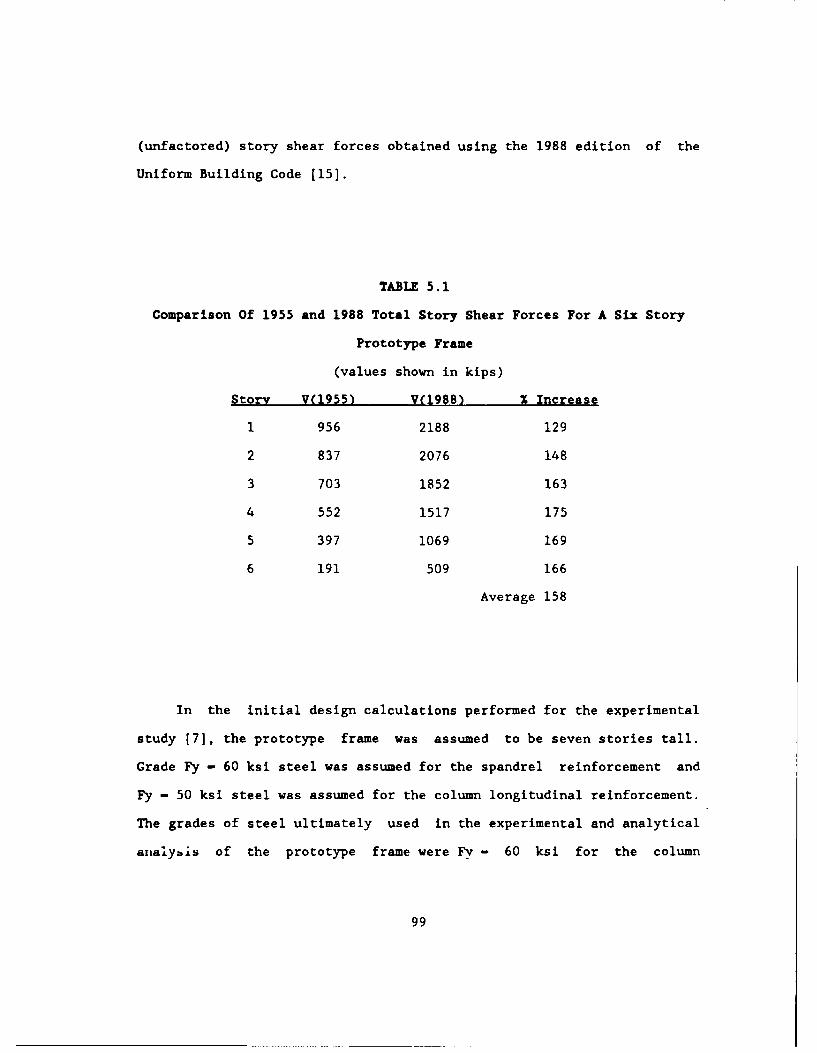
Design values of total story shear force for a six story prototype
frame were calculated using the 1955 Uniform Building Code and are
summarized in Table 5.1. Also shown in the table are the nominal
98
(unfactored) story shear forces obtained using the 1988 edition of the
Uniform Building Code [15].
TABLE 5.1
Comparison Of 1955 and 1988 Total Story Shear Forces For A Six Story
Prototype Frame
(values shown in kips)
Story V(1955) V(1988) % Increase
1 956 2188 129
2 837 2076 148
3 703 1852 163
4 552 1517 175
5 397 1069 169
6 191 509 166
Average 158
In the initial design calculations performed for the experimental
study [7], the prototype frame was assumed to be seven stories tall.
Grade Fy - 60 ksi steel was assumed for the spandrel reinforcement and
Fy - 50 ksi steel was assumed for the column longitudinal reinforcement.
The grades of steel ultimately used in the experimental and analytical
analybis of the prototype frame were Fv - 60 ksi for the column
99
longitudinal reinforcement and Fy - 40 ksi for all other reinforcement.
Using these revised steel grades and assuming a seven story frame,
initial calculations revealed that the spandrel reinforcement shown in
Fig. 3.2 for levels two and four were inadequate. Revision of building
height downward from seven stories to six stories reduces the spandrel
moments at levels 2 and 4 sufficiently that resizing of reinforcement at
those levels is not necessary. This action was taken so as to not
change the structural characteristics of the original prototype frame at
levels three, four, and five which correspond to the region of the frame
tested experimentally [7].
Frame design was completed assuming the prototype frame to be a six
story structure. A plan and profile of the revised six story prototype
frame is shown in Fig. 5.1. Spandrel reinforcement for the complete
frame is summarized in Fig. 5.2. The sections shown depict longitudinal
reinforcement typical at the spandrel ends. For simplicity, spandrel
reinforcement in the exterior bays was assumed the same as that provided
for the interior bays. The reduction of frame height from seven to six
stories necessitated a revision downward in column axial loads due to
gravity forces at each story. As a result, column lateral strength for
any given story was also reduced (see lateral shear strength equation
for short columns in Fig. 3.7). Nevertheless, longitudinal
reinforcement for the third and fourth floor columns (those modeled for
the experimental study) remained unchanged (see Fig. 2.7). A summary of
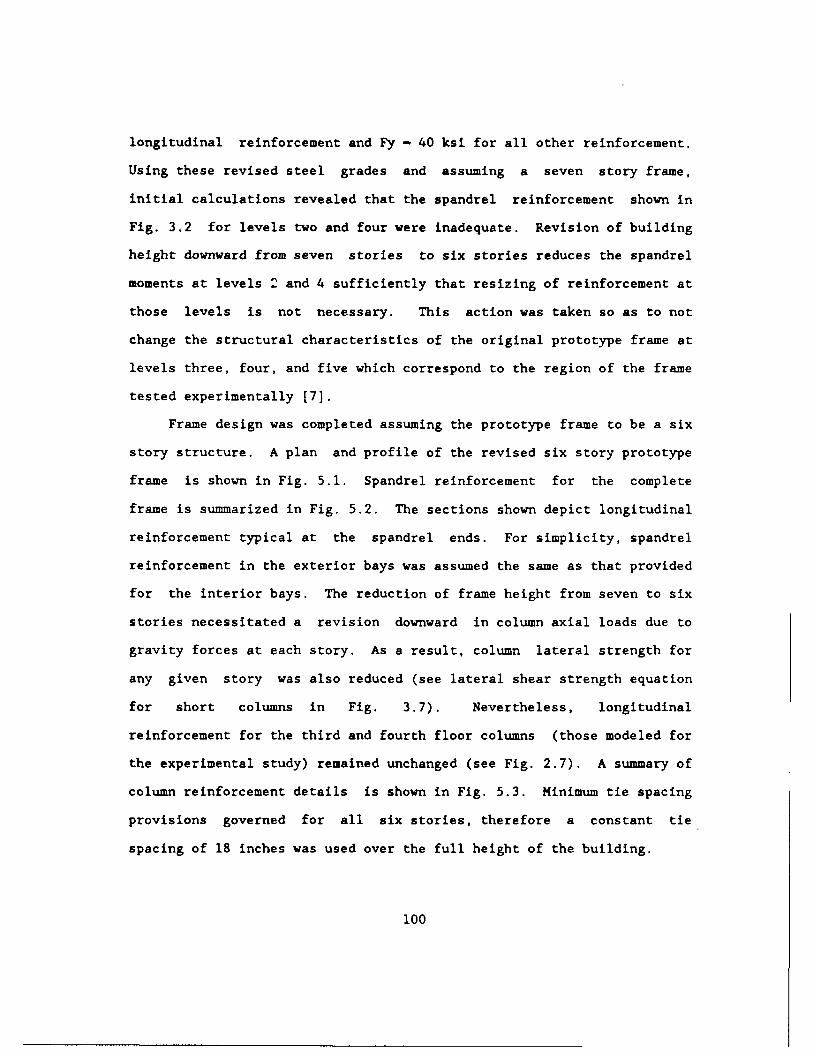
column reinforcement details is shown in Fig. 5.3. Minimum tie spacing
provisions governed for all six stories, therefore a constant tie
spacing of 18 inches was used over the full height of the building.
100
9-6 -9 at 21 189'
A6
S5
o -4
03
AIsymnat
4t fir subassemblage S
ELEVATION
228'
~19,-6' 8'W6
PLA N
Fig. 5.1 Plan and profile of the six story prototype frame
101
ROOF LEVELS 4,5,6 LEVELS 2, 3
n00 6farlo. C2 no. 6** n.6b~ *eno. b *@no.8
.Z no. 4bars Ns no. 4 go no. 4
0.no. 4 bars 0 * no. 4 0 0 no. 4
no. 6bars 9T n o.460 no.46
Fig. 5.2 Spandrel reinforcement for the six story prototype frame
102
STORIES 5&6
no. 7 no7 no.4 ties at I a
18
STORIES 3&4
no.10 no.1s
no.10a no.10
no1O no.1 0 no is atiB8
STORIES 1&2
no.14 no.1
no.' - no.11
o.?1 no11 -- flo.4ties at 19"
no.14 no.14
Fiq. 5.3 Column reinforcement for the six story prototype frame
Longitudinal column reinforcement was assumed to be the same for all
frame columns in a given story.
5.1.2 Selection Of Typical Six Story Subassemblage Of The Prototype
Frame
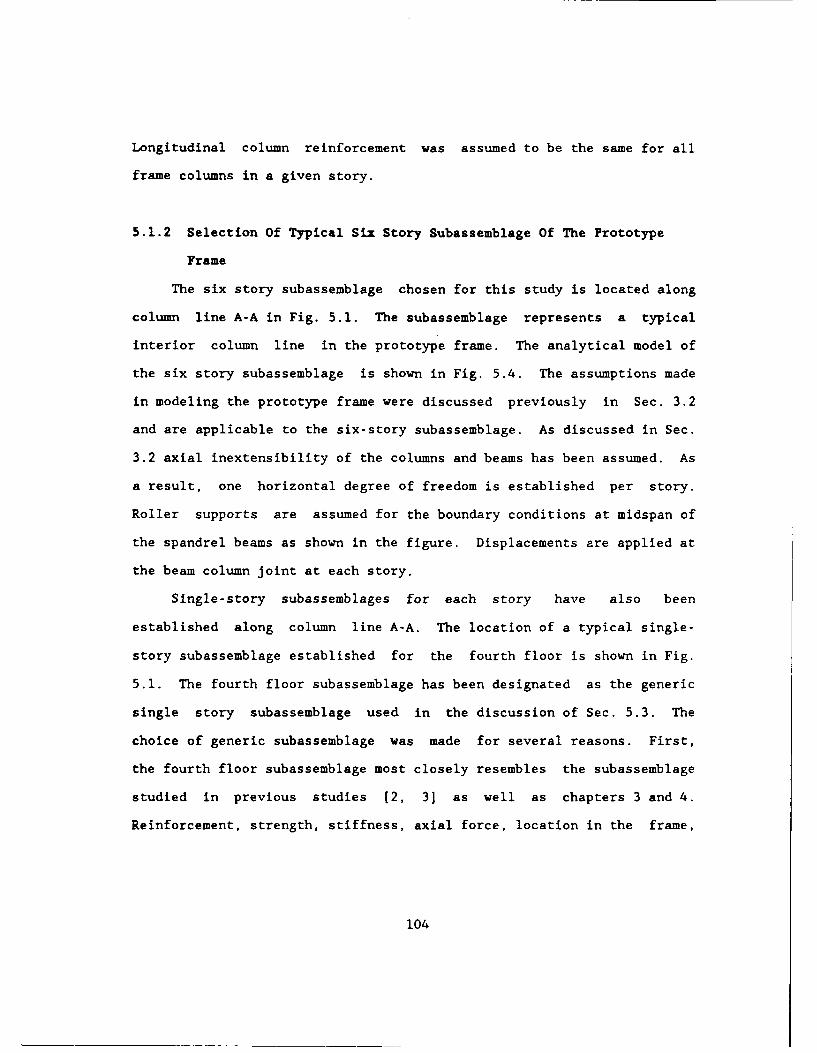
The six story subassemblage chosen for this study is located along
column line A-A in Fig. 5.1. The subassemblage represents a typical
interior column line in the prototype frame. The analytical model of
the six story subassemblage is shown in Fig. 5.4. The assumptions made
in modeling the prototype frame were discussed previously in Sec. 3.2
and are applicable to the six-story subassemblage. As discussed in Sec.
3.2 axial inextensibility of the columns and beams has been assumed. As
a result, one horizontal degree of freedom is established per story.
Roller supports are assumed for the boundary conditions at midspan of
the spandrel beams as shown in the figure. Displacements are applied at
the beam column joint at each story.
Single-story subassemblages for each story have also been
established along column line A-A. The location of a typical single-
story subassemblage established for the fourth floor is shown in Fig.
5.1. The fourth floor subassemblage has been designated as the generic
single story subassemblage used in the discussion of Sec. 5.3. The
choice of generic subassemblage was made for several reasons. First,
the fourth floor subassemblage most closely resembles the subassemblage
studied in previous studies [2, 3] as well as chapters 3 and 4.
Reinforcement, strength, stiffness, axial force, location in the frame,
104
FLOOR LEVEL
2S2
ROOF
6
120
5 120
5
4
3 ~120"
3
2
120
1 ~120"
Fig. 5.4 Anialytical model for the six story subassemblage of theprototype frame
and response history most closely match the original subassemblage of
the seven story frame. Secondly, the subassemblage is located near the
center of the frame away from the frame boundaries.
5.1.3 Prestressed Cable Brace And Beam Alteration Schemes Used In The
Study
It was shown in chapter 4 that there are advantages to using beam
alteration in conjunction with prestressed cable bracing systems. As a
result, the designer of a retrofit strengthening scheme may wish to
utilize both prestressed cable braces and beam alteration. In Sections
5.2 and 5.3 several prestressed cable bracing schemes are examined as
well as a beam alteration scheme to support the study. These retrofit
strengthening schemes are presented next.
In Sec. 4.5.3 it was demonstrated how an engineer can utilize the
serviceability design approach and Eqn. 2.3 to design a retrofitted
structure which will achieve a desired strength at a specified drift.
Once the response of the unstrengthened frame is determined, the
designer can derive equations similar to Eqn. 4.3 for selected beam
weakening schemes. This approach was followed in determining required
cable brace areas.
A design strength ratio of n-2 was arbitrarily chosen for each
story. Further, n-2 strength was to be attained at a drift
corresponding to shear failure of the columns in each story of the
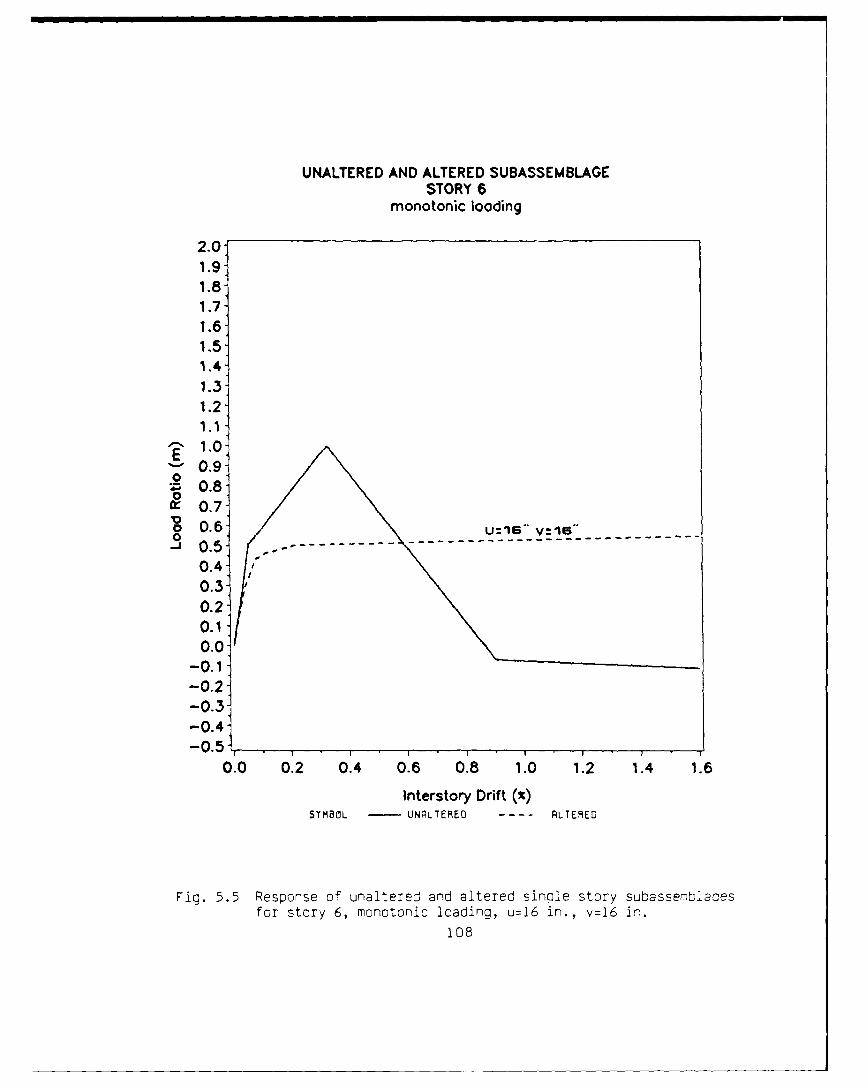
unstrengthened frame. For example, the ultimate lateral strength of
story 6 was determined to be 52.4 kips at a relative interstory drift of
0.34% (0.407 in.) from single story subassemblage analysis. The
106
response of the unstrengthened subassemblage is normalized with respect
to 52.4 kips and plotted as the solid line in Fig. 5.5. With n-2, the
desired retrofitted strength is 2(52.4) - 104.8 kips. From Eqn. 2.3 the
required cable area was found as:
Ac - [(2-1)(52.4k)(174in)]/[(1)(26,000ksi)(.407in)Cos 2 (43.6)] - 0.82 in2
If beam alteration is also part of the retrofitting scheme, a
larger cable brace area is required to achieve n-2 strength at 0.34%
drift (see discussion in Sec. 4.5.3). The response of the story six
subassemblage to beam alteration (u - 16 in., v - 16 in.) is normalized
to 52.4 kips and plotted as the dashed curve in Fig. 5.5. Observe that
at a drift of 0.34%, the strength of the altered subassemblage is 50%
that of the unaltered subassemblage. The cable brace area required to
reach n-2 strength in a braced-altered subassemblage is calculated as:
Cable brace areas were similarly calculated for each story of the
six story prototype building. The cable brace area schemes utilized in
this chapter are summarized in Table 5.2. Bracing schemes A, B, and C
were developed for application without beam alteration. Scheme Al was
developed in conjunction with beam alteration.
107
UNALTERED AND ALTERED SUBASSEMBLAGESTORY 6
monotonic looding
2.0-1.9.1.81.71.61.51.4
1.31.21.1
1.0%- 0.90S0.80.7
0 0.6 U:16" V=16".a 0.5 o o,0.4
0.3-
0.20.1.0.0
-0.1-0.2-0.3-0.4-0.54,
" I I I'' lTI'! '
0.0 0.2 0.4 0.6 0.8 1.0 1.2 1.4 1.6
Interstory Drift (%)STMBOL - UNALTEREO ALTERED
Fig. 5.5 Response of unaltered and altered sinale story subassemblacesfor story 6, monotonic loading, u=16 in., v=16 in.
108
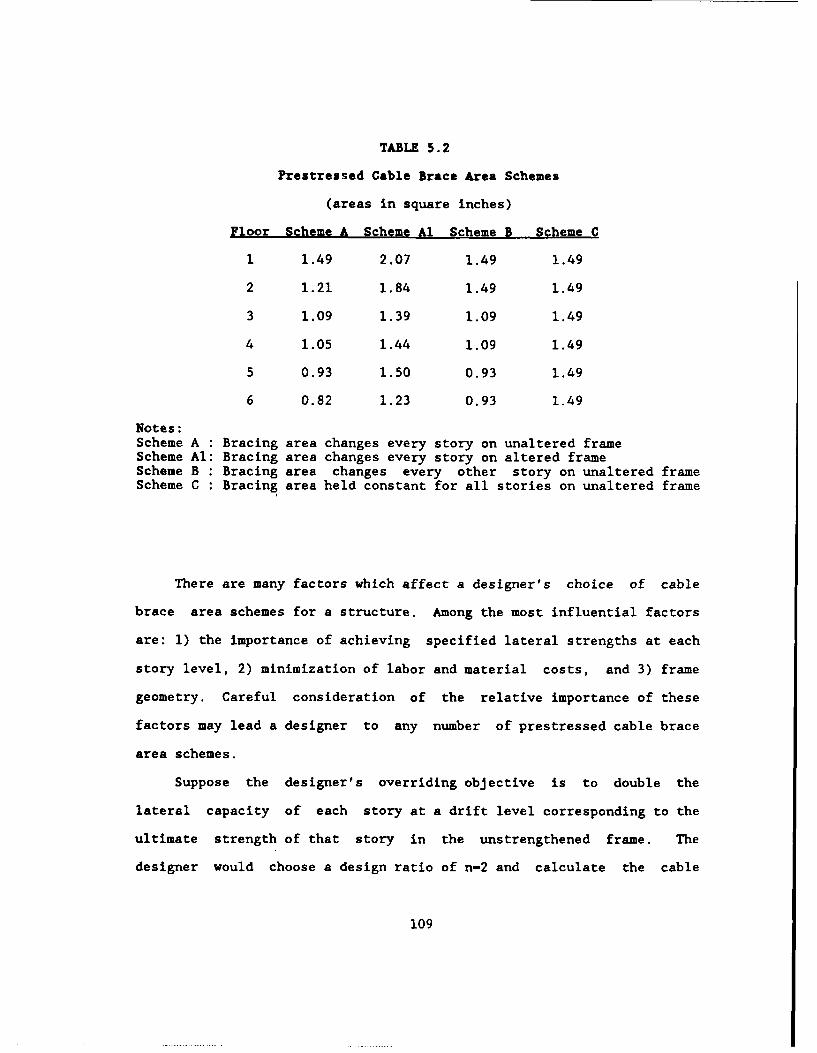
TABLE 5.2
Prestressed Cable Brace Area Schemes
(areas in square inches)
Floor Scheme A Scheme Al Scheme B Scheme C
1 1.49 2.07 1.49 1.49
2 1.21 1.84 1.49 1.49
3 1.09 1.39 1.09 1.49
4 1.05 1.44 1.09 1.49
5 0.93 1.50 0.93 1.49
6 0.82 1.23 0.93 1.49
Notes:Scheme A : Bracing area changes every story on unaltered frameScheme Al: Bracing area changes every story on altered frameScheme B : Bracing area changes every other story on unaltered frameScheme C : Bracing area held constant for all stories on unaltered frame
There are many factors which affect a designer's choice of cable
brace area schemes for a structure. Among the most influential factors
are: 1) the importance of achieving specified lateral strengths at each
story level, 2) minimization of labor and material costs, and 3) frame
geometry. Careful consideration of the relative importance of these
factors may lead a designer to any number of prestressed cable brace
area schemes.
Suppose the designer's overriding objective is to double the
lateral capacity of each story at a drift level corresponding to the
ultimate strength of that story in the unstrengthened frame. The
designer would choose a design ratio of n-2 and calculate the cable
109
brace area required for each story as shown above. If this was the only
concern, either prestressed cable brace area scheme A or Al shown in
Table 5.2 would be arrived at. In designing prestressed cable brace
scheme A and Al, the designer assumes it is practical to specify
different cable brace areas for each story. The number of connections
and prestressing points as well as the manhours required to install and
prestress each cable is assumed to be of secondary concern. The
advantage of such a scheme is that the designer can closely control the
design strength of each story as desired.
The designer might be primarily concerned with controlling
installation costs, thus desiring to minimize the number of connections,
prestressing points and cable sizes utilized. A bracing area scheme
similar to scheme C shown in Table 5.2 might then be specified. In
scheme C the assumption is that only one cable size is to be used for
the entire structure. The cable brace areas shown represent the largest
area required by any story in the structure to reach twice its
unstrengthened capacity, or n-2.
Scheme B represents a compromise between schemes A, and C. In
designing scheme B costs are limited by changing cable sizes every other
story. The number of connections and prestressing points, as well as
installation manhours, are greatly reduced over those required by
schemes A and Al. Meanwhile greater control over frame response is
achieved over that provided by scheme C.
In chapter 4, four beam alteration schemes were evaluated for the
fourth story subassemblage of the original seven story prototype frame.
It was shown that beam alteration scheme 2 provided optimum results.
110
Recall that in scheme 2 the first layer of negative and positive
reinforcement was cut (refer to Fig. 3.2 and Table 4.1). The conclusion
was drawn that scheme 2 provides optimum results for the fourth story
subassemblage analyzed. Alteration scheme 2 might not necessarily be
optimal if, for example, one evaluates the response of a two story
subassemblage consisting of floors three and four. For such a case,
scheme 1 might be appropriate for level 4 spandrels and scheme 2
appropriate for level 3.
For a six story structure, it becomes apparent that a great number
of beam weakening schemes can be developed. In an effort to limit the
scope of this study, only one beam alteration scheme for the six story
subassemblage was considered. Using the identical approach utilized in
chapter 4, the optimum beam alteration scheme for each level of the six
story frame was determined by single-story subassemblage analysis. The
optimum beam weakening scheme for each level is summarized in Table 5.3.
The combination of all six beam weakening schemes shown will be used in
the discussion of Sec. 5.2 in conjunction with prestressed cable brace
scheme Al.
5.2 RESPONSE OF THE SIX STORY FRAME USING UNIQUE SINGLE STORY
SUBASSEMBIAGE ANALYSES
5.2.1 Response Of The Unstrengthened Frame
As discussed in Sec. 5.1.2, unique single story subassemblages were
developed for each story of the prototype frame. A monotonic static
incremental displacement analysis was conducted on unstrengthened
111
TABLE 5.3
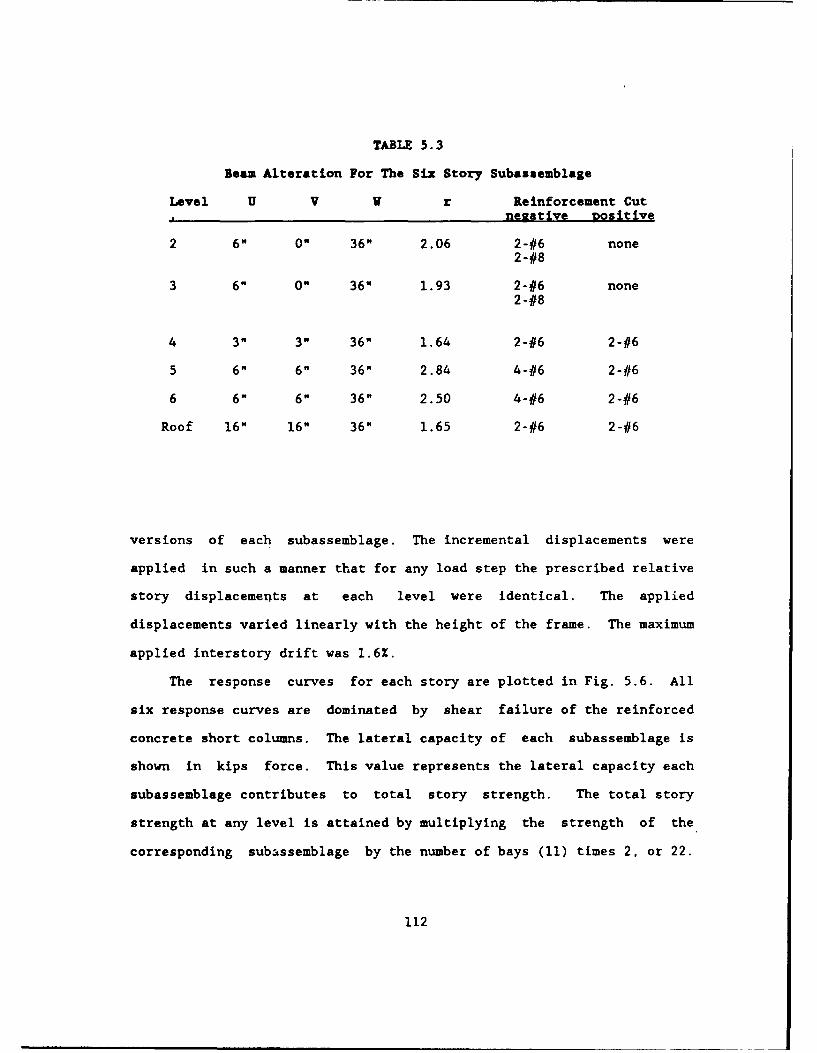
Beam Alteration For The Six Story Subassemblage
Level U V V r Reinforcement Cutne2ative Positive
2 6" 0" 36" 2.06 2-#6 none2-#8
3 6" 0" 36" 1.93 2-#6 none2-#8
4 3" 3" 36" 1.64 2-#6 2-#6
5 6" 6" 36" 2.84 4-#6 2-#6
6 6" 6" 36" 2.50 4-#6 2-#6
Roof 16" 16" 36" 1.65 2-#6 2-#6
versions of each subassemblage. The incremental displacements were
applied in such a manner that for any load step the prescribed relative
story displacements at each level were identical. The applied
displacements varied linearly with the height of the frame. The maximum
applied interstory drift was 1.6%.
The response curves for each story are plotted in Fig. 5.6. All
six response curves are dominated by shear failure of the reinforced
concrete short columns. The lateral capacity of each subassemblage is
shown in kips force. This value represents the lateral capacity each
subassemblage contributes to total story strength. The total story
strength at any level is attained by multiplying the strength of the
corresponding subassemblage by the number of bays (11) times 2, or 22.
112
An identical analysis was conducted on the six story subassemblage of
Fig. 5.4. A plot of the relative story response curves for the six
story subassemblage provides very close agreement to the curves obtained
from the individual subassemblages and therefore is not repeated.
When interpreting the curves of Fig. 5.6, it is important to
recognize how the shear dominated column behavior is reproduced by the
analytical model. Recall that nonlinear rotational springs at the
column ends are used to produce the overall nonlinear lateral load-
displacement curve of the column element (refer to Sec. 3.3). The
moments at the ends of the column element establish behavioral states of
each spring. As long as the column end moments are equal, the
rotational springs exhibit simultaneous behavior, and the desired
overall column load-displacement curve is represented exactly as seen in
the curves for stories 2, 4, and 5.
If, however, the column end moments are not equal, different
nonlinear behavior is exhibited by the two rotational springs.
Behavioral changes occur for each spring independently at various column
drifts. This causes a deviation in behavior from the desired column
load-displacement curve. One end of the column may "fail" earlier than
the other. This behavior is seen in the curves for stories 1, 3 and 6.
Such behavior is an anomaly unique to the analytical model since the
actual column displays a global shear failure at a unique drift.
The general shape of the response curves for stories 2, 4, and 5,
as well as their failure mechanisms, are identical to the subassemblage
discussed in detail in Sec. 3.7.1. The stiffness and strength of the
spandrel beams framing into the bottom of the column is the same as for
113
5O0
450
400
350
""3000.
2500
0.00200
0
Q- 150
100 A B
story --
-5010.0 0.2 0.4 0.6 0.8 1.0 1.2 1.4 1.6
Interstory Drift (%)S'rMBOL - STORY6 ------ 5 -
3 -- 2
Fig. 5.6 Respcnse curves for unstrengthened single story subassemblagesto mrtorlic loading
114
the top of the column in the cases of stories 2, 4, and 5. Since the
member properties of these subassemblages are symmetrical, an inflection
point is located at mid-height of the column. This results in equal end
moments for the column. When the column reaches its ultimate shear
capacity, simultaneous behavior of the nonlinear springs (due to the
equal end moments) causes both ends of the column to "fail" at the same
time.
Failure mechanisms for stories 1, 3, and 6 are slightly different.
The member properties for the spandrel framing in at the bottom of the
subassemblage column are not the same as they are at the top of the
column. Since the subassemblage no longer has symmetrical member
properties, the inflection point in the column moves away from the
center. A larger moment develops at the bottom of the column where the
beam-column joint is stiffer. As a result, the lower column spring
"fails" first. The upper column spring "fails" at a slightly higher
drift. This condition is of little significance in stories 3 and 6;
however, it is quite prevalent in story 1. The bottom of the first
story column is assumed fixed in the computer model. This is equivalent
to framing the column into infinitely stiff spandrel beams at the column
base. A larger end moment therefore develops in the bottom of the
column than at the top. It follows that the ultimate capacity of the
inelastic spring is reached first at the base. This occurs at a drift
of 0.35% and is labeled as point A in the figure. Ultimate capacity of
the inelastic spring at the top of the column is reached at a drift of
0.40% shown as point B. Actual shear failure of the column should occur
at approximately 0.4% drift with a lateral load of 99 kips.
115
The observed ultimate lateral strengths of each story and their
corresponding ultimate drifts are summarized in Table 5.4. Observe that
the lower stories achieve a higher ultimate lateral capacity than the
upper stories. This is attributable to increased axial load on the
lower story columns as well as increased transverse shear reinforcement
in stories 1 and 2.
TABLE 5.4
Ultimate Lateral Capacity Of The Unstrengthened Frame By Story
Story Lateral Capacity % Drift at Ultimate(kips)
1 95.0 0.35
2 89.2 0.40
3 77.3 0.36
4 69.3 0.36
5 60.9 0.34
6 52.4 0.32
5.2.2 Response Of the Braced-Unaltered Frame
Bracing scheme A was next applied to the single story
subassemblages and the six story subassemblage. Monotonic incremental
displacements were applied to both the single story and multi-story
models. The resulting curves for the single story subassemblages are
116
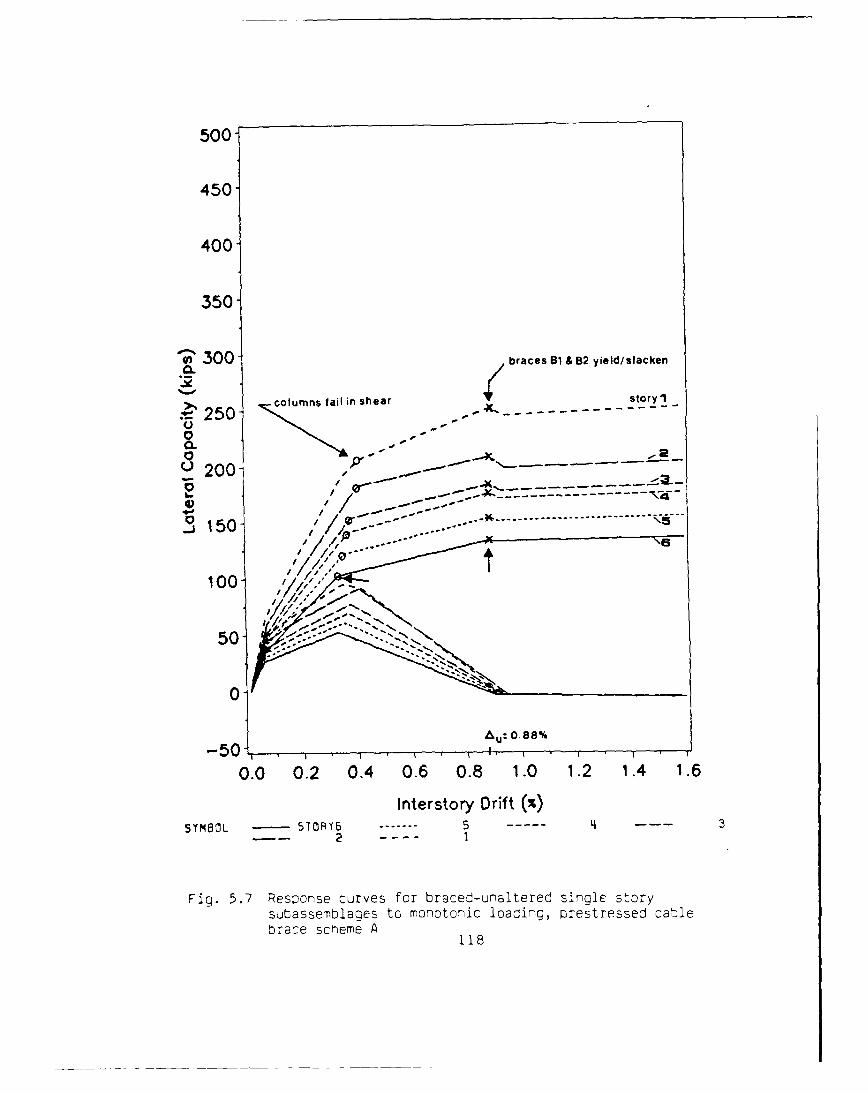
presented in Fig. 5.7. The corresponding response curves obtained from
analysis of the six story subassemblage are identical to those in Fig.
5.7 and are therefore not repeated.
Recall that for bracing scheme A the size of cable bracing was
changed at every story level. Further, the objective was to double the
lateral strength for any story at a drift corresponding to shear failure
of the columns in the original unstrengthened frame. Comparison of the
unstrengthened and braced curves confirm that this objective was met.
Note that the failure mechanism of each story is still dominated by
shear failure of the columns. Further, column shear failure occurs at
the same drift in both the unstrengthened and braced versions of the
frame.
At drifts beyond those causing shear failure of the columns,
response is dominated by characteristics of the cable braces as
described in detail in Sec. 3.7.2. The reader is reminded here that
these results rely on the validity of the assumption that the columns
maintain their ability to carry the gravity loads even though the column
has failed in shear. Ultimate story strength at each floor is reached
at a common drift of 0.88%. This drift corresponds to simultaneous
yielding and slackening of cable braces in each story.
5.2.3 Response Of The Braced-Altered Frame
Prestressed cable bracing scheme Al and the beam alteration scheme
shown in Table 5.3 were applied to the single story subassemblages and
the six story subassemblage. Monotonic incremental displacements were
again applied as in the previous unstrengthened and braced-unaltered
117
500-
450-
400-
350-
300- braces 51 11B2 yield/slacken
columns fail n shear Vstory I-
~ 250 A'------------------
00
0.
-50 AU: 0.88%
0.0 0.2 0.4 0.6 0.8 1.0 1.2 1.4 1.6
Interstory Drift()SYMBOL - SrORT6 ------- --- 3
- - ~2 - --
Fig. 5.7 Response curves for braced-unaltered single storysutassemblages to monotonic loading, prestressed cat1ebrace scheme A
118
runs. The resulting curves obtained from the single story
subassemblages are presented in Fig. 5.8. The response curves obtained
from the six story subassemblage analysis once again confirm good
agreement with analysis using single story subassemblages.
In bracing scheme Al the size of cable bracing was again changed at
every story level. As with scheme A, the objective was to double the
lateral strength at each story at a drift corresponding to shear failure
of the columns in the unstrengthened frame. To n-hieve this objective
the larger cable brace sizes indicated in Table 5.2 were required as
explained in the discussion of Sec. 4.5.3. Comparison of the
unstrengthened braced-altered curves of Fig. 5.8 at the appropriate
drift confirms that this objective was met.
With the exception of story 1, the failure mechanisms of each story
is no longer dominated by shear failure of the columns. Beam weakening
at level 2 spandrels was successful in moving failure away from the top
of the first story column and into the beams. Beam weakening may not,
however, prevent shear failure from eventually occurring in the story 1
column. The "failure" of the inelastic spring at the base of the story
1 column is delayed from occurring until a drift of 0.48%. Even with a
reduced end moment transferred to the top of the column in an altered
frame, the story 1 column may still fail in shear because of the large
end moment at the base of the column. A design engineer may in this
case elect to utilize one of the more traditional seismic retrofitting
techniques discussed in chapter 1 to strengthen the first floor columns.
Plastic hinges formed in the weakened spandrel beams at drifts
shown in the figure. Beyond these drifts, response was again dominated
119
500-
450 r braces yield/slacken
400 -- - - -story 1
350 '/
n300 - ----CL-
250 1
00
050
00
50-
0-
50
0.0 0.2 0.4 0.6 0.8 1.0 1.2 1.4 1.6
Interstory Drift (%)SYMBOL - STORYG ---- 4 3
- -2 1
Fig. 5.8 Response curves for braced-altered single story subassemblagesto mnnotonic loading, prestressed cable brace scheme Al
120
by behavior of the prestressed cable bracing system. Ultimate story
strength at each floor was again reached at a common drift of 0.88%.
5.3 EVALUATION OF THE SINGLE STORY GENERIC SUBASSEMBLAGE HYPOTHESIS BY
CONTRAST WITH RESULTS OF A SIX STORY SUBASSEMBLAGE ANALYSIS
In the previous prestressed cable brace study [2], it was
hypothesized that global behavior of the retrofitted frame could be
adequately represented by modeling and analyzing Lne generic single
story subassemblage. In this section the hypothesis is evaluated. The
six story subassemblage was fitted and analyzed with bracing schemes A,
B, and C of Table 5.3. The resulting normalized response curves for
each scheme were compared and contrasted to the normalized response
curve obtained from a generic single story subassemblage.
The location of the generic single story subassemblage is shown in
Fig. 5.1. The generic subassemblage is identical to the unique single
story subassemblage developed for story 4 in Sec. 5.2. The choice of
generic subassemblage was made for the following reasons. First, the
fourth floor subassemblage most closely resembles the subassemblage
studied in previous studies [2, 3] as well as chapters 3 and 4.
Reinforcement, strength, stiffness, axial force, location in the frame,
and response history most closely match the original subassemblage of
the seven story frame. Secondly, the subassemblage is located near the
center of the frame away from the frame boundaries.
The cable brace area used was 1.05 in2 which is the same cable
brace area specified for story 4 in bracing scheme A. The monotonic
response of unstrengthened and braced-unaltered versions of the
121
subassemblage are plotted in Fig. 5.9. The generic subassemblage
hypothesis is based on the premise that the normalized response curve of
Fig. 5.9 adequately represents the global behavior expected of the
complete frame. The critical unstated assumption was that every bay of
the frame is braced uniformly and that cable brace areas are selected
based on a common design ratio n throughout the structure.
Relative response curves for the unstrengthened six story
subassemblage and a braced-unaltered version with bracing scheme A are
presented in Fig 5.10. The relative response curves have been
normalized with respect to the ultimate strength of the unstrengthened
frame at each story (load ratio m as defined in Sec. 2.4.2).
The monotonic response curves for the unstrengthened frame shown in
Fig. 5.10 fall within a fairly tight band as expected. The response of
the generic subassemblage is the same as that for story 4 and falls in
the center of the family of curves.
Recall that in bracing scheme A the size of the cable braces was
changed at every level of the frame. The family of curves representing
response of the braced frame with bracing scheme A falls within a
relatively tight band. The curves have a range of 0.31 at 0.88% drift
and a deviation of 0.13 using the generic subassemblage response as the
basis. The response of the braced generic subassemblage is identical to
the response of story 4 and falls near the center of the family of
curves. The generic subassemblage model underestimates the ultimate
strength of story i by 4.8% and overestimates the ultimate strength of
story 2 by 8.8%. For bracing scheme A the generic subassemblage
Fig. 5.9 Monotonic response of unbraced and braced versions of thegeneric single story subassemblage, n=2, Ac=l.0)5 in2
123
6.0- SCHEME A
5.5-
5.0-
4.5-
4.0-
3.5-
.0 3.0-BRACED FRAME S~y
0
2.0-
1.5-
1 .0- UNSTRENOTHENED FRAME
0.5-
0.0-
-0 .A. II
0.0 0.2 0.4 0.6 0.8 1.0 1.2 1.4 1.6
Interstory Drift (%)SYMBOL - STORY6 --- 5 '4 3
- -2 - -- - I
Fig. 5.10 Relative monotonic response of unbraced and braced versionsof the six story subassemblage changing size of cable bracesevery story, scheme A
124
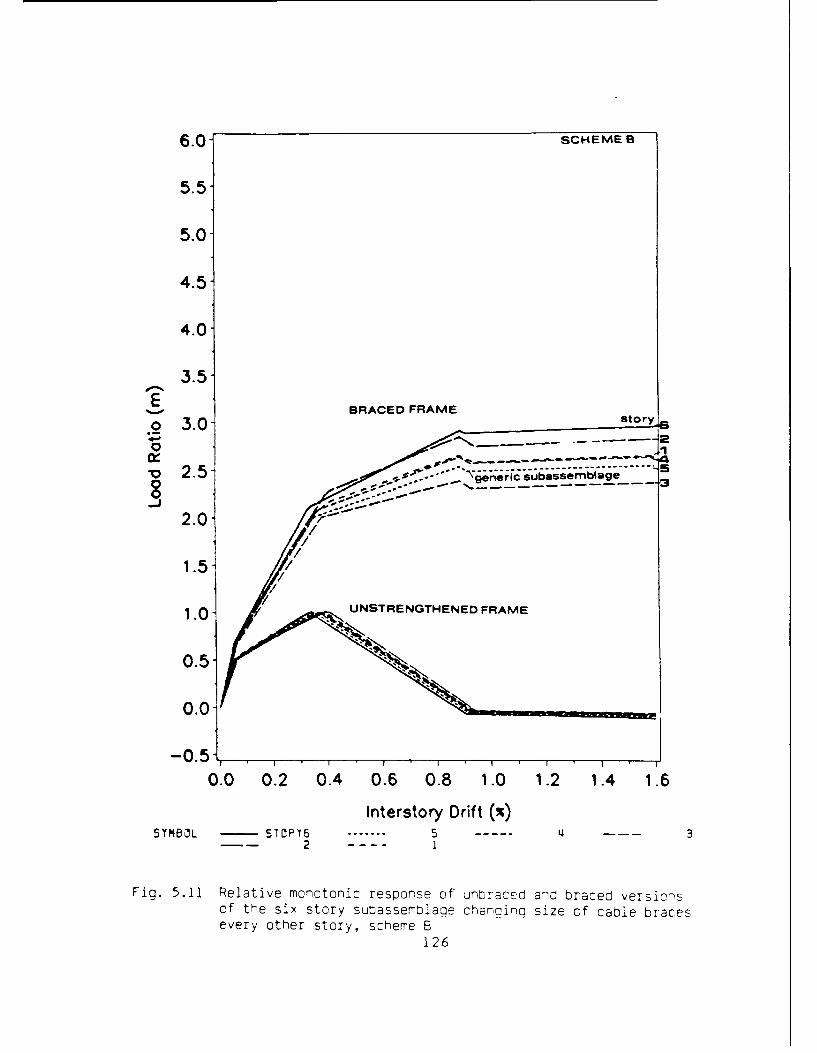
Using bracing scheme B the cable brace size was changed every other
story (at levels 3, and 5). The relative response curves for bracing
scheme B are plotted in Fig. 5.11. The response of the generic
subassemblage is presented as well and plots on top of the story 5
curve. The dispersion of the response curves is more apparent in this
bracing scheme and falls into roughly two distinct bands as expected
since the cable brace size was changed every other story. One band
contains the curves for the odd numbered stories 1, 3, and 5. The
second band contains curves for the even numbered stories 2, 4, and 6.
The range of the curves is 0.52 at 0.88% drift. The deviation from that
of the generic subassemblage response increases to 0.23. The generic
subassemblage model underestimates the ultimate strength of story 6 by
14.7% and overestimates the ultimate strength of story 3 by 6.0%.
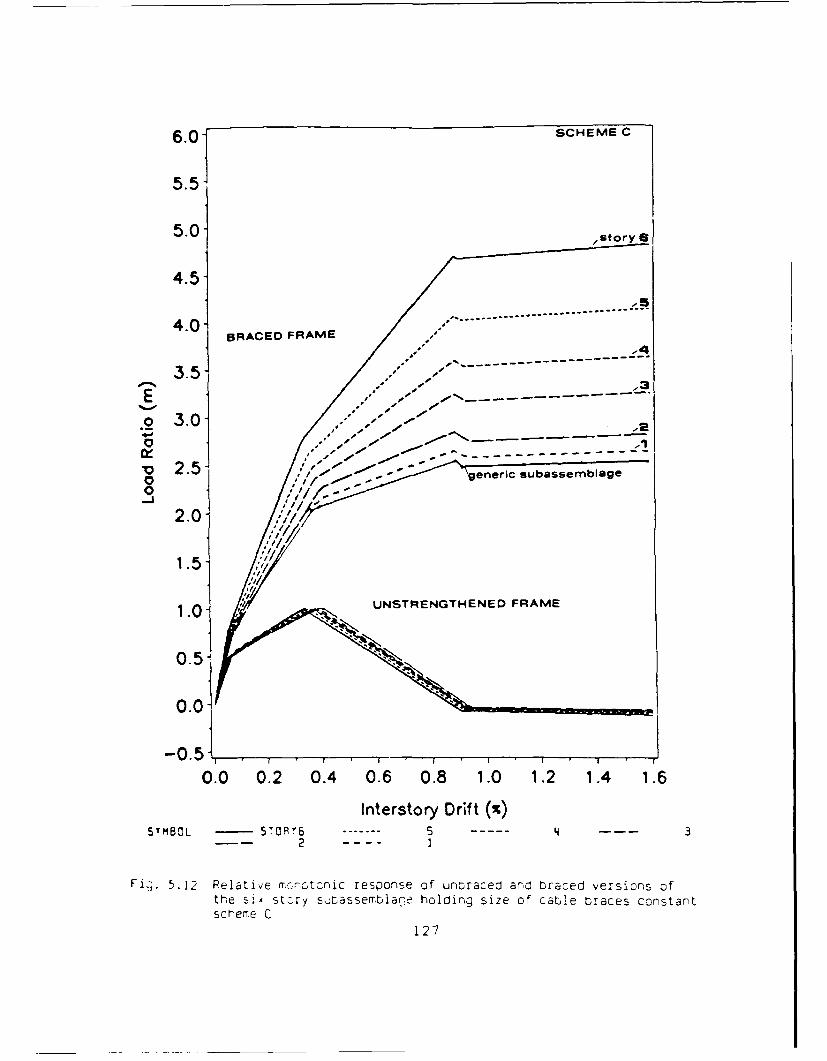
In bracing scheme C the cable brace size is held constant for the
entire height for the structure. The response of the six story
subassemblage with bracing scheme C is plotted in Fig. 5.12. The
response of the generic subassemblage is presented in the figure as well
for comparison. The family of braced response curves are dispersed to
the maximum extent under this bracing scheme. The range of the curves
is 2.06 and the deviation from the generic subassemblage model is 1.33.
The generic subassemblage model underestimates the ultimate strength of
story 6 by 86.9%.
The generic subassemblage model becomes progressively less accurate
in representing the global response of the frame as the bracing scheme
employed deviates from one in which the cable brace area is changed at
every story level. In a practical bracing scheme, cable brace area
125
6.0- SCHEME 8
5.5-
5.0-
4.5-
4.0-
BRACED FRAME
.2 3.00
2.5~ geric subassemblage --
2.0-
1.0 UNSTRENGTHENED FRAME
0.5-
0.0
0.0 0.2 0.4 0.6 0.8 1.0 1.2 1.4 1.6
Interstory Drift (%)SYMBOL - S~TOP16 ---- L-- 3
- - ~2 -
Fig. 5.11 Relative monotonic response of untbraced and braced versic-sof the six story subassemblace chard nq size of cable bracesevery other story, scheme 8
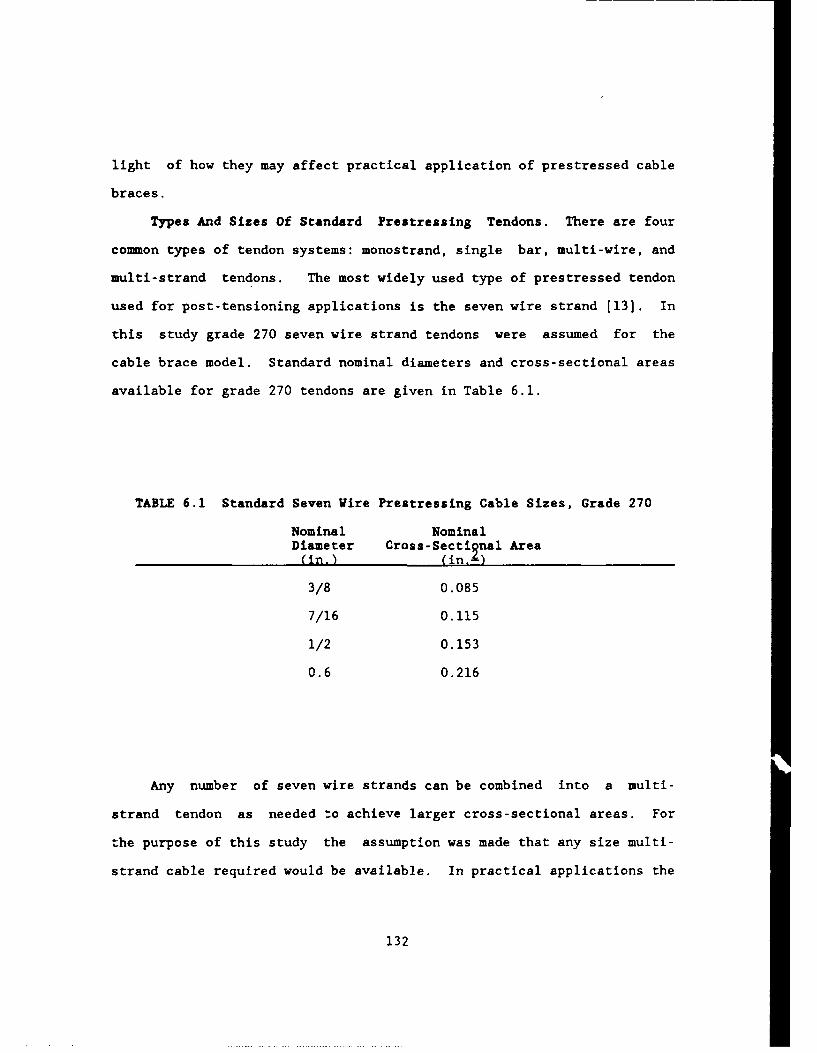
WWI rang. i 4 sagh tendon foce 11111 long* In ohealh ionlon *,or.no Of insdeO. s 10 (kN) no of W06 d1- it' (kIN)stra/de in. (mmn) 0.7 Am,, strad on. (M-) 0 r~l
E -12 1" (c6o) 23' 3 (026) E- 12 a I &(I1) 2I320 tIO1)M1 ISO (03) 3400 (1046) It 300 (70) 401.1 (ties)
ES- I S 12 3 (0) 700a (1071) EI- lB 13 226 (as) 42S (17 f)If 2 it (1) 6492 (2442) Is 2.1 t") 177.4 (240)
E5-22 32 26 (a1) spt (267) E6-22 Is 400(too) 804 (3446)2 2 0 36 8) 641 a (21) I2 400(100) 01 A (40 i)
E5-31 i2 3 " (00) 44 6 (266?) E-31 I s 4 " (1t4) 1042 (1I)8I 4 g I0) I a 2"IW at $00(lt*) 12710 51664)
if&-&& as 6490 (I) 1600 4 (7070) E-5S of 4 6(106) I0"4 11" $0)
(C) VSL 1/2 e.(13mniJ-270K I seres' (d VSL 0.6 m. (15nin)-270K E wes"
Fig. 6.2 The VSL multi-strand post tensioninq system [13]
136
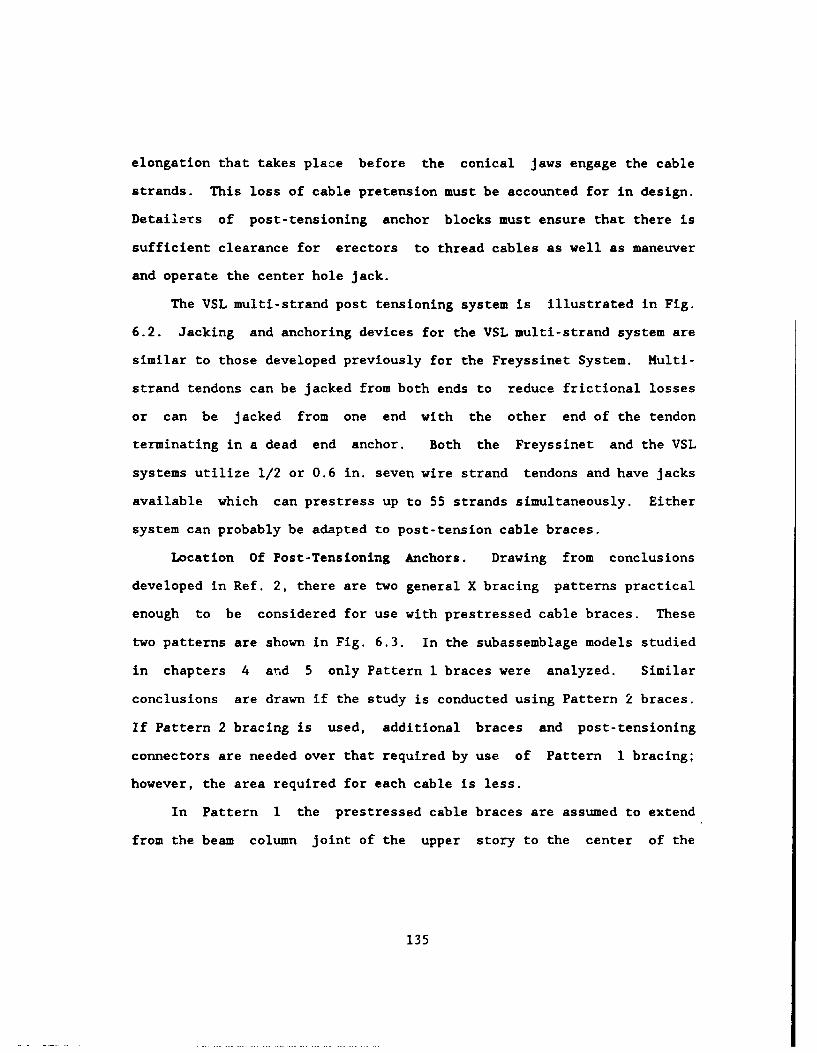
A
PATR I PATR 2
SEE BRACING DETAIL I
SEE BRACING DETAIL 2
Fig. 6.3 Prestressed cable bracing patterns
137
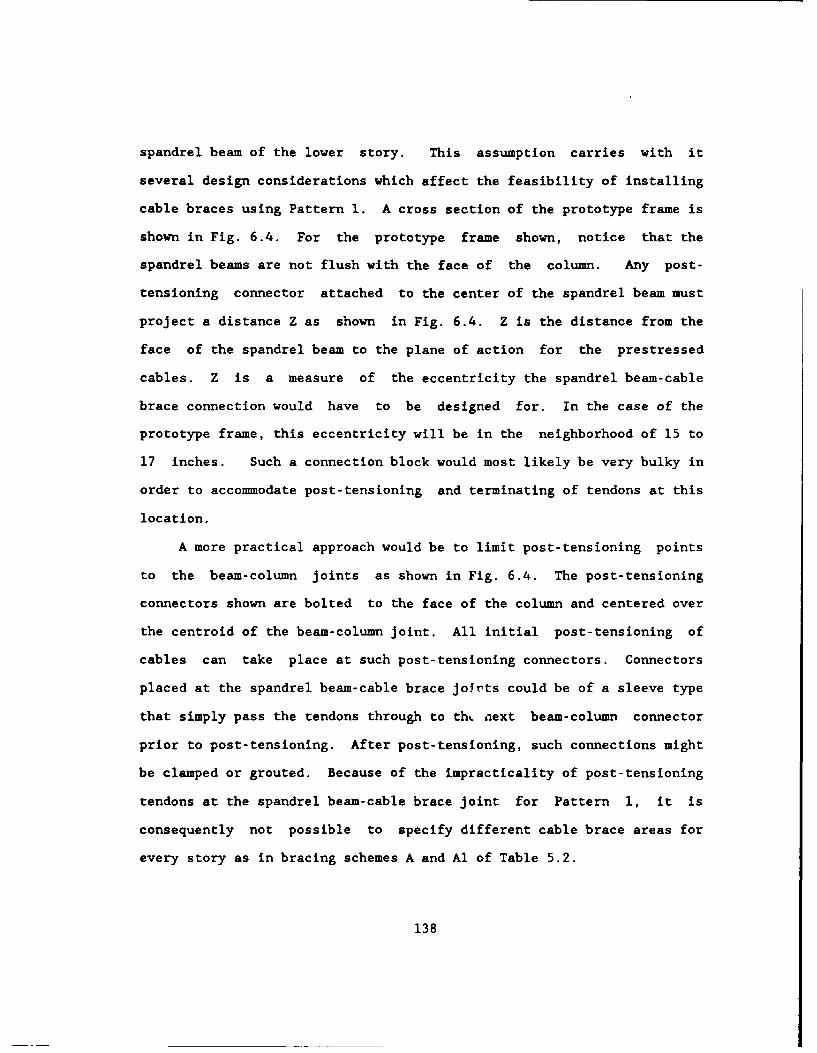
spandrel beam of the lower story. This assumption carries with it
several design considerations which affect the feasibility of installing
cable braces using Pattern 1. A cross section of the prototype frame is
shown in Fig. 6.4. For the prototype frame shown, notice that the
spandrel beams are not flush with the face of the column. Any post-
tensioning connector attached to the center of the spandrel beam must
project a distance Z as shown in Fig. 6.4. Z is the distance from the
face of the spandrel beam to the plane of action for the prestressed
cables. Z is a measure of the eccentricity the spandrel beam-cable
brace connection would have to be designed for. In the case of the
prototype frame, this eccentricity will be in the neighborhood of 15 to
17 inches. Such a connection block would most likely be very bulky in
order to accommodate post-tensioning and terminating of tendons at this
location.
A more practical approach would be to limit post-tensioning points
to the beam-column joints as shown in Fig. 6.4. The post-tensioning
connectors shown are bolted to the face of the column and centered over
the centroid of the beam-column joint. All initial post-tensioning of
cables can take place at such post-tensioning connectors. Connectors
placed at the spandrel beam-cable brace Jo~rts could be of a sleeve type
that simply pass the tendons through to thL aext beam-column connector
prior to post-tensioning. After post-tensioning, such connections might
be clamped or grouted. Because of the impracticality of post-tensioning
tendons at the spandrel beam-cable brace joint for Pattern 1, it is
consequently not possible to specify different cable brace areas for
every story as in bracing schemes A and Al of Table 5.2.
138
COLUMN
POST TENSIONING
CONNECTOR
kz-
SPANDREL BEAM
FLOOR SLAB
FRAME SECTION
Fig. 6.4 Frame section showing a profile view of Pattern 2 Type B
post-tensioning connectors
139
Post-Tensioning Sequence. The analytical research presented thus
far begins with the post-tensioned cables already in place. Static
analysis of the braced frame with DRAIN-2D confirms that the additional
forces imposed by the prestressed cable braces do not yield any of the
members or joints of the original unstrengthened frame. However, this
may not be true during the installation and initial post-tensioning of
the cable brace system. Careful attention must be given to the post-
tensioning sequence for the bracing system. Simultaneous and or
incremental post-tensioning of several cables may be necessary in order
to avoid overstressing the structure during the retrofitting operation.
Out-Of-Plane Forces. Significant out-of-plane forces are imposed on
the frame with the installation of a prestressed cable brace system.
For the purpose of the present analytical study the assumption was made
that all forces associated with the retrofitted frame are in-plane. The
distances Zl and Z2 in Fig. 6.4 illustrate the incorrectness of this
assumption. Zl and Z2 are the distances between the planes of action
for the beam forces and the bracing system. The maximum distance Z2 can
be as high as 21 inches for the prototype frame. Such eccentricities
will impose torque on the frame columns. This problem will be
predominate during the post-tensioning operation on all bays; however,
it will persist on columns adjacent to unbraced bays even after post-
tensioning is completed. The magnitude of such out-of-plane forces must
be evaluated and considered with respect to the capacity of the frame to
carry these forces.
140
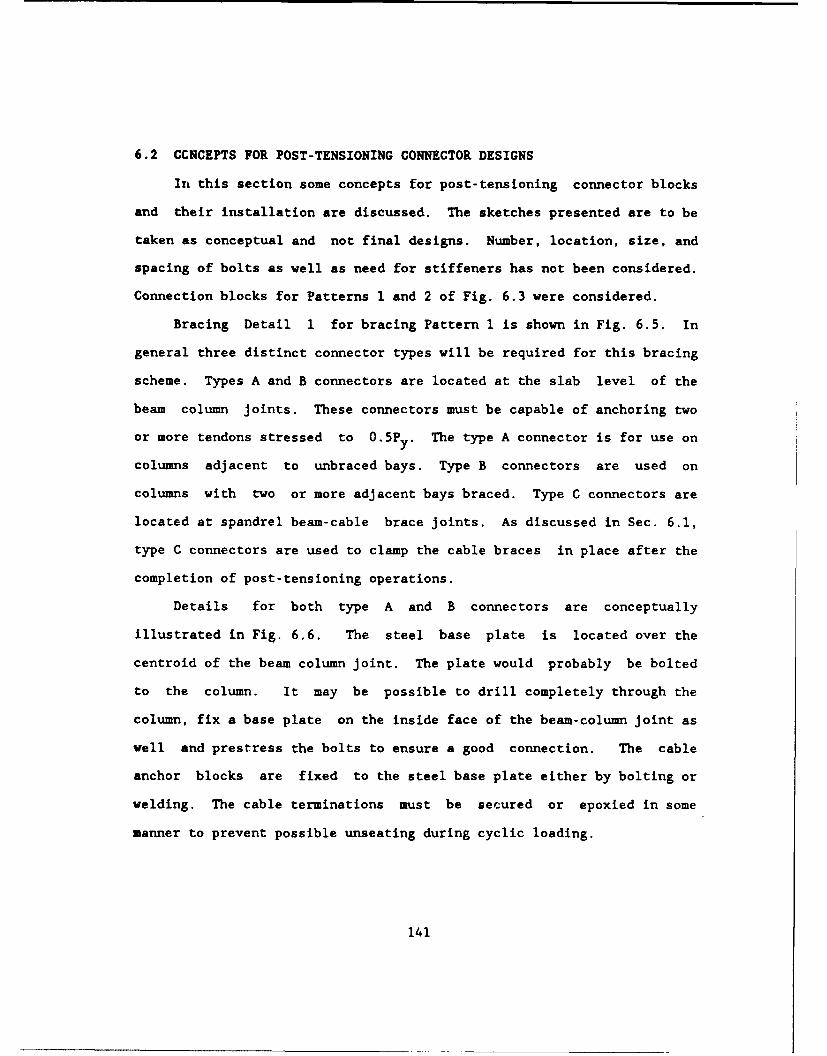
6.2 CCNCEPTS FOR POST-TENSIONING CONNECTOR DESIGNS
In this section some concepts for post-tensioning connector blocks
and their installation are discussed. The sketches presented are to be
taken as conceptual and not final designs. Number, location, size, and
spacing of bolts as well as need for stiffeners has not been considered.
Connection blocks for Patterns 1 and 2 of Fig. 6.3 were considered.
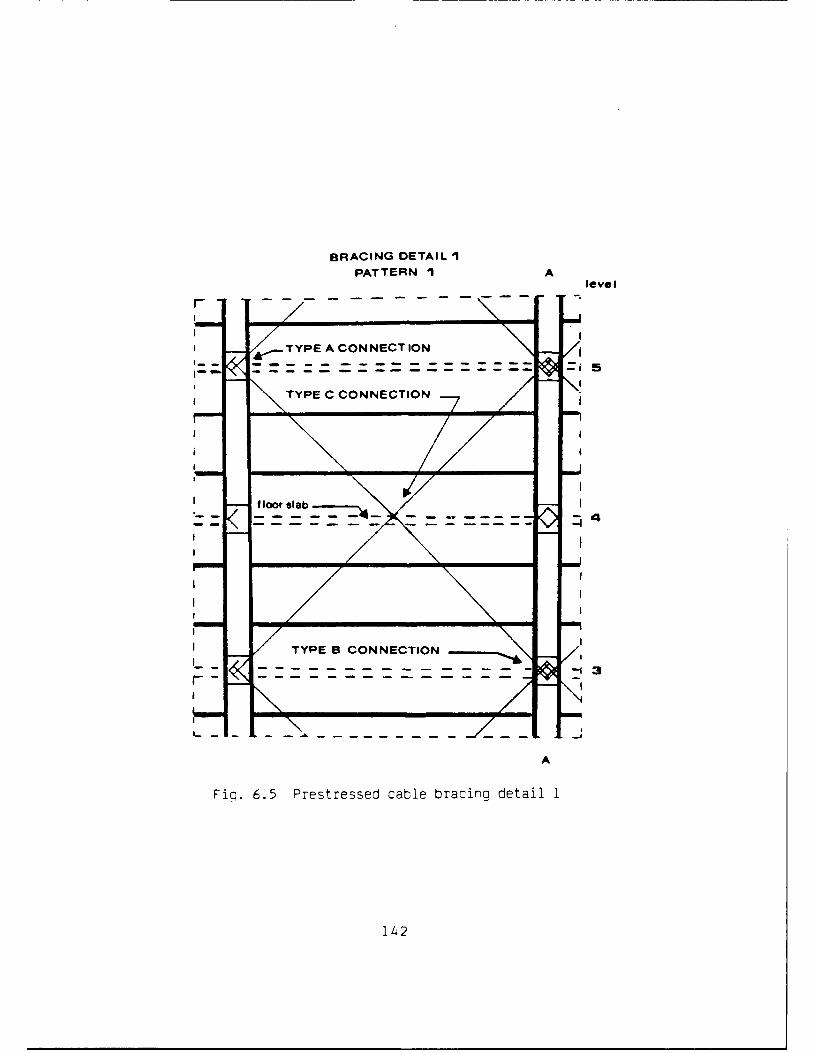
Bracing Detail 1 for bracing Pattern 1 is shown in Fig. 6.5. In
general three distinct connector types will be required for this bracing
scheme. Types A and B connectors are located at the slab level of the
beam column joints. These connectors must be capable of anchoring two
or more tendons stressed to 0.5P The type A connector is for use ony.
columns adjacent to unbraced bays. Type B connectors are used on
columns with two or more adjacent bays braced. Type C connectors are
located at spandrel beam-cable brace joints. As discussed in Sec. 6.1,
type C connectors are used to clamp the cable braces in place after the
completion of post-tensioning operations.
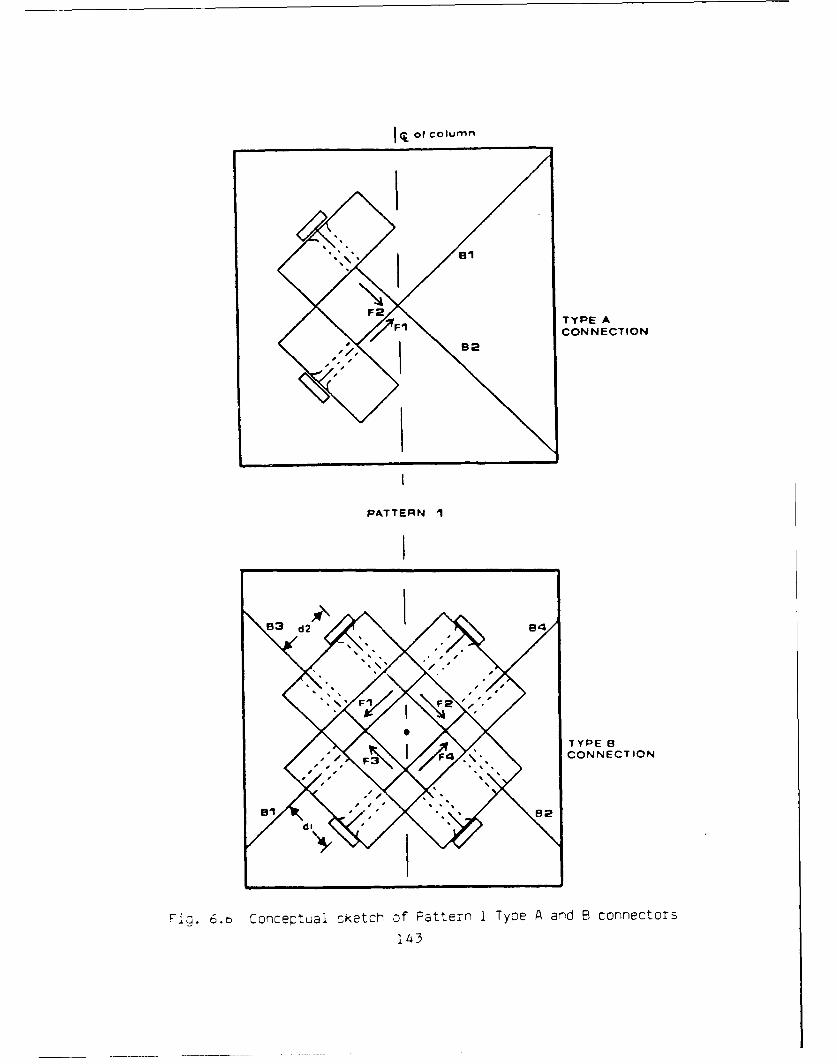
Details for both type A and B connectors are conceptually
illustrated in Fig. 6.6. The steel base plate is located over the
centroid of the beam column joint. The plate would probably be bolted
to the column. It may be possible to drill completely through the
column, fix a base plate on the inside face of the beam-column joint as
well and prestress the bolts to ensure a good connection. The cable
anchor blocks are fixed to the steel base plate either by bolting or
welding. The cable terminations must be secured or epoxied in some
manner to prevent possible unseating during cyclic loading.
141
BRACING DETAIL IPATTERN I A
level
I TYPEABCONNECTION
A i
Fiq. 6.5 PEtrse cal bracingIO deai7
f loor sla
Of Column
TYPE A
CONNECTION
PATTERN I
83 d2 8
TYPE S
F\ /F4 CONNECTION
Fic. 6.6 Conceptual sketch of Pattern 1 Tyne A and B connectors
143
In the type A connection, the prestressed cable force passes
concentrically through the beam column joint as assumed in the computer
model of the analytical study. Since both Fl and F2 are tensile forces,
there is a net horizontal force (horizontal component of Fl + F2) which
must be resisted by the beam-column joint. As pointed out in the
previous section, the eccentricity of this force may be as high as 21
inches for the prototype frame. The designer must look at whether or
not the frame can handle the combined torque and bending. If the torque
is too high, it may be feasible to attach prestressed cable braces to
both the inside and outside faces of the frame, thus eliminating the
torque and reducing the problem to one of pure bending. Attaching cable
braces to the inside face of the frame will require cutting cable
troughs in the floor slabs. This is necessary to pass the cables from
one story to the other. With modern concrete cutting and coring
equipment, placing cable braces on both sides of the frame is quite
feasible. The labor involved, inconvenience to building occupants, and
aesthetics, however, may eliminate cable braces as a desirable
retrofitting scheme.
In a type B connection, forces do not pass exactly through the
centroid of the beam-column joint as shown. If braces Bl, B2, B3, and
B4 are all the same size and carry the same prestress force, the joint
will be in equilibrium under static load. If Bl, B2, B3, and B4 are not
the same, the unbalanced force will have to be carried by the frame.
The cable termination points are located such that the moment FI*F4*dl/2
should be roughly canceled by the moment F2*F3*d2/2. The type B
connection does not experience the same combined torque and bending
144
forces at rest that the type A connection does, except possibly duriig
post-tensioning operations and cyclic loading. The possibility of
overstressing during post-tensioning can be reduced or eliminated by
carefully considering the post-tensioning sequence.
Sizing type A and type B anchor blocks will be fairly straight
forward. Under static load the anchor blocks for both type A and B
connections experience primarily shear force; however, the height of the
blocks may be great enough that bending may become a concern. The cable
spacings, dl and d2, are dependent on the clearance requirements of the
center hole jacks used to post-tension the cables as well as minimum
spacing and edge distance requirements.
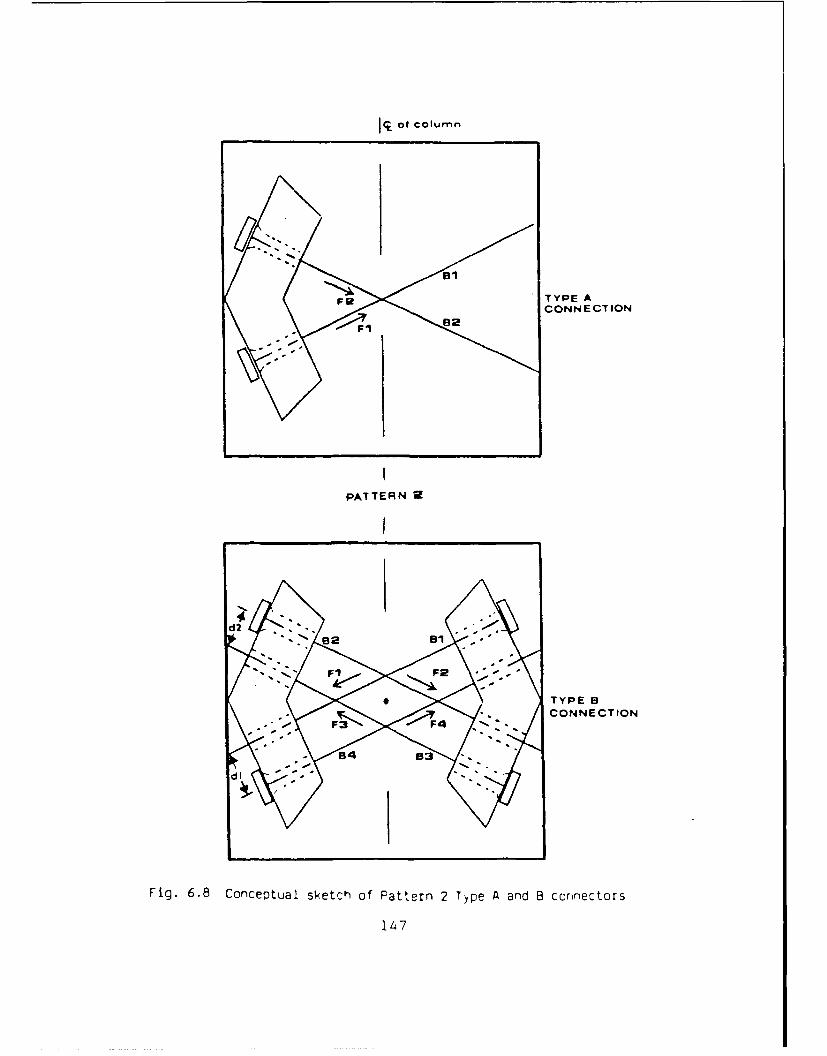
The effect cable brace orientation has on design of type A and type
B connectors is shown in Figs. 6.7 and 6.8. The cable brace areas
required by Pattern 2 bracing schemes are significantly less than those
required by Pattern I bracing schemes. As a consequence, the forces
seen by the connectors in Fig. 6.8 are correspondingly less than the
connectors of Fig. 6.6. This fact may significantly influence the
decision of which bracing pattern is ultimately chosen for the
retrofitting scheme.
145
BRACING DETAIL 2
PATTERN 2 Blevel
5
Fi. 6.7 rocote cab
146
I TTYPEAB
I I 3
I , JB
Fig 6. Prsrseal baigdtiI146
of column
FIR TYPE A
CONNECTION
PATTERN 2
TYPE B
CONNECTION
Fig. 6.8 Conceptual sketch Of Pattern 2 Type A and B connectors
147
CHAPTER 7
SUMMARY AND CONCLUSIONS
7.1 SUMMARY
The objective of this thesis is to study analytically the
effectiveness of prestressed cable bracing systems in conjunction with
beam alteration as a viable retrofit strengthening scheme for
seismically inadequate structures. Structures which are likely
candidates for seismic retrofitting are inadequate for two primary
reasons: 1) their lateral load carrying capacity is insufficient to
sustain seismic loading specified in current building codes and/or,
2) the unstrengthened structures feature an undesirable failure
mechanism such as failure of the columns in shear.
The prototype frame studied in this thesis is typical a class of
building commonly constructed during the 50's and 60's in California and
elsewhere. !he reinforced concrete prototype frame features deep
spandrel beams and short columns. The structure is six stories high and
eleven bays long. The external frames are adequate to carry gravity
loads but are deficient in lateral capacity. The prototype frame's
failure mechanism is non-ductile and is dominated by shear failure of
the reinforced concrete short columns.
The analytical study was carried out using DRAIN-2D. DRAIN-2D is a
general purpose computer program for the dynamic analysis of inelastic
plane frame structures. The current version of the program features
element EL7, a reinforced concrete element with degrading stiffness.
With EL7 one is able to model the negative lateral stiffness exhibited
148
by a reinforced concrete short column once its shear capacity has been
reached. An option has been added to the program which utilizes the
program's existing dynamic analysis algorithm to perform static
incremental displacement analysis.
In the first part of the study the effectiveness of prestressed
cable braces applied to a single story subassemblage of the prototype
frame was re-examined. The concept of beam alteration or beam weakening
was then introduced. A single story subassemblage was studied under
several beam alteration schemes. The affect of systematically weakening
the spandrel beams on the frame's failure mechanism was determined. An
optimum beam alteration scheme was selected for the subassemblage. The
response of unstrengthened, braced-unaltered and braced-altered
subassemblages were studied under both monotonic and cyclic loading.
The second part of this research expanded on the first part by
focusing on the behavior of a six story subassemblage of the prototype
frame to retrofit strengthening. The remaining four levels of the
prototype frame were designed in accordance with building codes and
design procedures in common use when such structures were originally
constructed.
The response of unstrengthened, braced-unaltered, and braced-
altered unique single story subassemblages were studied and compared to
the response predicted by a six story subassemblage. The influence of
changing brace areas at various elevations of the frame was evaluated by
contrasting the response of a generic subassemblage to the response
obtained from analyzing a six story subassemblage retrofitted with
different brace area schemes (with and without beam alteration). The
149
retrofit schemes studied were also evaluated with respect to their
adequacy for meeting current building code seismic strength
requirements.
The third part of this thesis focused on examination of some
practical aspects of designing and installing prestressed cable bracing
systems. Several design considerations were introduced which must be
addressed to practically implement prestressed cable bracing. Finally,
conceptual connection details were presented which illustrated how
prestressed cable braces might be attached to a structure in a
retrofitting operation.
7.2 CONCLUSIONS
The following conclusions can be drawn from this study of
retrofitting seismically deficient reinforced concrete frames with
prestressed cable bracing systems and beam alteration:
1) A prestressed cable bracing system applied to the weak column-
strong beam frame studied is effective in increasing lateral strength.
Following either the ultimate strength or serviceability design
approach, any reasonable desired strength can be attained by choosing an
appropriate design ratio n for use in determining cable areas required.
2) The use of prestressed cable bracing alone on the prototype
frame improves the ductility of the strengthened system (assuming the
columns can maintain gravity load capacity). The additional ductility
is solely attributable to the bracing, as the frame's failure mechanism
is unaltered.
150
3) Beam alteration is an effective means of altering the failure
mechanism of the original frame studied. Failure can be shifted from
the columns to the beams by selectively reducing the strength and
stiffness of the beams. It was determined that the moment capacity of
the prototype spandrel beams at midspan, as well as shear capacity at
the spandrel ends, were sufficient to carry gravity loads even if all
primary positive and negative reinforcement is severed. As a result, it
is possible to weaken the beams sufficiently to ensure that plastic
hinges form in the beams prior to the columns reaching their ultimate
shear capacity. Ultimate strength of the original frame is greatly
reduced by weakening the beams. The improvement in frame ductility,
however, is dramatically improved.
4) The cyclic behavior of the prototype frame is dramatically
improved with use of beam weakening. Evaluation of the hysteretic
behavior of the original and altered frames indicates the altered frame
will dissipate significantly more energy during a seismic event.
5) The consequential reduction in frame lateral strength resulting
from beam weakening can be restored by supplemental use of prestressed
cable braces. Combination of prestressed cable bracing and beam
alteration results in dramatic improvements in strength, ductility, and
failure mechanism.
6) For a given cable brace area, ultimate lateral strength
attained by the retrofitted prototype frame is significantly increased
if beam weakening is part of the retrofitting scheme. The trade off is
that the increased ultimate strength is achieved at a much greater
drift. The strength attained with the prestressed cable brace/beam
151
alteration scheme can be made to equal that attained by the bracing only
scheme at lower drift levels by increasing the cable brace area. For
the retrofit scheme studied, a 43% increase in cable brace area resulted
in a 25% increase in stiffness in the retrofitted system.
7) For symmetric reinforced concrete frame structures with uniform
bracing in every bay, global frame response can be predicted accurately
by analysis of unique single story subassemblages established for each
story, as well as by multi-story subassemblage models.
8) The value of using a single generic single-story subassemblage
to represent the global behavior of a frame to retrofit strengthening is
somewhat limited. Comparable results with analysis of a multi-story
subassemblage can be obtained for a bracing scheme consisting of uniform
bracing in all bays and cable brace size determined uniquely for each
story using a constant design ratio n. For cases utilizing constant
brace areas over several stories, unique single story subassemblages for
each story in the frame should be developed.
9) Any practical retrofitting scheme will be based most likely on
two types of objectives. The primary objective will likely be to
increase the lateral strength capacity of the original frame at each
story to that required to resist current building code design loads.
The second objective might be a serviceability, or drift criteria. Such
a criteria might be to prevent shear failure of the columns from
occurring at low drifts as in the prototype frame studied. To meet such
objectives, the required design ratio n can be established for each
individual story. In the case the prototype frame studied, higher
152
design strength ratios are required for the first three stories than for
the upper three stories.
10) Actual application of practical prestressed cable bracing
systems introduces several design and installation considerations not
investigated in this analytical study. Some of these considerations are
briefly discussed below.
a) Location of post-tensioning anchors. The magnitude of the
prestressing forces applied to the cable braces may introduce
excessive internal stresses to the original frame. For the
prototype frame examined in this study, the beam-column joints
are more able to resist unbalanced prestress forces than
connection points located at the midspan of the spandrel
beams.
b) Post-tensioning sequence. Inattention to the post-tensioning
sequence of the cable braces can also introduce excessive
internal stresses to the original frame. The forces
introduced at a typical interior joint by prestressed cable
braces will balance or nearly balance each other after
installation. Any resulting unbalance should be small and is
transferred to the concrete frame. If post-tensioning of
cables terminating at the joint is not executed either
simultaneously or incrementally, the resulting unbalanced
force, however temporary, is transferred directly to the
concrete frame. Care must be taken to eliminate or minimize
such situations. If not avoidable one must ensure that such
induced stresses do not fail the concrete frame.
153
c) Out-of-plane forces. In the prototype frame studied the face
of the columns and the spandrel beams are not flush.
Installation of the bracing system therefore introduces
additional out-of-plane forces to the system. Such
eccentricities impose torque in addition to bending on the
frame columns. This problem is predominant during the post-
tensioning operation on all bays; however, it will persist on
columns adjacent to unbraced bays even after post-tensioning
is complete. The magnitude of such out-of-plane forces must
be evaluated and considered with respect to the capacity of
the frame to carry these forces.
7.3 RECOMMENDATIONS FOR FUTURE RESEARCH
EXPERIMNTAL RESEARCH: Experimental tests using prestressed cable
braces and beam alteration are needed to verify the analytical
conclusions made in this study. A single story subassemblage such as
those developed in this study for the prototype frame could form the
basis for an experimental study.
The most challenging task to be encountered in setting up an
experimental study will lie in designing and fabricating the post-
tensioning anchor blocks. The connections in the bracing system must
not be the weak link in the system under cyclic loading.
Experimental research is necessary to confirm the effectiveness of
improving the seismic performance of a prestressed cable braced frame
with weak columns by weakening the beams. Various possible weakening
154
techniques including sawing and coring should be investigated.
Guidelines for the design of weakening schemes should be developed.
ANALYTICAL RESEARCH: The research conducted in this study advances
knowledge of prestressed cable bracing system behavior in conjunction
with beam alteration. Analysis was limited to inelastic monotonic and
cyclic incremental displacement analysis. The next step is to perform a
dynamic analysis as well to assess the behavior of the retrofitted
system to a more realistic loading scenario. A dynamic analysis may
reveal some unforeseen problems not encountered in the static
incremental analysis.
The global behavior of the prototype frame was studied with respect
to vertical distribution of cable brace area. It would be interesting
to expand the model to include the entire frame in order to study the
effect of horizontal spacial distribution of prestressed cable braces.
Such a study should be performed using a dynamic analysis. Further
analytical work needs to focus on developing design guidelines for
developing practical prestressed cable area and beam weakening schemes
required to meet the designer's retrofitting objectives.
DRAIN-2D should be revised to increase its usefulness as a research
tool. The program is written in out-dated FORTRAN language and is
configured to run on main frame computer systems of vintage 1970 type.
The numerous changes and additions made to the program by various users
over the years has made troubleshooting the version of the program used
for this study a nightmare. A project could be undertaken to rewrite
the program, from the ground up, with moderti FORTRAN language and state-
of-the-art data storage and processing techniques. The rewritten
155
program should be well documented with a revised user's manual format
and adequate comment statements within the program itself.
156
REFERENCES
1. Kanaan, A. and Powell, G., "DRAIN-2D, A General Purpose ComputerProgram For Dynamic Analysis Of Inelastic Plane Structures WithUser's Guide And Supplement," Earthquake Engineering ResearchCenter, University of California RePort No. EERC 73-6 and 73-22,August 1975.
2. Masroor, T., "Seismic Strengthening Of Reinforced ConcreteStructures Using Prestressed Cable Bracing System," unpublishedMasters thesis , The University of Oklahoma, May 1990.
3. Badoux, M., "Seismic Retrofitting Of Reinforced Concrete StructuresWith Steel Bracing Systems," unpublished Ph.D. dissertation, TheUniversity of Texas at Austin, May 1987.
4. Tang, X. and Goel, S., "DRAIN-2DM Technical Notes And User'sGuide," Reasearch ReDort UMCE 88-1, Department of CivilEngineering, University of Michigan at Ann Arbor, January 1988.
5. Umehara, H., and Jirsa, J., "Shear Strength and Deterioration ofShort Reinforced Concrete Columns under Cyclic Deformations,"PMFSEL Report No. 82-3, The University of Texas at Austin, July1982.
6. Woodward, K., and Jirsa, J., "Influence of Reinforcement on theReinforced Concrete Short Column Lateral Resistance," ASCE Journalof Structural Engineering, Vol. 110, No. 1, January 1984.
7. Bush, T., "Seismic Strengthening of a Reinforced Concrete Frame,"unpublished Ph.D. dissertation, The University of Texas at Austin,May 1987.
8. Sugano, S., and Fujimura, M., "Seismic Strengthening of ExistingReinforced Concrete Buildings," Proceedings of the Seventh WorldConference on Earthauake Enzineerin , Part I, Vol. 4, Istanbul,Turkey, 1980, pp. 449-456.
9. American Concrete Institute, Building Code Reguirements forReinforced Concrete (ACI 318-89), Detroit, MI, 1989.
10. American Concrete Institute, "ACI Building Code," Journal of theAmerican Concrete Institute, Detroit, MI, April 1951.
11. American Concrete Institute, Reinforced Concrete Design Handbook,2nd Edition, American Concrete Institute, Detroit, MI, 1955.
12. Pacific Coast Building Officials Conference, Uniform Building Code1955 Edition, Volume 3, Los Angeles, CA, 1955.
157
13. Collins, M. and Mitchell, D., Prestressed Concrete Structures,Prentice Hall, Englewood Cliffs, NJ 07632, 1991.
14. Keshavarzian, M., Schnobrich, W.C., Analytical Models for theNonlinear Seismic Analysis of Reinforced Concrete Structures,"Engineering Structures, 1985, Vol. 7.
15. International Conference Of Building Officials, Uniform BuildingCode, 1988 Edition, Whittier, CA, 1988.
158
APPENDIX A
REVISED USER'S GUIDE FOR DRAIN-2D MAIN PROGRAM
WITH ELEMENTS EL7 AND ELl(m)
DRAIN-2D is a general purpose computer program for dynamic
response analysis of planar inelastic structures under earthquake
excitation. The program was originally developed by A. E. Kanaan and G.
H. Powell in 1972 at the University of California at Berkeley [1]. The
program has undergone several expansions and modifications since 1975 by
various users at the University of Michigan at Ann Arbor [4], University
of Texas at Austin [3], and the University of Oklahoma [2].
This appendix contains a complete user's guide for the program
version used in this study. Data input specifications are given for
elements EL7, reinforced concrete element with degrading stiffness, and
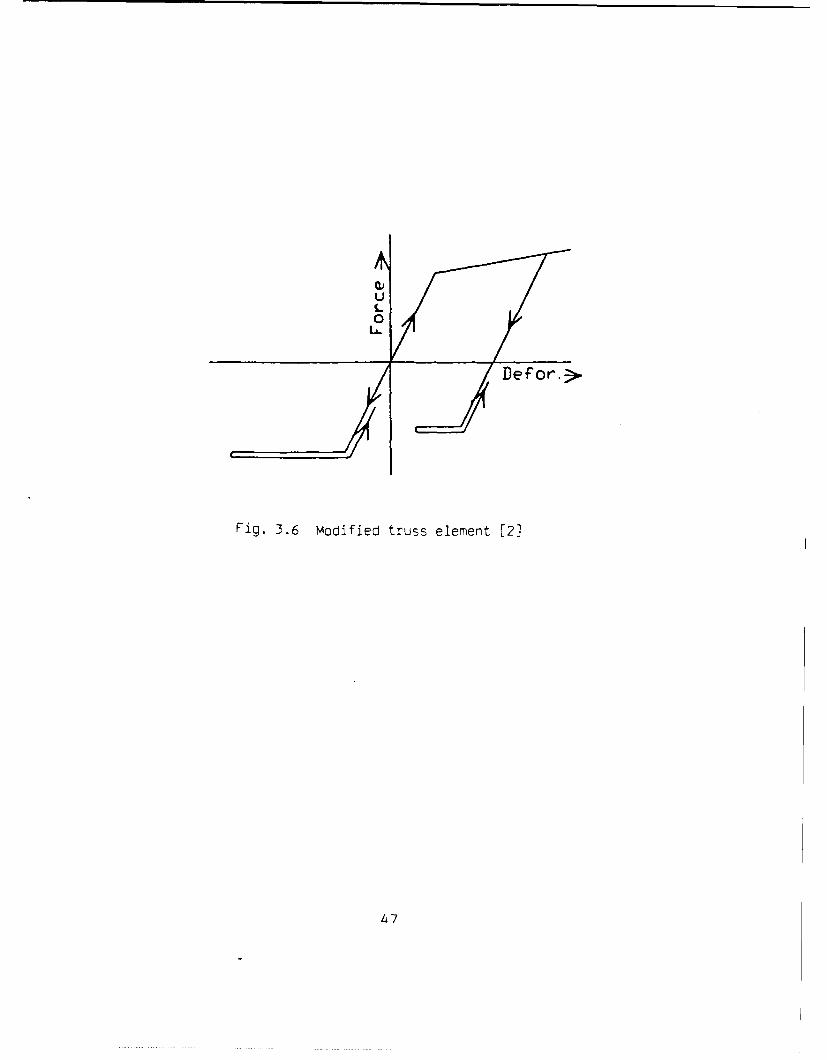
ELl(m), truss element modified to model a prestressed cable brace. The
reader is referred to the original user's manual found in reference [1]
for data input instructions for other elements in the program library
not used in this study.
INPUT DATA
The following input cards define the problem to be solved. Consistent
units must be used throughout.
A. PROBLEM INITIATION AND TITLE
CARD A: Problem Initiation And Title (A5,3X,18A4). One card required.
159
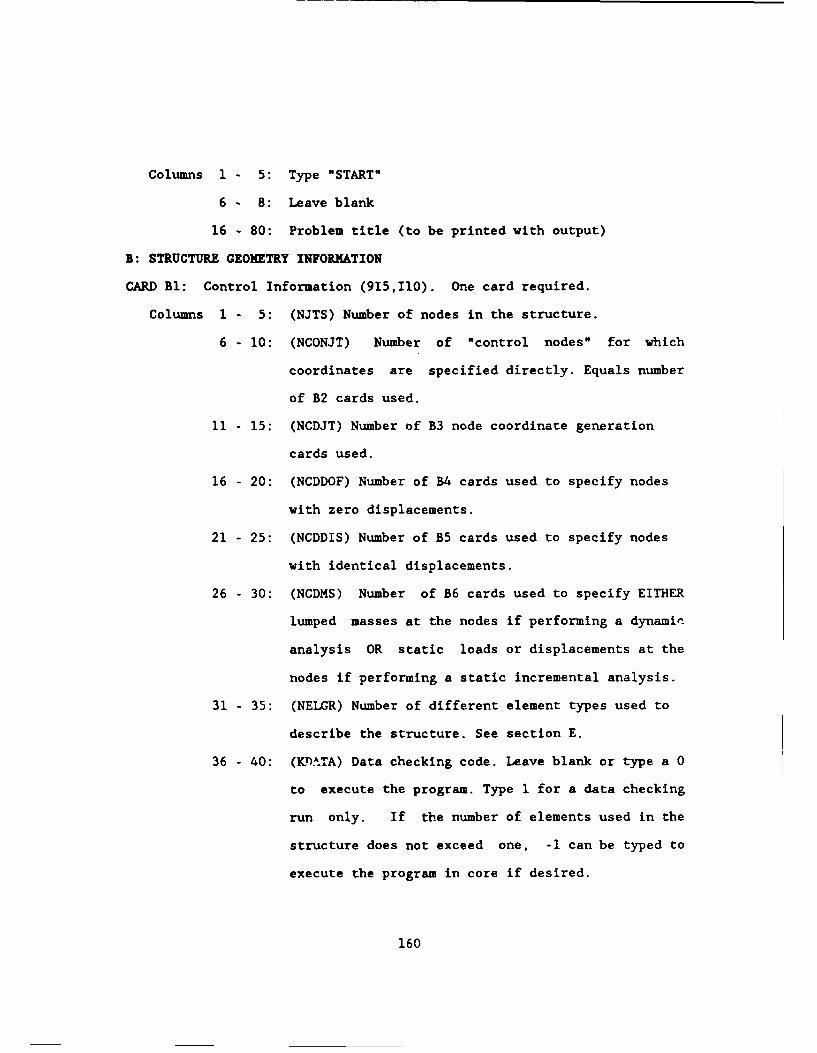
Columns I - 5: Type "START"
6 - 8: Leave blank
16 - 80: Problem title (to be printed with output)
B: STRUCTURE GEOMETRY INFORMATION
CARD Bl: Control Information (915,110). One card required.
Columns 1 - 5: (NJTS) Number of nodes in the structure.
6 - 10: (NCONJT) Number of "control nodes" for which
coordinates are specified directly. Equals number
of B2 cards used.
11 - 15: (NCDJT) Number of B3 node coordinate generation
cards used.
16 - 20: (NCDDOF) Number of B4 cards used to specify nodes
with zero displacements.
21 - 25: (NCDDIS) Number of B5 cards used to specify nodes
with identical displacements.
26 - 30: (NCDMS) Number of B6 cards used to specify EITHER
lumped masses at the nodes if performing a dynamic
analysis OR static loads or displacements at the
nodes if performing a static incremental analysis.
31 - 35: (NELGR) Number of different element types used to
describe the structure. See section E.
36 - 40: (KnA.TA) Data checking code. Leave blank or type a 0
to execute the program. Type 1 for a data checking
run only. If the number of elements used in the
structure does not exceed one, -1 can be typed to
execute the program in core if desired.
160
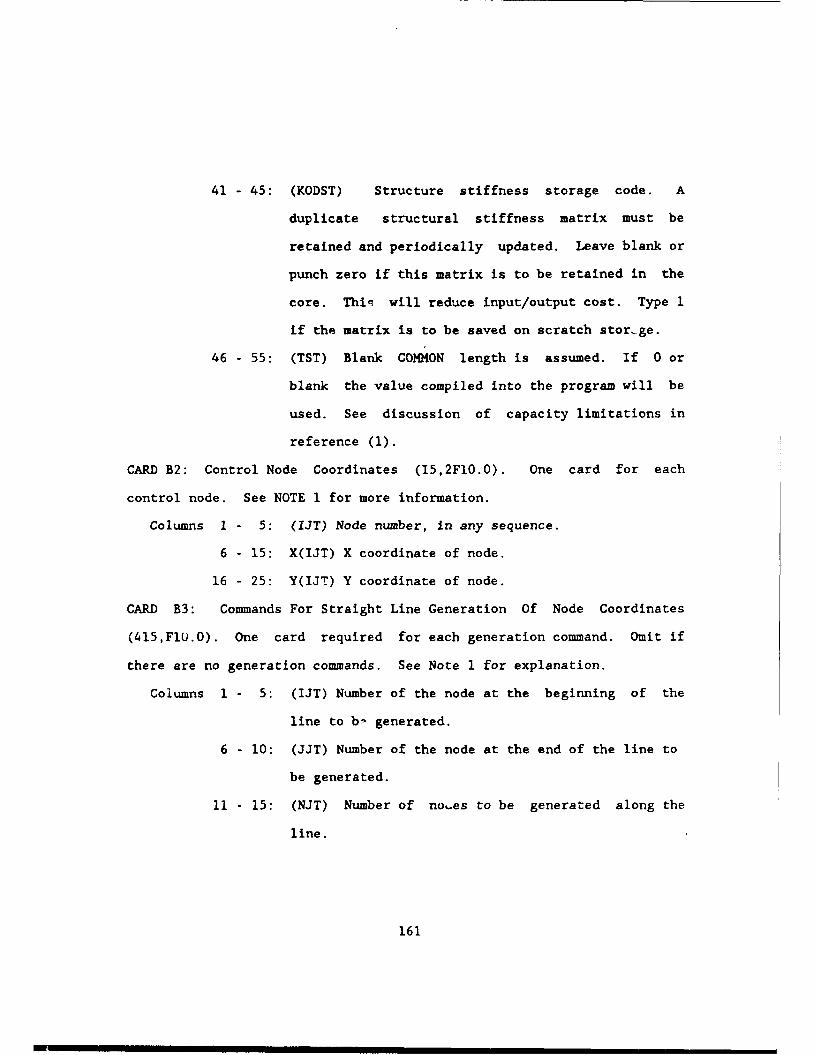
41 - 45: (KODST) Structure stiffness storage code. A
duplicate structural stiffness matrix must be
retained and periodically updated. Leave blank or
punch zero if this matrix is to be retained in the
core. Thii will reduce input/output cost. Type 1
if the matrix is to be saved on scratch stor-ge.
46 - 55: (TST) Blank COMMON length is assumed. If 0 or
blank the value compiled into the program will be
used. See discussion of capacity limitations in
reference (1).
CARD B2: Control Node Coordinates (15,2F10.0). One card for each
control node. See NOTE 1 for more information.
Columns I - 5: (IJT) Node number, in any sequence.
6 - 15: X(IJT) X coordinate of node.
16 - 25: Y(IJT) Y coordinate of node.
CARD B3: Commands For Straight Line Generation Of Node Coordinates
(415,FlU.O). One card required for each generation command. Omit if
there are no generation commands. See Note 1 for explanation.
Columns 1 - 5: (IJT) Number of the node at the beginning of the
line to b- generated.
6 - 10: (JJT) Number of the node at the end of the line to
be generated.
11 - 15: (NJT) Number of noes to be generated along the
line.
161
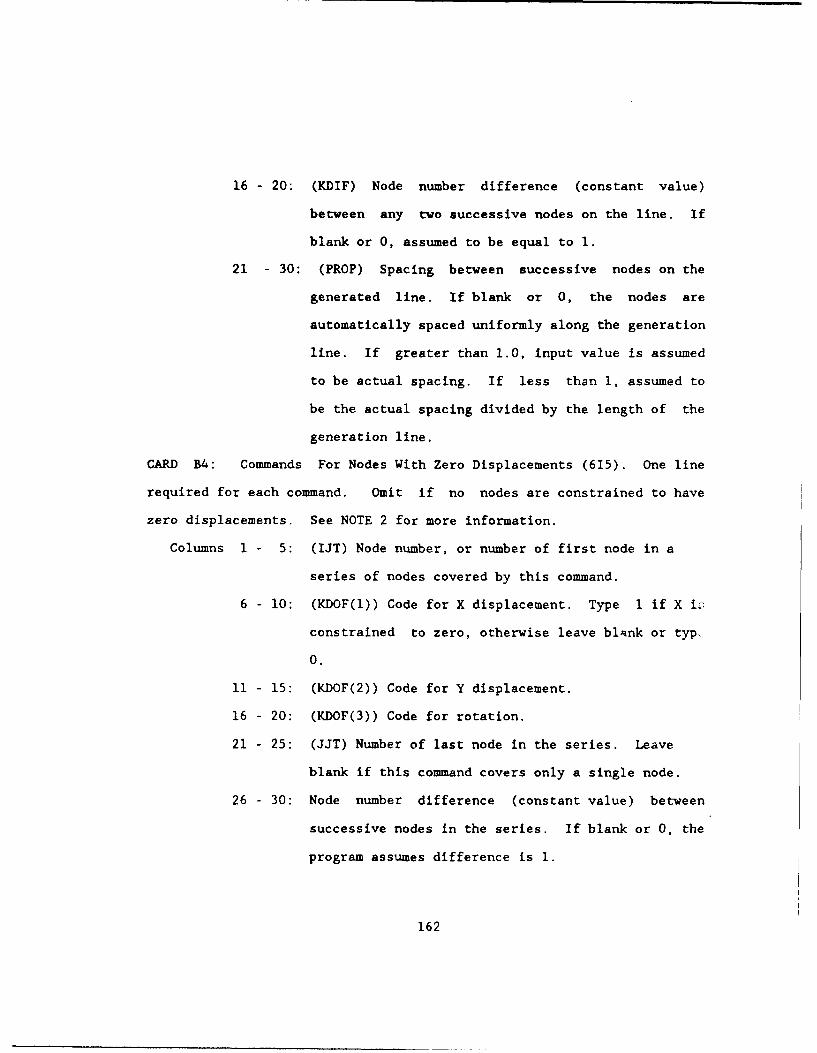
16 - 20: (KDIF) Node number difference (constant value)
between any two successive nodes on the line. If
blank or 0, assumed to be equal to 1.
21 - 30: (PROP) Spacing between successive nodes on the
generated line. If blank or 0, the nodes are
automatically spaced uniformly along the generation
line. If greater than 1.0, input value is assumed
to be actual spacing. If less than 1, assumed to
be the actual spacing divided by the length of the
generation line.
CARD B4: Commands For Nodes With Zero Displacements (615). One line
required for each command. Omit if no nodes are constrained to have
zero displacements. See NOTE 2 for more information.
Columns 1 - 5: (IJT) Node number, or number of first node in a
series of nodes covered by this command.
6 - 10: (KDOF(l)) Code for X displacement. Type I if X iz
constrained to zero, otherwise leave blAnk or typ.
0.
11 - 15: (KDOF(2)) Code for Y displacement.
16 - 20: (KDOF(3)) Code for rotation.
21 - 25: (JJT) Number of last node in the series. Leave
blank if this command covers only a single node.
26 - 30: Node number difference (constant value) between
successive nodes in the series. If blank or 0, the
program assumes difference is 1.
162
CARD B5: Commands for Nodes with Identical Displacements (1615). One
line required for each command. Omit if no nodes are constrained to
have identical displacements. See NOTE 3 for more information.
Columns 1 - 5: (KODOF) Displacement code as follows:
Type 1 for X displacement.
Type 2 for Y displacement.
Type 3 for rotation.
6 - 10: (NJT) Number of nodes covered by this command.
Maximum is 14. See NOTE 3 for procedure when more
than 14 nodes have identical displacements.
11 - 80: (IJOINT(I)) List of nodes in increasing numerical
order. Up to 14 fields, 15 each.
CARD B6: Commands For Lumped Masses At The Nodes If Performing A
Dynamic Analysis (15,3FI0.O,215,FlO.O) OR Commands For Loads Or
Displacements At The Nodes If Performing A Static Incremental Analysis
(I5,3FI0.0,215,FlO.0). One line required for each command.
Columns 1 - 5: (IJT) Node number, or number of first node in a
series of nodes covered by this command.
6 - 15: (FMAS(1))
If performing a dynamic analysis:
Mass associated with X displacement (may be zero)
If performing a static incremental analysis:
Portion of load or displacement associated with the
X direction.
163
16 - 25: (FMAS(2))
If performing a dynamic analysis:
Mass associated with Y displacement. May be zero.
If performing a static incremental analysis:
Portion of load or displacement associated with Y
direction.
26 - 35: (FMAS(3))
If performing a dynamic analysis:
Rotary Inertia. May be zero.
If performing a static incremental analysis:
Leave blank, not used.
36 - 40: (JJT) Number of last node in the series. Leave
blank for a single node.
41 - 45: (KDIF) Node number difference between successive
nodes in a series. If blank or 0, assumed to be
equal to 1.
46 - 55: (SSCALE) Modifying factor.
If performing a dynamic analysis:
Factor by which the masses are divided. If blank or
0 the factor from the previous command is used.
Typically the factor is g and the mass values are
given as weights.
If performing a static incremental analysis:
Type 1.
164
C. LOAD INFORMATION
CARD Cl: Load Control Information (315,6FI0.0). One card required.