20
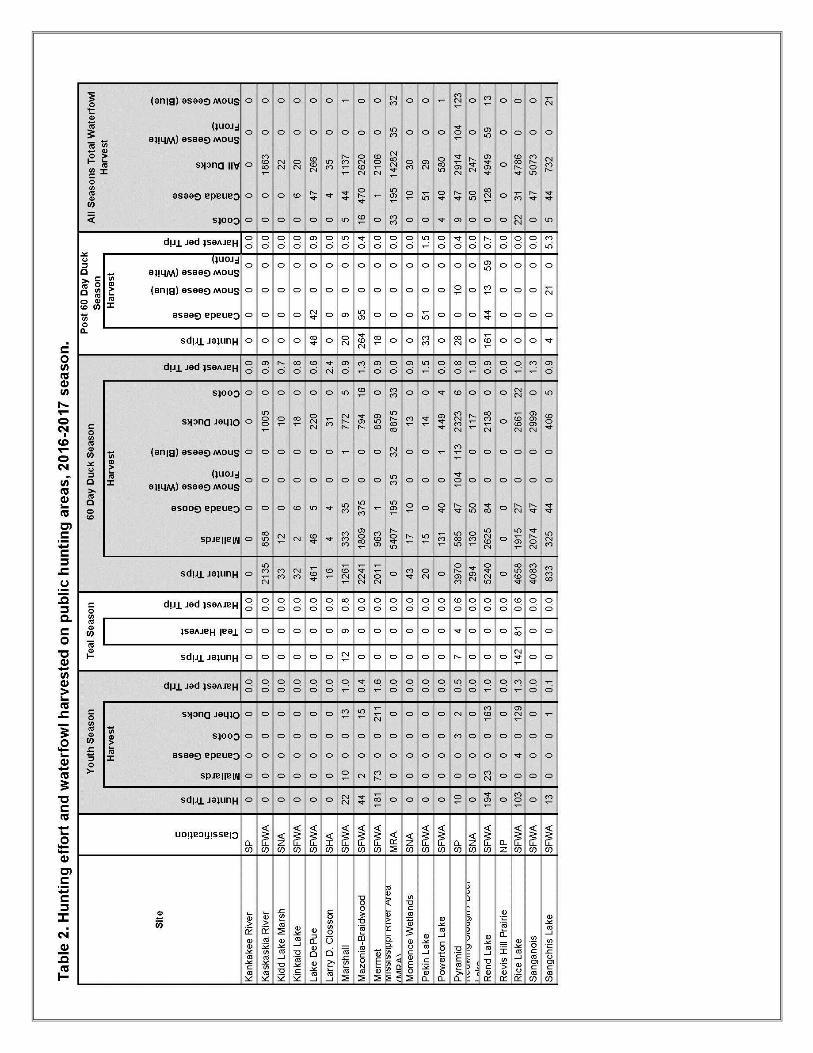
1 The Illinois Public Hunting Areas Report is developed each year to provide information on public hunting/trapping effort and wildlife harvest. This report provides both hunting and trapping information on Illinois Department of Natural Resources (IDNR) owned, leased or managed public hunting sites. Table 2 provides specific information concerning the 2016-17 waterfowl season on public land sites where waterfowl hunting is provided in Illinois. The Federal Aid in Wildlife Restoration Program (resulting from the Pittman-Robertson Act of 1937 – a cost share program administered by the U.S. Fish & Wildlife Service) has either funded or is currently funding wildlife habitat developments, or has acquired land on 117 of the 183 public hunting and trapping areas. Pittman-Robertson (P-R) funding provides wildlife habitat development, maintenance activity, research projects and land acquisition for wildlife management purposes in Illinois. P-R funds also provide funding for Illinois hunter safety course administration and materials. The purpose of the P-R Act is to strengthen the ability of the States to preserve, protect and enhance wild animal and bird resources. Benefits include providing increased public enjoyment of these resources. Equal opportunity to participate in programs of the Illinois Department of Natural Resources (IDNR) and those funded by the U.S Fish and Wildlife Service and other agencies is available to all individuals regardless of race, sex, national origin, disability, age, religion or other non-merit factors. If you believe you have been discriminated against, contact the funding source’s civil rights office and/or the Equal Employment Opportunity Officer, IDNR, One Natural Resources Way, Springfield, IL 62702-1271, 217/782-2662; TTY 217/782-9175. Illinois Public Hunting Areas Report: 2016-2017 Wildlife Harvest John D. Griesbaum Division of Wildlife Resources, Illinois Department of Natural Resources


![Summary of Results of the Big Woods Wildlife Management Area …€¦ · [8] "Deer dog hunting is always disruptive in a public hunting area. When dog hunters arrive, all other hunting](https://static.documents.pub/doc/80x56/5fbfce93e12728088c6e5d99/summary-of-results-of-the-big-woods-wildlife-management-area-8-deer-dog.jpg)


