129
PUBLIC OPINION ON HUNTING AND WILDLIFE MANAGEMENT IN WASHINGTON Conducted for the Washington Department of Fish and Wildlife by Responsive Management 2008

PUBLIC OPINION ON HUNTING AND WILDLIFE MANAGEMENT IN WASHINGTON
Conducted for the Washington Department of Fish and Wildlife
by Responsive Management
2008

PUBLIC OPINION ON HUNTING AND WILDLIFE MANAGEMENT IN WASHINGTON
2008
Responsive Management National Office Mark Damian Duda, Executive Director
Tom Beppler, Research Associate Steven J. Bissell, Ph.D., Qualitative Research Associate
Andrea Criscione, Research Associate Brad Hepler, Ph.D., Research Associate
James B. Herrick, Ph.D., Research Associate Martin Jones, Research Associate
Amanda Ritchie, Research Associate Carol L. Schilli, Research Associate
Tim Winegord, Survey Center Manager Alison Lanier, Business Manager
130 Franklin Street Harrisonburg, VA 22801
Phone: 540/432-1888 Fax: 540/432-1892 E-mail: [email protected]
www.responsivemanagement.com
Acknowledgements
Responsive Management would like to thank the following staff of the Washington Department of Fish and Wildlife: Dave Ware, Game Division Manager, Jerry Nelson, Deer & Elk Section
Manager, Mick Cope, Upland Game Section Manager, Don Kraege, Waterfowl Section Manager, Donny Martorello, Bear, Cougar, Moose, Goat, Sheep, & Furbearer Section Manager,
and Rena Henson, Management Analyst.

Public Opinion on Hunting and Wildlife Management in Washington i
EXECUTIVE SUMMARY INTRODUCTION AND METHODOLOGY
This study was conducted for the Washington Department of Fish and Wildlife (the Department) to determine public opinion on hunting and wildlife management in the state. The study entailed a telephone survey of Washington residents 18 years old and older. For the survey, telephones were selected as the preferred sampling medium because of the universality of telephone ownership. The telephone survey questionnaire was developed cooperatively by Responsive Management and the Department. Responsive Management conducted a pre-test of the questionnaire and made any necessary revisions based on the pre-test. Interviews were conducted Monday through Friday from 9:00 a.m. to 9:00 p.m., Saturday noon to 5:00 p.m., and Sunday from 5:00 p.m. to 9:00 p.m., local time. The survey was conducted in January 2008. Responsive Management obtained a total of 805 completed interviews. The software used for data collection was Questionnaire Programming Language 4.1. The analysis of data was performed using Statistical Package for the Social Sciences software as well as proprietary software developed by Responsive Management. The results were weighted to increase the representation of younger people in the survey, as slightly fewer younger people were reached than would be representative of their actual proportion in the population. This was most likely caused by younger people’s greater use of cell phones in lieu of traditional land lines, as the sampling for the general population was of households, which are based on a listing of land-line telephones. Throughout this report, findings of the telephone survey are reported at a 95% confidence interval. For the entire sample of Washington residents, the sampling error is at most plus or minus 3.45 percentage points. Sampling error was calculated using the formula described below, with a sample size of 805 and a population size of 4,867,922 Washington residents aged 18 years and older. Trends in the data are shown, based on a previous survey conducted in 2001-2002 (hereinafter referred to as the 2002 survey).

ii Responsive Management
PARTICIPATION IN HUNTING AND OTHER OUTDOOR RECREATION The most popular outdoor recreation activities of Washington residents in the past 2 years (of
the seven activities about which the survey asked) were hiking (57% did this), wildlife
viewing (49%), and camping (48%). A second tier or activities were boating (41%), fishing
(40%), and swimming in natural waters (38%).
GENERAL SUPPORT OF OR OPPOSITION TO HUNTING The large majority of Washington residents (82%) approve of legal, regulated hunting, and
only 12% disapprove. Most approval is strong approval (51% strongly approve).
• Those who disapprove of hunting were asked why they disapprove. Most commonly
they give an animal rights answer and/or say that they are against killing animals. These
respondents who disapprove of hunting were then asked if there was anything that would
change their mind about disapproving of hunting. The large majority said that there is
nothing that would change their mind. Otherwise, a few would change their mind if they
knew that there were environmental reasons/wildlife had to be controlled.
• Trend: Overall approval of hunting remained nearly the same from 2002 to 2008.
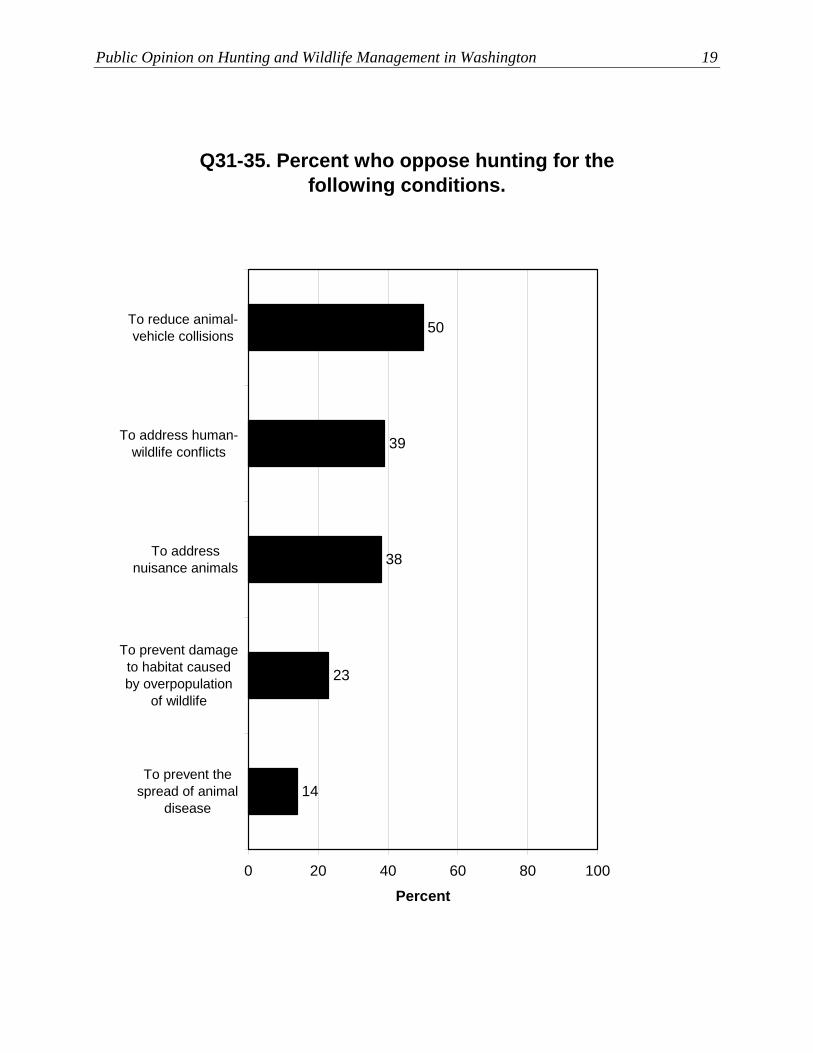
The survey asked respondents about their support of or opposition to hunting for five specific
reasons. These results suggest that concern for the welfare of the animal is greater than
concern for humans. The reasons pertaining to animal welfare have markedly higher support
than the rest: hunting to prevent the spread of animal disease (79% support) and hunting to
prevent damage to habitat caused by overpopulation of wildlife (71% support). Lower
percentages support hunting for reasons related to human welfare: 54% support hunting to
address nuisance animals, 47% to address wildlife conflicts, and 41% to reduce animal-
vehicle collisions. (Indeed, the latter is the only reason for which a majority—slightly more
than 50%—oppose.)
OPINIONS ON HUNTERS’ BEHAVIOR AND HUNTER ETHICS
The survey asked Washington residents how they would characterize the behavior of hunters
in Washington. The most common answer is that they do not know (32%). Otherwise, the
percentage saying that hunters’ behavior is excellent or good (46%) exceeds the percentage

Public Opinion on Hunting and Wildlife Management in Washington iii
who rate hunters’ behavior as fair or poor (22%). Note that the middle answers (good or fair)
of the scale exceed the extremes (excellent of poor).
• Trend: There is only a small difference in perceptions of hunter behavior between 2002
and 2008 (unweighted data). Excellent and good ratings are about the same (46% in
2002 gave an excellent or good rating, while 45% did so in 2008). On the other hand, it
appears that “Don’t know” responses grew (25% in 2002, 33% in 2008) at the expense of
fair/poor ratings (29% in 2002, 22% in 2008).
The survey asked Washington residents to indicate the percentage of Washington hunters
they think comply with all hunting regulations. While only 2% think that all hunters comply
with all hunting regulations, 48% give an answer of 75 percent or more who comply.
(Again, the “don’t know” responses are high—24%.)
OPINIONS ON USING DOGS TO HUNT The survey directly asked Washington residents if they support or oppose the use of dogs to
hunt cougar. Opposition (46%) slightly exceeds support (41%). Note, however, that most
opposition is strong opposition (34% strongly oppose), while support is evenly divided
between strong and moderate.
When specific reasons for hunting cougar with dogs are presented, support increases over the
support in general discussed above (in which 41% support). At the top is support of using
dogs to hunt cougar to protect human safety (65% support), followed by two more reasons
with majorities in support: to protect pets or livestock (56%) and to produce a healthy age
structure in the state’s elk herd, which is preyed upon by cougars (also 56%). At the bottom,
with only 33% in support, is using dogs to hunt cougar for recreation. Indeed, the latter is the
only reason for which a majority oppose hunting cougar with dogs (60% oppose).
OPINIONS ON PREDATOR MANAGEMENT IN GENERAL The survey asked respondents about their support of or opposition to reducing predators for
four reasons. Majorities support reducing predators for the health of threatened or
endangered species (65%) or for human safety (62%), and half support it for protecting pets

iv Responsive Management
and domestic animals (50%). The lowest is to increase game populations (40%), which is the
only reason for which a majority oppose (slightly more than 50%).
• Trend: Support for reducing predators is less in 2008 (unweighted data) than it was in
2002 for three of the four reasons: to address human safety (84% in 2002, 63% in 2008),
to protect threatened or endangered species (76% in 2002, 64% in 2008), and to prevent
loss of domestic animals or pets (69% in 2002, 53% in 2008). Support for reducing
predators to increase game populations was about the same in the two years of study
(40% in 2002, 42% in 2008).
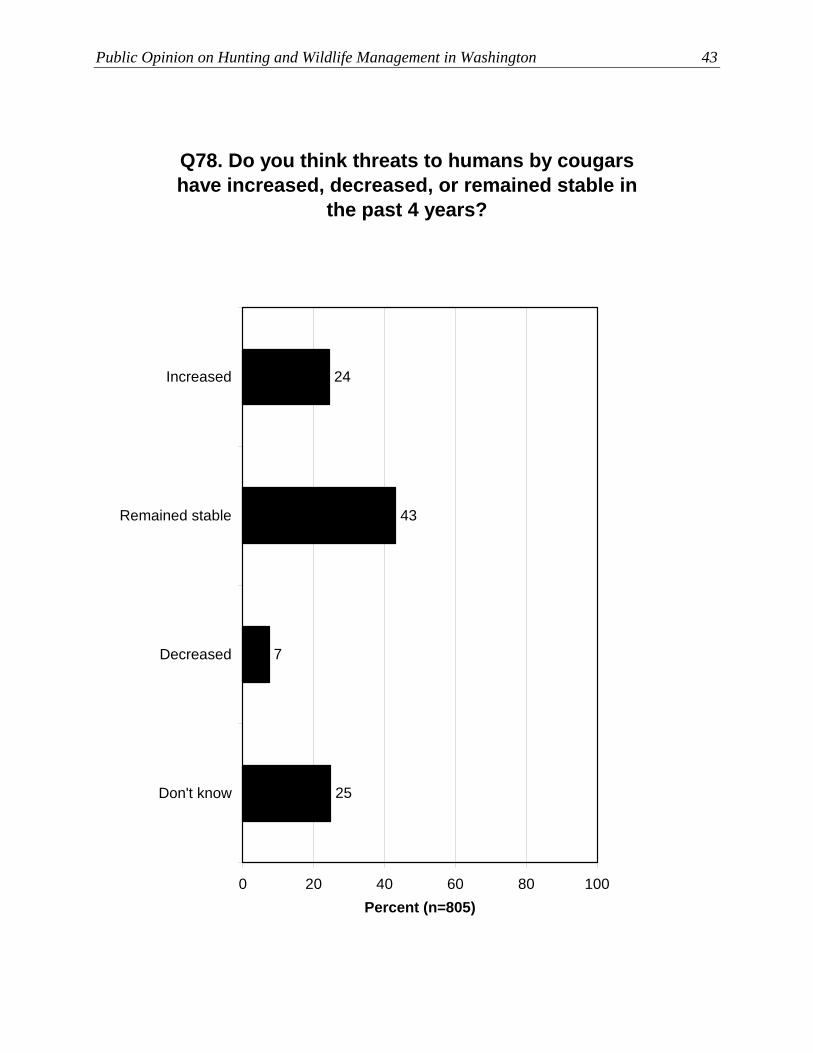
OPINIONS ON MANAGEMENT OF COUGAR AND BLACK BEAR Washington residents most commonly think that threats to humans from cougars have
remained stable in the past 4 years (43% gave this answer); otherwise, they more often think
threats have increased (24%) than decreased (7%). A quarter (25%) do not know.
• Those who say the threats to humans have increased most commonly attribute the
increase to habitat encroachment by humans or simply more media reports about threats;
only a few think threats have increased because the number of cougars has increased.
• Those who say the threats to humans have decreased most commonly attribute the
decrease to fewer media reports/fewer sightings or to their belief that human
encroachment has forced cougars out of the area and thereby reduced threats (i.e.,
cougars just are not around anymore).
Washington residents most commonly think that threats to livestock or pets from cougars
have remained stable in the past 4 years (39% gave this answer); otherwise, they more often
think threats have increased (24%) than decreased (5%). Almost a third (31%) do not know.
• Those who say the threats to livestock or pets have increased most commonly attribute
the increase to habitat encroachment by humans or simply more media reports about
threats; only a few think threats have increased because the number of cougars has
increased.
• Those who say the threats to livestock or pets have decreased most commonly attribute
the decrease to fewer media reports, fewer cougars, or better cougar population
management.

Public Opinion on Hunting and Wildlife Management in Washington v
Washington residents were asked whether local opinion should be given more weight than
statewide opinion in cougar management decisions, and the large majority of residents (74%)
think local opinion should be given more weight.
• A crosstabulation found that those who live in urban areas are less likely to support, and
much less likely to strongly support, giving more weight to local opinion.
Those who disapprove of hunting were asked if they support or oppose using cougar hunting
as a way to manage cougar populations in situations where deer and/or elk herds are below
population objectives and need to be increased. Given this stipulation, 45% of those who
disapprove of legal, regulated hunting support cougar hunting to increase deer and/or elk
herds when necessary.
The survey asked those who had not previously indicated that they disapprove of legal,
recreational hunting a specific question about zone management of cougars. First, an
explanation was given that zone management of cougars would mean that different zones of
the state could have different population objectives for cougar (e.g., keeping the cougar
population stable in one zone while reducing the cougar population in another zone), and that
different population objectives, in turn, could require different hunting methods in the
different zones. These respondents were then asked if they support or oppose zone
management with its different population objectives, and a large majority (79%) support
zone management, while 12% oppose.
The survey asked Washington residents which of four actions they would support to reduce
cougar when Department biologists consider it necessary to do so. Trap and relocate is the
most popular (75%), the only with a majority in support. With medium support is regulated
hunting by licensed hunters (48%) and hunting by Department staff (40%). The lowest
support is for hunting by paid professionals other than Department staff (24%).
The survey asked a similar question to that discussed immediately above pertaining to black
bears instead of cougars. The results are nearly the same. Trap and relocate is the most
popular (75%), followed by regulated hunting by licensed hunters (47%), hunting by

vi Responsive Management
Department staff (38%), and, the lowest, hunting by paid professionals other than
Department staff (22%).
OPINIONS ON MANAGEMENT OF WOLVES The large majority of Washington residents (75%) support allowing wolves to recover in
Washington; meanwhile, 17% oppose.
• A crosstabulation found that those who live in urban and suburban areas are more likely
to support wolf recovery; while those residing in small city/town or rural area are more
likely to oppose. Note that those living on ranches or farms are the most likely to
strongly oppose.
• When the stipulation is put on wolf recovery that it could result in localized declines in
elk and deer populations, support declines slightly: 61% support wolf recovery if it will
result in some localized declines in elk and deer populations, and 28% oppose.
Most Washington residents (61%) support some level of lethal wolf control to protect at-risk
livestock; however, 31% oppose. Additionally, a majority of residents (56%) support having
the state pay compensation out of the General Fund to ranchers who have documented losses
to livestock from wolves, but 35% oppose.
When asked how worried, while recreating outdoors, they would be about wolves,
respondents most commonly say that they would not be worried at all (39%), and 26% would
be only a little worried; in sum, 65% would be only a little worried or not worried at all. On
the other hand, 33% would be very or moderately worried, with 11% very worried.
In a question tangentially related to wolf management, the survey found that wildlife viewing
specifically of wild wolves would appear to be popular, as 54% of residents say that they
would travel to see or hear wild wolves in Washington.
OPINIONS ON MANAGEMENT OF COYOTES The survey asked whether residents support or oppose reducing coyote populations for four
specific reasons. Majorities support each reason, with little difference among them: to

Public Opinion on Hunting and Wildlife Management in Washington vii
protect threatened or endangered species (60% support), to increase wildlife populations
(60%), to prevent the loss of domestic animals (59%), and to address human safety (58%).
OPINIONS ON MANAGEMENT OF RACCOONS Similar to the series of questions about reducing coyote populations, the survey asked
whether residents support or oppose reducing raccoon populations for four specific reasons.
Majorities support each reason, with the top reason being to protect threatened or endangered
species (65% support), followed by to increase wildlife populations (58%), to prevent the
loss of domestic animals (54%), and, at the bottom again, to address human safety (53%).
Opposition is greatest for these last two reasons: 40% oppose reducing raccoon populations
to address human safety, and 39% oppose to prevent the loss of domestic animals.
SOURCES OF INFORMATION ON WILDLIFE MANAGEMENT Just under a third (31%) of Washington residents have seen or heard information about how
Washington manages its wild animal populations; however, most Washington residents
(69%) have not seen or heard any such information.
• The most common sources from which residents had heard or seen information about
how Washington manages its wild animal populations were newspapers, word-of-mouth,
and television. Other important sources included brochures/pamphlets, hunting
regulations handbook, Internet sites other than agency websites, and magazines.
• When asked to indicate the best way that the state could communicate with them about
wildlife management, the top choice is direct mail, followed by television, newspapers,
the Internet, e-mail, or brochures/pamphlets.
HUMAN-WILDLIFE CONFLICTS AND NUISANCE WILDLIFE A little more than a quarter of Washington residents (29%) had problems with wild animals
or birds within the past 2 years. The most common such wildlife were raccoons, coyotes,
and deer. The most common types of problems were damage to property/landscaping or
attacks on pets or livestock. Another common problem was animals getting into trash.
• Trend: A slightly greater percentage of respondents in 2008 relative to 2002 had
problems with wildlife: 26% had a problem in 2002, while 31% had a problem in 2008

viii Responsive Management
(unweighted data). Problems with raccoons appeared to decline between 2002 and 2008,
while problems with deer appeared to increase.
Those who had problems with wild animals or birds within the past 2 years were asked who
they believe should pay for nuisance wildlife control and pay for damage caused by wildlife,
and they most commonly say the homeowner, state government, or local government.
• Trend: In 2008, a slightly lower percentage think the homeowner should pay, relative to
2002.
In answer to a direct question, more Washington residents support (46%) than oppose (39%)
hunting to address human-wildlife conflicts. Also, more residents support (54%) than oppose
(38%) hunting to address nuisance animals. On the other hand, fewer residents support
(41%) than oppose (50%) hunting to reduce animal-vehicle collisions.
In questions about reducing predator populations (respondents were informed, if they asked,
that predators are animals such as bears that hunt and eat other animals), slightly more
Washington residents support (50%) than oppose (43%) reducing predator populations to
prevent the loss of domestic animals or pets. Many more residents support (62%) than
oppose (32%) reducing predator populations to address human safety.
• Trend: Support for reducing predator populations to prevent the loss of domestic animals
or pets appears to have dropped from 2002 to 2008. In 2002, 69% supported, while 53%
support in 2008 (unweighted data).
• Trend: Support for reducing predator populations to address human safety also appears
to have dropped from 2002 to 2008. In 2002, 84% supported, while 63% support in 2008
(unweighted data).
In questions about raccoons that are similar to the questions above regarding predators, more
Washington residents support (54%) than oppose (39%) reducing local raccoon populations
to prevent the loss of domestic animals. Also, more support (52%) than oppose (40%)
reducing local raccoon populations to address human safety.

Public Opinion on Hunting and Wildlife Management in Washington ix
In questions about coyotes that are similar to questions regarding predators, more
Washington residents support (59%) than oppose (37%) reducing local coyote populations to
prevent the loss of domestic animals. Also, more support (58%) than oppose (38%) reducing
local coyote populations to address human safety.
The survey asked questions specifically about hunting cougar with dogs with similar
conditions as those asked about predators, raccoons, and coyotes discussed above. In these
questions, more Washington residents support (57%) than oppose (37%) hunting cougar with
dogs to protect pets or livestock. Also, more than double the percentage support (65%) than
oppose (29%) hunting cougar with dogs to address human safety.
As reported previously, but which also pertains to this section, Washington residents were
asked whether local opinion should be given more weight than statewide opinion in cougar
management decisions, and the large majority of residents (74%) think local opinion should
be given more weight.
Also as reported previously, but which also pertains to this section, Washington residents
most commonly think that threats to humans from cougars have remained stable in the past 4
years (43% give this answer); otherwise, they more often think threats have increased (24%)
than decreased (7%). A quarter (25%) do not know. (This graph is shown in the section of
this report titled, “Opinions on Management of Cougar and Black Bear.”)
Again, as reported previously, but which also pertains to this section, Washington residents
most commonly think that threats to livestock or pets from cougars have remained stable in
the past 4 years (39% give this answer); otherwise, they more often think threats have
increased (24%) than decreased (5%). Almost a third (31%) do not know. (This graph is
shown in the section of this report titled, “Opinions on Management of Cougar and Black
Bear.”)
Finally, as reported previously, but which also pertains to this section, in a question
specifically pertaining to wolf predation of livestock, most Washington residents (61%)
x Responsive Management
support some level of lethal wolf control to protect at-risk livestock; however, a substantial
percentage (31%) oppose. Additionally, a majority of residents (56%) support having the
state pay compensation out of the General Fund to ranchers who have documented losses to
livestock from wolves, but 35% oppose.
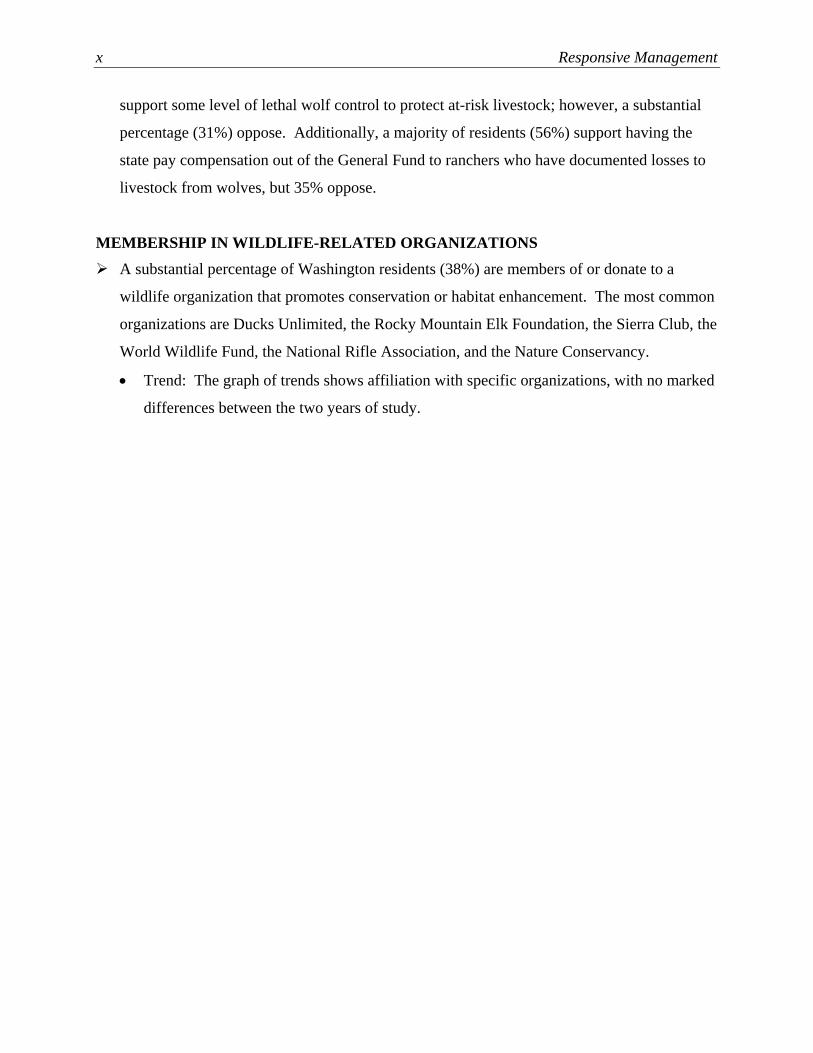
MEMBERSHIP IN WILDLIFE-RELATED ORGANIZATIONS A substantial percentage of Washington residents (38%) are members of or donate to a
wildlife organization that promotes conservation or habitat enhancement. The most common
organizations are Ducks Unlimited, the Rocky Mountain Elk Foundation, the Sierra Club, the
World Wildlife Fund, the National Rifle Association, and the Nature Conservancy.
• Trend: The graph of trends shows affiliation with specific organizations, with no marked
differences between the two years of study.

Public Opinion on Hunting and Wildlife Management in Washington xi
TABLE OF CONTENTS Introduction and Methodology ........................................................................................................1 Participation in Hunting and Other Outdoor Recreation .................................................................4 Public Opinions on Hunting and Wildlife Management................................................................12
General Support of or Opposition To Hunting......................................................................12 Opinions on Hunters’ Behavior and Hunter Ethics...............................................................21 Opinions on Using Dogs to Hunt ..........................................................................................27 Opinions on Predator Management in General .....................................................................34 Opinions on Management of Cougar and Black Bear...........................................................41 Opinions on Management of Wolves ....................................................................................56 Opinions on Management of Coyotes ...................................................................................64 Opinions on Management of Raccoons.................................................................................68
Sources of Information on Wildlife Management .........................................................................72 Human-Wildlife Conflicts and Nuisance Wildlife ........................................................................76 Demographic Characteristics and Membership in Wildlife-Related Organizations....................101 About Responsive Management ..................................................................................................114

Public Opinion on Hunting and Wildlife Management in Washington 1
INTRODUCTION AND METHODOLOGY This study was conducted for the Washington Department of Fish and Wildlife (the Department)
to determine public opinion on hunting and wildlife management in the state. The study entailed
a telephone survey of Washington residents 18 years old and older. Specific aspects of the
research methodology are discussed below.
For the survey, telephones were selected as the preferred sampling medium because of the
universality of telephone ownership. In addition, a central polling site at the Responsive
Management office allowed for rigorous quality control over the interviews and data collection.
Responsive Management maintains its own in-house telephone interviewing facilities. These
facilities are staffed by interviewers with experience conducting computer-assisted telephone
interviews on the subjects of natural resources and outdoor recreation. The telephone survey
questionnaire was developed cooperatively by Responsive Management and the Department.
Responsive Management conducted a pre-test of the questionnaire and made any necessary
revisions based on the pre-test.
To ensure the integrity of the telephone survey data, Responsive Management has interviewers
who have been trained according to the standards established by the Council of American Survey
Research Organizations. Methods of instruction included lecture and role-playing. The Survey
Center Managers and other professional staff conducted project briefings with the interviewers
prior to the administration of this survey. Interviewers were instructed on type of study, study
goals and objectives, handling of survey questions, interview length, termination points and
qualifiers for participation, interviewer instructions within the survey instrument, reading of the
survey instrument, skip patterns, and probing and clarifying techniques necessary for specific
questions on the survey instrument. The Survey Center Managers and statisticians monitored the
data collection, including monitoring of the actual telephone interviews without the interviewers’
knowledge, to evaluate the performance of each interviewer and ensure the integrity of the data.
Interviews were conducted Monday through Friday from 9:00 a.m. to 9:00 p.m., Saturday noon
to 5:00 p.m., and Sunday from 5:00 p.m. to 9:00 p.m., local time. A five-callback design was
used to maintain the representativeness of the sample, to avoid bias toward people easy to reach

2 Responsive Management
by telephone, and to provide an equal opportunity for all to participate. When a respondent
could not be reached on the first call, subsequent calls were placed on different days of the week
and at different times of the day. The survey was conducted in January 2008. Responsive
Management obtained a total of 805 completed interviews.
The software used for data collection was Questionnaire Programming Language 4.1 (QPL).
The survey data were entered into the computer as each interview was being conducted,
eliminating manual data entry after the completion of the survey and the concomitant data entry
errors that may occur with manual data entry. The survey instrument was programmed so that
QPL branched, coded, and substituted phrases in the survey based on previous responses to
ensure the integrity and consistency of the data collection. The analysis of data was performed
using Statistical Package for the Social Sciences software as well as proprietary software
developed by Responsive Management.
The results were weighted to increase the representation of younger people in the survey, as
slightly fewer younger people were reached than would be representative of their actual
proportion in the population. This was most likely caused by younger people’s greater use of
cell phones in lieu of traditional land lines, as the sampling for the general population was of
households, which are based on a listing of land-line telephones. The tabulation below shows
the weighting factors.
Weighting Factors
Age Actual
Population by Age
Population Proportion
by Age
Actual Sample by
Age
Proportion of Sample by
Age Weighting
Factor Weighted
Proportion of Sample by Age
18-24 614,340 12.62% 37 4.60% 2.7457 12.62%
25-34 888,641 18.26% 60 7.45% 2.4492 18.26%
35-44 948,214 19.48% 144 17.89% 1.0889 19.48%
45-54 970,799 19.94% 190 23.60% 0.8449 19.94%
55-64 709,212 14.57% 188 23.35% 0.6238 14.57%
65 or older 736,716 15.13% 186 23.11% 0.6550 15.13%
Total 4,867,922 100% 805 100% NA NA

Public Opinion on Hunting and Wildlife Management in Washington 3
Throughout this report, findings of the telephone survey are reported at a 95% confidence interval. For the entire sample of Washington residents, the sampling error is at most plus or minus 3.45 percentage points. This means that if the survey were conducted 100 times on different samples that were selected in the same way, the findings of 95 out of the 100 surveys would fall within plus or minus 3.45 percentage points of each other. Sampling error was calculated using the formula described below, with a sample size of 805 and a population size of 4,867,922 Washington residents aged 18 years and older. Sampling Error Equation
( )( )96.1
1
25.25.
⎟⎟⎟⎟
⎠
⎞
⎜⎜⎜⎜
⎝
⎛
−
−=
p
s
p
NN
N
B
Derived from formula: p. 206 in Dillman, D. A. 2000. Mail and Internet Surveys. John Wiley & Sons, NY.
Note: This is a simplified version of the formula that calculates the maximum sampling error using a 50:50 split (the most conservative calculation because a 50:50 split would give maximum variation).
Trends in the data are shown, based on a previous survey conducted in 2001-2002 (hereinafter referred to as the 2002 survey or 2002 data). Note that the previous study did not weight the data based on age as did this study, which may affect the trends. For this reason, the trends show comparisons of the 2002 data with both the weighted and unweighted data from 2008. Note that some results may not sum to exactly 100% because of rounding. Additionally, rounding on the graphs may cause apparent discrepancies of 1 percentage point between the graphs and the reported results of combined responses (e.g., when “strongly support” and “moderately support” are summed to determine the total percentage in support). A note about the layout of the report: some graphs pertain to more than one section, so these graphs are discussed in more than one section of the report. In these instances, the graph is shown only in one section, with a call-out in the other section indicating where the graph is located.
Where: B = maximum sampling error (as decimal) NP = population size (i.e., total number who could be surveyed) NS = sample size (i.e., total number of respondents surveyed)

4 Responsive Management
PARTICIPATION IN HUNTING AND OTHER OUTDOOR RECREATION
The most popular outdoor recreation activities of Washington residents in the past 2 years (of
the seven activities about which the survey asked) were hiking (57% did this), wildlife
viewing (49%), and camping (48%). A second tier or activities were boating (41%), fishing
(40%), and swimming in natural waters (38%). Hunting had a participation rate of 16%.
• Wildlife viewing specifically of wild wolves would appear to be popular, as 54% of
residents say that they would travel to see or hear wild wolves in Washington. (This
graph is shown in the section of this report titled, “Opinions on Management of
Wolves.”)
• When asked how worried, while recreating outdoors, they would be about wolves, most
respondents (65%) would be only a little worried or not worried at all. On the other
hand, 33% would be very or moderately worried. (This graph is shown in the section of
this report titled, “Opinions on Management of Wolves.”)
• A note about the participation rate in hunting: The rate shown should be viewed with
caution, as it may appear higher than otherwise expected. This can occur for several
reasons, one of the primary being “telescoping,” wherein we ask about a 2-year
timeframe, but respondents answer based on slightly longer periods of time simply
because of faulty memory—in other words, if they hunted 3 years previous, for instance,
they remember it as having occurred in the previous 2 years. Another reason is that some
people may have accompanied others hunting, for instance going to a cabin used as the
hunting base, although they may not have actually carried a gun and hunted in the field.
Nonetheless, even without having hunted according to the legal definition of the term,
they may consider that they have gone hunting. Finally, the process of “churning” may
serve to raise the apparent hunting rate. Churning refers to the fact that in any given year,
the total pool of hunters consists of those very avid hunters who go every year, as well as
those who go only some years; this second portion is replaced the following year with
other hunters who do not go every year. In other words, the pool of hunters from year to
year are not the same hunters; only a portion are the same from the previous year, while
the rest consist of occasional hunters who are different from year to year. In such as

Public Opinion on Hunting and Wildlife Management in Washington 5
situation, it may be that 10% go hunting in the first year of study, and 10% in the second
year of study, but more than 10% hunted in that 2-year period.
• Trend: The questions about hunting participation were asked differently between the
2002 survey and the 2008 survey, so the trends are not shown. Nonetheless, in 2002,
13% of the general population indicated that they had purchased a license and gone
hunting.
Those who had not hunted in the past 2 years were asked if they had ever hunted, and
combining these people with those who hunted in the past 2 years in Washington (from the
question discussed above), the results indicate that 35% of respondents hunted at some time
in Washington. (Note that with no timeframe, respondents could have hunted, for instance,
only as a youth and still count as having hunted in Washington. This 35% should not be
taken as active hunters.) Of those who have hunted in Washington, 81% report having
purchased a license (suggesting that some of the respondents may have hunted as youth,
when they may not have been required to purchase a license).
• Most respondents who had not hunted in Washington at any time had never hunted
anywhere (79%); nonetheless, there were 18% who had hunted outside Washington but
not in the state. (Again, respondents could have hunted outside Washington only as a
youth and still answer in the affirmative in this question.)
• Those who had never hunted outside of Washington were asked for their reasons for not
hunting outside of Washington (also note that these respondents had not hunted in
Washington either, so the responses are among those who have not hunted at all). Most
commonly, it was because they do not hunt, because they dislike hunting/do not believe
in it, or because they are not interested.
• Those who had never hunted in Washington but had hunted outside of the state were
asked why they had never hunted in Washington. Most commonly, they said that their
reasoning is lack of time, that they no longer hunt, that they dislike/do not agree with
hunting, that they recently moved into the state, or that they are not interested in hunting.
At the bottom of the list is that they hunt elsewhere, so it does not appear that better
hunting elsewhere is driving people to choose not to hunt in Washington.

6 Responsive Management
Q9. In the past 2 years in washington, have you participated in any of these outdoor recreation
activities?
38
40
41
48
49
57
16
15
0 20 40 60 80 100
Hiking
Wildlife viewing
Camping
Boating
Fishing
Swimming innatural waters
Hunting
None of these
Mul
tiple
Res
pons
es A
llow
ed
Percent

Public Opinion on Hunting and Wildlife Management in Washington 7
Q100. Have you ever gone hunting in Washington? (Among all respondents.)
2
63
35
0 20 40 60 80 100
Yes
No
Don't know
Percent (n=805)

8 Responsive Management
Q105. Have you ever purchased a hunting license in Washington? (Asked of those who have gone
hunting in Washington.)
19
81
0 20 40 60 80 100
Yes
No
Percent (n=280)

Public Opinion on Hunting and Wildlife Management in Washington 9
Q102. Have you ever gone hunting anywhere outside of Washington? (Asked of those who have
never gone hunting in Washington .)
3
79
18
0 20 40 60 80 100
Yes
No
Don't know
Percent (n=525)

10 Responsive Management
Q104. Why haven't you ever hunted outside of Washington? (Asked of those who have never gone
hunting.)
4
5
6
16
24
49
0 20 40 60 80 100
Don't hunt
Dislike hunting /don't believe in
Not interested
Other
No time / not able
Don't know
Mul
tiple
Res
pons
es A
llow
ed
Percent

Public Opinion on Hunting and Wildlife Management in Washington 11
Q103. Why haven't you ever hunted in Washington? (Asked of those who have never gone hunting in Washington, but have gone hunting outside of
Washington.)
6
14
14
15
18
24
1
21
0 20 40 60 80 100
No time / not able
No longer hunt
Dislike hunting /don't believe in it
Recently moved
Not interested
Hunt / huntedelsewhere
Don't know
Other
Mul
tiple
Res
pons
es A
llow
ed
Percent

12 Responsive Management
PUBLIC OPINIONS ON HUNTING AND WILDLIFE MANAGEMENT GENERAL SUPPORT OF OR OPPOSITION TO HUNTING
The large majority of Washington residents (82%) approve of legal, regulated hunting, and
only 12% disapprove. Most approval is strong approval (51% strongly approve).
• Those who disapprove of hunting were asked why they disapprove. Most commonly
they give an animal rights answer and/or say that they are against killing animals. Other
less common reasons are that they are against trophy hunting or that hunting damages
wildlife populations/the ecosystem. These respondents who disapprove of hunting were
then asked if there was anything that would change their mind about disapproving of
hunting. The large majority said that there is nothing that would change their mind.
Otherwise, a few would change their mind if they knew that there were environmental
reasons/wildlife had to be controlled.
• Trend: Overall approval of hunting remained nearly the same from 2002 to 2008.
The survey asked respondents about their support of or opposition to hunting for five specific
reasons. These results suggest that concern for the welfare of the animal is greater than
concern for humans. The reasons pertaining to animal welfare have markedly higher support
than the rest: hunting to prevent the spread of animal disease (79% support) and hunting to
prevent damage to habitat caused by overpopulation of wildlife (71% support). Lower
percentages support hunting for reasons related to human welfare: 54% support hunting to
address nuisance animals, 47% to address wildlife conflicts, and 41% to reduce animal-
vehicle collisions. (Indeed, the latter is the only reason for which a majority—slightly more
than 50%—oppose.)
• Note that there is a wording difference between the first question discussed in this section
(approval or disapproval of hunting) and this series of questions (support of or opposition
to hunting). The latter connotes a little more action (support) than the former (approval),
which may explain the slightly lower support of hunting for any particular reason when
compared to the overall approval of hunting.

Public Opinion on Hunting and Wildlife Management in Washington 13
Q11. In general, do you approve or disapprove of legal, regulated hunting?
2
7
5
4
31
51
0 20 40 60 80 100
Strongly approve
Moderatelyapprove
Neither approvenor disapprove
Moderatelydisapprove
Stronglydisapprove
Don't know
Percent (n=805)

14 Responsive Management
In general, do you approve or disapprove of legal, regulated hunting?
5 72
72
50
32
3 48
34
31
51
4
52
30
4
0
20
40
60
80
100
Strongly approve Moderatelyapprove
Neither approvenor disapprove
Moderatelydisapprove
Stronglydisapprove
Don't know
Perc
ent
2002 survey2008 survey (weighted)2008 survey (unweighted)

Public Opinion on Hunting and Wildlife Management in Washington 15
Q12. You indicated that you disapprove of hunting. Why do you disapprove of hunting? (Asked of
those who disapprove of legal, regulated hunting.)
8
8
9
10
12
49
7
4
1
0 20 40 60 80 100
Against killing animals / believe inanimal rights / unethical
Against trophy hunting
It damages wildlife populations, nature,and/or the ecosystem
Other
Guns are dangerous / don't like guns
Don't think it is necessary / can getmeat from other sources
Against hunting in general
Hunters break the law / don't followrules (e.g., poaching, trespassing,
hunting out of season)
Don't know
Mul
tiple
Res
pons
es A
llow
ed
Percent

16 Responsive Management
2
3
6
13
78
0 20 40 60 80 100
No
If needed forenvironmental
reasons /wildlife
populationcontrol
Other
If used for foodsource only
Don't know
Mul
tiple
Res
pons
es A
llow
ed
Percent
Q13. Is there anything that would change your mind about disapproving of hunting? (Asked of those who
disapprove of legal, regulated hunting.)

Public Opinion on Hunting and Wildlife Management in Washington 17
Q31-35. Percent who strongly support hunting for the following conditions.
50
38
28
19
18
0 20 40 60 80 100
To prevent thespread of animal
disease
To prevent damageto habitat causedby overpopulation
of wildlife
To addressnuisance animals
To address human-wildlife conflicts
To reduce animal-vehicle collisions
Percent

18 Responsive Management
Q31-35. Percent who support hunting for the following conditions.
79
71
54
47
41
0 20 40 60 80 100
To prevent thespread of animal
disease
To prevent damageto habitat causedby overpopulation
of wildlife
To addressnuisance animals
To address human-wildlife conflicts
To reduce animal-vehicle collisions
Percent
Public Opinion on Hunting and Wildlife Management in Washington 19
Q31-35. Percent who oppose hunting for the following conditions.
50
39
38
23
14
0 20 40 60 80 100
To reduce animal-vehicle collisions
To address human-wildlife conflicts
To addressnuisance animals
To prevent damageto habitat causedby overpopulation
of wildlife
To prevent thespread of animal
disease
Percent

20 Responsive Management
Q31-35. Percent who strongly oppose hunting for the following conditions.
26
20
20
11
8
0 20 40 60 80 100
To reduce animal-vehicle collisions
To address human-wildlife conflicts
To addressnuisance animals
To prevent damageto habitat causedby overpopulation
of wildlife
To prevent thespread of animal
disease
Percent

Public Opinion on Hunting and Wildlife Management in Washington 21
OPINIONS ON HUNTERS’ BEHAVIOR AND HUNTER ETHICS The survey asked Washington residents how they would characterize the behavior of hunters
in Washington. The most common answer is that they do not know (32%). Otherwise, the
percentage saying that hunters’ behavior is excellent or good (46%) exceeds the percentage
who rate hunters’ behavior as fair or poor (22%). Note that the middle answers (good or fair)
of the scale exceed the extremes (excellent of poor).
• Those who gave a rating of anything except excellent were asked if there is anything that
would improve their opinion of hunters. The most common thing that could be done is if
hunters are more courteous (e.g., they do not litter, they respect landowners’ property) or
if they follow the laws and regulations.
• Trend: There is only a small difference in perceptions of hunter behavior between 2002
and 2008 (unweighted data). Excellent and good ratings are about the same (46% in
2002 gave an excellent or good rating, while 45% did so in 2008). On the other hand, it
appears that “Don’t know” responses grew (25% in 2002, 33% in 2008) at the expense of
fair/poor ratings (29% in 2002, 22% in 2008).
The survey asked Washington residents to indicate the percentage of Washington hunters
they think comply with all hunting regulations. While only 2% think that all hunters comply
with all hunting regulations, 48% give an answer of 75 percent or more who comply.
(Again, the “don’t know” responses are high—24%.)
• In follow-up, any respondent who did not answer that “100 percent” of hunters comply
with all hunting regulations were asked how they think Washington state could improve
the compliance of hunters. “Don’t know” is the most common answer, distantly followed
by various ways, the top few being as follows: dispatch more law enforcement officers,
provide better education to hunters, enforce the law more strictly/have more checks, and
have more strict punishment and fines.

22 Responsive Management
Q14. In general, how would you characterize the behavior of hunters while hunting in Washington?
Would you say their behavior, in general, is excellent, good, fair or poor?
32
5
17
32
14
0 20 40 60 80 100
Excellent
Good
Fair
Poor
Don't know
Percent (n=805)

Public Opinion on Hunting and Wildlife Management in Washington 23
In general, how would you characterize the behavior of hunters while hunting in Washington?
5
32 33
8
38
23
6
25
17
32
14
612
33
16
0
20
40
60
80
100
Excellent Good Fair Poor Don't know
Perc
ent
2002 survey2008 survey (weighted)2008 survey (unweighted)

24 Responsive Management
Q15. What would it take to improve your opinion of hunters? (Asked of those who characterize hunter
behavior during hunting as either good, fair, or poor.)
22
8
14
5
6
8
8
12
15
2
2
4
0 20 40 60 80 100
If hunters are more courteous (e.g., keepenvironment clean, respect landowners'
property)
If hunters follow the laws / regulations
If hunters are more careful / safer / aware oftheir environment
If hunters are more educated aboutregulations, gun safety, etc.
If hunters don't drink alcohol while hunting
More / stricter law enforcement and/orregulations
If hunters kill only for food
Change regulations (e.g., season lengths,times of seasons, bag limits)
Nothing because I already have a good opinionof hunters
Nothing
Other
Don't know
Mul
tiple
Res
pons
es A
llow
ed
Percent

Public Opinion on Hunting and Wildlife Management in Washington 25
Q16. What percentage of hunters do you think comply with all hunting regulations?
24
3
12
9
10
36
2
1
3
1
0 20 40 60 80 100
100%
76% - 99%
75%
51% - 74%
50%
26% - 49%
25%
1% - 24%
0%
Don't know
Percent (n=805)
Mean = 71.20

26 Responsive Management
Q17. How would you suggest the Department improve the compliance of hunters? (Asked of those who did not believe that 100% of hunters
comply with all hunting regulations.)
1
1
6
8
9
9
16
47
4
3
2
0 20 40 60 80 100
Don't know
Dispatch more law enforcement officers into thefield / police areas more
More and/or better classes / information forhunters in general
Enforce the law more / more checks
More and/or stricter punishment / fines forviolators
Other
Nothing / Department currently doing anadequate job
More and/or stricter regulations / licenserequirements
Reduce some regulations (e.g., more access,lower fees, more tags)
More / mandatory safety courses
Incentive and/or method for reporting violators
Mul
tiple
Res
pons
es A
llow
ed
Percent

Public Opinion on Hunting and Wildlife Management in Washington 27
OPINIONS ON USING DOGS TO HUNT The survey directly asked Washington residents if they support or oppose the use of dogs to
hunt cougar. Opposition (46%) slightly exceeds support (41%). Note, however, that most
opposition is strong opposition (34% strongly oppose), while support is evenly divided
between strong and moderate.
• The survey also asked about support of or opposition to use of dogs to hunt cougar
specifically in the respondent’s county of residence, with almost identical results:
opposition (48%) slightly exceeds support (40%).
When specific reasons for hunting cougar with dogs are presented, support increases over the
support in general discussed above (in which 41% support). At the top is support of using
dogs to hunt cougar to protect human safety (65% support), followed by two more reasons
with majorities in support: to protect pets or livestock (56%) and to produce a healthy age
structure in the state’s elk herd, which is preyed upon by cougars (also 56%). At the bottom,
with only 33% in support, is using dogs to hunt cougar for recreation. Indeed, the latter is the
only reason for which a majority oppose hunting cougar with dogs (60% oppose).

28 Responsive Management
Q68. In general, do you support or oppose the use of dogs to hunt cougar?
8
34
12
5
21
20
0 20 40 60 80 100
Strongly support
Moderatelysupport
Neither supportnor oppose
Moderatelyoppose
Strongly oppose
Don't know
Percent (n=805)

Public Opinion on Hunting and Wildlife Management in Washington 29
Q69. Do you support or oppose the use of dogs to hunt cougar in your county?
7
36
12
5
21
19
0 20 40 60 80 100
Strongly support
Moderatelysupport
Neither supportnor oppose
Moderatelyoppose
Strongly oppose
Don't know
Percent (n=805)

30 Responsive Management
Q71-76. Percent who strongly support the use of dogs to hunt cougar for the following reasons.
39
27
25
20
17
14
0 20 40 60 80 100
To protect humansafety
To protect pets orlivestock
For management toproduce a healthyage structure for
the elk herd
To reduce cougarpopulations to the
local sociallyacceptable level
To specificallymanage the
number of maleand female
cougars harvested
To providerecreational
opportunities tohunters
Percent

Public Opinion on Hunting and Wildlife Management in Washington 31
Q71-76. Percent who support the use of dogs to hunt cougar for the following reasons.
65
56
56
50
44
33
0 20 40 60 80 100
To protect humansafety
To protect pets orlivestock
For management toproduce a healthyage structure for
the elk herd
To reduce cougarpopulations to the
local sociallyacceptable level
To specificallymanage the
number of maleand female
cougars harvested
To providerecreational
opportunities tohunters
Percent

32 Responsive Management
Q71-76. Percent who oppose the use of dogs to hunt cougar for the following reasons.
60
41
41
38
34
29
0 20 40 60 80 100
To providerecreational
opportunities tohunters
To specificallymanage the
number of maleand female
cougars harvested
To reduce cougarpopulations to the
local sociallyacceptable level
To protect pets orlivestock
For management toproduce a healthyage structure for
the elk herd
To protect humansafety
Percent

Public Opinion on Hunting and Wildlife Management in Washington 33
Q71-76. Percent who strongly oppose the use of dogs to hunt cougar for the following reasons.
45
27
26
24
24
18
0 20 40 60 80 100
To providerecreational
opportunities tohunters
To specificallymanage the
number of maleand female
cougars harvested
To reduce cougarpopulations to the
local sociallyacceptable level
To protect pets orlivestock
For management toproduce a healthyage structure for
the elk herd
To protect humansafety
Percent

34 Responsive Management
OPINIONS ON PREDATOR MANAGEMENT IN GENERAL The survey asked respondents about their support of or opposition to reducing predators for
four reasons. Majorities support reducing predators for the health of threatened or
endangered species (65%) or for human safety (62%), and half support it for protecting pets
and domestic animals (50%). The lowest is to increase game populations (40%), which is the
only reason for which a majority oppose (slightly more than 50%).
• Trend: Support for reducing predators is less in 2008 (unweighted data) than it was in
2002 for three of the four reasons: to address human safety (84% in 2002, 63% in 2008),
to protect threatened or endangered species (76% in 2002, 64% in 2008), and to prevent
loss of domestic animals or pets (69% in 2002, 53% in 2008). Support for reducing
predators to increase game populations was about the same in the two years of study
(40% in 2002, 42% in 2008).

Public Opinion on Hunting and Wildlife Management in Washington 35
Q38-41. Percent who strongly support the following items as they relate to predator management.
30
30
22
17
0 20 40 60 80 100
Reducing predatorpopulations to
protect threatenedor endangered
species
Reducing predatorpopulations to
address humansafety
Reducing predatorpopulations toprevent loss of
domestic animalsor pets
Reducing predatorpopulations toincrease game
populations
Percent

36 Responsive Management
Q38-41. Percent who support the following items as they relate to predator management.
65
62
50
40
0 20 40 60 80 100
Reducing predatorpopulations to
protect threatenedor endangered
species
Reducing predatorpopulations to
address humansafety
Reducing predatorpopulations toprevent loss of
domestic animalsor pets
Reducing predatorpopulations toincrease game
populations
Percent

Public Opinion on Hunting and Wildlife Management in Washington 37
Q38-41. Percent who oppose the following items as they relate to predator management.
50
43
32
26
0 20 40 60 80 100
Reducing predatorpopulations toincrease game
populations
Reducing predatorpopulations toprevent loss of
domestic animalsor pets
Reducing predatorpopulations to
address humansafety
Reducing predatorpopulations to
protect threatenedor endangered
species
Percent

38 Responsive Management
Q38-41. Percent who strongly oppose the following items as they relate to predator management.
24
22
17
11
0 20 40 60 80 100
Reducing predatorpopulations toincrease game
populations
Reducing predatorpopulations toprevent loss of
domestic animalsor pets
Reducing predatorpopulations to
address humansafety
Reducing predatorpopulations to
protect threatenedor endangered
species
Percent

Public Opinion on Hunting and Wildlife Management in Washington 39
Percent who strongly support each reason to reduce predator populations.
1715
3335
52
30 30
22 232931
18
0
20
40
60
80
100
To address human safety To protect threatened orendangered species
To prevent loss of domestic animalsor pets
To increase game populations
Perc
ent
2002 survey2008 survey (weighted)2008 survey (unweighted)
Percent who support each reason to reduce predator populations.
40
84
76
69
40
50
6562
42
63 64
53
0
20
40
60
80
100
To address human safety To protect threatened orendangered species
To prevent loss of domestic animalsor pets
To increase game populations
Perc
ent
2002 survey2008 survey (weighted)2008 survey (unweighted)

40 Responsive Management
Percent who oppose each reason to reduce predator populations.
32
1218
24
5450
43
26 26
4047
31
0
20
40
60
80
100
To increase game populations To prevent loss of domestic animalsor pets
To protect threatened orendangered species
To address human safety
Perc
ent
2002 survey2008 survey (weighted)2008 survey (unweighted)
Percent who strongly oppose each reason to reduce predator populations.
17
30
12 10 811
2224
1723
20
11
0
20
40
60
80
100
To increase game populations To prevent loss of domestic animalsor pets
To protect threatened orendangered species
To address human safety
Perc
ent
2002 survey2008 survey (weighted)2008 survey (unweighted)

Public Opinion on Hunting and Wildlife Management in Washington 41
OPINIONS ON MANAGEMENT OF COUGAR AND BLACK BEAR Washington residents most commonly think that threats to humans from cougars have
remained stable in the past 4 years (43% gave this answer); otherwise, they more often think
threats have increased (24%) than decreased (7%). A quarter (25%) do not know.
• Those who say the threats to humans have increased most commonly attribute the
increase to habitat encroachment by humans or simply more media reports about threats;
only a few think threats have increased because the number of cougars has increased.
• Those who say the threats to humans have decreased most commonly attribute the
decrease to fewer media reports/fewer sightings or to their belief that human
encroachment has forced cougars out of the area and thereby reduced threats (i.e.,
cougars just are not around anymore).
Washington residents most commonly think that threats to livestock or pets from cougars
have remained stable in the past 4 years (39% gave this answer); otherwise, they more often
think threats have increased (24%) than decreased (5%). Almost a third (31%) do not know.
• Those who say the threats to livestock or pets have increased most commonly attribute
the increase to habitat encroachment by humans or simply more media reports about
threats; only a few think threats have increased because the number of cougars has
increased.
• Those who say the threats to livestock or pets have decreased most commonly attribute
the decrease to fewer media reports, fewer cougars, or better cougar population
management.
Washington residents were asked whether local opinion should be given more weight than
statewide opinion in cougar management decisions, and the large majority of residents (74%)
think local opinion should be given more weight.
• A crosstabulation found that those who live in urban areas are less likely to support, and
much less likely to strongly support, giving more weight to local opinion.
Those who disapprove of hunting were asked if they support or oppose using cougar hunting
as a way to manage cougar populations in situations where deer and/or elk herds are below

42 Responsive Management
population objectives and need to be increased. Given this stipulation, 45% of those who
disapprove of legal, regulated hunting support cougar hunting to increase deer and/or elk
herds when necessary.
• Those who oppose were asked why they oppose. The most common answer is that they
believe nature will balance itself, followed by that the respondent believes there are better
alternatives such as trapping and relocating or that the respondent does not approve of
hunting/killing animals.
The survey asked those who had not previously indicated that they disapprove of legal,
recreational hunting a specific question about zone management of cougars. First, an
explanation was given that zone management of cougars would mean that different zones of
the state could have different population objectives for cougar (e.g., keeping the cougar
population stable in one zone while reducing the cougar population in another zone), and that
different population objectives, in turn, could require different hunting methods in the
different zones. These respondents were then asked if they support or oppose zone
management with its different population objectives, and a large majority (79%) support
zone management, while 12% oppose.
The survey asked Washington residents which of four actions they would support to reduce
cougar when Department biologists consider it necessary to do so. Trap and relocate is the
most popular (75%), the only with a majority in support. With medium support is regulated
hunting by licensed hunters (48%) and hunting by Department staff (40%). The lowest
support is for hunting by paid professionals other than Department staff (24%).
The survey asked a similar question to that discussed immediately above pertaining to black
bears instead of cougars. The results are nearly the same. Trap and relocate is the most
popular (75%), followed by regulated hunting by licensed hunters (47%), hunting by
Department staff (38%), and, the lowest, hunting by paid professionals other than
Department staff (22%).
Public Opinion on Hunting and Wildlife Management in Washington 43
Q78. Do you think threats to humans by cougars have increased, decreased, or remained stable in
the past 4 years?
25
7
43
24
0 20 40 60 80 100
Increased
Remained stable
Decreased
Don't know
Percent (n=805)

44 Responsive Management
1
8
10
11
32
43
0 20 40 60 80 100
Human populationincrease / habitat
encroachment / habitatloss
More media reports /hear more about it /
more sightings
More cougars
Lower populationmanagement
Other
Don't know
Mul
tiple
Res
pons
es A
llow
ed
Percent
Q79. Why do you think threats to humans have increased in the last 4 years? (Asked of those who
believe that threats to humans by cougars have increased in the past 4 years.)

Public Opinion on Hunting and Wildlife Management in Washington 45
Q80. Why do you think threats to humans have decreased in the last 4 years? (Asked of those who
believe that threats to humans by cougars have decreased in the past 4 years.)
5
7
9
13
18
50
0 20 40 60 80 100
Fewer media reports /physical sightings
Human encroachmentcaused cougars to
move away from humanpopulation
Other
Better populationmanagement
Environmental change
Fewer cougars
Mul
tiple
Res
pons
es A
llow
ed
Percent

46 Responsive Management
Q81. Do you think threats to livestock or pets by cougars have increased, decreased, or remained
stable in the past 4 years?
31
5
39
24
0 20 40 60 80 100
Increased
Remained stable
Decreased
Don't know
Percent (n=805)

Public Opinion on Hunting and Wildlife Management in Washington 47
Q82. Why do you think threats to livestock or pets have increased in the last 4 years? (Asked of those
who believe that threats to livestock or pets by cougars have increased in the past 4 years.)
3
7
8
15
26
46
0 20 40 60 80 100
Human populationincrease / habitatencroachment /
habitat loss
More media reports /hear more about it /
more sightings
More cougars
Lower populationmanagement
Other
Don't know
Mul
tiple
Res
pons
es A
llow
ed
Percent

48 Responsive Management
Q83. Why do you think threats to livestock or pets have decreased in the last 4 years? (Asked of those
who believe that threats to livestock or pets by cougars have decreased in the past 4 years.)
5
5
11
12
19
53
0 20 40 60 80 100
Fewer media reports /hear less about it /
fewer sightings
Fewer cougars
Better populationmanagement
Other
Habitat encroachment /habitat loss
Don't know
Mul
tiple
Res
pons
es A
llow
ed
Percent

Public Opinion on Hunting and Wildlife Management in Washington 49
Q77. When the Department makes decisions about cougar management, do you support or oppose weighting local public input more than statewide
public input for local cougar management issues?
4
8
7
6
25
49
0 20 40 60 80 100
Strongly support
Moderatelysupport
Neither supportnor oppose
Moderatelyoppose
Strongly oppose
Don't know
Percent (n=805)

50 Responsive Management
Q77. When the Department makes decisions about cougar management, do you support or oppose weighting local public input more than statewide
public input for local cougar management issues?
11
10
3
5
6
9
15
3
58
23
6
5
6
2
6
10
9
10
29
3650
24
36
26
53
5
1
21
51
0 20 40 60 80 100
Stronglysupport
Moderatelysupport
Neithersupport nor
oppose
Moderatelyoppose
Stronglyoppose
Don't know
Percent
Large city or urban area
Suburban area
Small city or town
Rural area on a farm orranchRural area not on a farm orranch

Public Opinion on Hunting and Wildlife Management in Washington 51
4
35
13
3
28
17
0 20 40 60 80 100
Strongly support
Moderatelysupport
Neither supportnor oppose
Moderatelyoppose
Strongly oppose
Don't know
Percent (n=93)
Q65. The overall health of deer and elk populations can vary due to factors like severe winters or poor habitat conditions.
In some cases, when a deer or elk population is already depressed, predators such as cougar can hinder the
population's ability to rebound. In cases like this, do you support or oppose using cougar hunting as a management tool to reduce cougar populations to increase deer or elk
herds that are below population objectives? (Asked of those who disapprove of legal, regulated hunting.)

52 Responsive Management
Q66. Why do you oppose reducing cougar populations to enhance deer or elk herds that are
below herd objectives? (Asked of those who oppose using cougar hunting as a management
tool to help deer or elk populations rebound.)
6
10
11
18
22
40
0 20 40 60 80 100
Believes nature willbalance itself / natural
process
Believes there is abetter alternative(e.g.,. trapping,
relocating)
Doesn't approve ofhunting / killing
anything
Other
Do not want to killcougars / like cougars/ not enough cougars
Believes deer and elkherds don't need help /currently plenty of deer
and elk
Mul
tiple
Res
pons
es A
llow
ed
Percent

Public Opinion on Hunting and Wildlife Management in Washington 53
3
8
4
5
41
38
0 20 40 60 80 100
Strongly support
Moderatelysupport
Neither supportnor oppose
Moderatelyoppose
Strongly oppose
Don't know
Percent (n=712)
If the Department uses a zone management approach for cougar management, different zones of the state may have different population objectives and use different hunting methods and seasons. One possible outcome is that the population objective in one zone may be for stable cougar populations while the population objective in another zone may be for a reduced cougar population.
Q63. (PRIOR TO THE QUESTION, THE ZONE MANAGEMENT APPROACH WAS EXPLAINED TO RESPONDENTS, AS SHOWN IN INSERT.)
Do you support having some zones with an objective of reducing cougar populations as long as other zones are
managed for stable populations? (Asked of those who did not previously indicate disapproval
of legal, regulated hunting.)

54 Responsive Management
Q58. Please tell me which, if any, of the following actions you would support to reduce cougar populations in situations where Department
biologists determine it necessary.
2
2
24
40
48
75
1
0 20 40 60 80 100
Trap and relocate
Regulated hunting by licensed hunters
Hunting by Department staff
Hunting by paid professionals other thanDepartment staff
None of these
Don't know
Specifically says does not supportreducing cougar populations for any
reason
Mul
tiple
Res
pons
es A
llow
ed
Percent

Public Opinion on Hunting and Wildlife Management in Washington 55
Q61. Please tell me which, if any, of the following actions you would support to reduce black bear
populations in situations where Department biologists determine it necessary.
2
3
22
38
47
75
1
0 20 40 60 80 100
Trap and relocate
Regulated hunting by licensed hunters
Hunting by Department staff
Hunting by paid professionals other thanDepartment staff
Don't know
None of these
Specifically says does not support reducingblack bear populations for any reason
Mul
tiple
Res
pons
es A
llow
ed
Percent

56 Responsive Management
OPINIONS ON MANAGEMENT OF WOLVES The large majority of Washington residents (75%) support allowing wolves to recover in
Washington; meanwhile, 17% oppose.
• A crosstabulation found that those who live in urban and suburban areas are more likely
to support wolf recovery; while those residing in small city/town or rural area are more
likely to oppose. Note that those living on ranches or farms are the most likely to
strongly oppose.
• When the stipulation is put on wolf recovery that it could result in localized declines in
elk and deer populations, support declines slightly: 61% support wolf recovery if it will
result in some localized declines in elk and deer populations, and 28% oppose.
Most Washington residents (61%) support some level of lethal wolf control to protect at-risk
livestock; however, 31% oppose. Additionally, a majority of residents (56%) support having
the state pay compensation out of the General Fund to ranchers who have documented losses
to livestock from wolves, but 35% oppose.
When asked how worried, while recreating outdoors, they would be about wolves,
respondents most commonly say that they would not be worried at all (39%), and 26% would
be only a little worried; in sum, 65% would be only a little worried or not worried at all. On
the other hand, 33% would be very or moderately worried, with 11% very worried.
In a question tangentially related to wolf management, the survey found that wildlife viewing
specifically of wild wolves would appear to be popular, as 54% of residents say that they
would travel to see or hear wild wolves in Washington. (Note that 2% of respondents say
that they would not need to travel, as they have wild wolves nearby already.)

Public Opinion on Hunting and Wildlife Management in Washington 57
Q93. Would you support or oppose allowing wolves to recover in Washington?
4
11
6
4
33
42
0 20 40 60 80 100
Strongly support
Moderatelysupport
Neither supportnor oppose
Moderatelyoppose
Strongly oppose
Don't know
Percent (n=805)

58 Responsive Management
Q93. Would you support or oppose allowing wolves to recover in Washington?
2
5
4
15
3
4
18
10
42
29
4
10
11
4
50
30
1
3
10
6
4
35
49
7
34
36
6
28
36
4
0 20 40 60 80 100
Stronglysupport
Moderatelysupport
Neithersupport nor
oppose
Moderatelyoppose
Stronglyoppose
Don't know
Percent
Large city or urban area
Suburban area
Small city or town
Rural area on a farm orranchRural area not on a farm orranch

Public Opinion on Hunting and Wildlife Management in Washington 59
Q96. Would you support or oppose wolf recovery in Washington if it resulted in some localized declines
in elk and deer populations?
6
15
13
5
38
23
0 20 40 60 80 100
Strongly support
Moderatelysupport
Neither supportnor oppose
Moderatelyoppose
Strongly oppose
Don't know
Percent (n=805)

60 Responsive Management
Q94. Would you support or oppose some level of lethal wolf control to protect at-risk livestock in
Washington?
4
17
14
3
35
26
0 20 40 60 80 100
Strongly support
Moderatelysupport
Neither supportnor oppose
Moderatelyoppose
Strongly oppose
Don't know
Percent (n=805)

Public Opinion on Hunting and Wildlife Management in Washington 61
Q95. Would you support or oppose the State of Washington paying compensation out of the General Fund to ranchers and other livestock
owners for documented losses of livestock caused by wolves?
6
20
15
4
28
28
0 20 40 60 80 100
Strongly support
Moderatelysupport
Neither supportnor oppose
Moderatelyoppose
Strongly oppose
Don't know
Percent (n=805)

62 Responsive Management
Q98. How worried would you be about your personal safety when recreating outdoors in areas
occupied by wolves?
2
39
26
22
11
0 20 40 60 80 100
Very worried
Moderatelyworried
A little worried
Not worried at all
Don't know
Percent (n=805)

Public Opinion on Hunting and Wildlife Management in Washington 63
Q97. Would you travel to see or hear wild wolves in Washington?
2
1
42
54
0 20 40 60 80 100
Yes
No
Don't know
Wouldn't need to;wild wolves live
close by
Percent (n=805)

64 Responsive Management
OPINIONS ON MANAGEMENT OF COYOTES The survey asked whether residents support or oppose reducing coyote populations for four
specific reasons. Majorities support each reason, with little difference among them: to
protect threatened or endangered species (60% support), to increase wildlife populations
(60%), to prevent the loss of domestic animals (59%), and to address human safety (58%).
Note that opposition is also similar among these reasons, ranging from 30% to 38%.
Q50-53. Percent who strongly support reducing coyote populations for the following reasons.
29
28
26
25
0 20 40 60 80 100
To address humansafety
To prevent loss ofdomestic animals,such as chickens,
goats, or pets
To protectthreatened orendangered
species, such aspygmy rabbits
To increase wildlifepopulations, such
as nestingwaterfowl or deer
fawns
Percent

Public Opinion on Hunting and Wildlife Management in Washington 65
Q50-53. Percent who support reducing coyote populations for the following reasons.
60
60
59
58
0 20 40 60 80 100
To protectthreatened orendangered
species, such aspygmy rabbits
To increase wildlifepopulations, such
as nestingwaterfowl or deer
fawns
To prevent loss ofdomestic animals,such as chickens,
goats, or pets
To address humansafety
Percent

66 Responsive Management
Q50-53. Percent who oppose reducing coyote populations for the following reasons.
38
37
32
30
0 20 40 60 80 100
To address humansafety
To prevent loss ofdomestic animals,such as chickens,
goats, or pets
To increase wildlifepopulations, such
as nestingwaterfowl or deer
fawns
To protectthreatened orendangered
species, such aspygmy rabbits
Percent

Public Opinion on Hunting and Wildlife Management in Washington 67
Q50-53. Percent who strongly oppose reducing coyote populations for the following reasons.
21
18
15
14
0 20 40 60 80 100
To address humansafety
To prevent loss ofdomestic animals,such as chickens,
goats, or pets
To protectthreatened orendangered
species, such aspygmy rabbits
To increase wildlifepopulations, such
as nestingwaterfowl or deer
fawns
Percent

68 Responsive Management
OPINIONS ON MANAGEMENT OF RACCOONS Similar to the series of questions about reducing coyote populations, the survey asked
whether residents support or oppose reducing raccoon populations for four specific reasons.
Majorities support each reason, with the top reason being to protect threatened or endangered
species (65% support), followed by to increase wildlife populations (58%), to prevent the
loss of domestic animals (54%), and, at the bottom again, to address human safety (53%).
Opposition is greatest for these last two reasons: 40% oppose reducing raccoon populations
to address human safety, and 39% oppose to prevent the loss of domestic animals.
Q44-47. Percent who strongly support reducing racoon populations for the following reasons.
28
26
23
22
0 20 40 60 80 100
To protectthreatened orendangered
species
To address humansafety
To increase wildlifepopulations, such
as nestingwaterfowl
To prevent loss ofdomestic animals,such as chickens,domestic ducks, or
pets
Percent

Public Opinion on Hunting and Wildlife Management in Washington 69
Q44-47. Percent who support reducing racoon populations for the following reasons.
65
58
54
53
0 20 40 60 80 100
To protectthreatened orendangered
species
To increase wildlifepopulations, such
as nestingwaterfowl
To prevent loss ofdomestic animals,such as chickens,domestic ducks, or
pets
To address humansafety
Percent

70 Responsive Management
Q44-47. Percent who oppose reducing racoon populations for the following reasons.
40
39
29
26
0 20 40 60 80 100
To address humansafety
To prevent loss ofdomestic animals,such as chickens,domestic ducks, or
pets
To increase wildlifepopulations, such
as nestingwaterfowl
To protectthreatened orendangered
species
Percent

Public Opinion on Hunting and Wildlife Management in Washington 71
Q44-47. Percent who strongly oppose reducing racoon populations for the following reasons.
20
19
12
12
0 20 40 60 80 100
To address humansafety
To prevent loss ofdomestic animals,such as chickens,domestic ducks, or
pets
To protectthreatened orendangered
species
To increase wildlifepopulations, such
as nestingwaterfowl
Percent

72 Responsive Management
SOURCES OF INFORMATION ON WILDLIFE MANAGEMENT Just under a third (31%) of Washington residents have seen or heard information about how
Washington manages its wild animal populations; however, most Washington residents
(69%) have not seen or heard any such information.
• The most common sources from which residents had heard or seen information about
how Washington manages its wild animal populations were newspapers, word-of-mouth,
and television. Other important sources included brochures/pamphlets, hunting
regulations handbook, Internet sites other than agency websites, and magazines.
• When asked to indicate the best way that the state could communicate with them about
wildlife management, the top choice is direct mail, followed by television, newspapers,
the Internet, e-mail, or brochures/pamphlets.
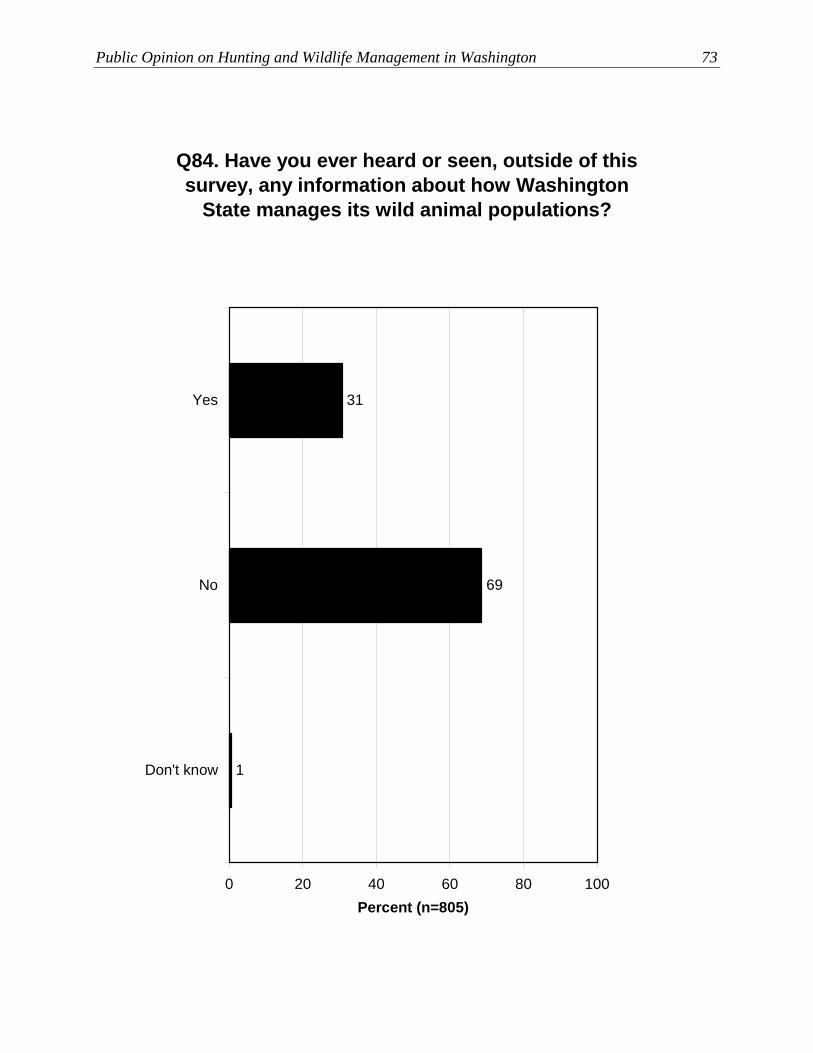
Public Opinion on Hunting and Wildlife Management in Washington 73
Q84. Have you ever heard or seen, outside of this survey, any information about how Washington
State manages its wild animal populations?
1
69
31
0 20 40 60 80 100
Yes
No
Don't know
Percent (n=805)

74 Responsive Management
Q87. From what sources did you hear or see information about how Washington State manages its wild animal populations? (Asked of those who
have previously heard or seen any information about how Washington State manages its wild
animal populations.)
1
1
1
2
3
4
5
10
10
13
23
24
33
9
8
6
0 20 40 60 80 100
Newspapers
Word-of-mouth
TV
Brochures / pamphlets
Hunting regulations handbook
Internet other than agency websites
Magazines
Other
Any agency websites
State agency
Government agency
Radio
Federal agency
Local government agency
Don't know
Direct mail
Mul
tiple
Res
pons
es A
llow
ed
Percent

Public Opinion on Hunting and Wildlife Management in Washington 75
Q91. If the state wished to inform you about its wildlife management efforts, what do you think is
the best way to provide you with information?
2
5
13
15
18
22
23
45
9
6
5
0 20 40 60 80 100
Direct mail
TV
Newspapers
Internet
Brochures / pamphlets
Radio
Magazines
Other
Hunting regulations handbook
Don't know
Mul
tiple
Res
pons
es A
llow
ed
Percent

76 Responsive Management
HUMAN-WILDLIFE CONFLICTS AND NUISANCE WILDLIFE A little more than a quarter of Washington residents (29%) had problems with wild animals
or birds within the past 2 years. The most common such wildlife were raccoons, coyotes,
and deer. The most common types of problems were damage to property/landscaping or
attacks on pets or livestock. Another common problem was animals getting into trash.
• Trend: A slightly greater percentage of respondents in 2008 relative to 2002 had
problems with wildlife: 26% had a problem in 2002, while 31% had a problem in 2008
(unweighted data). Problems with raccoons appeared to decline between 2002 and 2008,
while problems with deer appeared to increase.
Those who had problems with wild animals or birds within the past 2 years were asked who
they believe should pay for nuisance wildlife control and pay for damage caused by wildlife,
and they most commonly say the homeowner. However, substantial percentages say the state
government or local government.
• Trend: In 2008, a slightly lower percentage think the homeowner should pay, relative to
2002.
In answer to a direct question, more Washington residents support (46%) than oppose (39%)
hunting to address human-wildlife conflicts. Also, more residents support (54%) than oppose
(38%) hunting to address nuisance animals. On the other hand, fewer residents support
(41%) than oppose (50%) hunting to reduce animal-vehicle collisions.
• Trend: Support of hunting to address human-wildlife conflicts appears to have dropped
from 76% in 2003 to 47% in 2008 (in comparing unweighted data). However, the 2002
survey included slightly different wording—specifically adding examples of human-
wildlife conflicts: “nuisance animals, preventing the spread of disease, or reducing
animal-vehicle collisions.” This latter wording was not added to the 2008 survey
question. It may be that the provision of specific examples prompted greater support in
2002 when compared to 2008.
In questions about reducing predator populations (respondents were informed, if they asked,
that predators are animals such as bears that hunt and eat other animals), slightly more

Public Opinion on Hunting and Wildlife Management in Washington 77
Washington residents support (50%) than oppose (43%) reducing predator populations to
prevent the loss of domestic animals or pets. Many more residents support (62%) than
oppose (32%) reducing predator populations to address human safety.
• Trend: Support for reducing predator populations to prevent the loss of domestic animals
or pets appears to have dropped from 2002 to 2008. In 2002, 69% supported, while 53%
support in 2008 (unweighted data).
• Trend: Support for reducing predator populations to address human safety also appears
to have dropped from 2002 to 2008. In 2002, 84% supported, while 63% support in 2008
(unweighted data).
In questions about raccoons that are similar to the questions above regarding predators, more
Washington residents support (54%) than oppose (39%) reducing local raccoon populations
to prevent the loss of domestic animals. Also, more support (52%) than oppose (40%)
reducing local raccoon populations to address human safety.
In questions about coyotes that are similar to questions regarding predators, more
Washington residents support (59%) than oppose (37%) reducing local coyote populations to
prevent the loss of domestic animals. Also, more support (58%) than oppose (38%) reducing
local coyote populations to address human safety.
The survey asked questions specifically about hunting cougar with dogs with similar
conditions as those asked about predators, raccoons, and coyotes discussed above. In these
questions, more Washington residents support (57%) than oppose (37%) hunting cougar with
dogs to protect pets or livestock. Also, more than double the percentage support (65%) than
oppose (29%) hunting cougar with dogs to address human safety.
Washington residents were asked whether local opinion should be given more weight than
statewide opinion in cougar management decisions, and the large majority of residents (74%)
think local opinion should be given more weight. (This graph is shown in the section of this
report titled, “Opinions on Management of Cougar and Black Bear.”)

78 Responsive Management
Washington residents most commonly think that threats to humans from cougars have
remained stable in the past 4 years (43% give this answer); otherwise, they more often think
threats have increased (24%) than decreased (7%). A quarter (25%) do not know. (This
graph is shown in the section of this report titled, “Opinions on Management of Cougar and
Black Bear.”)
• Those who say the threats to humans have increased most commonly attribute the
increase to habitat encroachment by humans or simply more media reports about threats;
only a few think threats have increased because the number of cougars has increased.
(This graph is shown in the section of this report titled, “Opinions on Management of
Cougar and Black Bear.”)
• Those who say the threats to humans have decreased most commonly attribute the
decrease to fewer media reports/fewer sightings or to their belief that human
encroachment has forced cougars out of the area and thereby reduced threats (i.e.,
cougars just are not around anymore). (This graph is shown in the section of this report
titled, “Opinions on Management of Cougar and Black Bear.”)
Washington residents most commonly think that threats to livestock or pets from cougars
have remained stable in the past 4 years (39% give this answer); otherwise, they more often
think threats have increased (24%) than decreased (5%). Almost a third (31%) do not know.
(This graph is shown in the section of this report titled, “Opinions on Management of Cougar
and Black Bear.”)
• Those who say the threats to livestock or pets have increased most commonly attribute
the increase to habitat encroachment by humans or simply more media reports about
threats; only a few think threats have increased because the number of cougars has
increased. (This graph is shown in the section of this report titled, “Opinions on
Management of Cougar and Black Bear.”)
• Those who say the threats to livestock or pets have decreased most commonly attribute
the decrease to fewer media reports, fewer cougars, or better cougar population
management. (This graph is shown in the section of this report titled, “Opinions on
Management of Cougar and Black Bear.”)

Public Opinion on Hunting and Wildlife Management in Washington 79
In a question specifically pertaining to wolf predation of livestock, most Washington
residents (61%) support some level of lethal wolf control to protect at-risk livestock;
however, a substantial percentage (31%) oppose. Additionally, a majority of residents (56%)
support having the state pay compensation out of the General Fund to ranchers who have
documented losses to livestock from wolves, but 35% oppose. (These graphs are shown in
the section of this report titled, “Opinions on Management of Wolves.”)

80 Responsive Management
Q18. Sometimes people have problems with wildlife in their neighborhoods or around their
homes. Have you had any problems with any wild animals or birds within the past 2 years?
71
29
0 20 40 60 80 100
Yes
No
Percent (n=805)

Public Opinion on Hunting and Wildlife Management in Washington 81
Have you had any problems with any wild animals or birds within the past 2 years?
26
73 71
29 31
69
0
20
40
60
80
100
Yes No
Perc
ent
2002 survey2008 survey (weighted)2008 survey (unweighted)

82 Responsive Management
Q21. Which wild animals or birds caused you problems? (Asked of those who have experienced
problems with wildlife near their home in the past 2 years.)
1
1
1
1
1
2
2
3
3
3
5
5
8
10
11
22
22
35
6
5
5
0 20 40 60 80 100
Raccoons
Coyotes
Deer
Opossums
Other birds
Bears
Other rodents
Cougars
Crows
Squirrels
Skunks
Other
Bobcats
Rabbits
Birds of prey
Beavers
Elk
Don't know
Geese
Snakes
Seagulls
Mul
tiple
Res
pons
es A
llow
ed
Percent

Public Opinion on Hunting and Wildlife Management in Washington 83
Which wild animals or birds caused you problems?
5 85
25
16 6
26
2275
47
14 148 6 6
11
22
35
5
34
22
10
0
20
40
60
80
100
Raccoons Deer Oppossums Cougar Bear Skunks Beaver Squirrels Don't know
Perc
ent
2002 survey2008 survey (weighted)2008 survey (unweighted)

84 Responsive Management
Q23. What problems did the wildlife cause? (Asked of those who have had problems with wildlife in the
past 2 years.)
3
5
5
8
9
11
12
27
29
8
7
5
0 20 40 60 80 100
Damaged property and/or landscaping
Attacked / injured / killed pets and/or livestock
Got into the trash
A nuisance in general (e.g., too many, noisy,roam the neighborhood)
Attempted to enter house / dwell in or aroundhouse
Other
Presence of the animal disturbed / frightenedme, my family, and/or the neighbors
Made a mess / defecated and/or "sprayed" onproperty
Came onto property / lawn
Annoyed / bothered pets and/or livestock
Ate food left out for cats, dogs, birds, etc.
Eats or gets into everything (unspecific)
Mul
tiple
Res
pons
es A
llow
ed
Percent

Public Opinion on Hunting and Wildlife Management in Washington 85
Q26. Who do you think should pay for nuisance wildlife control and pay for damage caused by
wildlife? (Asked of those who have experienced problems with wildlife near their home in the past 2
years.)
1
1
9
10
12
15
25
36
8
5
3
0 20 40 60 80 100
Homeowner
State government
Local government
Don't know
Government(unspecified)
Insurancecompany
Federalgovernment
Other
Taxpayers
Nobody
Hunters, fromtheir license fees
Mul
tiple
Res
pons
es A
llow
ed
Percent

86 Responsive Management
Who do you think should pay for nuisance wildlife control and pay for damage caused by wildlife?
128 78 879
1721
26
46
36
25
15 13
26
37
11
0
20
40
60
80
100
Landowners State government Local government Don't know Federal government Hunters
Perc
ent
2002 survey2008 survey (weighted)2008 survey (unweighted)

Public Opinion on Hunting and Wildlife Management in Washington 87
Q31. Do you support or oppose hunting to address human-wildlife conflicts?
7
20
19
8
27
19
0 20 40 60 80 100
Strongly support
Moderatelysupport
Neither supportnor oppose
Moderatelyoppose
Strongly oppose
Don't know
Percent (n=805)

88 Responsive Management
Do you support or oppose hunting to address human-wildlife conflicts?
19 20
7
20
8
42
34
38 8
58
27
19 182027
8
0
20
40
60
80
100
Strongly support Moderatelysupport
Neither supportnor oppose
Moderatelyoppose
Strongly oppose Don't know
Perc
ent
2002 survey2008 survey (weighted)2008 survey (unweighted)

Public Opinion on Hunting and Wildlife Management in Washington 89
Q32. Do you support or oppose hunting to address nuisance animals?
2
20
18
6
26
28
0 20 40 60 80 100
Strongly support
Moderatelysupport
Neither supportnor oppose
Moderatelyoppose
Strongly oppose
Don't know
Percent (n=805)

90 Responsive Management
Q34. Do you support or oppose hunting to reduce animal-vehicle collisions?
3
26
24
5
23
18
0 20 40 60 80 100
Strongly support
Moderatelysupport
Neither supportnor oppose
Moderatelyoppose
Strongly oppose
Don't know
Percent (n=805)

Public Opinion on Hunting and Wildlife Management in Washington 91
Q38. Do you support or oppose reducing predator populations to prevent loss of domestic animals or
pets?
1
22
21
5
28
22
0 20 40 60 80 100
Strongly support
Moderatelysupport
Neither supportnor oppose
Moderatelyoppose
Strongly oppose
Don't know
Percent (n=805)

92 Responsive Management
Do you support or oppose reducing predator populations to prevent loss of domestic animals or pets?
21 22
1
20
2
3336
3
12 1255
2822 20
2330
5
0
20
40
60
80
100
Strongly support Moderatelysupport
Neither supportnor oppose
Moderatelyoppose
Strongly oppose Don't know
Perc
ent
2002 survey2008 survey (weighted)2008 survey (unweighted)

Public Opinion on Hunting and Wildlife Management in Washington 93
Q41. Do you support or oppose reducing predator populations to address human safety?
2
17
15
4
32
30
0 20 40 60 80 100
Strongly support
Moderatelysupport
Neither supportnor oppose
Moderatelyoppose
Strongly oppose
Don't know
Percent (n=805)

94 Responsive Management
Do you support or oppose reducing predator populations to address human safety?
15 17
2
17
2
52
32
2 48
34
3230
15
31 32
4
0
20
40
60
80
100
Strongly support Moderatelysupport
Neither supportnor oppose
Moderatelyoppose
Strongly oppose Don't know
Perc
ent
2002 survey2008 survey (weighted)2008 survey (unweighted)

Public Opinion on Hunting and Wildlife Management in Washington 95
Q44. Do you support or oppose reducing local raccoon populations to prevent loss of domestic animals, such as chickens, domestic ducks, or
pets?
3
19
20
4
32
22
0 20 40 60 80 100
Strongly support
Moderatelysupport
Neither supportnor oppose
Moderatelyoppose
Strongly oppose
Don't know
Percent (n=805)

96 Responsive Management
Q47. Do you support or oppose reducing local raccoon populations to address human safety?
2
20
20
6
26
26
0 20 40 60 80 100
Strongly support
Moderatelysupport
Neither supportnor oppose
Moderatelyoppose
Strongly oppose
Don't know
Percent (n=805)

Public Opinion on Hunting and Wildlife Management in Washington 97
Q50. Do you support or oppose reducing local coyote populations to prevent loss of domestic
animals, such as chickens, goats, or pets?
1
18
19
3
31
28
0 20 40 60 80 100
Strongly support
Moderatelysupport
Neither supportnor oppose
Moderatelyoppose
Strongly oppose
Don't know
Percent (n=805)

98 Responsive Management
Q53. Do you support or oppose reducing local coyote populations to address human safety?
1
21
17
3
29
29
0 20 40 60 80 100
Strongly support
Moderatelysupport
Neither supportnor oppose
Moderatelyoppose
Strongly oppose
Don't know
Percent (n=805)
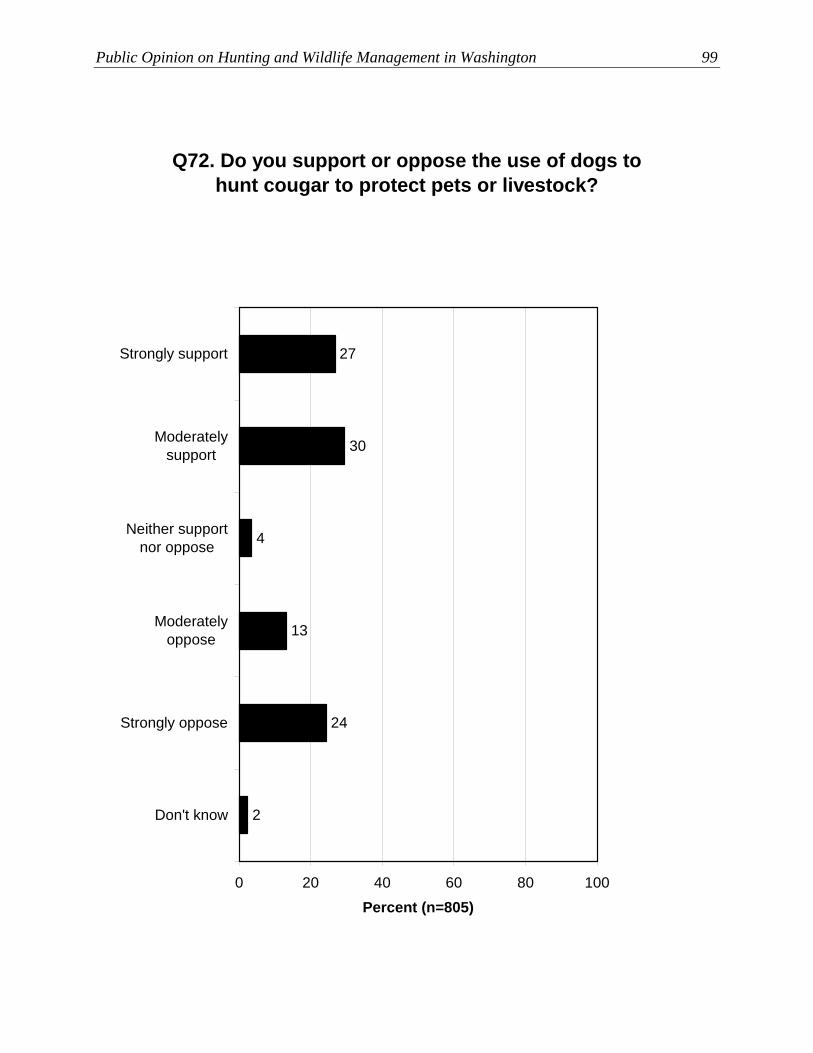
Public Opinion on Hunting and Wildlife Management in Washington 99
Q72. Do you support or oppose the use of dogs to hunt cougar to protect pets or livestock?
2
24
13
4
30
27
0 20 40 60 80 100
Strongly support
Moderatelysupport
Neither supportnor oppose
Moderatelyoppose
Strongly oppose
Don't know
Percent (n=805)

100 Responsive Management
Q71. Do you support or oppose the use of dogs to hunt cougar to protect human safety?
2
18
11
4
26
39
0 20 40 60 80 100
Strongly support
Moderatelysupport
Neither supportnor oppose
Moderatelyoppose
Strongly oppose
Don't know
Percent (n=805)

Public Opinion on Hunting and Wildlife Management in Washington 101
DEMOGRAPHIC CHARACTERISTICS AND MEMBERSHIP IN WILDLIFE-RELATED ORGANIZATIONS
The gender split of the sample is nearly even, with 52% females and 48% males.
Ages of respondents are shown, fairly evenly distributed among age categories. Note that the
data were weighted by age to ensure proper representation of younger respondents, and this
graph reflects the weighting.
The ethnicity of respondents is shown. The majority of Washington residents (82%) answer
that their ethnic background includes white/Caucasian.
When asked to characterize the area in which they live, 39% of respondents describe it as a
large city/urban area or a suburban area. Meanwhile, 27% describe it as a small city or town,
and 31% describe it as rural.
Counties of residence are shown, with the leading counties being King, Pierce, Snohomish,
Clark, Spokane, and Kitsap (all with more than 5% of respondents).
Educational attainment of Washington residents is shown: 69% have some college or trade
school coursework, with or without a degree, and 35% have a Bachelor’s degree, with or
without a higher degree.
Occupations of respondents are shown.
Incomes of respondents are shown, which follow a bell curve with the peak in the $60,000 to
$79,000 category.

102 Responsive Management
A substantial percentage of Washington residents (38%) are members of or donate to a
wildlife organization that promotes conservation or habitat enhancement. The most common
organizations are Ducks Unlimited, the Rocky Mountain Elk Foundation, the Sierra Club, the
World Wildlife Fund, the National Rifle Association, and the Nature Conservancy.
• Trend: The graph of trends shows affiliation with specific organizations, with no marked
differences between the two years of study. (Trends were not shown on total
“participation” in an organization, as the 2002 survey asked only about membership in an
organization, while the 2008 survey asked about membership in or having donated to an
organization; it is likely that some may have donated to organizations without becoming
full members.)

Public Opinion on Hunting and Wildlife Management in Washington 103
Q125. Respondent's gender. (Observed by interviewer, not asked.)
52
48
0 20 40 60 80 100
Male
Female
Percent (n=805)

104 Responsive Management
Q119. Respondent's age.
10
17
18
19
14
14
2
5
0 20 40 60 80 100
65 years old orolder
55-64 years old
45-54 years old
35-44 years old
25-34 years old
18-24 years old
Under 18 yearsold
Don't know /Refused
Percent (n=805)
Mean = 45.51

Public Opinion on Hunting and Wildlife Management in Washington 105
Q114. What races or ethnic backgrounds do you consider yourself, and please mention all that
apply?
2
3
4
4
8
82
1
1
0 20 40 60 80 100
White orCaucasian
Don't know / can'tsay / refused
Native American orAlaskan native or
Aleutian
Hispanic or Latino
Black or African-American
East Asian
Native Hawaiian orother Pacific
Islander
South Asian
Mul
tiple
Res
pons
es A
llow
ed
Percent

106 Responsive Management
Q108. Do you consider your place of residence to be in a large city or urban area, a suburban area, a
small city or town, or a rural area?
3
24
7
27
19
20
0 20 40 60 80 100
Large city orurban area
Suburban area
Small city or town
Rural area on afarm or ranch
Rural area not ona farm or ranch
Don't know
Percent (n=805)

Public Opinion on Hunting and Wildlife Management in Washington 107
Q109. In what county do you live?
3.50.10.10.20.20.30.30.40.50.50.60.60.70.70.70.91.11.11.21.31.41.41.51.61.71.82.12.6
5.56.56.97.6
11.621.5
4.43.9
3.2
0 20 40 60 80 100
KingPierce
SnohomishClark
SpokaneKitsap
ThurstonYakima
WhatcomCowlitzBentonMasonGrant
StevensSkagit
WhitmanClallam
LewisFranklin
GraysOkanogan
WallaChelan
DouglasAsotinPend
IslandKittitas
FerrySan Juan
KlickitatJefferson
PacificSkamania
AdamsWahkiaku
Don't know
Percent (n=805)

108 Responsive Management
Q110. What is the highest level of education you have completed?
10
21
12
22
24
4
3
4
0 20 40 60 80 100
Not a high schoolgraduate
High schoolgraduate orequivalent
Some college ortrade school, no
degree
Associate'sdegree or tradeschool degree
Bachelor'sdegree
Master's degree
Professional ordoctorate degree
Don't know / can'tsay
Percent (n=805)
27%
35%
69%

Public Opinion on Hunting and Wildlife Management in Washington 109
Q116/117. Respondent's occupation.
5
4
3
2
2
2
1
1
1
6
5
5
5
5
6
6
6
8
18
5
5
0 20 40 60 80 100
Retired
Homemaker
Office / consulting / data analysis
Construction / carpentry / plumbing / electrical /craftsman
Medical / wellness
Government services
Retail / wholesale sales
Finance / insurance / real estate
Disabled
Full-time student
Education
Computer / technical / electronics
Unemployed
Manufacturing / factory / industry
Transportation / shipping
Mechanical / machine servicing
Restaurant / hotel / tourism / entertainment
Military
Agriculture / farming
Other
Don't know / can't be categorized
Percent

110 Responsive Management
Q111. Which of these categories best describes your total household income before taxes last
year?
5
8
14
13
11
7
9
32
0 20 40 60 80 100
Under $20,000
$20,000 -$39,000
$40,000 -$59,000
$60,000 -$79,000
$80,000 -$99,000
$100,000 -$119,000
$120,000 or more
Don't know / can'tsay
Percent (n=805)

Public Opinion on Hunting and Wildlife Management in Washington 111
Q106. Are you a member of or have you donated to any organization that promotes wildlife conservation or habitat enhancement?
4
59
38
0 20 40 60 80 100
Yes
No
Don't know
Percent (n=805)

112 Responsive Management
Q107. What conservation organization are you a member of or donated to? (Asked of those who
have donated to or are a member of any organization that promotes wildlife conservation or
habitat enhancement.)
26
19
1
1
1
1
1
1
1
1
1
2
2
3
3
6
7
8
8
11
14
5
4
4
0 20 40 60 80 100
Ducks Unlimited
Rocky Mountain Elk Foundation
Sierra Club
World Wildlife Fund
National Rifle Association
Nature Conservatory
Various sportsmans' clubs
Greenpeace
National Wildlife Federation
Animal rights organizations
Audubon Society
Wolf Haven
County government and land trusts
Pheasants Forever
Aquariums and zoos
Trout Unlimited
National Geographic
Washington state agency
State agencies outside Washington
Sarvey Wildlife Center
Defenders of Wildlife
Natural Resources Defense CouncilOther miscellaneous answers given by less than 1% of
respondentsCan't remember / not specified / don't know
Mul
tiple
Res
pons
es A
llow
ed
Percent

Public Opinion on Hunting and Wildlife Management in Washington 113
What conservation organization are you a member of donated to?
3 3 14
23 14
1113 3 2 2 2 115
2 336
2
0
20
40
60
80
100
NatureConservancy
Ducks Unlimited National WildlifeFederation
Sierra Club National RifleAssociation
Audubon Society Rocky MountainElk Foundation
Greenpeace
Perc
ent
2002 survey2008 survey (weighted)2008 survey (unweighted)

114 Responsive Management
ABOUT RESPONSIVE MANAGEMENT Responsive Management is a nationally recognized public opinion and attitude survey research
firm specializing in natural resource and outdoor recreation issues. Its mission is to help natural
resource and outdoor recreation agencies and organizations better understand and work with their
constituents, customers, and the public.
Utilizing its in-house, full-service, computer-assisted telephone and mail survey center with 45
professional interviewers, Responsive Management has conducted more than 1,000 telephone
surveys, mail surveys, personal interviews, and focus groups, as well as numerous marketing and
communications plans, need assessments, and program evaluations on natural resource and
outdoor recreation issues.
Clients include most of the federal and state natural resource, outdoor recreation, and
environmental agencies, and most of the top conservation organizations. Responsive
Management also collects attitude and opinion data for many of the nation’s top universities,
including the University of Southern California, Virginia Tech, Colorado State University,
Auburn, Texas Tech, the University of California—Davis, Michigan State University, the
University of Florida, North Carolina State University, Penn State, West Virginia University, and
others.
Among the wide range of work Responsive Management has completed during the past 20 years
are studies on how the general population values natural resources and outdoor recreation, and
their opinions on and attitudes toward an array of natural resource-related issues. Responsive
Management has conducted dozens of studies of selected groups of outdoor recreationists,
including anglers, boaters, hunters, wildlife watchers, birdwatchers, park visitors, historic site
visitors, hikers, and campers, as well as selected groups within the general population, such as
landowners, farmers, urban and rural residents, women, senior citizens, children, Hispanics,
Asians, and African-Americans. Responsive Management has conducted studies on
environmental education, endangered species, waterfowl, wetlands, water quality, and the
reintroduction of numerous species such as wolves, grizzly bears, the California condor, and the
Florida panther.

Public Opinion on Hunting and Wildlife Management in Washington 115
Responsive Management has conducted research on numerous natural resource ballot initiatives
and referenda and helped agencies and organizations find alternative funding and increase their
memberships and donations. Responsive Management has conducted major agency and
organizational program needs assessments and helped develop more effective programs based
upon a solid foundation of fact. Responsive Management has developed Web sites for natural
resource organizations, conducted training workshops on the human dimensions of natural
resources, and presented numerous studies each year in presentations and as keynote speakers at
major natural resource, outdoor recreation, conservation, and environmental conferences and
meetings.
Responsive Management has conducted research on public attitudes toward natural resources
and outdoor recreation in almost every state in the United States, as well as in Canada, Australia,
the United Kingdom, France, Germany, and Japan. Responsive Management routinely conducts
surveys in Spanish and has also conducted surveys and focus groups in Chinese, Korean,
Japanese, and Vietnamese.
Responsive Management’s research has been featured in most of the nation’s major media,
including CNN, ESPN, The Washington Times, The New York Times, Newsweek, The Wall Street
Journal, and on the front pages of The Washington Post and USA Today.
Visit the Responsive Management Website at:
www.responsivemanagement.com


