This Selected Issues paper on Haiti was prepared by a staff team of the International Monetary Fund as background documentation for the periodic consultation with the member country. It is based on the information available at the time it was completed on May 6, 2015.
Copies of this report are available to the public from
FIGURE 1. Demographic Trends and Baseline Projections ________________________________________ 30 TABLES 1. Efficiency Scores _______________________________________________________________________ 27 2. Public Investment Management Index ________________________________________________ 28 3. Average Years of Total Schooling, Population > 15, 1950–2010 ______________________ 28 4. Achievements Under the PSUGO Program, 2011–2014 _______________________________ 29
MONETARY POLICY AND FINANCIAL INTERMEDIATION IN HAITI _________________ 34
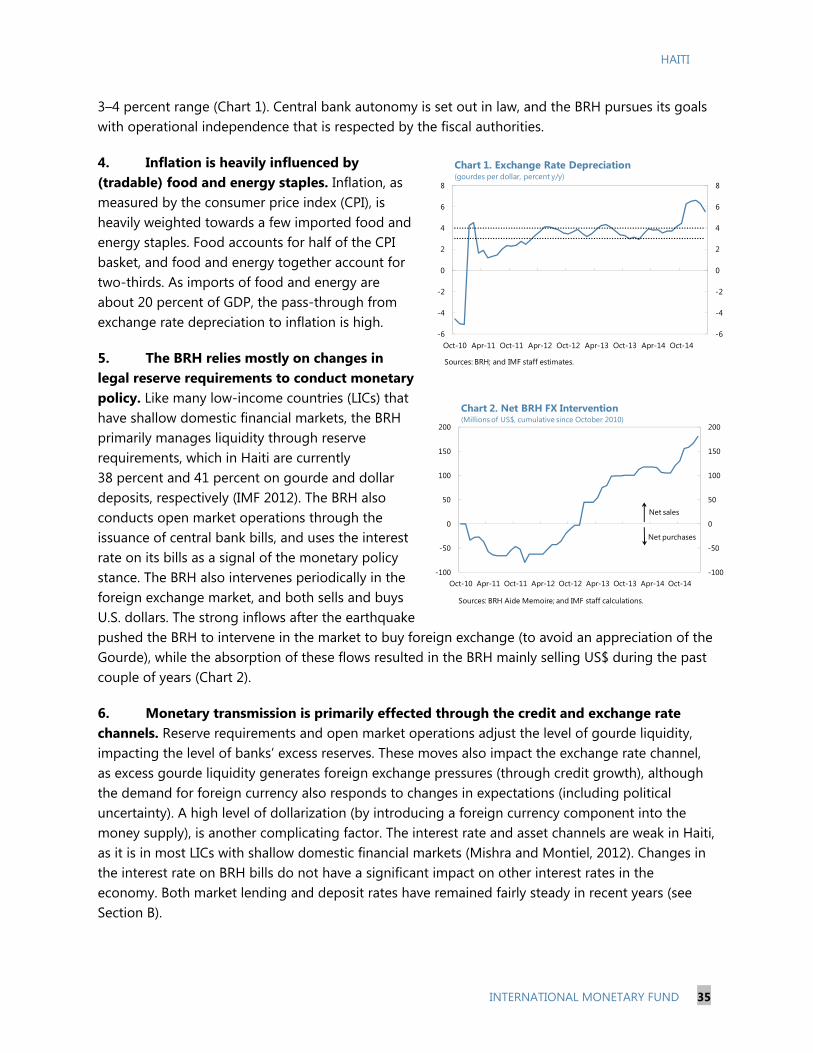
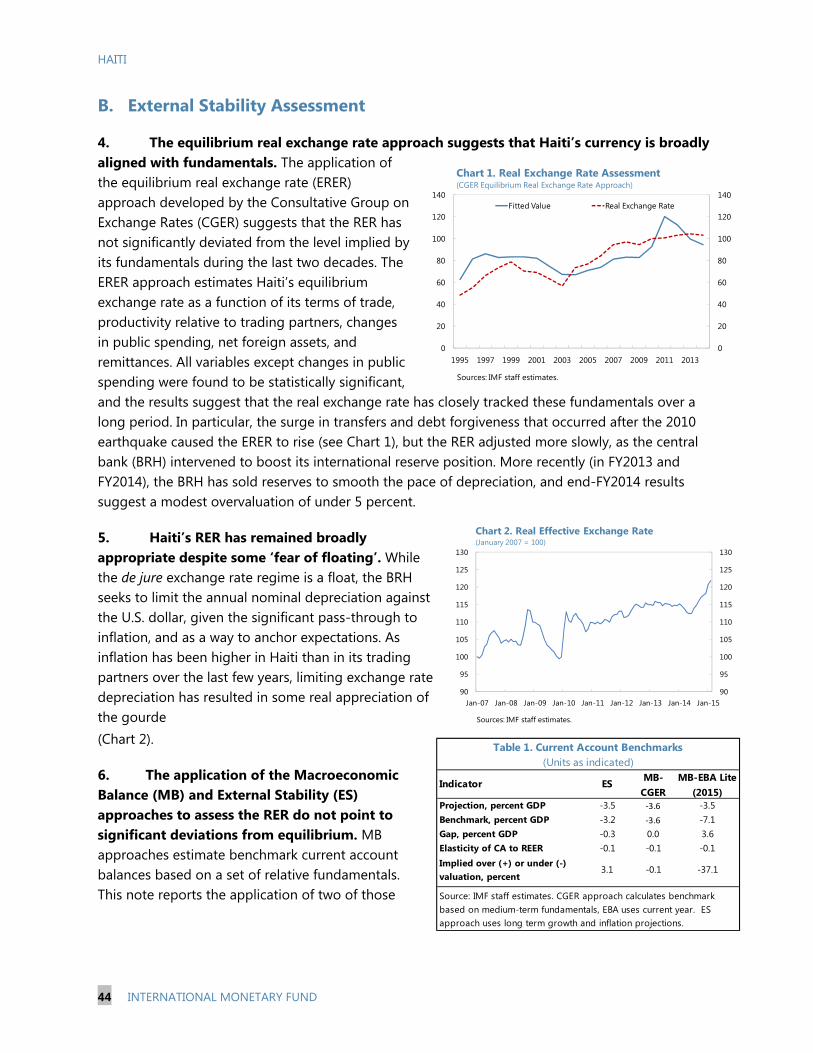
A. Introduction ___________________________________________________________________________ 34
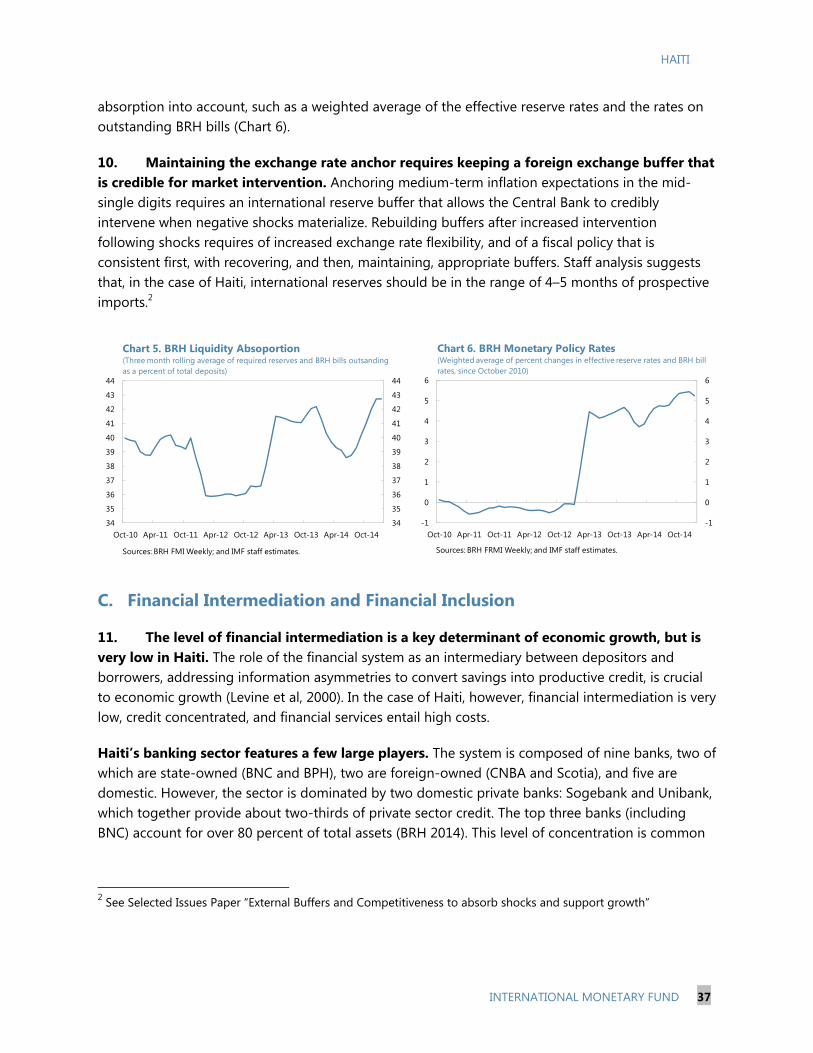
B. Monetary Policy _______________________________________________________________________ 34
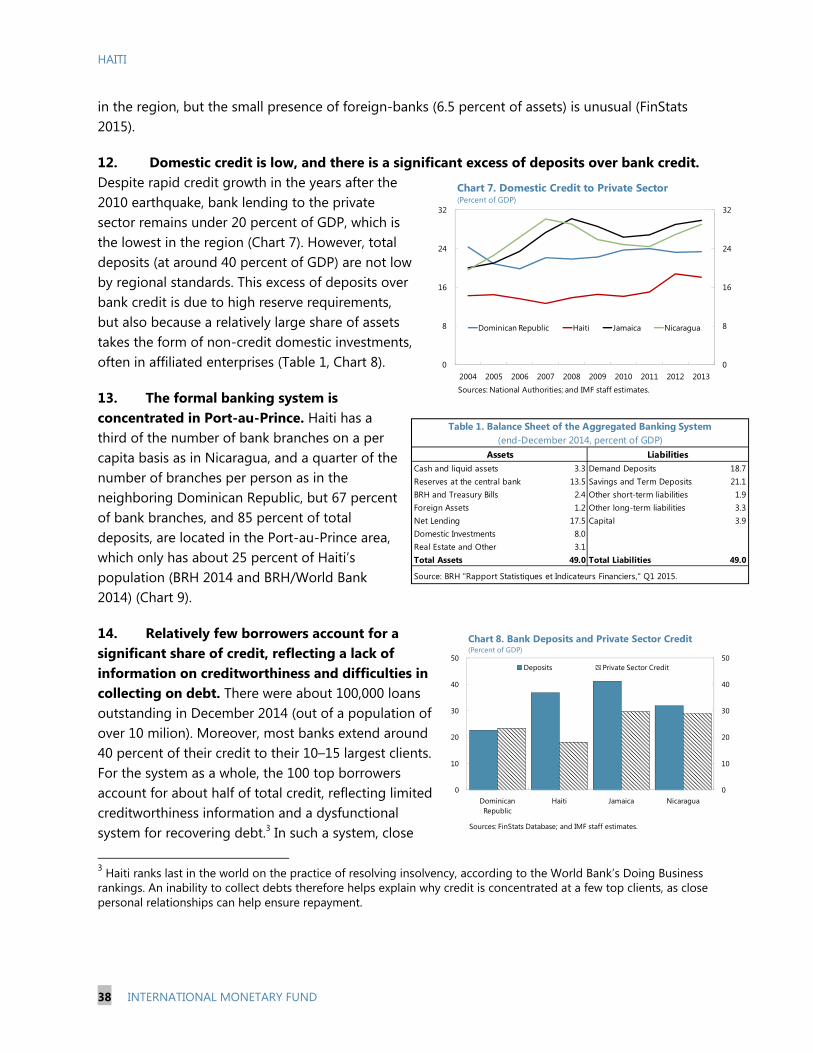
C. Financial Intermediation and Financial Inclusion ______________________________________ 37
References ______________________________________________________________________________ 42 TABLES 1. Balance Sheet of the Aggregated Banking System ____________________________________ 38 2. Sectoral Allocation of Credit ___________________________________________________________ 39 3. Evolution of Savings and Credit Cooperative Sector __________________________________ 40
EXTERNAL BUFFERS AND COMPETITIVENESS TO ABSORB SHOCKS AND
SUPPORT GROWTH ____________________________________________________________________ 43
A. Introduction ___________________________________________________________________________ 43
B. External Stability Assessment __________________________________________________________ 44
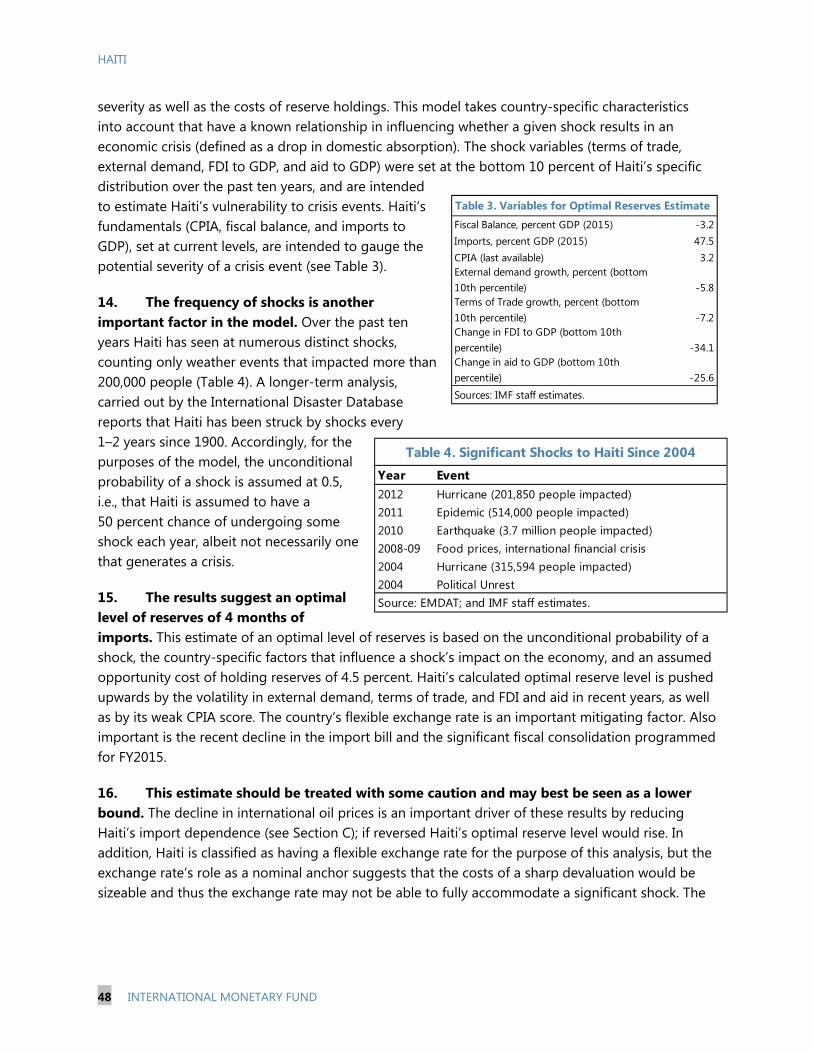
C. Haiti’s Optimal Level of Reserves ______________________________________________________ 47
D. The Impact on Haiti of Lower Oil Prices _______________________________________________ 49
References ______________________________________________________________________________ 50 TABLES 1. Current Account Benchmarks _________________________________________________________ 44 2. Haiti’s Ranking on International Surveys, Latest Available Year _______________________ 46 3. Variables for Optimal Reserves Estimate ______________________________________________ 48 4. Significant Shocks to Haiti Since 2004 _________________________________________________ 48
HAITI’S PUBLIC SECTOR: EXPLAINING THE ECF’S FISCAL TARGET __________________ 51
A. Introduction ___________________________________________________________________________ 51
B. The Banque de la République d’Haiti (BRH) ___________________________________________ 51
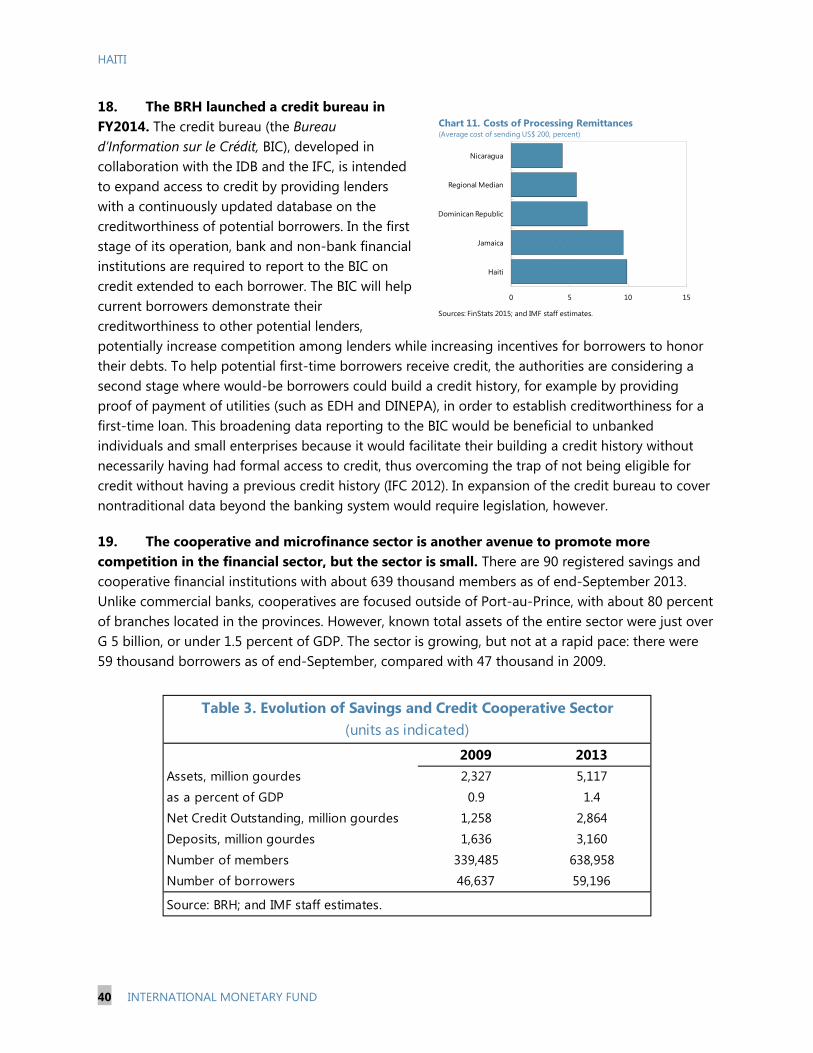
C. State-Owned Enterprises ______________________________________________________________ 53
HAITI
INTERNATIONAL MONETARY FUND 3
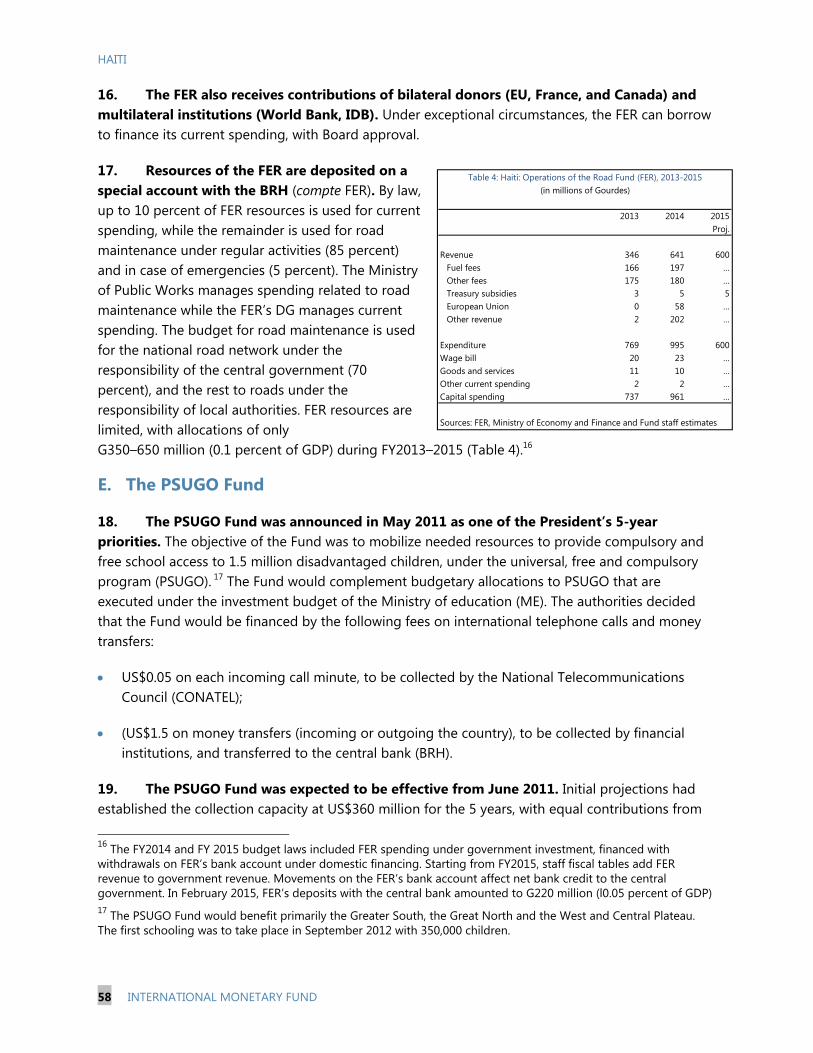
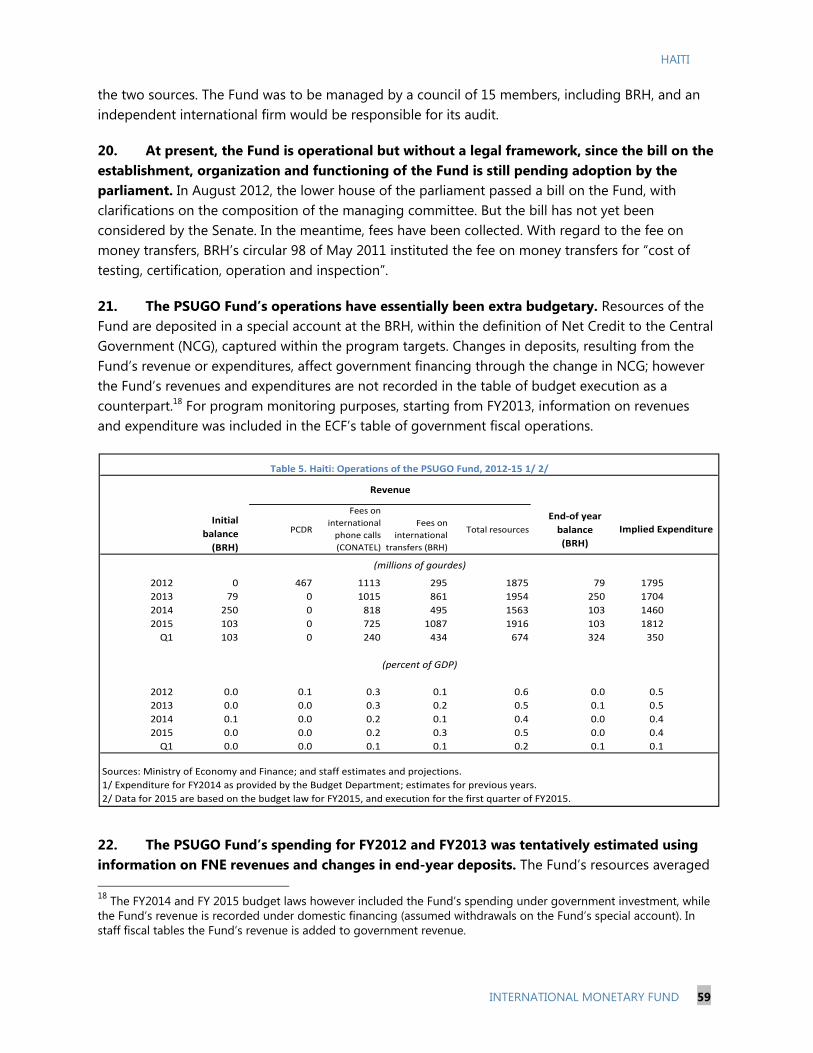
D. The Road Maintenance Fund (FER) ____________________________________________________ 55
E. The PSUGO Fund ______________________________________________________________________ 58
F. The Pension System ___________________________________________________________________ 60
G. Municipalities _________________________________________________________________________ 62
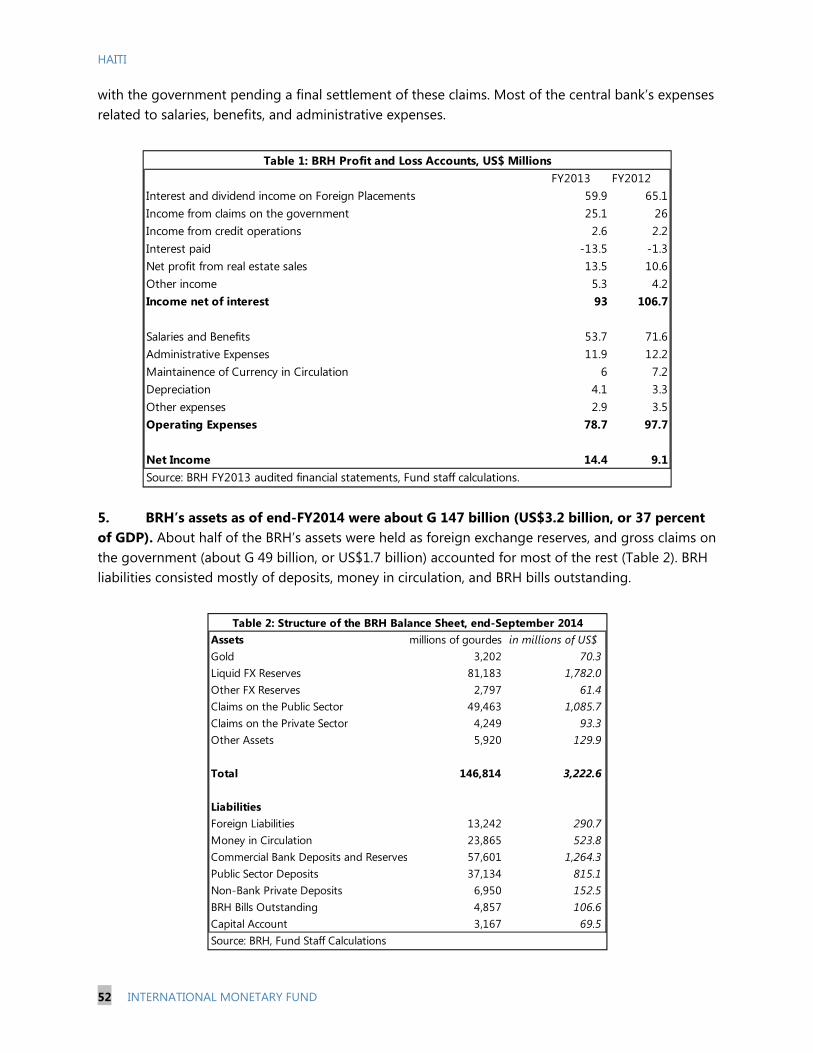
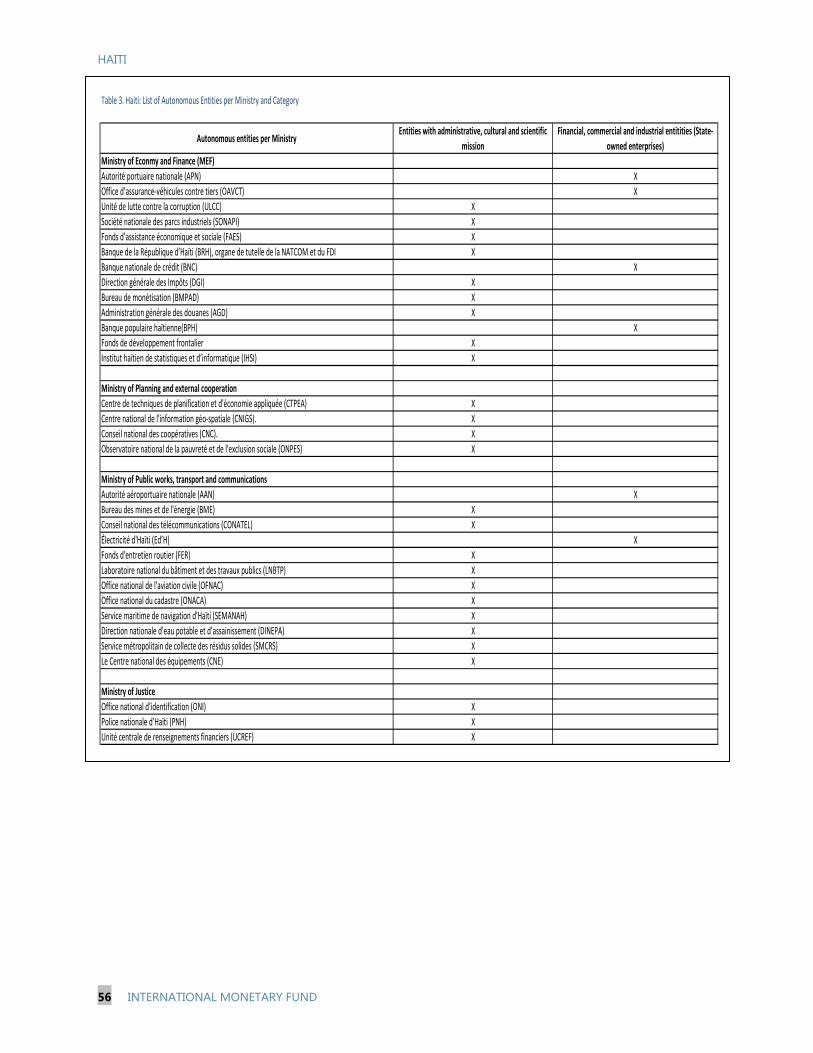
References ______________________________________________________________________________ 64 TABLES 1. BRH Profit and Loss Accounts _________________________________________________________ 52 2. Structure of the BRH Balance Sheet ___________________________________________________ 52 3. List of Autonomous Entities per Ministry and Category ______________________________ 56 4. Operations of the Road Fund (FER), 2013–2015 _______________________________________ 58 5. Operations of the PSUGO Fund 2012–15 ______________________________________________ 59 6. Benefits for Public Sector Employees __________________________________________________ 61
HAITI
4 INTERNATIONAL MONETARY FUND
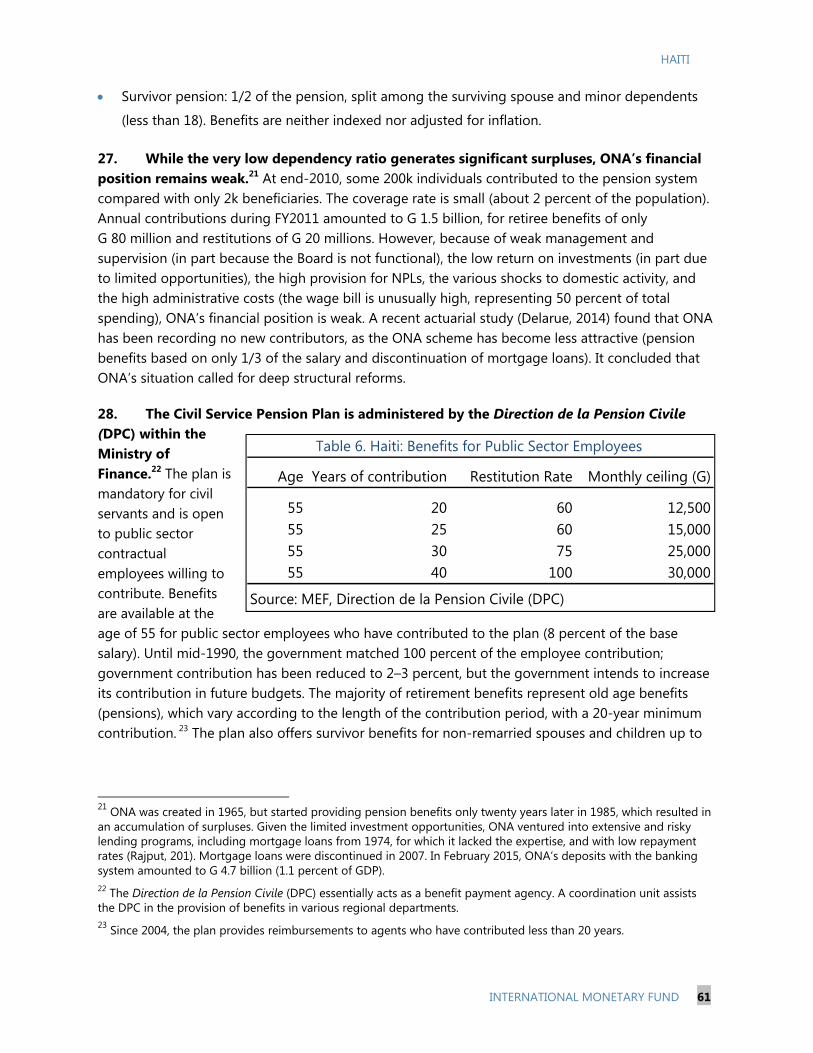
OPPORTUNITIES AND CHALLENGES FOR GROWTH1 A. Introduction
1. Achieving a sustained increase in living standards in Haiti will require deep-seated reforms across a range of areas. Diversifying the export base is needed to cushion the impact of severe shocks that have reduced per capita income and prevented a sustained increase in the capital stock. Integration into global-value chains (GVCs) would allow Haiti to take advantage of its proximity to the U.S. market and favorable trade preferences to generate employment, spur the creation of human capital, and allow Haiti to begin climbing the value added chain. As secure property rights are essential to increased investment, reforms are needed to address Haiti’s persistent uncertainty over land ownership and weak conflict resolution institutions. Haiti’s poor infrastructure, notably in electricity, imposes significant costs on firms and is also a key bottleneck to growth.
2. Haiti is one of the most open economies in Latin America and the Caribbean (LAC), and has carved out a place in world apparel exports through preferential trade agreements with the U.S. However, the absence of strong institutions and complementary structural reforms to augment trade policy, combined with continued vulnerability to a high incidence of shocks, resulted in the failure of trade reforms to stimulate growth. Implementing structural forms will help to attract investments in higher value added activities and aid Haiti in moving up the GVCs, beginning with the apparel industry.
3. Export diversification is important to reduce vulnerability to shocks. Haiti is subject to a high incidence of shocks, with 75 percent of Haitians subject to one or more economically damaging shocks per year (World Bank, 2014). The country’s narrow range of exports and dependence on food imports, further exacerbates its vulnerability to shocks. To reduce it, export diversification is crucial for an open low-income country like Haiti. Empirical evidence shows that, following a wave of trade reforms to open their economies, the diversification spurts of LICs in the 1990s have been associated with a pronounced decrease in growth volatility and have increased their resilience to shocks (IMF 2014).
4. The U.S. HELP and HOPE trade initiatives provide Haiti with an opportunity to integrate into global value chains (GVC) and begin climbing the value added ladder. Geographic proximity with the U.S. and low labor costs (despite low productivity) are additional comparative advantages. Integrating into GVCs requires increasing labor productivity, improving infrastructure, property rights, and the business climate, and upholding international labor standards. Better access to finance would also encourage domestic and foreign investment in the apparel industry.
1 Prepared by Anta Ndoye (SPR), Lawrence Norton, Daniela Cortez, and Gabriel Di Bella (all WHD)
HAITI
INTERNATIONAL MONETARY FUND 5
5. Strengthening property rights and the land tenure system is essential to unlock growth. Haiti’s current land tenure system (where informal land rights exist alongside a complex and archaic legal system), is a serious obstacle to Haiti’s development. Establishing a modern land cadastre, which would both accurately survey each parcel of land and establish clear ownership, would greatly advance the goal of establishing secure and transferable property rights in Haiti. Such a system would incentivize investments to improve real property, allow land to be used as collateral, reduce costly and time-consuming conflicts over land rights, and provide information that could be used for tax purposes.
6. Inadequate basic public infrastructure constitutes a serious deterrent for investment and a bottleneck to growth. A lack of infrastructure means that enterprises must often furnish their own sanitation, security, and energy, and cope with increased costs in transport and logistics. These bottlenecks have been shown to be a significant constraint to growth (IMF 2014). Improved infrastructure would promote higher investment by reducing these costs, but also by reducing uncertainty by providing a concrete demonstration of the state’s determination to maintain a stable business environment.
7. In particular unreliable, insufficient, and unwarrantedly expensive electricity supply hampers investment, growth, poverty reduction, and fuels fiscal vulnerabilities. Inadequate service (including frequent, long, and unplanned blackouts) forces the private sector to generate its own electricity, which reinforces a vicious cycle of high cost and poor service, and prevents taking advantage of economies of scale in production. The electricity sector is a drag to the budget and an important source of macro vulnerability. The deficit of the state-owned electricity company (EDH) was 2.5 percent of GDP in FY2014 (nearly 20 percent of tax revenues), and was financed by central government transfers and loans, and by an accumulation of arrears. Only about 30 percent of the population is connected to the grid, with access among the rural poor being even lower. Large transfers to cover EDH’s deficit crowd out priority spending in education, health and security. High delinquency rates for large electricity consumers result in a more regressive distribution of income.
B. External Trade: Diversify Exports to Reduce Vulnerability to Shocks
8. The U.S. is Haiti’s largest export market, while the Dominican Republic has become the largest source of imports. The majority of apparel exports are shipped to the U.S., Haiti’s main trading partner. In the 1980s, close to 90 percent of exports were with the U.S. and E.U. countries. In 2013, trade to the U.S., as a share of total exports, increased thanks to the generous trade preferences in the apparel sector and new trade partners (Canada, Korea, China) have replaced EU countries (Figure 1).
-40
-35
-30
-25
-20
-15
-10
-5
0
0
5
10
15
20
25
30
1995 1997 1999 2001 2003 2005 2007 2009 2011 2013
Remittances
Trade balance (right axis)
Chart 1. Remittances and Trade(percent of GDP)
Sources: National Authorities; and IMF staff calculations.
HAITI
6 INTERNATIONAL MONETARY FUND
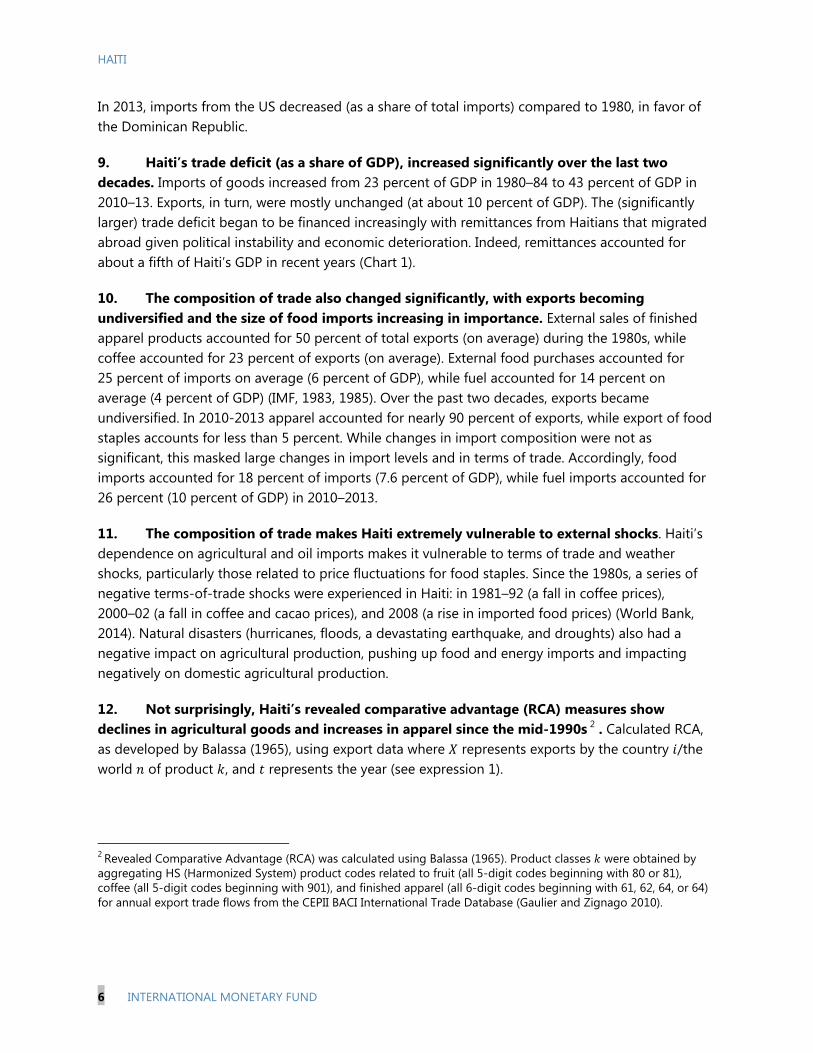
In 2013, imports from the US decreased (as a share of total imports) compared to 1980, in favor of the Dominican Republic.
9. Haiti’s trade deficit (as a share of GDP), increased significantly over the last two decades. Imports of goods increased from 23 percent of GDP in 1980–84 to 43 percent of GDP in 2010–13. Exports, in turn, were mostly unchanged (at about 10 percent of GDP). The (significantly larger) trade deficit began to be financed increasingly with remittances from Haitians that migrated abroad given political instability and economic deterioration. Indeed, remittances accounted for about a fifth of Haiti’s GDP in recent years (Chart 1).
10. The composition of trade also changed significantly, with exports becoming undiversified and the size of food imports increasing in importance. External sales of finished apparel products accounted for 50 percent of total exports (on average) during the 1980s, while coffee accounted for 23 percent of exports (on average). External food purchases accounted for 25 percent of imports on average (6 percent of GDP), while fuel accounted for 14 percent on average (4 percent of GDP) (IMF, 1983, 1985). Over the past two decades, exports became undiversified. In 2010-2013 apparel accounted for nearly 90 percent of exports, while export of food staples accounts for less than 5 percent. While changes in import composition were not as significant, this masked large changes in import levels and in terms of trade. Accordingly, food imports accounted for 18 percent of imports (7.6 percent of GDP), while fuel imports accounted for 26 percent (10 percent of GDP) in 2010–2013.
11. The composition of trade makes Haiti extremely vulnerable to external shocks. Haiti’s dependence on agricultural and oil imports makes it vulnerable to terms of trade and weather shocks, particularly those related to price fluctuations for food staples. Since the 1980s, a series of negative terms-of-trade shocks were experienced in Haiti: in 1981–92 (a fall in coffee prices), 2000–02 (a fall in coffee and cacao prices), and 2008 (a rise in imported food prices) (World Bank, 2014). Natural disasters (hurricanes, floods, a devastating earthquake, and droughts) also had a negative impact on agricultural production, pushing up food and energy imports and impacting negatively on domestic agricultural production.
12. Not surprisingly, Haiti’s revealed comparative advantage (RCA) measures show declines in agricultural goods and increases in apparel since the mid-1990s 2 . Calculated RCA, as developed by Balassa (1965), using export data where represents exports by the country /the world of product , and represents the year (see expression 1).
2 Revealed Comparative Advantage (RCA) was calculated using Balassa (1965). Product classes were obtained by aggregating HS (Harmonized System) product codes related to fruit (all 5-digit codes beginning with 80 or 81), coffee (all 5-digit codes beginning with 901), and finished apparel (all 6-digit codes beginning with 61, 62, 64, or 64) for annual export trade flows from the CEPII BACI International Trade Database (Gaulier and Zignago 2010).
HAITI
INTERNATIONAL MONETARY FUND 7
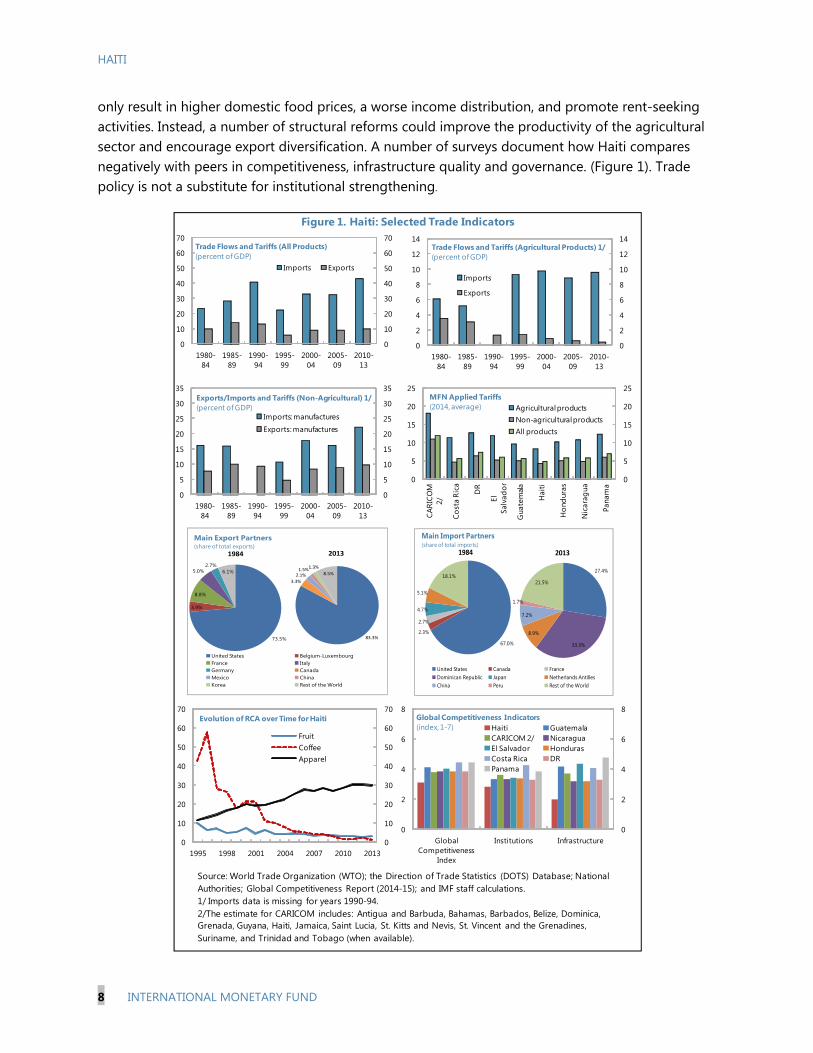
13. The RCAs calculated reveal that Haiti’s specialization in apparel has steadily increased over the past 15 years. At the same time, its exports of agricultural products (fruits, and coffee) have steeply declined. Indeed, Haiti’s coffee exports (in volume terms) in 2013 were only 5 percent of its 1995 level.
14. External trade trends in Haiti also underscore the importance of implementing structural alongside trade reforms. East Asian countries, Mauritius and Chile all implemented trade liberalization policies in the 1990s, which boosted their growth performance (World Bank, 2005) and accompanied their trade reforms with structural reforms which strengthened institutions and entrenched macroeconomic stability. Some of these countries (e.g., India, China, Mauritius) also opted for partial trade liberalization, either by relaxing protection in one sector at a time (India), or by pursuing a dual track approach to liberalizing via special economic zones for export industries (China, Mauritius). Strong institutions (e.g. low corruption, sound infrastructure in Mauritius), along with the maintenance of stable inflation rates and a competitive real exchange rate (Mauritius, India, Chile), via sound policy, provided long-term credibility for trade liberalization policies. (World Bank, 2005).
15. Haiti, in contrast, liberalized trade against the backdrop of domestic turmoil and indecisive implementation of structural reforms. Reforms in the late 1980s included the elimination of import and export license restrictions, as well as lower customs duties (except for agricultural goods). In the mid-1990s, Haiti eliminated import restrictions and reduced tariffs on agricultural goods to 15 percent (from 40–50 percent). Specific rates (0–3 percent) were introduced for basic products (e.g., rice, sugar, flour, and cement) (IMF, 2011).3 Tariffs have remained broadly unchanged since then. Haiti’s simple average applied tariff is the lowest in the region at 4.8 percent. Although agriculture has a higher-than-average tariff (8.2 percent), it is nonetheless lower than in comparator countries. The combination of a reduction in tariffs for agricultural goods, deteriorated infrastructure, and an uncertain policy framework, contributed to a further decline of the agricultural sector, which was already experiencing a secular decrease in productivity. The unsteady domestic situation during the 1990s was also reflected in a dramatic decline in the exports of manufacturing goods (Lundahl, 2013). (Figure 1).
16. For Haiti, the main challenge remains to pair trade policy with structural reforms more conducive to export diversification and growth. Although there is some room to use tariffs (converging to CARICOM averages) to stimulate the agricultural sector, steep increases in tariffs may
3 Haiti became a member of the WTO in 1996.
(1)
HAITI
8 INTERNATIONAL MONETARY FUND
only result in higher domestic food prices, a worse income distribution, and promote rent-seeking activities. Instead, a number of structural reforms could improve the productivity of the agricultural sector and encourage export diversification. A number of surveys document how Haiti compares negatively with peers in competitiveness, infrastructure quality and governance. (Figure 1). Trade policy is not a substitute for institutional strengthening.
Figure 1. Haiti: Selected Trade Indicators
Source: World Trade Organization (WTO); the Direction of Trade Statistics (DOTS) Database; National Authorities; Global Competitiveness Report (2014-15); and IMF staff calculations.1/ Imports data is missing for years 1990-94.2/The estimate for CARICOM includes: Antigua and Barbuda, Bahamas, Barbados, Belize, Dominica, Grenada, Guyana, Haiti, Jamaica, Saint Lucia, St. Kitts and Nevis, St. Vincent and the Grenadines, Suriname, and Trinidad and Tobago (when available).
0
10
20
30
40
50
60
70
0
10
20
30
40
50
60
70
1980-84
1985-89
1990-94
1995-99
2000-04
2005-09
2010-13
Imports Exports
Trade Flows and Tariffs (All Products)(percent of GDP)
0
2
4
6
8
10
12
14
0
2
4
6
8
10
12
14
1980-84
1985-89
1990-94
1995-99
2000-04
2005-09
2010-13
Imports
Exports
Trade Flows and Tariffs (Agricultural Products) 1/(percent of GDP)
0
5
10
15
20
25
30
35
0
5
10
15
20
25
30
35
1980-84
1985-89
1990-94
1995-99
2000-04
2005-09
2010-13
Imports: manufactures
Exports: manufactures
Exports/Imports and Tariffs (Non-Agricultural) 1/(percent of GDP)
United States Belgium-LuxembourgFrance ItalyGermany CanadaMexico ChinaKorea Rest of the World
83.3%
3.3%
2.1%1.5%
1.3%
8.5%
2013
Main Import Partners(share of total imports)
67.0%
2.3%
2.7%
4.7%
5.1%
18.1%
1984
United States Canada FranceDominican Republic Japan Netherlands AntillesChina Peru Rest of the World
27.4%
33.3%
8.9%
7.2%
1.7%
21.5%
2013
0
2
4
6
8
0
2
4
6
8
Global Competitiveness
Index
Institutions Infrastructure
Haiti GuatemalaCARICOM 2/ NicaraguaEl Salvador HondurasCosta Rica DRPanama
Global Competitiveness Indicators (index, 1-7)
HAITI
INTERNATIONAL MONETARY FUND 9
C. Integrating to GVCs to Support Growth and Job Creation
17. A value chain represents all activities that firms would engage to bring a product to the market. Value chains have become increasingly global and resulted in more interconnection between economies as well as more specialization in specific activities and stages of in the value chain rather than in industries. GVCs are also a contributing factor to growth and productivity as well as employment. Integration in a GVC facilitates economic development and is often an easier path to higher living standards than building a complete value chain. Case study evidence generally suggests that countries which integrated successfully in GVCs instead of pursuing domestically-based industrialization experienced better outcomes in the activities and sectors studied (OECD, 2014).
18. Integration to GVCs underpinned increases in GDP per capita in array of countries including Cambodia, China, Costa Rica, the Czech Republic, Mexico, Thailand and Vietnam. Policies to increase openness to trade and investment, improve the business environment, and the creation of export zones seemed to have played a role in the integration of countries into GVCs (World Bank, 2014).
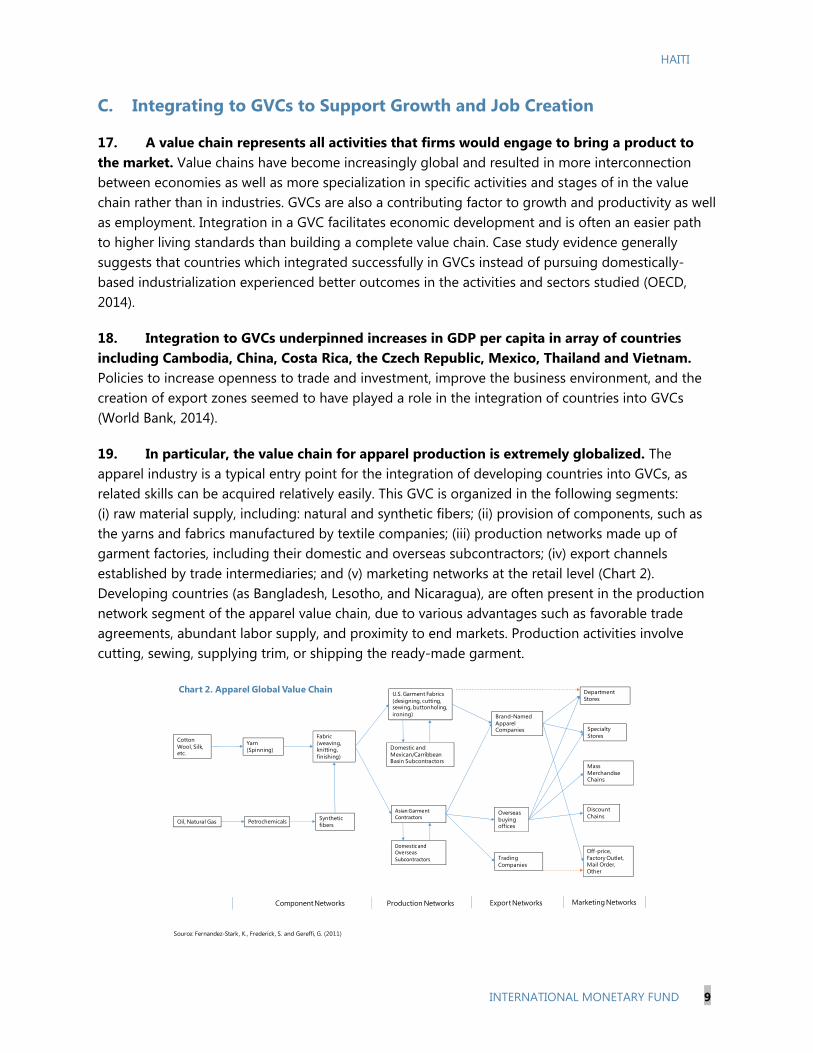
19. In particular, the value chain for apparel production is extremely globalized. The apparel industry is a typical entry point for the integration of developing countries into GVCs, as related skills can be acquired relatively easily. This GVC is organized in the following segments: (i) raw material supply, including: natural and synthetic fibers; (ii) provision of components, such as the yarns and fabrics manufactured by textile companies; (iii) production networks made up of garment factories, including their domestic and overseas subcontractors; (iv) export channels established by trade intermediaries; and (v) marketing networks at the retail level (Chart 2). Developing countries (as Bangladesh, Lesotho, and Nicaragua), are often present in the production network segment of the apparel value chain, due to various advantages such as favorable trade agreements, abundant labor supply, and proximity to end markets. Production activities involve cutting, sewing, supplying trim, or shipping the ready-made garment.
Cotton Wool, Silk, etc.
Oil, Natural Gas
Yarn (Spinning)
Petrochemicals
Fabric (weaving, knitting, finishing)
Synthetic fibers
U.S. Garment Fabrics (designing, cutting, sewing, buttonholing, ironing)
Domestic and Mexican/CarribbeanBasin Subcontractors
Domestic and Overseas Subcontractors
Asian Garment Contractors
Brand-Named Apparel Companies
Overseas buying offices
Trading Companies
Department Stores
Specialty Stores
Mass Merchandise Chains
Discount Chains
Off-price, Factory Outlet, Mail Order, Other
Component Networks Production Networks Export Networks Marketing Networks
Source: Fernandez-Stark, K., Frederick, S. and Gereffi, G. (2011)
Chart 2. Apparel Global Value Chain
HAITI
10 INTERNATIONAL MONETARY FUND
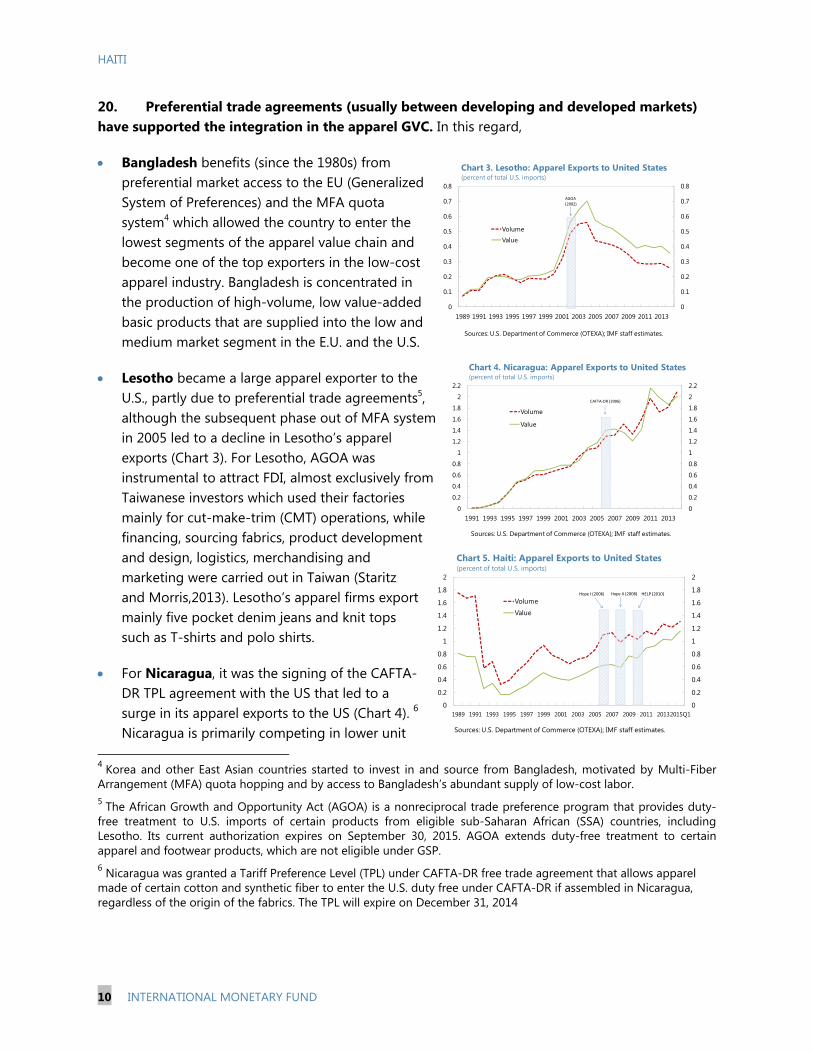
20. Preferential trade agreements (usually between developing and developed markets) have supported the integration in the apparel GVC. In this regard,
Bangladesh benefits (since the 1980s) from preferential market access to the EU (Generalized System of Preferences) and the MFA quota system4 which allowed the country to enter the lowest segments of the apparel value chain and become one of the top exporters in the low-cost apparel industry. Bangladesh is concentrated in the production of high-volume, low value-added basic products that are supplied into the low and medium market segment in the E.U. and the U.S.
Lesotho became a large apparel exporter to the U.S., partly due to preferential trade agreements5, although the subsequent phase out of MFA system in 2005 led to a decline in Lesotho’s apparel exports (Chart 3). For Lesotho, AGOA was instrumental to attract FDI, almost exclusively from Taiwanese investors which used their factories mainly for cut-make-trim (CMT) operations, while financing, sourcing fabrics, product development and design, logistics, merchandising and marketing were carried out in Taiwan (Staritz and Morris,2013). Lesotho’s apparel firms export mainly five pocket denim jeans and knit tops such as T-shirts and polo shirts.
For Nicaragua, it was the signing of the CAFTA-DR TPL agreement with the US that led to a surge in its apparel exports to the US (Chart 4). 6 Nicaragua is primarily competing in lower unit
4 Korea and other East Asian countries started to invest in and source from Bangladesh, motivated by Multi-Fiber Arrangement (MFA) quota hopping and by access to Bangladesh’s abundant supply of low-cost labor. 5 The African Growth and Opportunity Act (AGOA) is a nonreciprocal trade preference program that provides duty-free treatment to U.S. imports of certain products from eligible sub-Saharan African (SSA) countries, including Lesotho. Its current authorization expires on September 30, 2015. AGOA extends duty-free treatment to certain apparel and footwear products, which are not eligible under GSP. 6 Nicaragua was granted a Tariff Preference Level (TPL) under CAFTA-DR free trade agreement that allows apparel made of certain cotton and synthetic fiber to enter the U.S. duty free under CAFTA-DR if assembled in Nicaragua, regardless of the origin of the fabrics. The TPL will expire on December 31, 2014
Chart 5. Haiti: Apparel Exports to United States (percent of total U.S. imports)
Sources: U.S. Department of Commerce (OTEXA); IMF staff estimates.
Hope I (2006) Hope II (2008) HELP (2010)
HAITI
INTERNATIONAL MONETARY FUND 11
value segments of the chain (knitted shirts and intimate apparel) (Frederick, Bair, and Gereffi, 2014).
Haiti has long benefitted from regional trade preferences, in the apparel sector. Since 1983, Haiti and other Caribbean countries have benefitted from duty-free access to the U.S. market of certain apparel exports that are made of U.S. materials. However, international sanctions against Haiti in the early 1990s cut exports almost to zero. More recently, the U.S. granted more flexible trade preferences specific to Haiti to help the country attract investment and create jobs (HOPE Act). These preferences were deepened as part of the rebuilding process (HELP Act) Trade preferences in the HOPE/HELP acts are based largely on duty-free treatment for apparel articles made with third-country inputs, especially fabric. Because the U.S. is Haiti’s primary export destination, apparel exports and employment grew significantly after the adoption of these laws.
21. Despite trade preferences, Lesotho and Nicaragua continue to be mainly at the low-value added end of the apparel industry. Nicaragua is mainly present in the assembly segment of the GVC, with no significant spillovers to domestic production of inputs. In this regard, a relatively large apparel sector, (at the local or regional level) is generally required to attract investment in fabric production, particularly in the woven segment (Staritz and Frederick, 2014). In Lesotho, a challenge has been that labor productivity is low compared to Asian countries specialized in low-cost apparel industries (as Cambodia and Vietnam)
22. Haiti’s apparel exports increased sharply since 2009, but they are also at the low end in terms of value added (Charts 5 and 6). Apparel foreign sales represented 90 percent of exports as of 2014. However, the value added in the sector is still low (around 3 percent). Production is still limited mostly to simple knits and some woven products. The mix is slowly shifting, however, toward greater production of more complicated woven goods (e.g. khaki pants) (Hornbeck, 2010). Employment in the apparel industry is still relatively low (30,000 workers, of which 65 percent are women; Better Work, 2014). Most companies are located in the SONAPI industrial park in the outskirts of Port-au-Prince, although an industrial park in the Dominican border employs 6,500 workers (Grupo M), and a subsidiary of a Korean company (S & H Global) located in the CARACOL industrial park (near Cap Haitien) employs 2500 workers.
200
220
240
260
280
300
320
200
300
400
500
600
700
800
900
1000
2009 2010 2011 2012 2013 2014 2015
Volume, apparel exports to Haiti, SME millions (RHS)Haiti total exports to world, US$ millionsApparel to US, US$ millions
Chart 6. Haitian Apparel Exports to the United States(rolling 12-month sum)
Sources: National Authorities; U.S. Department of Commerce (OTEXA); IMF staff estimates.
R&D
Design
PurchasingProduction
Distribution
Marketing
Services
Valu
e-A
dded
Pre-Production Intangible Activities
Production: Tangible Activities
Post-Production Intangible
Source: Fernandez-Stark, K., Frederick, S. and Gereffi, G. (2011),
Haiti, Bangladesh, Lesotho, Nicaragua
Chart 7. Global Value Chain: Value-Added Stages
HAITI
12 INTERNATIONAL MONETARY FUND
23. Bangladesh increased the value added of apparel exports by developing a domestic textile industry for knitted textiles which allowed exporting firms to source locally. In 1994, Bangladesh introduced a cash incentives program for exporters of apparel products using domestic fabrics, which allowed the country to increase the value added of its exports. Thus, an increasing share of firms do more than cutting and sewing, as they are also responsible for input sourcing. That said, Bangladesh is facing constraints in the form of shortage of skilled workers, supervisors and managers as well as concerns with labor and environmental compliance which have become a requirement from buyers to enter sourcing networks (Staritz, 2011).
24. Increasing value added and labor productivity is essential to preserve investment, as trade preferences usually have a sunset clause. Both Nicaragua and Lesotho are facing the expiration of trade preferences with the US, which could lead to a significant decrease in their exports. Similarly, Haiti benefits from generous trade preferences from the US which are set to expire in 2020 unless an extension is granted.
25. Haiti’s ability to attract investment into higher value activities (including in apparel) will require the steady implementation of reforms, and may benefit from an extension in preferential market access. Challenges that will need addressing include (i) a shortage of personnel with specialized skills (especially in management), and still-low labor productivity;7 (ii) high electricity costs (and generally poor infrastructure); (iii) a lack of commercial property to accommodate factories of 2000 employees and more; (iv) a lack of access to finance; (v) and high administrative costs (including at customs). The implementation of reforms to address these shortcomings will require time, and thus the extension of preferential market access could provide needed time for such reforms to mature and generate investment in the production of higher value-added manufacture goods.
D. Strengthening Property Rights to Unlock Growth
26. A functioning land cadastre system is essential to Haiti’s economic development. Secure and transferable property rights promote domestic and foreign private investment, improve resource allocation by allowing speedy and low-cost transactions, and improve access to credit by allowing land to be used as collateral (Besley and Ghatak, 2009). A cadastre would also deepen the tax base and allow for more equitable and transparent taxation. Finally, the land protection and improvements incentivized by secure title can reduce vulnerabilities to natural disasters; key priorities in a country with a level of land degradation and with frequent exposure to disasters.
7 Wage costs in Haiti are lower than in Bangladesh and Nicaragua but productivity is generally lower.
HAITI
INTERNATIONAL MONETARY FUND 13
27. Haiti’s existing land tenure system is largely informal, particularly in rural areas. Surveys have found that 68 percent of the urban population and 97 percent of the rural population live on land without clear access to title (de Soto, 2000). Instead, an informal land tenure system based on occupancy and family ties developed after the Haitian revolution with the dissolution of the plantation system. While the same basic land titling system has existed since 1825 (when a Civil Code based on the French system was adopted), landowners had little incentive to pursue formal title. Haiti’s legal institutions were weak and politicized, costs prohibitively expensive, and pursuing formal title required interaction with a government often perceived as hostile, particularly as it was not clear how much settled land originally belonged to the Haitian state (Lundahl, 2013).
28. Informal land tenure eventually resulted in fragmented plots and contributed to conflicts over ownership and environmental degradation. Informal land system can adequately protect property rights when there are strong social norms, as has long been the case in rural Haitian communities, and some scholars argue that Haiti’s informal system works reasonably well in the context of weak official institutions (Smucker et al, 2000). However, as growing population fully settled Haiti’s cultivable land by the turn of the 20th century, and given limited opportunities outside of agriculture, a fragmentation of parcels began that continues today. Today, rural land parcels are generally too small to support a decent living, and adding to inefficiency is that a farmer’s land is often composed of several tiny parcels that can be located at some distance from each other
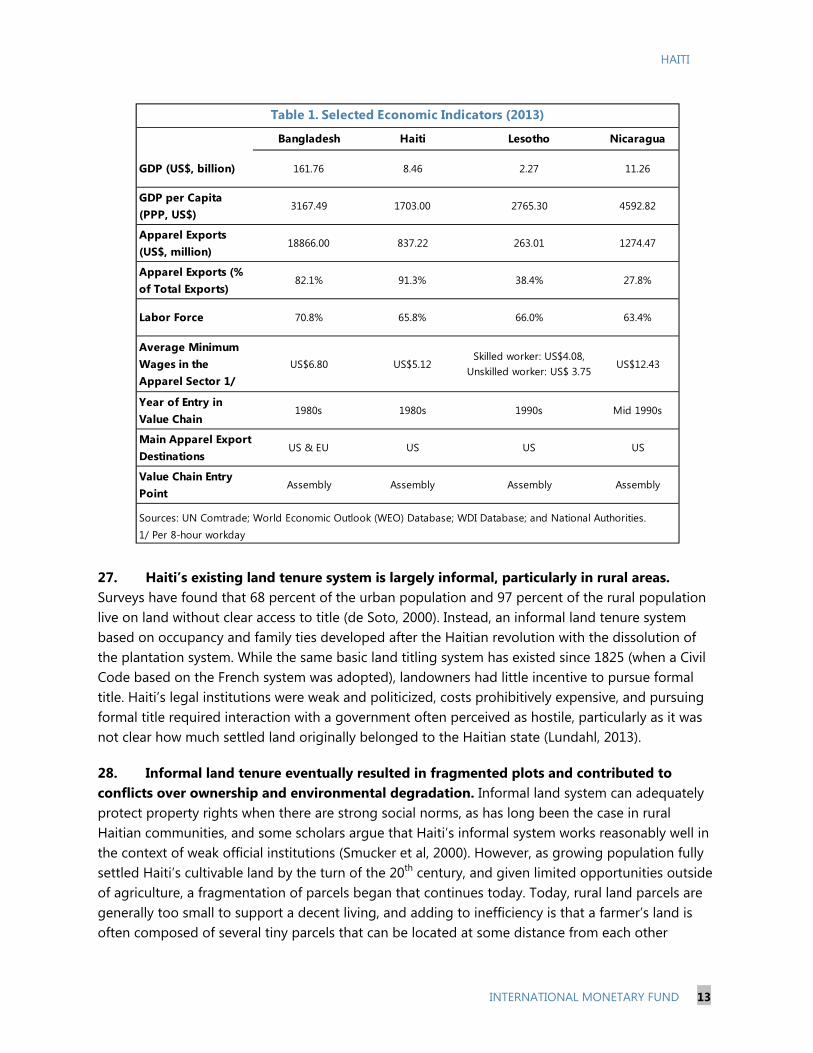
Bangladesh Haiti Lesotho Nicaragua
GDP (US$, billion) 161.76 8.46 2.27 11.26
GDP per Capita (PPP, US$)
3167.49 1703.00 2765.30 4592.82
Apparel Exports (US$, million)
18866.00 837.22 263.01 1274.47
Apparel Exports (% of Total Exports)
82.1% 91.3% 38.4% 27.8%
Labor Force 70.8% 65.8% 66.0% 63.4%
Average Minimum Wages in the Apparel Sector 1/
US$6.80 US$5.12Skilled worker: US$4.08,
Unskilled worker: US$ 3.75US$12.43
Year of Entry in Value Chain
1980s 1980s 1990s Mid 1990s
Main Apparel Export Destinations
US & EU US US US
Value Chain Entry Point
Assembly Assembly Assembly Assembly
1/ Per 8-hour workday
Table 1. Selected Economic Indicators (2013)
Sources: UN Comtrade; World Economic Outlook (WEO) Database; WDI Database; and National Authorities.
HAITI
14 INTERNATIONAL MONETARY FUND
(Lundahl, 2013). The need to continuously occupy land to maintain a claim also hinders economic development, and in urban areas after the 2010 earthquake, it slowed reconstruction by deterring owners from demolishing damaged structures. The informal system also generates conflicts over land, and in the absence of reliable written records, can invite fraudulent claims. The inherent uncertainty of the system also deters investment, and studies have found that it contributes to environmental degradation by reducing incentives to long-term planning (Dolisca et al, 2007).
29. The formal land title system is complex and archaic, making Haiti one of the most difficult places to register property in the world. According to the World Bank’s 2015 Doing Business survey, Haiti ranks 175th out of 189 countries in the ease of registering property (World Bank, 2015)8. After a sales agreement between parties is reached, the first step in registering property is to conduct a survey, which follows an 1890 law that the report be hand-written. Thereafter, a notary public prepares a sale agreement that is then submitted to one of about 140 local communal offices of the Tax Department DGI, which then hand-writes the calculations and text of the assessment notice. After the taxes are paid, the DGI requires an additional 6–9 months to hand-record and transcribe the documents, finally returning the documents to the notary public, and a copy to the central DGI office in Port-au-Prince. There is no central land registry, although the central DGI office does maintain a chronological paper record of transactions in several thousand books, dating back to 1824 (OAS 2010).
30. In the absence of a nationwide land cadastre, the system relies heavily on notary publics and surveyors, with the DGI representing the state. The key role of notary publics (which have a special legal status, and are appointed for life by the President) is to ensure that clear title exists, before it is transferred. However, with over 500 notaries in the country, and no central registry, notaries may not be able to adequately trace the required chain of title going back at least twenty years. Notaries may also not be able to discover prior claims on the land that could invalidate the transaction, such as whether the previous owners respected inheritance laws requiring land to be divided among children, or whether a previous promise to sell the land was made (which in Haiti is binding, see Haiti Property Law Working Group, 2012). The use of surveyors adds to the time and expense of registering property, particularly in Haiti’s archaic legal framework, and surveyors are only licensed by commune but sometimes practice out of it, potentially invalidating the transaction. Fraud amongst both notaries and surveyors is also a problem. The DGI represents the state in the transaction, but its role is primarily tax collection, not record-keeping, and the fact that taxes were paid on a previous transfer of title does not ensure that there is no dispute over ownership of the parcel of land.
31. The parallel existence of an informal and complex formal system of land tenure, together with land fragmentation and weak conflict resolution systems, generates conflict and uncertainty over the ownership of land. The first potential conflict arises if a parcel previously
8 Haiti’s ranking assumes that the underlying land title is clear and undisputed, which is frequently not the case.
HAITI
INTERNATIONAL MONETARY FUND 15
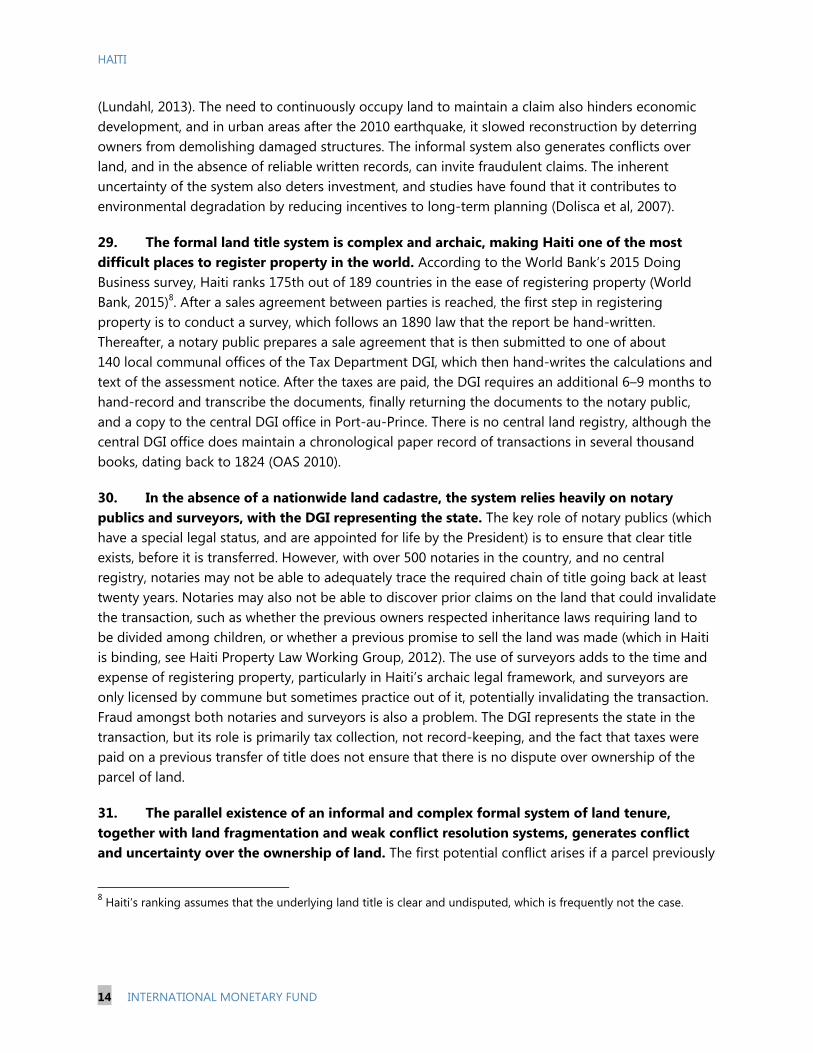
Step of the procedure* Institution or professional involved Documents needed Estimated Time
1. Preliminary sale agreement Notary1 STEP2. Survey ● Surveyor ● Prior survey 3 to 12 months
6 STEPS ● Office of Land Registry (DGI) ● Exploit ou sommation● New survey● Copy of new survey● Copy of receipt from DGI
3. Preparation of the bill of sale ● Notary ● Copy of new survey with the old property title in the margin and the DGI receipts 10 days to 5 months● Office of Land Registry (DGI) ● Mortgage situation of the property
● Evidence of payment of taxes on built properties (CFPB) and bills for utilities (DINEPA and EDH) for the past five years, including the current year.
6 STEPS
4. Registration, transcription, and payment of taxes Office of Land Registry (DGI) ● Bill of sale with all of the above documents in the annex 3 months to 1.5 years● Receipt of payment of taxes and fees from DGI
4 STEPS
Total: 17 steps 4 to 8 institutions and 2 professionals 14 to 16 documents 6 months to 2.5 years
Sources: Haiti Property Law Working Group; Haiti Land Transaction Manual.* Certain procedures can be done simultaneously.
Notary submits the deed of sale to the DGI for registration and transcription and pays the fees and taxes
Survey of the property and writing of survey documents by the surveyor.
● Preliminary sale agreement or promise of sale
Verification of title documents, compilation of documentation for the sale, writing of bill of sale, collection of fees and taxes by the notary.
● Ministries, consulate, general assembly, etc. (depending on legal status of seller or buyer)
Table 2. Summary of the Steps to a Sale by Genuine Deed
● Documentation providing the identity of the seller and the buyer and required permissions (4-6 docs.)
formed part of the informal system, and no formal title exists. Titling such property requires compiling oral histories and local documentation as to who have valid claims on a piece of land (Earth Institute, 2012), which given the principle that land be shared amongst descendents can involve a large number of people. Where title does already exist it can often be contested, given Haiti’s weak capacity to implement a complex process, but also because the legal structure facilitates such objections. For example, anyone (regardless of whether their name is on a title or not) can object to a land survey, halting it and sending it to a local judge to evaluate the claim. If a land title dispute is sent to the wider court system, the Organization of American States reports that the average length of conflict resolution is five years (OAS 2010). In recent projects undertaken by USAID, such conflicts have delayed projects by as much as two years, despite the fact that the underlying projects had high-level government backing (GAO 2013).
32. A modern cadastre system is essential to addressing these challenges. A functioning cadastre would delineate individual parcel boundaries across the whole country, eliminating the need for the archaic surveying system. The cadastre would also confirm land ownership, together with any associated rights or liens. A cadastre would reduce uncertainty over land rights, encourage investments, and reduce conflicts over land. In Haiti’s case, no cadastre has been completed since 1784 (CIAT 2015).
33. A wide range of government institutions participate in efforts to build a cadastre. The Office national du cadastre (ONACA) is an autonomous agency created in 1984 under the authority of the Ministry of Public Works, Transportation, and Communications (OAS 2010). ONACA is tasked with developing a land cadastre covering the whole country, although it made little progress prior to the earthquake (OAS 2010). In rural areas ONACA shares responsibility with the Institut National de la Réforme Agraire (INARA), part of the Ministry of Agriculture. The Centre National de l’Information Géospatiale (CNIGS), part of the Ministry of Planning, is tasked with using satellite imagery survey the territory of Haiti. The DGI, part of the Finance Ministry, is another key entity involved in the land cadastre, and it is tasked with scanning its written records into machine-readable form. The Comité Interministériel d’Aménagement du Territoire (CIAT), an inter-ministerial committee headed by the
HAITI
16 INTERNATIONAL MONETARY FUND
Prime Minister’s office, is tasked with coordinating the activities of the ministries above as well as other involved ministries (including the Ministries of the Interior and of the Environment; Haiti Property Law Working Group 2012). Finally, Haiti’s 140 communes administer state land at the local level, and are key participants as well.
34. The authorities’ plan is to first develop a non-legally binding national cadastre, starting in several targeted areas. The Plan Foncier de Base (basic land plan) aims to build a cadastre before pursuing legislation. Therefore, in its initial stages the cadastre would not issue titles or change the legal competencies of notaries and surveyors. The plan relies on several simultaneous efforts, including (i) developing high-precision of cartography of Haiti’s territory; (ii) digitization of the DGI archives as well as legal documents that are relevant to land ownership; and most crucially (iii) work on the ground. Staff from ONACA and INARA work together with locally-recruited staff and the public to more accurately delineate properties as well as to verify ownership. Within three years, the authorities plan to complete the initial cadastre in 8 rural communes and the city center of Port-au-Prince. Completion of a nationwide cadastre, and passage of a new land law, is envisaged in about ten years.
E. Overhauling the Electricity Sector: Lifting a Bottleneck to Growth
35. The electricity sector is a bottleneck to growth. High electricity prices hurt Haiti’s competitiveness, and an unreliable service (including frequent, long, and unplanned blackouts) force the private sector to generate its own electricity, which reinforces a vicious cycle of high cost and poor service, and prevents taking advantage of economies of scale in production.
36. The electricity sector is a drag to the budget and an important source of macroeconomic vulnerability. The deficit of the state-owned electricity company (EDH) was 2.5 percent of GDP in FY2014 (nearly 20 percent of tax revenues), and was financed by central government transfers and loans, and accumulation of arrears with independent power providers (IPPs). In particular, in FY2013–FY2014, on-budget transfers to EDH amounted to 0.7 percent of GDP, while off-budget transfers in the form of Petrocaribe-related flows reached 0.9 percent of GDP. Moreover, an IPP exercised guarantees against the central government for unpaid electricity sold to EDH for 0.3 percent of GDP. In addition, EDH has run arrears with IPPs, which in turn ran arrears on fuel purchases with BMPAD (an autonomous government agency that manages Petrocaribe flows).
37. The electricity sector has set back efforts at poverty reduction. Only about 30 percent of the population is connected to the grid, with access among the rural poor being even lower. Coverage has remained about constant for decades, as EDH’s unsustainable financial situation impeded investment in expanding the grid. High electricity generation costs push up the cost of providing water and sewage services, which are essential for poverty reduction. Large transfers to cover EDH’s deficit crowd out priority spending in education, health and security. High delinquency rates for large electricity consumers result in a more regressive distribution of income.
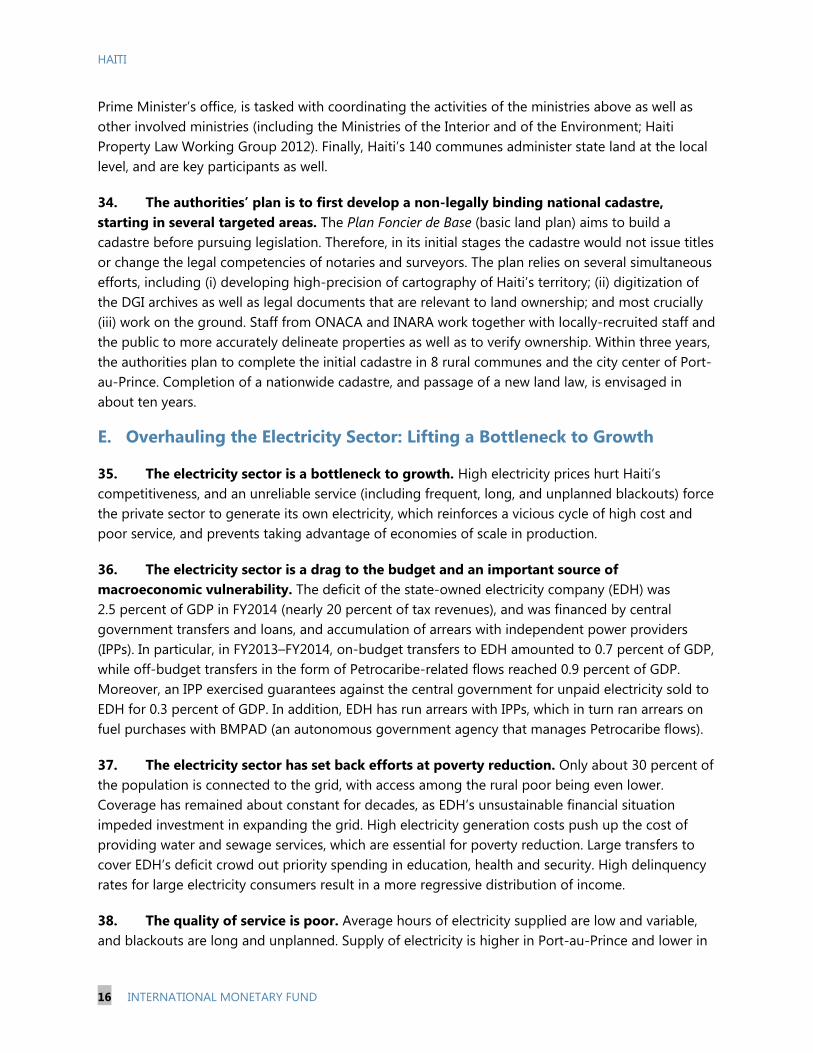
38. The quality of service is poor. Average hours of electricity supplied are low and variable, and blackouts are long and unplanned. Supply of electricity is higher in Port-au-Prince and lower in
HAITI
INTERNATIONAL MONETARY FUND 17
the provinces (Chart 8). Financial support from Venezuela (in the context of the Petrocaribe initiative) allowed increasing service hours and reducing blackouts during the last few years, but given lack of progress in reducing technical and non-technical losses, a reduction or a stop of these resources will likely result in longer blackouts.
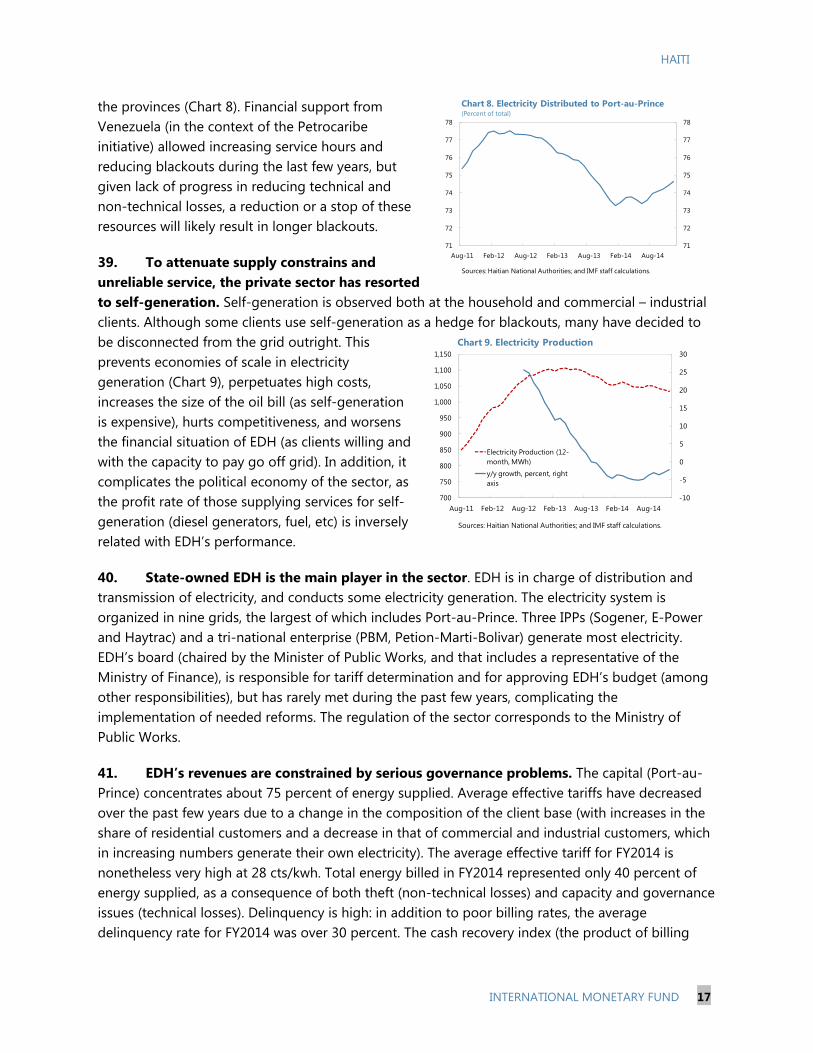
39. To attenuate supply constrains and unreliable service, the private sector has resorted to self-generation. Self-generation is observed both at the household and commercial – industrial clients. Although some clients use self-generation as a hedge for blackouts, many have decided to be disconnected from the grid outright. This prevents economies of scale in electricity generation (Chart 9), perpetuates high costs, increases the size of the oil bill (as self-generation is expensive), hurts competitiveness, and worsens the financial situation of EDH (as clients willing and with the capacity to pay go off grid). In addition, it complicates the political economy of the sector, as the profit rate of those supplying services for self-generation (diesel generators, fuel, etc) is inversely related with EDH’s performance.
40. State-owned EDH is the main player in the sector. EDH is in charge of distribution and transmission of electricity, and conducts some electricity generation. The electricity system is organized in nine grids, the largest of which includes Port-au-Prince. Three IPPs (Sogener, E-Power and Haytrac) and a tri-national enterprise (PBM, Petion-Marti-Bolivar) generate most electricity. EDH’s board (chaired by the Minister of Public Works, and that includes a representative of the Ministry of Finance), is responsible for tariff determination and for approving EDH’s budget (among other responsibilities), but has rarely met during the past few years, complicating the implementation of needed reforms. The regulation of the sector corresponds to the Ministry of Public Works.
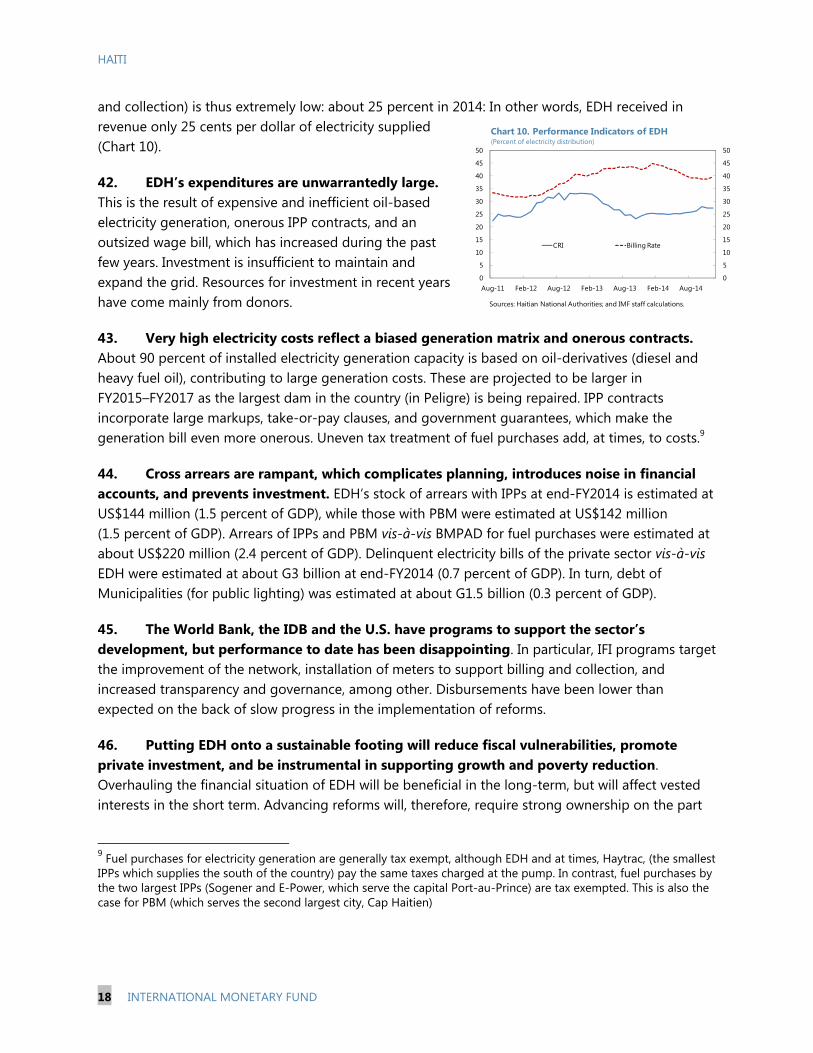
41. EDH’s revenues are constrained by serious governance problems. The capital (Port-au-Prince) concentrates about 75 percent of energy supplied. Average effective tariffs have decreased over the past few years due to a change in the composition of the client base (with increases in the share of residential customers and a decrease in that of commercial and industrial customers, which in increasing numbers generate their own electricity). The average effective tariff for FY2014 is nonetheless very high at 28 cts/kwh. Total energy billed in FY2014 represented only 40 percent of energy supplied, as a consequence of both theft (non-technical losses) and capacity and governance issues (technical losses). Delinquency is high: in addition to poor billing rates, the average delinquency rate for FY2014 was over 30 percent. The cash recovery index (the product of billing
-10
-5
0
5
10
15
20
25
30
700
750
800
850
900
950
1,000
1,050
1,100
1,150
Aug-11 Feb-12 Aug-12 Feb-13 Aug-13 Feb-14 Aug-14
Electricity Production (12-month, MWh)
y/y growth, percent, right axis
Chart 9. Electricity Production
Sources: Haitian National Authorities; and IMF staff calculations.
71
72
73
74
75
76
77
78
71
72
73
74
75
76
77
78
Aug-11 Feb-12 Aug-12 Feb-13 Aug-13 Feb-14 Aug-14
Sources: Haitian National Authorities; and IMF staff calculations.
Chart 8. Electricity Distributed to Port-au-Prince (Percent of total)
HAITI
18 INTERNATIONAL MONETARY FUND
and collection) is thus extremely low: about 25 percent in 2014: In other words, EDH received in revenue only 25 cents per dollar of electricity supplied (Chart 10).
42. EDH’s expenditures are unwarrantedly large. This is the result of expensive and inefficient oil-based electricity generation, onerous IPP contracts, and an outsized wage bill, which has increased during the past few years. Investment is insufficient to maintain and expand the grid. Resources for investment in recent years have come mainly from donors.
43. Very high electricity costs reflect a biased generation matrix and onerous contracts. About 90 percent of installed electricity generation capacity is based on oil-derivatives (diesel and heavy fuel oil), contributing to large generation costs. These are projected to be larger in FY2015–FY2017 as the largest dam in the country (in Peligre) is being repaired. IPP contracts incorporate large markups, take-or-pay clauses, and government guarantees, which make the generation bill even more onerous. Uneven tax treatment of fuel purchases add, at times, to costs.9
44. Cross arrears are rampant, which complicates planning, introduces noise in financial accounts, and prevents investment. EDH’s stock of arrears with IPPs at end-FY2014 is estimated at US$144 million (1.5 percent of GDP), while those with PBM were estimated at US$142 million (1.5 percent of GDP). Arrears of IPPs and PBM vis-à-vis BMPAD for fuel purchases were estimated at about US$220 million (2.4 percent of GDP). Delinquent electricity bills of the private sector vis-à-vis EDH were estimated at about G3 billion at end-FY2014 (0.7 percent of GDP). In turn, debt of Municipalities (for public lighting) was estimated at about G1.5 billion (0.3 percent of GDP).
45. The World Bank, the IDB and the U.S. have programs to support the sector’s development, but performance to date has been disappointing. In particular, IFI programs target the improvement of the network, installation of meters to support billing and collection, and increased transparency and governance, among other. Disbursements have been lower than expected on the back of slow progress in the implementation of reforms.
46. Putting EDH onto a sustainable footing will reduce fiscal vulnerabilities, promote private investment, and be instrumental in supporting growth and poverty reduction. Overhauling the financial situation of EDH will be beneficial in the long-term, but will affect vested interests in the short term. Advancing reforms will, therefore, require strong ownership on the part
9 Fuel purchases for electricity generation are generally tax exempt, although EDH and at times, Haytrac, (the smallest IPPs which supplies the south of the country) pay the same taxes charged at the pump. In contrast, fuel purchases by the two largest IPPs (Sogener and E-Power, which serve the capital Port-au-Prince) are tax exempted. This is also the case for PBM (which serves the second largest city, Cap Haitien)
0
5
10
15
20
25
30
35
40
45
50
0
5
10
15
20
25
30
35
40
45
50
Aug-11 Feb-12 Aug-12 Feb-13 Aug-13 Feb-14 Aug-14
CRI Billing Rate
Chart 10. Performance Indicators of EDH(Percent of electricity distribution)
Sources: Haitian National Authorities; and IMF staff calculations.
HAITI
INTERNATIONAL MONETARY FUND 19
of the authorities. A recent initiative in the form of a memorandum of understanding for the sector (the “Electricity Sector Protocol”) with the participation of the sector’s main stakeholders is a good step in that direction. Coordination of actions among all stakeholders (including donors) is essential for creating momentum and ensuring that reforms advance. A master plan for the sector would be instrumental in coordinating actions. The recent selection of Électricité de France (EDF) to draft such a plan is encouraging.
47. Strengthening EDH’s management and the sector’s regulation are priorities. EDH’s Board should meet regularly to ensure, inter alia, that budgets are approved on time, that EDH accounts are audited, and that financial audits are published. Tariffs should be reviewed to ensure that price signals are appropriate for an efficient utilization of electricity supply. This should stop the leakage of large clients in industrial and commercial sectors to off-grid self-generation. Penalties for non-payment should be reviewed and enforced. Inspections on clients and evaluations on the quality of service should be led by the regulatory body and proceed on a regular basis.
48. Improving the quality of service should result in an improvement in collection. Although service improvements can only proceed gradually, some actions can be taken in the short-term. On the latter, EDH can establish a calendar of outages by affected area, which should improve planning of demand by the private sector.
49. EDH’s revenues need to be swiftly increased. Efforts should be geared at increasing billing and collection, and tackling theft. The initial focus should be on the largest clients, who constitute the lion’s share of EDH’s revenues. Payment regularization plans should be considered for clients with large payments arrears, and to create a culture of payment for smaller clients (including by, e.g., requiring paid electricity bills in loan applications or for a driving license).
50. The government should remain current in its electricity bill. The minister of finance should centralize the payment of electricity bills for all central government institutions. The budget should provide for the cost of public lighting, as its cost is too large for municipalities to bear with their own resources. Municipalities should contribute to payments in relation with consumption and revenues.
51. EDH’s expenditures need to be controlled and reduced. The wage bill should be controlled. Electricity provision contracts need to be analyzed together with IPPs to attenuate wide dispersion of costs despite similar technologies. All contracts with IPPs need to be published to improve accountability and transparency. Use of different IPPs needs to proceed on a marginal cost rule. A competitive and transparent bidding process needs to be followed in all decisions impacting electricity costs, including on the construction of new generation facilities by EDH, and all documentation need to be published. Consolidating cross arrears will add clarity to financial statements of the sector’s participants.
52. Going forward, the electricity generation matrix needs to be diversified, and isolated grids interconnected. Haiti has potential for wind-based, hydro, and biomass-electricity generation. Overhauling EDH to make it financially sustainable, strengthening regulation and transparency
HAITI
20 INTERNATIONAL MONETARY FUND
should result in increased investment in lower-cost generation alternatives. Interconnecting the now isolated grids will create a national market, and will allow significant electricity cost reductions in the provinces.
HAITI
INTERNATIONAL MONETARY FUND 21
References Balassa, B. (1965). “Trade Liberalization and Revealed Comparative Advantage”, Manchester School of Economic and Social Studies. 33, 99 – 123, (Manchester, Manchester School of Economic and Social Studies)
Besley, T. and Ghatak M. (2009) “Property Rights and Economic Development.” In D. Rodrik and M. Rosenzweig, eds. “Handbook of Development Economics, 1st ed. Elsevier.
Better Work Haiti 2014, “Garment Industry, 8th Biannual Synthesis Report Under the HOPE II. Legislation”, Synthesis Report (ILO/IFC).
Comite Interministériel d’Aménagement du Territoire (CIAT, 2015) « Vers un Système Cadastral Adapte a Haiti Pour des Exploitations Agricoles Viables »
De Soto, Hernando (2000) “The Mystery of Capital: Why Capitalism Triumphs in the West and Fails Everywhere Else.” Basic Books, New York.
Dolisca et al (2007) “Land tenure, population pressure, and deforestation in Haiti: The case of Forêt des Pins Reserve.” Journal of Forest Economics Volume 13, Issue 5. Elsevier.
Earth Institute (2012) “Options for Land Tenure Dispute Management in Rural Haiti.” Columbia University.
Fernandez-Stark, K., Frederick, S. and Gereffi, G. (2011), “The Apparel Global Value Chain: Economic Upgrading and Workforce Development”, Center on globalization, governance and competitiveness Report, (North Carolina, Duke)
Frederick, S., Bair, J. and Gereffi, G. 2014, "Nicaragua and the Apparel Value Chain in the Americas", Center on globalization, governance and competitiveness Report, (North Carolina, Duke)
Gaulier, G. and S. Zignago (2010). “BACI: International Trade Database at the Product Level. The 1994-2007 Version”, (Paris, CEPII).
Government Accountability Office (GAO, 2013) “Haiti Reconstruction: USAID Infrastructure Projects Have Had Mixed Results and Face Sustainability Challenges.” Washington, DC. Haiti Property Law Working Group (2012) “Haiti Land Transaction Manual, Vol. 1: A how-to guide for the legal sale of property in Haiti. Available electronically at:
Hornbeck, J. F. 2010. “The Haitian Economy and the HOPE Act”, CRS Report for Congress (Washington, DC, Congressional Research Service)
HAITI
22 INTERNATIONAL MONETARY FUND
International Monetary Fund. (1983) “Haiti Staff Report for the 1983 Article IV Consultation”, (Washington D.C. International Monetary Fund)
International Monetary Fund. (1985) “Haiti Staff Report for the 1985 Article IV Consultation”, (Washington D.C. International Monetary Fund)
International Monetary Fund. (2014) “Sustaining long-run growth and macroeconomic stability in low-income countries—the role of structural transformation and diversification”, (Washington D.C. International Monetary Fund)
International Monetary Fund. (2014b) “Is it time for an infrastructure push? The macroeconomic effects of public investment”, World Economic Outlook, Autumn 2014. Chapter 3 (Washington D.C. International Monetary Fund)
Lundahl, Mats (2013), “The Political Economy of Disaster” (London, Routledge)
Organization of American States (2010) “Modernization of Cadastres and Land Rights Infrastructure in Haiti.” Washington, DC.
OECD. (2014), “Interconnected Economies: Benefitting from Global Value Chains”, Synthesis report (Paris, OECD)
Staritz, C. 2011 “Making the Cut? Low-Income Countries and the Global Clothing Value Chain in a Post-Quota and Post-Crisis World”, World Bank Study, (Washington DC, World Bank)
Smucker, Glenn et al (2000) “Land Tenure and the Adoption of Agricultural Technology in Haiti.” CAPRi Working Paper No. 7. Washington, DC.
Staritz. C. and Morris, M. 2013."Local embeddedness, upgrading and skill development: global value chains and foreign direct investment in Lesotho’s apparel industry," Brooks World Poverty Institute Working Paper Series (Manchester, The University of Manchester)
Verreydt, E. (2001), “Trade Liberalisation in Haiti”, IMF Staff Country report No 01/04 (Washington D.C. International Monetary Fund).
World Bank. (2005). “Economic Growth in the 1990s: Learning from a Decade of Reform”, Chapter 5 (Washington, D.C.,World Bank).
World Bank. (2014), “Reflections for evidence-based policy making”, (Washington, DC: World Bank Group)
World Bank. 2014. “Enhancing Competitiveness in an Uncertain World”, East Asia and Pacific Economic Update (October), (Washington, DC, World Bank).
HAITI
INTERNATIONAL MONETARY FUND 23
World Bank (2014). Doing Business 2015: Going Beyond Efficiency. Washington, DC: World Bank. DOI: 10.1596/978-1-4648-0351-2. License: Creative Commons Attribution CC BY 3.0 IGO World Trade Organisation. (2011), “Trade profiles 2011”, WTO Publications (Geneva,WTO)
HAITI
24 INTERNATIONAL MONETARY FUND
PUBLIC EXPENDITURE IN HAITI: BALANCING HUMAN CAPITAL AND INFRASTRUCTURE FORMATION1
A. Introduction
1. Capital spending increases underpinned Haiti’s public expenditure trends in the last decade. Despite relatively high and sustained levels in public investment, Haiti’s performance compares negatively with that of the region and low-income countries (LICs) both in terms of translating resources into better infrastructure and with respect to management practices.
2. Spending on education increased recently and progress was made in achieving higher enrollment rates. The strong focus on increasing primary enrollment rates helped to bring Haiti closer to universal primary school enrollment (88 percent). However challenges remain in closing the gap with the region in terms of increasing average years of schooling, increasing enrollment rates for secondary and tertiary education and enhancing the quality of the education system.
3. Rebalancing public expenditure to support both human capital formation and better infrastructure will improve the growth environment. The combination of high, but inefficient, capital spending calls for enhancing capital efficiency, rather than increasing spending. The declining school-age population relative to the working population provides room to raise enrollment rates, but additional fiscal space is needed to increase spending per student. Reallocating resources towards education while enhancing its quality and accessibility would support human capital formation, but would also increase the productivity of the capital stock. This should foster long term growth.
B. Public Expenditure Trends, 2004–2014
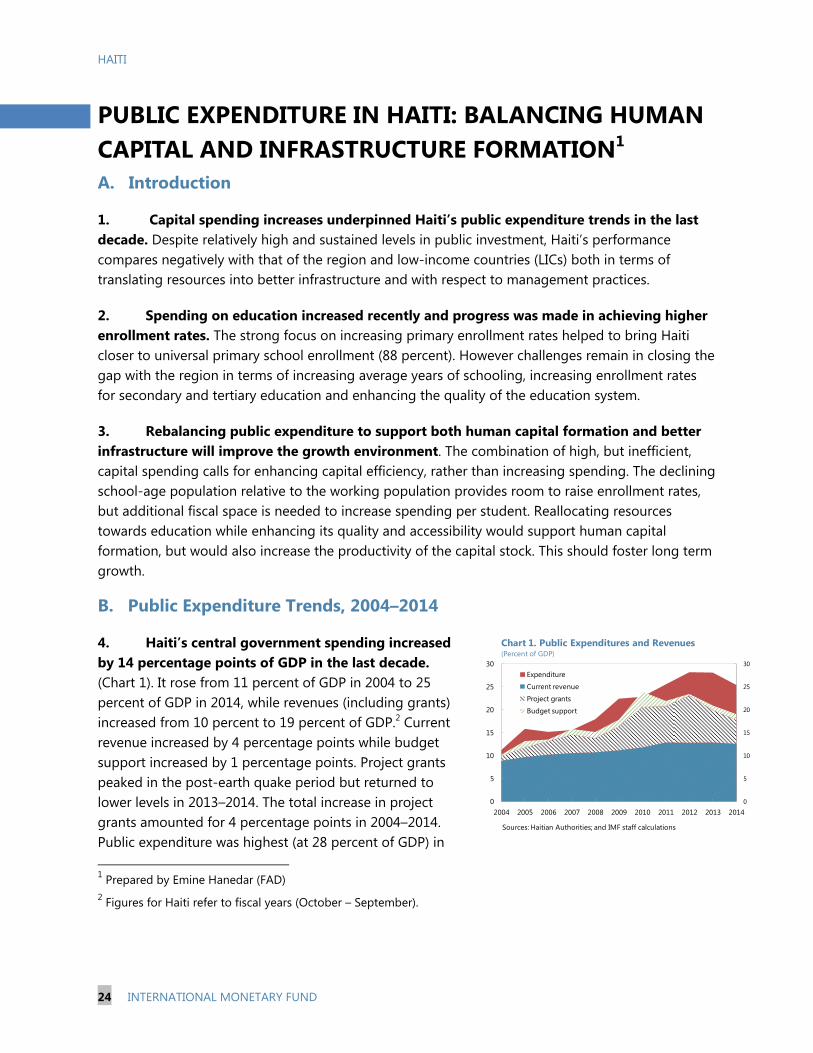
4. Haiti’s central government spending increased by 14 percentage points of GDP in the last decade. (Chart 1). It rose from 11 percent of GDP in 2004 to 25 percent of GDP in 2014, while revenues (including grants) increased from 10 percent to 19 percent of GDP.2 Current revenue increased by 4 percentage points while budget support increased by 1 percentage points. Project grants peaked in the post-earth quake period but returned to lower levels in 2013–2014. The total increase in project grants amounted for 4 percentage points in 2004–2014. Public expenditure was highest (at 28 percent of GDP) in 1 Prepared by Emine Hanedar (FAD) 2 Figures for Haiti refer to fiscal years (October – September).
Sources: Haitian Authorities; and IMF staff calculations
Chart 1. Public Expenditures and Revenues(Percent of GDP)
HAITI
INTERNATIONAL MONETARY FUND 25
2012–2013, as post-earthquake reconstruction accelerated. The decrease in public spending in 2014 suggests a return to more sustainable levels in the years ahead.
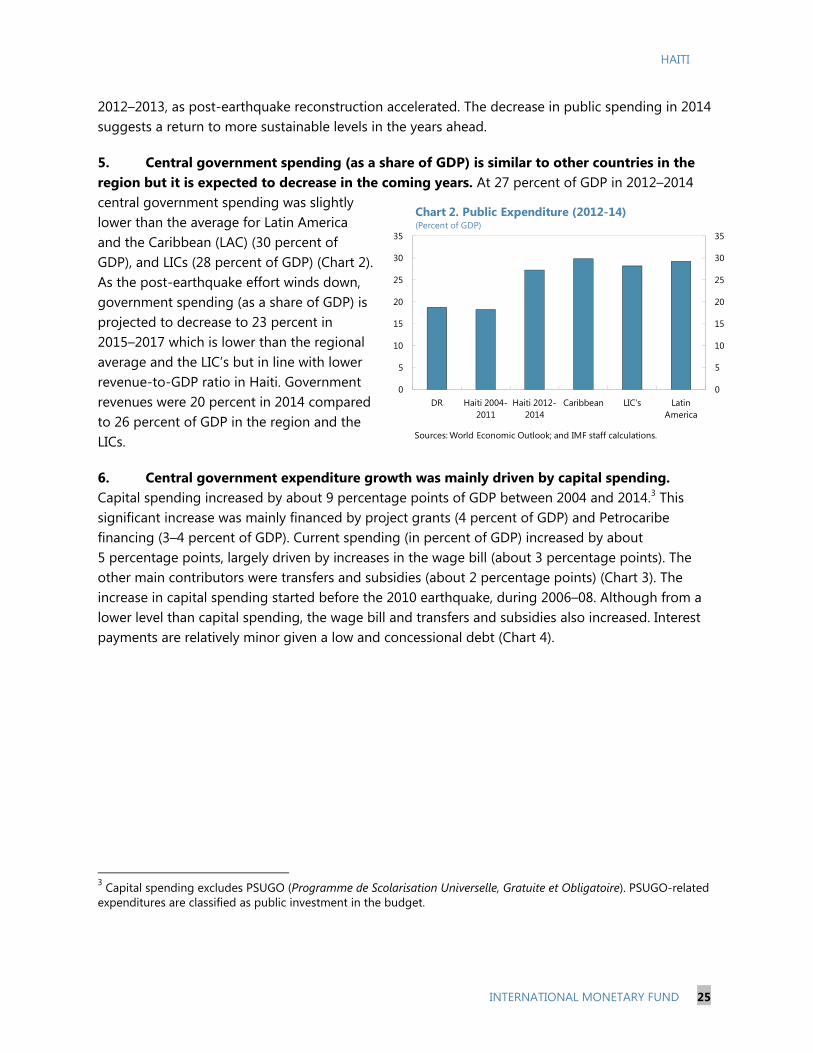
5. Central government spending (as a share of GDP) is similar to other countries in the region but it is expected to decrease in the coming years. At 27 percent of GDP in 2012–2014 central government spending was slightly lower than the average for Latin America and the Caribbean (LAC) (30 percent of GDP), and LICs (28 percent of GDP) (Chart 2). As the post-earthquake effort winds down, government spending (as a share of GDP) is projected to decrease to 23 percent in 2015–2017 which is lower than the regional average and the LIC’s but in line with lower revenue-to-GDP ratio in Haiti. Government revenues were 20 percent in 2014 compared to 26 percent of GDP in the region and the LICs.
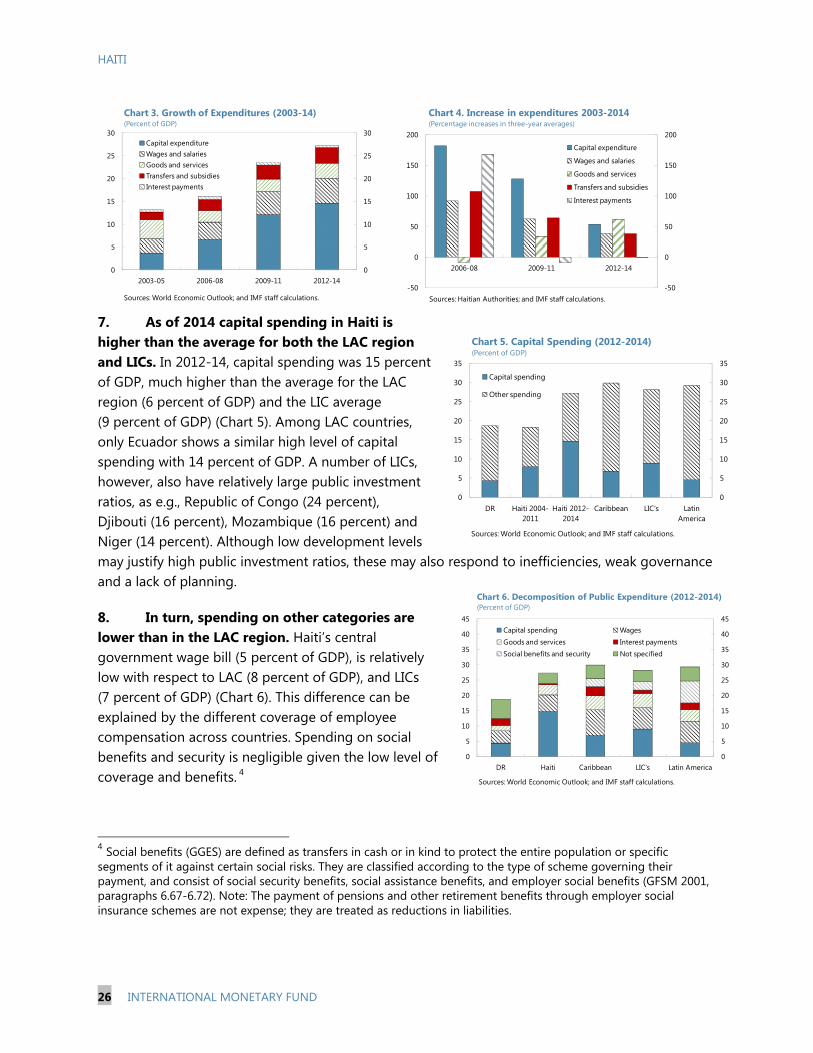
6. Central government expenditure growth was mainly driven by capital spending. Capital spending increased by about 9 percentage points of GDP between 2004 and 2014.3 This significant increase was mainly financed by project grants (4 percent of GDP) and Petrocaribe financing (3–4 percent of GDP). Current spending (in percent of GDP) increased by about 5 percentage points, largely driven by increases in the wage bill (about 3 percentage points). The other main contributors were transfers and subsidies (about 2 percentage points) (Chart 3). The increase in capital spending started before the 2010 earthquake, during 2006–08. Although from a lower level than capital spending, the wage bill and transfers and subsidies also increased. Interest payments are relatively minor given a low and concessional debt (Chart 4).
3 Capital spending excludes PSUGO (Programme de Scolarisation Universelle, Gratuite et Obligatoire). PSUGO-related expenditures are classified as public investment in the budget.
0
5
10
15
20
25
30
35
0
5
10
15
20
25
30
35
DR Haiti 2004-2011
Haiti 2012-2014
Caribbean LIC's Latin America
Chart 2. Public Expenditure (2012-14)(Percent of GDP)
Sources: World Economic Outlook; and IMF staff calculations.
HAITI
26 INTERNATIONAL MONETARY FUND
7. As of 2014 capital spending in Haiti is higher than the average for both the LAC region and LICs. In 2012-14, capital spending was 15 percent of GDP, much higher than the average for the LAC region (6 percent of GDP) and the LIC average (9 percent of GDP) (Chart 5). Among LAC countries, only Ecuador shows a similar high level of capital spending with 14 percent of GDP. A number of LICs, however, also have relatively large public investment ratios, as e.g., Republic of Congo (24 percent), Djibouti (16 percent), Mozambique (16 percent) and Niger (14 percent). Although low development levels may justify high public investment ratios, these may also respond to inefficiencies, weak governance and a lack of planning.
8. In turn, spending on other categories are lower than in the LAC region. Haiti’s central government wage bill (5 percent of GDP), is relatively low with respect to LAC (8 percent of GDP), and LICs (7 percent of GDP) (Chart 6). This difference can be explained by the different coverage of employee compensation across countries. Spending on social benefits and security is negligible given the low level of coverage and benefits. 4
4 Social benefits (GGES) are defined as transfers in cash or in kind to protect the entire population or specific segments of it against certain social risks. They are classified according to the type of scheme governing their payment, and consist of social security benefits, social assistance benefits, and employer social benefits (GFSM 2001, paragraphs 6.67-6.72). Note: The payment of pensions and other retirement benefits through employer social insurance schemes are not expense; they are treated as reductions in liabilities.
0
5
10
15
20
25
30
0
5
10
15
20
25
30
2003-05 2006-08 2009-11 2012-14
Capital expenditureWages and salariesGoods and servicesTransfers and subsidiesInterest payments
Sources: World Economic Outlook; and IMF staff calculations.
Chart 3. Growth of Expenditures (2003-14)(Percent of GDP)
-50
0
50
100
150
200
-50
0
50
100
150
200
2006-08 2009-11 2012-14
Capital expenditure
Wages and salaries
Goods and services
Transfers and subsidies
Interest payments
Chart 4. Increase in expenditures 2003-2014(Percentage increases in three-year averages)
Sources: Haitian Authorities; and IMF staff calculations.
0
5
10
15
20
25
30
35
40
45
0
5
10
15
20
25
30
35
40
45
DR Haiti Caribbean LIC's Latin America
Capital spending Wages
Goods and services Interest paymentsSocial benefits and security Not specified
Chart 6. Decomposition of Public Expenditure (2012-2014)(Percent of GDP)
Sources: World Economic Outlook; and IMF staff calculations.
0
5
10
15
20
25
30
35
0
5
10
15
20
25
30
35
DR Haiti 2004-2011
Haiti 2012-2014
Caribbean LIC's Latin America
Capital spending
Other spending
Chart 5. Capital Spending (2012-2014)(Percent of GDP)
Sources: World Economic Outlook; and IMF staff calculations.
HAITI
INTERNATIONAL MONETARY FUND 27
9. However, spending in education increased in the last few years, due mainly to PSUGO, and is similar to the LAC average. Spending on education was 4.2 percent of GDP in 2014 and is projected to increase to 4.8 percent of GDP in 2015 (MENFP 2015). Central government spending was comparable with the LAC average in 2013 (4.7 percent of GDP), slightly lower than the average for Sub-Saharan Africa (5 percent of GDP) and higher than that in MENA (3.8 percent of GDP) (World Bank 2013). Half of the education spending in Haiti is domestically financed and half foreign financed. The government launched in 2011–12 the PSUGO (Programme de Scolarisation Universelle, Gratuite et Obligatoire). The program aims providing free basic education to children from poor households. PSUGO spending amounted for 0.5 percent of GDP during 2012–2014 and is budgeted to increase to 1.1 percent of GDP in 2015. PSUGO is financed by the fees collected on international calls and remittances, and to a lower extent through the budget.5
C. Efficiency of Capital and Education Spending: Some Indicators
10. The efficiency of Haiti’s public investment spending appears low, according to a number of metrics. An efficiency frontier analysis is used to evaluate capital spending efficiency (IMF 2014). This method assesses efficiency by the extent to which monetary inputs are translated into infrastructure outputs. The methodology reflects how far a country is from the production possibility frontier which is determined by the best performers worldwide. The used inputs are the real public capital stock per capita in purchasing power parity (PPP). The infrastructure output is estimated using the infrastructure component of the Global Competitiveness Indicator (GCI), which considers, inter alia, the overall quality of infrastructure, of roads, of (air)ports, of electricity supply, and of (mobile) telephone lines. The efficiency frontier analysis uses two metrics to evaluate capital spending efficiency: the “Partial Free Disposal Hull” (PFDH) and the “Data envelopment Analysis” (DEA). The main difference between the PFDH and DEA metrics is that the first measure benchmarks against a group of peers and re-samples to improve robustness and reduce sensitivity to outliers while the second is more sensitive to the presence of outliers and could overestimate inefficiencies by benchmarking a country relative to only a few best performers in the sample. According to both measures capital spending efficiency in Haiti is significantly lower than the average for the LAC region and LICs. In particular, Haiti’s PFDH score (at 0.5 on 0.5–1.2 range) is among the lowest in the world (Table 1).
5 See the Selected Issues Paper “Haiti’s Public Sector: Explaining the ECF’s Fiscal Target” for a comprehensive discussion of the PSUGO fund and its resources.
PFDH DEAHaiti 0.5 0.5LAC 0.9 0.7LIC's 0.9 0.8
Source: IMF (2014)
Table 1. Efficiency Scores
HAITI
28 INTERNATIONAL MONETARY FUND
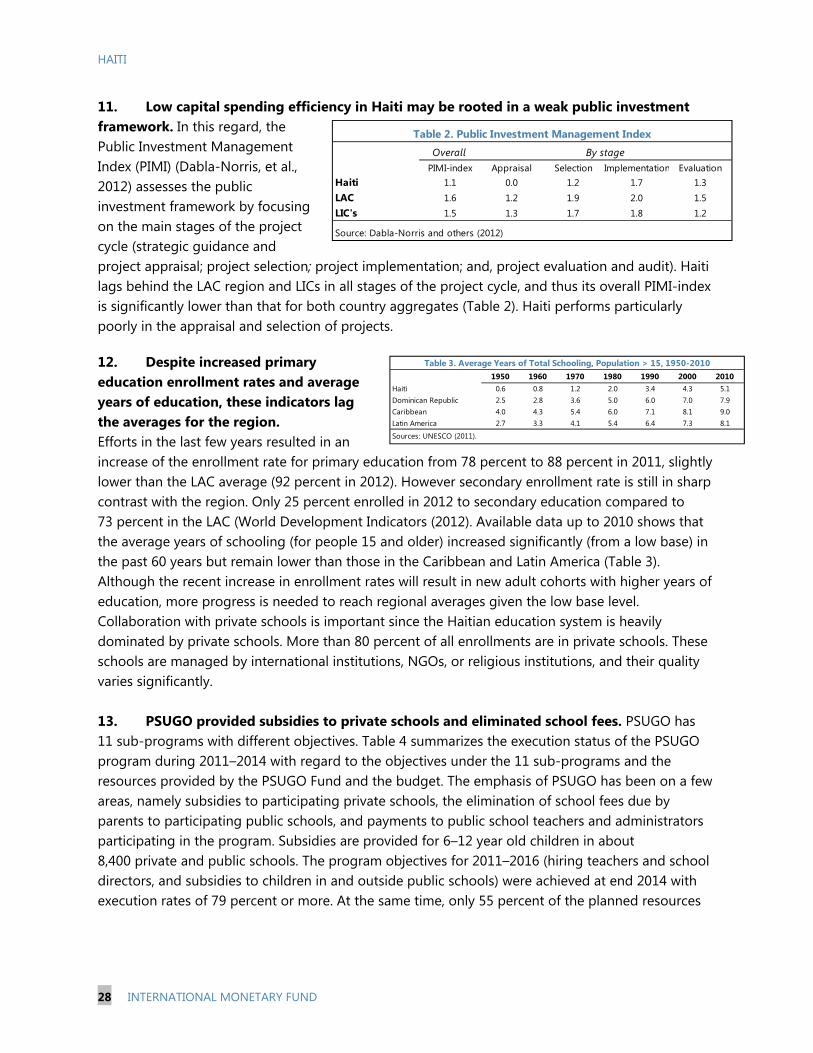
11. Low capital spending efficiency in Haiti may be rooted in a weak public investment framework. In this regard, the Public Investment Management Index (PIMI) (Dabla-Norris, et al., 2012) assesses the public investment framework by focusing on the main stages of the project cycle (strategic guidance and project appraisal; project selection; project implementation; and, project evaluation and audit). Haiti lags behind the LAC region and LICs in all stages of the project cycle, and thus its overall PIMI-index is significantly lower than that for both country aggregates (Table 2). Haiti performs particularly poorly in the appraisal and selection of projects.
12. Despite increased primary education enrollment rates and average years of education, these indicators lag the averages for the region.
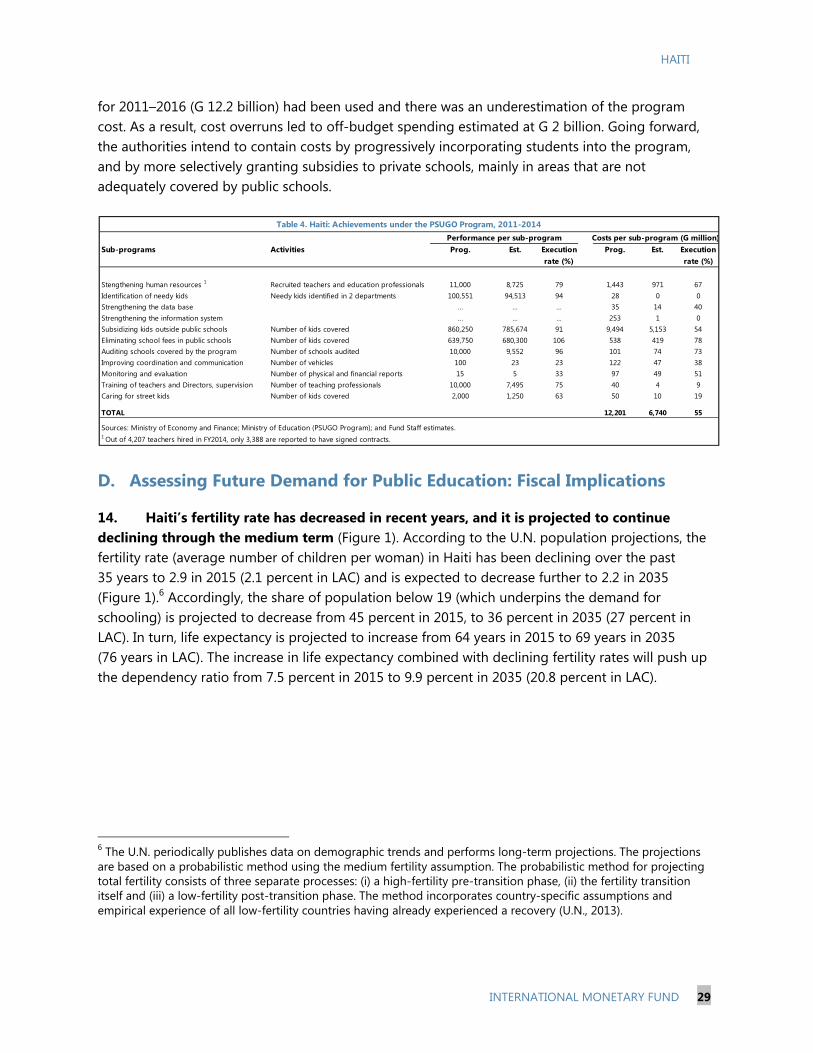
Efforts in the last few years resulted in an increase of the enrollment rate for primary education from 78 percent to 88 percent in 2011, slightly lower than the LAC average (92 percent in 2012). However secondary enrollment rate is still in sharp contrast with the region. Only 25 percent enrolled in 2012 to secondary education compared to 73 percent in the LAC (World Development Indicators (2012). Available data up to 2010 shows that the average years of schooling (for people 15 and older) increased significantly (from a low base) in the past 60 years but remain lower than those in the Caribbean and Latin America (Table 3). Although the recent increase in enrollment rates will result in new adult cohorts with higher years of education, more progress is needed to reach regional averages given the low base level. Collaboration with private schools is important since the Haitian education system is heavily dominated by private schools. More than 80 percent of all enrollments are in private schools. These schools are managed by international institutions, NGOs, or religious institutions, and their quality varies significantly. 13. PSUGO provided subsidies to private schools and eliminated school fees. PSUGO has 11 sub-programs with different objectives. Table 4 summarizes the execution status of the PSUGO program during 2011–2014 with regard to the objectives under the 11 sub-programs and the resources provided by the PSUGO Fund and the budget. The emphasis of PSUGO has been on a few areas, namely subsidies to participating private schools, the elimination of school fees due by parents to participating public schools, and payments to public school teachers and administrators participating in the program. Subsidies are provided for 6–12 year old children in about 8,400 private and public schools. The program objectives for 2011–2016 (hiring teachers and school directors, and subsidies to children in and outside public schools) were achieved at end 2014 with execution rates of 79 percent or more. At the same time, only 55 percent of the planned resources
Table 3. Average Years of Total Schooling, Population > 15, 1950-2010
HAITI
INTERNATIONAL MONETARY FUND 29
for 2011–2016 (G 12.2 billion) had been used and there was an underestimation of the program cost. As a result, cost overruns led to off-budget spending estimated at G 2 billion. Going forward, the authorities intend to contain costs by progressively incorporating students into the program, and by more selectively granting subsidies to private schools, mainly in areas that are not adequately covered by public schools.
D. Assessing Future Demand for Public Education: Fiscal Implications
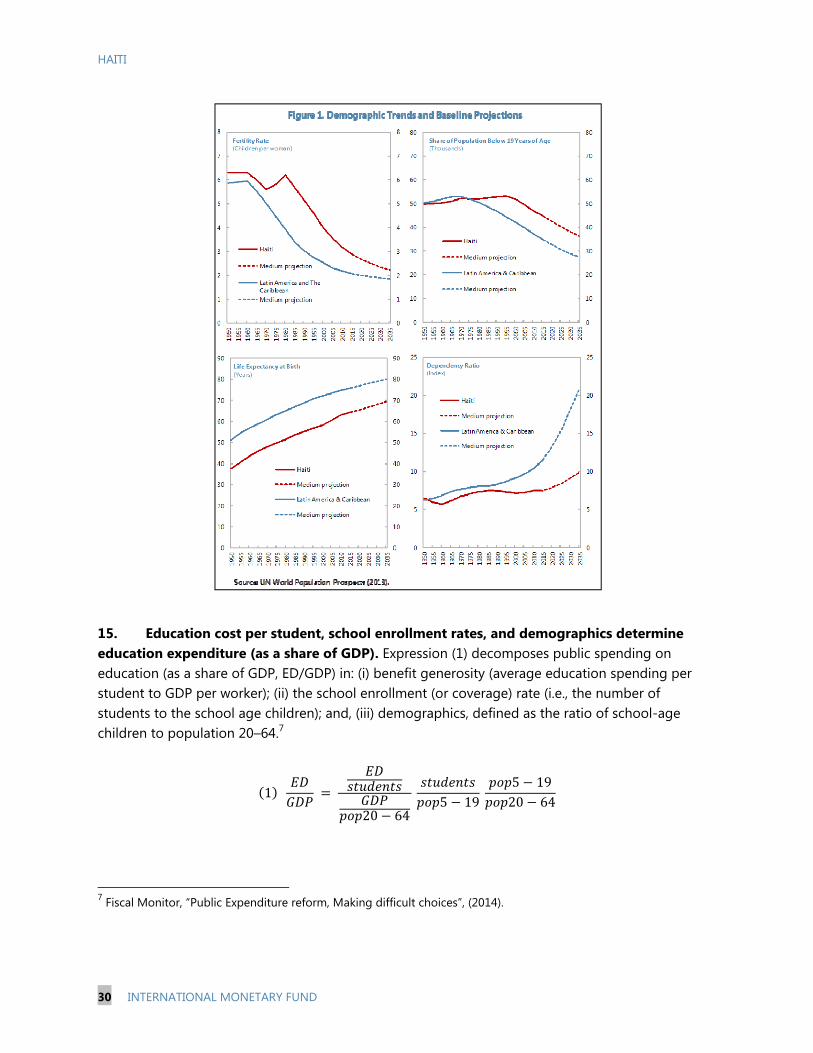
14. Haiti’s fertility rate has decreased in recent years, and it is projected to continue declining through the medium term (Figure 1). According to the U.N. population projections, the fertility rate (average number of children per woman) in Haiti has been declining over the past 35 years to 2.9 in 2015 (2.1 percent in LAC) and is expected to decrease further to 2.2 in 2035 (Figure 1).6 Accordingly, the share of population below 19 (which underpins the demand for schooling) is projected to decrease from 45 percent in 2015, to 36 percent in 2035 (27 percent in LAC). In turn, life expectancy is projected to increase from 64 years in 2015 to 69 years in 2035 (76 years in LAC). The increase in life expectancy combined with declining fertility rates will push up the dependency ratio from 7.5 percent in 2015 to 9.9 percent in 2035 (20.8 percent in LAC).
6 The U.N. periodically publishes data on demographic trends and performs long-term projections. The projections are based on a probabilistic method using the medium fertility assumption. The probabilistic method for projecting total fertility consists of three separate processes: (i) a high-fertility pre-transition phase, (ii) the fertility transition itself and (iii) a low-fertility post-transition phase. The method incorporates country-specific assumptions and empirical experience of all low-fertility countries having already experienced a recovery (U.N., 2013).
Performance per sub-program Costs per sub-program (G million)Sub-programs Activities Prog. Est. Execution Prog. Est. Execution
rate (%) rate (%)
Stengthening human resources 1 Recruited teachers and education professionals 11,000 8,725 79 1,443 971 67Identification of needy kids Needy kids identified in 2 departments 100,551 94,513 94 28 0 0Strengthening the data base … … … 35 14 40Strengthening the information system … … … 253 1 0Subsidizing kids outside public schools Number of kids covered 860,250 785,674 91 9,494 5,153 54Eliminating school fees in public schools Number of kids covered 639,750 680,300 106 538 419 78Auditing schools covered by the program Number of schools audited 10,000 9,552 96 101 74 73Improving coordination and communication Number of vehicles 100 23 23 122 47 38Monitoring and evaluation Number of physical and financial reports 15 5 33 97 49 51Training of teachers and Directors, supervision Number of teaching professionals 10,000 7,495 75 40 4 9Caring for street kids Number of kids covered 2,000 1,250 63 50 10 19
TOTAL 12,201 6,740 55
Sources: Ministry of Economy and Finance; Ministry of Education (PSUGO Program); and Fund Staff estimates.1 Out of 4,207 teachers hired in FY2014, only 3,388 are reported to have signed contracts.
Table 4. Haiti: Achievements under the PSUGO Program, 2011-2014
HAITI
30 INTERNATIONAL MONETARY FUND
15. Education cost per student, school enrollment rates, and demographics determine education expenditure (as a share of GDP). Expression (1) decomposes public spending on education (as a share of GDP, ED/GDP) in: (i) benefit generosity (average education spending per student to GDP per worker); (ii) the school enrollment (or coverage) rate (i.e., the number of students to the school age children); and, (iii) demographics, defined as the ratio of school-age children to population 20–64.7
1
20 64
5 19
5 1920 64
7 Fiscal Monitor, “Public Expenditure reform, Making difficult choices”, (2014).
HAITI
INTERNATIONAL MONETARY FUND 31
16. Projected demographic trends provide scope to increase enrollment rates. A projection assuming unchanged benefit and coverage ratios, and the U.N. “medium” fertility rates, is consistent with education spending (as a share of GDP) decreasing to 3.5 percent in 2035. This result would be driven by the projected decrease in the ratio of school-aged population to the labor force. A gradual increase in enrollment rates, in particular secondary enrollment rate, to catch up with the regional average (in 2015) would imply an increase in education spending to 4.9 percent of GDP in 2035. The increase in education spending needed to increase enrollment rates is sensitive to fertility rates. Using the U.N. “low” fertility rates would require a level of education spending (as a share of GDP) of 4.1 percent of GDP while U.N.’s “high” fertility rate would result in a significantly higher education spending ratio, of 5.7 percent of GDP.
17. Increasing benefits would require additional fiscal space. The analysis above isolates the implications of demographics and coverage on education spending (as percent of GDP). The fiscal space to finance increases in education will be larger, if in addition to increases in enrollment rates, there is an increase per-student benefits. Increasing per-student benefits by, e.g. 20 percent, would require additional fiscal space of about 1 percent of GDP.
E. Concluding Thoughts
18. Haiti should enhance the efficiency of capital spending rather than in increase its level. While high infrastructure-related spending was needed in the aftermath of the earthquake, capital spending appears to be crowding out other, equally needed, spending. In addition, a number of metrics show that the efficiency of public investment in Haiti remains low when compared to the region and LICs. Thus, increasing the efficiency of capital spending by strengthening public investment institutions should now be prioritized. Transparency of budget execution, openness of the procurement process and an efficient cash management system are critical to ensure stability of public investment and reduce opportunities in rent seeking. More transparency and accountability in project management, monitoring and evaluation will strengthen incentives to deliver on time and on budget and increase the integrity in the use of public resources (IMF 2015).
19. Investing in human capital through better education is essential to foster sustainable economic growth and social cohesion. A strong commitment to education is necessary. Pursuing higher enrollment rates, including gradually increasing secondary school attendance, should be
HAITI
32 INTERNATIONAL MONETARY FUND
accompanied with increases in the quality of the education system to ensure learning. Recent research has shown that economic growth is not only responsive to average years of schooling, but on measures of the quality of education (Hanushek and Woessman 2012).8 Qualified teachers are an important determinant of cognitive achievement (Wold Bank, 2014)9. PSUGO is investing in training of teachers and directors. On the institutional front, the government should have a strong role in regulating and monitoring the quality of the education system, including the private schools. Spending needs to be allocated transparently and public and private schools should coordinate policies and approaches. Improving education statistics is vital for monitoring developments and evaluating outcomes. Together with the implementation of other institutional reforms, the accumulation of human capital should make Haiti more attractive for investors and promote employment and social cohesion.
8 The authors use cross-country growth regressions to assess the relationship between educational achievement and GDP growth. The results show a close relationship between educational achievement and GDP growth that is remarkably stable across countries, time period and sensitivity analyses of specification. 9 Other important factors are nutrition, health, cognitive and social-emotional development in the early years of life.
HAITI
INTERNATIONAL MONETARY FUND 33
References Albino-War, M., S. Cerovic, F. Grigoli, J. Flores, J. Kapsoli, H. Qu, Y. Said, B. Shukurov, M. Sommer, and S. Yoon, 2014, “Making the Most of Public Investment in MENA and CCA Oil-Exporting Countries,” IMF Staff Discussion Note (Washington: International Monetary Fund). Bruns, B and J. Luque, 2014, Great Teachers: How to Raise Student Learning In Latin America and the Caribbean (Washington: World Bank Group). Dabla-Norris, E., J. Brumby, A. Kyobe, Z. Mills, and C. Papageorgiou, 2012, “Investing in Public Investment: An Index of Public Investment Efficiency,” Journal of Economic Growth, Vol. 17, pp. 201.
Hanushek E., and L. Woessmann, 2012, “Do Better Schools lead to more growth? Cognitive Skills, economic outcomes, and causation,” Journal of Economic Growth, 17 (4) (2012), pp. 267–321 International Monetary Fund, 2014, “Fiscal Monitor: Public Expenditure Reform—Making Difficult Choices,” (Washington). http://www.imf.org/external/pubs/ft/fm/2014/01/fmindex.htm.
————, forthcoming, Making Public Investment More Efficient, Board Paper (Washington).
Ministère de l'Education nationale et de la Formation professionnelle (MENFP), 2013, Budget général de la république exercice 2013-2014 (Port au Prince : MENFP). Ministère de l'Education nationale et de la Formation professionnelle (MENFP), 2014, Budget rectificatif 2014-2015 (Port au Prince : MENFP). Ministère de l'Education nationale et de la Formation professionnelle (MENFP), 2014, Budget général de la république exercice 2014-2015 (Port au Prince : MENFP). Ministry for Education and Professional Formation (MENFP). 2007. “La Stratégie National d’Action pour l’Education pour Tous.” Port-au-Prince. United Nations, 2013, World Population Prospects: The 2012 Revision, DVD Edition, Department of Economic and Social Affairs, Population Division.
Wolff, L., 2008, Education in Haiti: The Way Forward (Washington: OPREAL). World Bank, 2015, Haiti: Can Non-Public Schools Fill the Gap for Poor Children? (Washington: World Bank).
HAITI
34 INTERNATIONAL MONETARY FUND
MONETARY POLICY AND FINANCIAL INTERMEDIATION IN HAITI1 A. Introduction
1. Monetary policy in Haiti is geared towards containing inflation, but the transmission mechanism is weak and assessing the policy stance is at times challenging. Containing inflation in a context where tradable goods are a large share of the CPI necessitates a moderate path for exchange rate depreciation. The central bank (BRH) has strived to achieve this goal through a mix of exchange rate market interventions and open market operations. As in many other low-income countries, the BRH also resorted to changes in legal reserve requirements to conduct monetary policy, which are transmitted to aggregate demand through the credit channel. While monetary policy has been broadly successful in maintaining price stability, policy formulation is hampered by data gaps, transmission is complicated by Haiti’s vulnerability to shocks and by the shallow domestic market, and assessing the policy stance is at times difficult. The effectiveness of monetary policy in ensuring a moderate inflation rate depends on the implementation of a consistent policy mix, most importantly, a sustainable fiscal policy. This should anchor exchange rate depreciation expectations in the medium term. Against that backdrop, monetary policy could be strengthened by allowing additional exchange rate flexibility to respond to shocks, promoting financial deepening to better transmit policy changes onto interest rates, and by strengthened communication on the underlying policy stance.
2. Financial intermediation in Haiti is low and concentrated, and greater competition and an improved regulatory framework is needed to promote financial inclusion. The financial system is dominated by a few local banks, and cooperatives and microfinance institutions are relatively small and still mostly unregulated. Credit is low and heavily concentrated, in part reflecting lack of information on creditworthiness and difficulties in collecting on debt. A credit bureau was established to improve information-sharing on the creditworthiness of individual borrowers, and in time should support credit access to first-time borrowers. The authorities have recently launched a financial inclusion strategy, which aims to raise the share of adults with access to formal financial services. While efforts to direct more payments through the financial system and an improved regulatory environment will help grow the sector, broad financial inclusion will require reforms to promote the use of collateral, including of land.
B. Monetary Policy
3. The BRH’s objectives are to ensure a low and stable rate of inflation and to preserve the external value of the Gourde. The BRH does not have an objective for the exchange rate, but in recent years has used a combination of monetary policy tools to limit depreciation to the 1 Prepared by Lawrence Norton and Gabriel Di Bella (WHD)
HAITI
INTERNATIONAL MONETARY FUND 35
3–4 percent range (Chart 1). Central bank autonomy is set out in law, and the BRH pursues its goals with operational independence that is respected by the fiscal authorities.
4. Inflation is heavily influenced by (tradable) food and energy staples. Inflation, as measured by the consumer price index (CPI), is heavily weighted towards a few imported food and energy staples. Food accounts for half of the CPI basket, and food and energy together account for two-thirds. As imports of food and energy are about 20 percent of GDP, the pass-through from exchange rate depreciation to inflation is high.
5. The BRH relies mostly on changes in legal reserve requirements to conduct monetary policy. Like many low-income countries (LICs) that have shallow domestic financial markets, the BRH primarily manages liquidity through reserve requirements, which in Haiti are currently 38 percent and 41 percent on gourde and dollar deposits, respectively (IMF 2012). The BRH also conducts open market operations through the issuance of central bank bills, and uses the interest rate on its bills as a signal of the monetary policy stance. The BRH also intervenes periodically in the foreign exchange market, and both sells and buys U.S. dollars. The strong inflows after the earthquake pushed the BRH to intervene in the market to buy foreign exchange (to avoid an appreciation of the Gourde), while the absorption of these flows resulted in the BRH mainly selling US$ during the past couple of years (Chart 2).
6. Monetary transmission is primarily effected through the credit and exchange rate channels. Reserve requirements and open market operations adjust the level of gourde liquidity, impacting the level of banks’ excess reserves. These moves also impact the exchange rate channel, as excess gourde liquidity generates foreign exchange pressures (through credit growth), although the demand for foreign currency also responds to changes in expectations (including political uncertainty). A high level of dollarization (by introducing a foreign currency component into the money supply), is another complicating factor. The interest rate and asset channels are weak in Haiti, as it is in most LICs with shallow domestic financial markets (Mishra and Montiel, 2012). Changes in the interest rate on BRH bills do not have a significant impact on other interest rates in the economy. Both market lending and deposit rates have remained fairly steady in recent years (see Section B).
Chart 2. Net BRH FX Intervention(Millions of US$, cumulative since October 2010)
Sources: BRH Aide Memoire; and IMF staff calculations.
Net sales
Net purchases
HAITI
36 INTERNATIONAL MONETARY FUND
7. The implementation of monetary policy is complicated by Haiti’s vulnerability to shocks. Weather events and natural disasters, shifts in the terms of trade, foreign financing, and political events have been important drivers of inflation and of foreign exchange pressures in Haiti. The shallow domestic interbank market also amplifies shocks by increasing volatility in the foreign exchange market. The BRH has a clear understanding of how shocks propagate in the economy, but insufficient data hampers calibration of the policy response. A lack of high frequency macroeconomic data (particularly in the agricultural sector) and a limited capacity for liquidity forecasting complicates monetary policy. Treasury management by the central government, which needs significant improvement, introduces additional volatility into the level of gourde liquidity. The pressure on government deposits could increase as aid and foreign financing diminishes, provided fiscal consolidation does not proceed as needed.
8. Assessing the stance of monetary policy is sometimes challenging. Policy rates are used for signaling, but their role is hampered by a weak transmission mechanism to other interest rates in the economy. Increases in the level of reserve requirements have also signaled tightening, but a number of exemptions lower the effective reserve rate and complicate the measuring of the intended policy stance (Chart 3). There has been significant fluctuation in the volume of central bank bills in recent years, and amounts outstanding have not always tracked movements in the policy rate, which also complicates the assessment of the policy stance (Chart 4). And while there is a quarterly note on monetary policy and a monthly note on inflation, changes in policy are not always announced, and forward guidance is not provided.
9. The effectiveness of monetary policy would be increased by a better understanding of the transmission mechanism, and by a strengthened operational framework. The transmission mechanism should be better understood, including through the production of quality and timely macroeconomic and financial data. The use of exemptions on the implementation of reserve requirements should be avoided and open market operations should be used to ensure that market interest rates are close to targets. This will make the policy stance more clear and avoid instances where the signaling provided by policy rates is different than that implied by the implementation of open market operations (Chart 5). To strengthen the communication of the policy stance, the central bank could consider publishing a synthetic indicator that takes all factors impacting liquidity
Chart 4. BRH Bills Outstanding(Billions of gourdes and interest rate)
Sources: BRH FMI Weekly; and IMF staff estimates.
HAITI
INTERNATIONAL MONETARY FUND 37
absorption into account, such as a weighted average of the effective reserve rates and the rates on outstanding BRH bills (Chart 6).
10. Maintaining the exchange rate anchor requires keeping a foreign exchange buffer that is credible for market intervention. Anchoring medium-term inflation expectations in the mid-single digits requires an international reserve buffer that allows the Central Bank to credibly intervene when negative shocks materialize. Rebuilding buffers after increased intervention following shocks requires of increased exchange rate flexibility, and of a fiscal policy that is consistent first, with recovering, and then, maintaining, appropriate buffers. Staff analysis suggests that, in the case of Haiti, international reserves should be in the range of 4–5 months of prospective imports.2
C. Financial Intermediation and Financial Inclusion
11. The level of financial intermediation is a key determinant of economic growth, but is very low in Haiti. The role of the financial system as an intermediary between depositors and borrowers, addressing information asymmetries to convert savings into productive credit, is crucial to economic growth (Levine et al, 2000). In the case of Haiti, however, financial intermediation is very low, credit concentrated, and financial services entail high costs.
Haiti’s banking sector features a few large players. The system is composed of nine banks, two of which are state-owned (BNC and BPH), two are foreign-owned (CNBA and Scotia), and five are domestic. However, the sector is dominated by two domestic private banks: Sogebank and Unibank, which together provide about two-thirds of private sector credit. The top three banks (including BNC) account for over 80 percent of total assets (BRH 2014). This level of concentration is common
2 See Selected Issues Paper “External Buffers and Competitiveness to absorb shocks and support growth”
Chart 6. BRH Monetary Policy Rates(Weighted average of percent changes in effective reserve rates and BRH bill rates, since October 2010)
Sources: BRH FRMI Weekly; and IMF staff estimates.
HAITI
38 INTERNATIONAL MONETARY FUND
in the region, but the small presence of foreign-banks (6.5 percent of assets) is unusual (FinStats 2015).
12. Domestic credit is low, and there is a significant excess of deposits over bank credit. Despite rapid credit growth in the years after the 2010 earthquake, bank lending to the private sector remains under 20 percent of GDP, which is the lowest in the region (Chart 7). However, total deposits (at around 40 percent of GDP) are not low by regional standards. This excess of deposits over bank credit is due to high reserve requirements, but also because a relatively large share of assets takes the form of non-credit domestic investments, often in affiliated enterprises (Table 1, Chart 8).
13. The formal banking system is concentrated in Port-au-Prince. Haiti has a third of the number of bank branches on a per capita basis as in Nicaragua, and a quarter of the number of branches per person as in the neighboring Dominican Republic, but 67 percent of bank branches, and 85 percent of total deposits, are located in the Port-au-Prince area, which only has about 25 percent of Haiti’s population (BRH 2014 and BRH/World Bank 2014) (Chart 9).
14. Relatively few borrowers account for a significant share of credit, reflecting a lack of information on creditworthiness and difficulties in collecting on debt. There were about 100,000 loans outstanding in December 2014 (out of a population of over 10 milion). Moreover, most banks extend around 40 percent of their credit to their 10–15 largest clients. For the system as a whole, the 100 top borrowers account for about half of total credit, reflecting limited creditworthiness information and a dysfunctional system for recovering debt.3 In such a system, close
3 Haiti ranks last in the world on the practice of resolving insolvency, according to the World Bank’s Doing Business rankings. An inability to collect debts therefore helps explain why credit is concentrated at a few top clients, as close personal relationships can help ensure repayment.
Cash and liquid assets 3.3 Demand Deposits 18.7Reserves at the central bank 13.5 Savings and Term Deposits 21.1BRH and Treasury Bills 2.4 Other short-term liabilities 1.9Foreign Assets 1.2 Other long-term liabilities 3.3Net Lending 17.5 Capital 3.9Domestic Investments 8.0Real Estate and Other 3.1Total Assets 49.0 Total Liabilities 49.0
Source: BRH "Rapport Statistiques et Indicateurs Financiers," Q1 2015.
Assets Liabilities
Table 1. Balance Sheet of the Aggregated Banking System(end-December 2014, percent of GDP)
0
8
16
24
32
0
8
16
24
32
2004 2005 2006 2007 2008 2009 2010 2011 2012 2013
Dominican Republic Haiti Jamaica Nicaragua
Chart 7. Domestic Credit to Private Sector(Percent of GDP)
Sources: National Authorities; and IMF staff estimates.
0
10
20
30
40
50
0
10
20
30
40
50
Dominican Republic
Haiti Jamaica Nicaragua
Deposits Private Sector Credit
Chart 8. Bank Deposits and Private Sector Credit(Percent of GDP)
Sources: FinStats Database; and IMF staff estimates.
HAITI
INTERNATIONAL MONETARY FUND 39
personal relationships can substitute for formal institutional mechanisms for collecting on collateral (Bond and Rai, 2002.
15. Credit spreads are high, although top clients can borrow on more favorable terms. Average lending rates have hovered around 20 percent in recent years, even as savings rates have remained near zero (Chart 10). However, the weighted-average lending-deposit spread in Haiti was about 8 percent in 2013, similar to that in the Dominican Republic and lower than that in Nicaragua or Jamaica (each about 14 percent; Finstats 2015). This suggests that relatively few large borrowers can access credit at rates close to banks’ own costs of funds, while smaller borrowers pay significantly higher rates, likely reflecting higher perceived risk premia in a context where information asymmetries are still significant.
16. The sectoral distribution of bank loans suggests credit is concentrated in the consumption sector. Trade (wholesale and retail) is the largest category, followed by real estate, and a range of other services together are another important destination of credit. Industry receives about 15 percent of total credit, mostly to the food and beverage industry. Agriculture receives almost no credit from the formal banking system.
17. The discussion above suggests that more competition, better information, and an improved regulatory framework are needed to increase financial intermediation and boost growth. As discussed by Poghosyan (2012), a narrow credit base and high margins are common in LICs, reflecting a lack of competition and high intermediation costs imposed by weak institutions. Addressing these constraints can boost financial intermediation, reduce its costs, and promote growth. The high costs of financial intermediation in Haiti constrain growth not only by limiting access to credit (Haiti ranked 171th in the world on this indicator in the 2015 Doing Business survey), but by driving up the costs of receiving remittance transfers. Over half of all households receive remittances from the Haitian diaspora (Herrera et al, 2014), yet the fees associated with these transfers are over double that in Nicaragua (Chart 11).
(December 2014, percent)Table 2. Sectoral Allocation of Credit
0
10
20
30
40
50
60
70
80
90
0
10
20
30
40
50
60
70
80
90
Metropolitan Port-au-Prince Provinces
Share of Deposits
Share of Population
Chart 9. Port-au-Prince and the Provinces(Share of total deposits and population, percent of total )
Sources: BRH, IHSI; and IMF staff estimates.
0
5
10
15
20
25
30
0
5
10
15
20
25
30
Mar-12 Aug-12 Jan-13 Jun-13 Nov-13 Apr-14 Sep-14
Average Lending Rate in Gourdes
Weighted-Average Lending Rate in Gourdes
Weighted-Average Interest Rate on Savings Deposits
Chart 10. Savings and Lending Rates in Gourdes(Percent)
Sources: FMI Weekly; and IMF staff estimates.
HAITI
40 INTERNATIONAL MONETARY FUND
18. The BRH launched a credit bureau in FY2014. The credit bureau (the Bureau d’Information sur le Crédit, BIC), developed in collaboration with the IDB and the IFC, is intended to expand access to credit by providing lenders with a continuously updated database on the creditworthiness of potential borrowers. In the first stage of its operation, bank and non-bank financial institutions are required to report to the BIC on credit extended to each borrower. The BIC will help current borrowers demonstrate their creditworthiness to other potential lenders, potentially increase competition among lenders while increasing incentives for borrowers to honor their debts. To help potential first-time borrowers receive credit, the authorities are considering a second stage where would-be borrowers could build a credit history, for example by providing proof of payment of utilities (such as EDH and DINEPA), in order to establish creditworthiness for a first-time loan. This broadening data reporting to the BIC would be beneficial to unbanked individuals and small enterprises because it would facilitate their building a credit history without necessarily having had formal access to credit, thus overcoming the trap of not being eligible for credit without having a previous credit history (IFC 2012). In expansion of the credit bureau to cover nontraditional data beyond the banking system would require legislation, however.
19. The cooperative and microfinance sector is another avenue to promote more competition in the financial sector, but the sector is small. There are 90 registered savings and cooperative financial institutions with about 639 thousand members as of end-September 2013. Unlike commercial banks, cooperatives are focused outside of Port-au-Prince, with about 80 percent of branches located in the provinces. However, known total assets of the entire sector were just over G 5 billion, or under 1.5 percent of GDP. The sector is growing, but not at a rapid pace: there were 59 thousand borrowers as of end-September, compared with 47 thousand in 2009.
2009 2013Assets, million gourdes 2,327 5,117as a percent of GDP 0.9 1.4Net Credit Outstanding, million gourdes 1,258 2,864Deposits, million gourdes 1,636 3,160Number of members 339,485 638,958Number of borrowers 46,637 59,196
Source: BRH; and IMF staff estimates.
Table 3. Evolution of Savings and Credit Cooperative Sector(units as indicated)
0 5 10 15
Haiti
Jamaica
Dominican Republic
Regional Median
Nicaragua
Chart 11. Costs of Processing Remittances(Average cost of sending US$ 200, percent)
Sources: FinStats 2015; and IMF staff estimates.
HAITI
INTERNATIONAL MONETARY FUND 41
20. Modernization of the regulatory environment for cooperatives would help spur its development. Cooperatives are regulated by a 2002 law that placed supervisory responsibilities at a unit within the BRH, but maintained an existing institution (the Conseil National des Coopératives, CNC) with licensing responsibilities. In practice, the actions of the two institutions are not well coordinated, leading to licensing delays and incomplete information on the sector (IMF 2013). Most cooperatives are not registered, and the BRH does not publish information on the sub-sector (compared with comprehensive data published each quarter on banks). Revisions to the legal framework for cooperatives that would clarify the roles of the BRH and CNC and simplify registration procedures have been pending for several years, but have not been approved by parliament.
21. The microfinance sub-sector remains unregulated, with limited data availability. There are two types of microfinance institutions in Haiti. The first are microfinance subsidiaries of registered commercial banks. Several commercial banks operate such subsidiaries, which sometimes receive support from foreign donors by extending guarantees (USAID 2013). Other microfinance institutions are operated by non-governmental organizations, or function as local, small credit unions. Relatively little information is available on the sector, but one estimate based on self-reported data suggests that loans are around G 4 billion, or 1 percent of GDP (Microfinance Information Exchange, 2015). A study funded by USAID and published in 2012 used sampling methodology to estimate that there might be 200 such institutions in Haiti with total assets of about G 10 billion (Lhermite, 2012), but since few microfinance institutions report data to the central bank, it is difficult to verify this estimate. The BRH has been developing a draft law that would regulate microfinance institutions, but it has not yet been submitted to parliament.
22. The government’s National Strategy for Financial Inclusion aims to raise the share of the population that has access to financial services while safeguarding the stability of the financial system. The strategy, developed in coordination with the World Bank, aims to raise the share of adults that have an account with a formal financial institution from 27 percent to 45 percent in five years. Key action items are further developing the legal framework of the financial system, the credit bureau, and promoting more competition in the money transfer business to reduce costs (all noted above). Other measures include revisiting the requirements for opening up a bank account (such as on minimum account balances), studying the feasibility of making social payments through the banking system. One key reform priority laid out in the financial inclusion strategy is facilitating the use of collateral, including real assets (for which the authorities are drafting a law), and land. The latter will require a functioning land cadastre and improving property rights (see Selected Issues Paper “Opportunities and Challenges for Growth”).
HAITI
42 INTERNATIONAL MONETARY FUND
References Banque de la République d’Haïti (BRH, 2014). Rapport Statistiques et Indicateurs Financiers : Q1 FY2015. Available at http://www.brh.net/stats_financieres.html
Bencivenga, Valerie R and Bruce D Smith (1991) “Financial Intermediation and Endogenous Growth,” The Review of Economic Studies, Vol 58, No. 2.
Bond, Philip, and Ashok Rai (2002) “Collateral Substitutes in Microfinance,” Yale University.
Fin Stats 2015. World Bank Group, November 2014.
Herrera, J, Lamaute-Brisson, N., Milbin, D. Roubaud, F, Saint-Macary, C., Torelli, C,Zanuso, C.. L’Evolution des conditions de vie en Haïti entre 2007 et 2012. La réplique sociale du séisme. IHSI, DIAL, Paris, Port-au-Prince, 2014.
International Finance Corporation (2012) “Credit Reporting Knowledge Guide,” Washington, DC.
International Monetary Fund (2012) “Enhancing Financial Sector Surveillance in Low-Income Countries—Background Paper.” Washington, DC.
International Monetary Fund (2013) “2012 Article IV Consultation and Fifth Reivew under the Extended Credit Facility-Financial Sector Review,“ Washington, DC.
Levine, Ross, Norman Loayza, and Thorsten Beck (2000) ; “Financial Intermediation and Growth: Casuality and Causes.” Journal of Monetary Economics.
Lhermite François. September 2012. Recensement de L’industrie de la Microfinance en Haiti. Année 2010–11. USAID/HAITI, pp 5–7.
Microfinance Information Exchange (2015). Data available online at: http://www.mixmarket.org/mfi/country/Haiti
Mishra, Prachi and Montiel, Peter (2012) “How Effective is Monetary Transmission in Low-Income Countries? A Survey of the Empirical Evidence” IMF Working Paper WP/12/143.
Poghosyan, Tigran (2012) “Financial Intermediation Costs in Low-Income Countries: The Role of Regulatory, Institutional, and Macroeconomic Factors.” IMF Working Paper WP/12/140.
United States Agency for International Development (2013) “Evaluation of DCA Guarantees to Micro-Credit Capital and Sogesol, Haiti Final Report.” August 2013
World Bank. 2014. Doing Business 2015: Going Beyond Efficiency. Washington, DC: World Bank Group. DOI: 10.1596/978-1-4648-0351-2. License: Creative Commons Attribution CC BY 3.0 IGO
HAITI
INTERNATIONAL MONETARY FUND 43
EXTERNAL BUFFERS AND COMPETITIVENESS TO ABSORB SHOCKS AND SUPPORT GROWTH1 A. Introduction
1. Haiti’s real exchange rate is broadly aligned with fundamentals, but competitiveness is severely constrained by structural factors. This note presents the external stability assessment for the 2015 Article IV consultation. The application of various methods of analyzing the appropriateness of Haiti’s real exchange rate (RER) level suggests that it is broadly aligned with fundamentals. This is the case despite some ‘fear of floating’ given the large pass through from exchange rate depreciation to inflation. Haiti’s exchange rate arrangement is, nonetheless, flexible enough to respond to shifts in underlying economic conditions. Formal assessments of the RER are of limited use as a measure of competitiveness, which in Haiti is constrained by weak institutions, poor infrastructure, and a cumbersome regulatory environment. In this regard, synthetic indicators place Haiti near the bottom of cross-country indices of international competitiveness.
2. Maintaining international reserves equivalent to 4–5 months of imports would provide an adequate buffer for Haiti to withstand shocks and avoid stop-and-go growth dynamics. The estimates presented in this note balance the use of reserves a buffer against shocks against the costs of holding relatively low-yielding reserve assets. The analysis suggests that maintaining reserve coverage of 4–5 months of prospective imports is appropriate for Haiti given its high level of vulnerability to shocks and limited response capacity. This should allow attenuating stop-and-go growth dynamics that have characterized the country during the last 30 years, and capital accumulation.
3. The recent decline in international oil prices is the most significant terms of trade shock facing Haiti since 2008–09. The oil price decline has been a positive terms-of-trade shock for Haiti, which has significantly narrowed the current account deficit and has contributed to increasing domestic fiscal revenue in a context of fixed pump prices. However, these gains have been partially offset by lower Petrocaribe financing flows.
1 Prepared by Lawrence Norton (WHD)
HAITI
44 INTERNATIONAL MONETARY FUND
B. External Stability Assessment
4. The equilibrium real exchange rate approach suggests that Haiti’s currency is broadly aligned with fundamentals. The application of the equilibrium real exchange rate (ERER) approach developed by the Consultative Group on Exchange Rates (CGER) suggests that the RER has not significantly deviated from the level implied by its fundamentals during the last two decades. The ERER approach estimates Haiti’s equilibrium exchange rate as a function of its terms of trade, productivity relative to trading partners, changes in public spending, net foreign assets, and remittances. All variables except changes in public spending were found to be statistically significant, and the results suggest that the real exchange rate has closely tracked these fundamentals over a long period. In particular, the surge in transfers and debt forgiveness that occurred after the 2010 earthquake caused the ERER to rise (see Chart 1), but the RER adjusted more slowly, as the central bank (BRH) intervened to boost its international reserve position. More recently (in FY2013 and FY2014), the BRH has sold reserves to smooth the pace of depreciation, and end-FY2014 results suggest a modest overvaluation of under 5 percent.
5. Haiti’s RER has remained broadly appropriate despite some ‘fear of floating’. While the de jure exchange rate regime is a float, the BRH seeks to limit the annual nominal depreciation against the U.S. dollar, given the significant pass-through to inflation, and as a way to anchor expectations. As inflation has been higher in Haiti than in its trading partners over the last few years, limiting exchange rate depreciation has resulted in some real appreciation of the gourde (Chart 2).
6. The application of the Macroeconomic Balance (MB) and External Stability (ES) approaches to assess the RER do not point to significant deviations from equilibrium. MB approaches estimate benchmark current account balances based on a set of relative fundamentals. This note reports the application of two of those
Indicator ES MB-CGER
MB-EBA Lite (2015)
Projection, percent GDP -3.5 -3.6 -3.5Benchmark, percent GDP -3.2 -3.6 -7.1Gap, percent GDP -0.3 0.0 3.6Elasticity of CA to REER -0.1 -0.1 -0.1Implied over (+) or under (-) valuation, percent
3.1 -0.1 -37.1
Table 1. Current Account Benchmarks(Units as indicated)
Source: IMF staff estimates. CGER approach calculates benchmark based on medium-term fundamentals, EBA uses current year. ES approach uses long term growth and inflation projections.
0
20
40
60
80
100
120
140
0
20
40
60
80
100
120
140
1995 1997 1999 2001 2003 2005 2007 2009 2011 2013
Fitted Value Real Exchange Rate
Chart 1. Real Exchange Rate Assessment(CGER Equilibrium Real Exchange Rate Approach)
Chart 2. Real Effective Exchange Rate (January 2007 = 100)
Sources: IMF staff estimates.
HAITI
INTERNATIONAL MONETARY FUND 45
approaches to Haiti. The first, a modified External Balance Assessment approach (“EBA Lite”), produces a very large benchmark deficit for 2015 of 7.1 percent of GDP, implying a very large undervaluation of close to 40 percent, using an assumed elasticity of the current account derived from Isard and Faruquee (1998) (Table 1). In Haiti’s case, the results are driven by a very low level of relative productivity, which is associated with capital inflows, and by relatively high levels of aid and remittances, which are associated with a weaker current account. The second, the MB presented in IMF (2006) suggests a smaller current account deficit of 3.6 percent of GDP as a medium-term benchmark; this MB approach is based on a different set of fundamentals, with Haiti’s low productivity being partially offset by its relatively balanced net foreign asset position (post–debt relief). Finally, the ES approach calculates the current account deficit that is consistent with keeping external debt at some benchmark level (in this case, 40 percent of GDP). This approach results in a current account benchmark of -3.2 percent of GDP, close to current levels, again suggesting that the currency is broadly aligned with fundamentals.
7. All of these approaches have significant shortcomings as a measure of Haiti’s competitiveness. As suggested in Di Bella et al. (2007), analyses of the RER as a measure of competitiveness are complicated by the use of the CPI as a proxy for the price of non-tradables. In the case of Haiti, food accounts for half the CPI basket, making it unlikely to be representative of the costs of firms. Moreover, standard RER measures ignore the effect of imported inputs, which become more expensive in local currency terms as a currency depreciates, offsetting some of the competitiveness gain of devaluation. The vast majority of Haiti’s exports involve the final processing of imported fabric into apparel, and thus Haitian exports have very high import content. Moreover, the results of econometric models should likewise be treated with caution, as they rely on a set of fundamentals that in Haiti have been volatile due to a wide range of shocks and are subject to data quality issues, and use coefficients that do not directly account for country-specific structural factors. For example, while Haiti’s still-low wages are assumed to be a powerful factor for attracting capital by implying a higher return, in practice (for reasons discussed below), financial flows into Haiti have long been low despite its location and favorable access to the U.S. market (See Selected Issues Paper, “Opportunities and Challenges for Growth”).
8. Haiti’s competitiveness is constrained by numerous structural factors. While econometric analysis suggests that the exchange rate is not a key obstacle to Haiti’s external performance, such models do not directly account for a set of other factors that in Haiti’s case are serious obstacles to its international competitiveness. The lack of basic public services means that firms must often arrange for their own electricity, sanitation, and security, and must deal with poor infrastructure. Haiti’s port costs are the highest in the region, driving up the costs of Haiti’s exports and also the imported inputs into those exports. For example, exporting through Haiti’s ports costs 15 percent more than in the neighboring Dominican Republic; importing costs 35 percent more, and in both cases the necessary procedures require 2–3 more weeks (World Bank 2014). Haiti’s business environment is also difficult from a legal and regulatory perspective, with cumbersome procedures (including on land transactions, see Selected Issues Paper “Opportunities and Challenges for Growth”), and an often unclear and sometimes outright contradictory legal framework. This legal framework, combined with a weak rule of law, creates further uncertainty, for example in whether
HAITI
46 INTERNATIONAL MONETARY FUND
the Labor Code permits nighttime work in the assembly industry, or under what terms productive workers must be paid more than the base minimum wage (Better Work Haiti, 2015). Haiti also appears to have lost ground in relative terms in recent years, as measured by its percentage rank in the World Bank’s “Doing Business” survey, where it remains in the bottom 5 percent of all countries surveyed (Chart 3 3; see World Bank 2014). Haiti has seen some progress with regard to perceptions of corruption, albeit from a low base, but comparator countries have made progress as well (Chart 4; see Transparency International 2014).
9. A number of cross-country surveys illustrate some of the biggest obstacles to Haiti’s competitiveness. According to “Doing Business”, Haiti performs particularly poorly on starting a business, which involves 12 procedures and generally takes 97 days (see table). Notably, the costs involved have risen considerably since 2010. Haiti is the last place on the survey on resolving insolvency. The World Economic Forum’s “Global Competitiveness Report” has a broader focus and assigns gives the lowest rank for Haiti under its Institutions sub-index. Within the category of institutions, insecure property rights, transparency of government policymaking, and the efficiency of the legal system are highlighted as particular concerns.
Haiti LIC averageJamaica Dominican RepublicNicaragua
Sources: World Bank; and IMF staff estimates.
Chart 3. Evolution of Ease of Doing Business(Percentage rank)
Indicator Rank Sample Comments
Doing Business 2015 180 189 Enforcing contracts best sub-indicator at 84 (but still takes 530 days) o/w Starting a Business 188 189 Costs of starting business up since 2010 o/w Resolving Insolvency 189 189 No practice of insolvency to measure time and costsCorruption Perceptions Index 2014 161 174 Positive trend over past decadeGlobal Competitiveness Report 2014-2015 137 144 Labor market efficiency best sub-ranking at 77 o/w Institutions 135 144
Source: World Bank; Transparency International; and World Economic Forum.
Table 2. Haiti's Ranking on International Surveys, Latest Available Year
Property rights, legal system, government transparency cited as particular problems
Haiti LIC averageJamaica Dominican RepublicNicaragua
Sources: Transparency International; and IMF staff estimates.
Chart 4. Evolution of Corruption Perceptions(Percentage rank)
HAITI
INTERNATIONAL MONETARY FUND 47
C. Haiti’s Optimal Level of Reserves
10. Haiti’s needs a substantial reserve cushion due to its vulnerability to shocks. Estimating an optimal reserve level begins with an assessment of the trade-off between the likelihood and potential costs of shocks against the costs of holding reserves. Haiti’s undiversified economy faces a wide range of potential shocks spanning weather events, political tension, and volatile external financing. The human costs of a shock to domestic absorption are high, as a large share of the population lives close to subsistence. On the other hand, Haiti also has large infrastructure gaps and thus faces significant opportunity costs in holding low-yielding reserve assets.
11. An appropriate reserve cushion would help Haiti attenuate the stop-and-go growth dynamics that have lowered Haiti’s per capita income in recent decades. Haiti has seen several periods of negative per capita income growth over the past 30 years, often associated with political instability but which have also been due to a food price shock and an earthquake. The severity of these shocks has driven per capita income downward despite positive growth in non-crisis years (see Staff Report, Box 2). An adequate reserve buffer would reduce the severity of these shocks but also avoid the destruction of capital that later impedes growth in non-crisis years, promoting steadier per capita income growth.
12. At about 4.8 months of imports and 45 percent of broad money, Haiti’s international reserves remained appropriate according to generally used rules of thumb. While this represents a decline from the post-earthquake peak, reserves remain appropriate according to frequently used rules of thumb. The first such rule (i.e., that reserves cover three months of imports), measures the appropriateness of the reserve cushion to withstand a shock to the current account. The second (i.e., that reserves correspond to 20 percent of broad money) measures resilience in the face of capital flight. On both measures, Haiti’s reserve coverage remains appropriate and higher than in most low-income countries (see Charts 5 and 6). However, such generic benchmarks ignore the frequency of idiosyncratic shocks and country-specific circumstances.
13. A model accounting for a Haiti’s specific circumstances may produce a better estimate of optimal reserve coverage than generic benchmarks. The framework proposed by Dabla-Norris et al (2011) attempts to measure the benefit of reserves in avoiding crises and in reducing their
Chart 5. Gross International Reserves (Months of Prospective Imports)
Sources: IFS; WEO; and IMF staff estimates.
0
10
20
30
40
50
60
70
80
0
10
20
30
40
50
60
70
80
2000 2002 2004 2006 2008 2010 2012 2014
Haiti Simple average of 30 LICs
Sources: WEO; and IMF staff estimates.
Chart 6. Reserves as Share of Broad Money(Percent)
HAITI
48 INTERNATIONAL MONETARY FUND
severity as well as the costs of reserve holdings. This model takes country-specific characteristics into account that have a known relationship in influencing whether a given shock results in an economic crisis (defined as a drop in domestic absorption). The shock variables (terms of trade, external demand, FDI to GDP, and aid to GDP) were set at the bottom 10 percent of Haiti’s specific distribution over the past ten years, and are intended to estimate Haiti’s vulnerability to crisis events. Haiti’s fundamentals (CPIA, fiscal balance, and imports to GDP), set at current levels, are intended to gauge the potential severity of a crisis event (see Table 3).
14. The frequency of shocks is another important factor in the model. Over the past ten years Haiti has seen at numerous distinct shocks, counting only weather events that impacted more than 200,000 people (Table 4). A longer-term analysis, carried out by the International Disaster Database reports that Haiti has been struck by shocks every 1–2 years since 1900. Accordingly, for the purposes of the model, the unconditional probability of a shock is assumed at 0.5, i.e., that Haiti is assumed to have a 50 percent chance of undergoing some shock each year, albeit not necessarily one that generates a crisis.
15. The results suggest an optimal level of reserves of 4 months of imports. This estimate of an optimal level of reserves is based on the unconditional probability of a shock, the country-specific factors that influence a shock’s impact on the economy, and an assumed opportunity cost of holding reserves of 4.5 percent. Haiti’s calculated optimal reserve level is pushed upwards by the volatility in external demand, terms of trade, and FDI and aid in recent years, as well as by its weak CPIA score. The country’s flexible exchange rate is an important mitigating factor. Also important is the recent decline in the import bill and the significant fiscal consolidation programmed for FY2015.
16. This estimate should be treated with some caution and may best be seen as a lower bound. The decline in international oil prices is an important driver of these results by reducing Haiti’s import dependence (see Section C); if reversed Haiti’s optimal reserve level would rise. In addition, Haiti is classified as having a flexible exchange rate for the purpose of this analysis, but the exchange rate’s role as a nominal anchor suggests that the costs of a sharp devaluation would be sizeable and thus the exchange rate may not be able to fully accommodate a significant shock. The
Fiscal Balance, percent GDP (2015) -3.2Imports, percent GDP (2015) 47.5CPIA (last available) 3.2External demand growth, percent (bottom 10th percentile) -5.8Terms of Trade growth, percent (bottom 10th percentile) -7.2Change in FDI to GDP (bottom 10th percentile) -34.1Change in aid to GDP (bottom 10th percentile) -25.6
Sources: IMF staff estimates.
Table 3. Variables for Optimal Reserves Estimate
Year Event2012 Hurricane (201,850 people impacted)2011 Epidemic (514,000 people impacted)2010 Earthquake (3.7 million people impacted)2008-09 Food prices, international financial crisis2004 Hurricane (315,594 people impacted)2004 Political UnrestSource: EMDAT; and IMF staff estimates.
Table 4. Significant Shocks to Haiti Since 2004
HAITI
INTERNATIONAL MONETARY FUND 49
analysis is also designed to be risk-neutral, but some degree of risk aversion may be warranted, as external shocks can quickly lead to food insecurity and human suffering. Taken together, maintaining reserves near the mid-point of 4–5 months of imports may be prudent, in order to balance the use of reserves as a buffer against the costs of holding relatively low-yielding reserve assets.
D. The Impact on Haiti of Lower Oil Prices
17. The sharp decline in international oil prices improves Haiti’s terms of trade. Oil prices have recently witnessed the largest decline since the global financial crisis. As of March 2015, spot crude oil prices were down 50 percent from one year earlier (see Regional Economic Outlook, Western Hemisphere, Box 2.3). This sharp drop represents a large positive terms-of-trade shock for oil importers, including Haiti. Under the latest WEO projections, Haiti’s oil balance would improve by about 4.5 percent of GDP in FY2015.
18. However, the oil price fall also reduces Petrocaribe financing, partially offsetting the improvement in the balance of payments. Since, 2007, Haiti has borrowed from Venezuela under the Petrocaribe agreement, which allows participating countries to obtain long-term debt at below-market rates as they purchase oil from Venezuela. The level of financing is tied to the international oil price, and during the recent period of high oil prices, Petrocaribe flows to Haiti were about 4 percent of GDP per year. The current period of lower oil prices should reduce Petrocaribe flows to about 2 percent of GDP, partially offsetting the improvement in Haiti’s balance of payments.
19. The fall in Petrocaribe financing has also prompted Haiti to carry out a fiscal adjustment. Petrocaribe financing has financed a large part of the fiscal deficit in recent years, with the financing being used for domestic infrastructure projects but also for transfers to EDH. The authorities are pursuing the necessary fiscal adjustment in large part by reducing energy subsidies. By keeping domestic pump prices essentially unchanged in the face of the fall in international oil prices, the authorities are again able to collect customs duties and excise taxes that were previously forgone (that in FY2014 represented about 2 percent of GDP).2
20. The decrease in oil prices also increases the risk of a sudden stop. The fall in oil prices exacerbates the economic situation in Venezuela, raising the risks of a possible discontinuation of the Petrocaribe program. As Haiti still receives relatively large flows and has little alternative financing sources, a significant further adjustment would be necessary, although the impact on the economy would be less than in an environment of high oil prices.
2 The authorities increased fuel prices in October 2014 (7.5 percent for gasoline, 9.3 percent for diesel and 6.2 percent for kerosene), but decreased prices in February 2015.
HAITI
50 INTERNATIONAL MONETARY FUND
References Better Work Haiti: garnment industry 10th biannual synthesis report under the HOPE II legislation/International Labor Office; International Finance Corporation. Geneva: ILO, 2015.
Dabla-Norris, Era; Kim, Jun Il; and Shirono, Kazuko “Optimal Precautionary Reserves for Low-Income Countries : A Cost-Benefit Analysis.” IMF Working Paper 11/249. 2011
Di Bella et al (2007), “Assessing Competitiveness and Real Exchange Rate Misalignment in Low-Income Countries”, IMF Working Paper WP/07/201, International Monetary Fund.
Isard, Peter and Faruqee, Hamid (1998), “Exchange Rate Assessment; Extension of the Macroeconomic Balance Approach”, No 167, IMF Occasional Papers, International Monetary Fund.
IMF (2006), Methodology for CGER Exchange Rate Assessments,” Washington, DC.
International Disaster Database, available electronically at www.emdat.be
Regional Economic Outlook, Western Hemisphere (2015). IMF, Washington DC.
Transparency International (2014). “The Corruption Perceptions Index”. Available via the Internet: http://www.transparency.org/
World Bank. 2014. Doing Business 2015: Going Beyond Efficiency. Washington, DC: World Bank. DOI: 10.1596/978-1-4648-0351-2. License: Creative Commons Attribution CC BY 3.0 IGO
World Economic Forum (2006). “The Global Competitiveness Report 2006-2007”. Available via the Internet: http://www.weforum.org.
HAITI
INTERNATIONAL MONETARY FUND 51
HAITI’S PUBLIC SECTOR: EXPLAINING THE ECF’S FISCAL TARGET1 A. Introduction
1. A good assessment of Haiti’s public finances requires an appropriate coverage of fiscal accounts. Although fiscal targets under IMF-supported programs (2006–10 and 2010–14) have focused on the Central Government, there are a number of public sector institutions with significant weight in the economy, which (directly or indirectly) impact on public debt accumulation, and which are the source of fiscal vulnerabilities.2 For example, over recent years, deficits accumulated by the state-owned electricity utility (EDH) has become a drain for government finances. 3
2. The current note provides an inventory of public sector entities other than the central government. These include the central bank (Banque de la République d’Haïti, BRH), state-owned enterprises (SOEs) such as the electricity utility (Electricité d’Haïti, EDH), autonomous agencies such as the Road Fund (FER), special treasury accounts such as the fund for the universal education program (PSUGO), the pension system, and local authorities (municipalities). The main constraint to the compilation of public sector fiscal accounts is the lack of financial data for most of public entities, mainly autonomous agencies and state-owned enterprises even if these entities are required by law to publish their financial data on a regular basis.
3. The new IMF-supported medium-term program (2015–2018) targets the deficit of a subset of non-financial public sector institutions. This subset includes, in addition to the central government, all transaction financed with Petrocaribe-related resources, as well as the FER, PSUGO, and EDH balances. These entities are responsible for public debt dynamics, as well as fiscal vulnerabilities. Other information will be gradually collected and integrated as the treasury single account (TSA) is expanded to cover autonomous agencies, state owned enterprises, and local authorities.
B. The Banque de la République d’Haiti (BRH)
4. The BRH has generated a profit in recent years. The BRH’s net income was over $14 million in FY2013, according to the BRH’s most recent audited financial statements (see BRH 2014). The central bank’s key income driver has been the return on its FX portfolio in recent years, which has largely funded the central bank’s operations. The interest on its FX portfolio was US$60 million in FY2013 (Table 1). The BRH has also earned G 1.1 billion a year (about US$25 million) on its claims on the government in recent years, under the terms of an agreement
1 Prepared by Joseph Ntamatungiro and Lawrence Norton (WHD) 2 International Monetary Fund (2006 and 2010). 3 See the Selected Issues Paper “Opportunities and Challenges for Growth”.
HAITI
52 INTERNATIONAL MONETARY FUND
with the government pending a final settlement of these claims. Most of the central bank’s expenses related to salaries, benefits, and administrative expenses.
5. BRH’s assets as of end-FY2014 were about G 147 billion (US$3.2 billion, or 37 percent of GDP). About half of the BRH’s assets were held as foreign exchange reserves, and gross claims on the government (about G 49 billion, or US$1.7 billion) accounted for most of the rest (Table 2). BRH liabilities consisted mostly of deposits, money in circulation, and BRH bills outstanding.
FY2013 FY2012Interest and dividend income on Foreign Placements 59.9 65.1Income from claims on the government 25.1 26Income from credit operations 2.6 2.2Interest paid -13.5 -1.3Net profit from real estate sales 13.5 10.6Other income 5.3 4.2Income net of interest 93 106.7
Salaries and Benefits 53.7 71.6Administrative Expenses 11.9 12.2Maintainence of Currency in Circulation 6 7.2Depreciation 4.1 3.3Other expenses 2.9 3.5Operating Expenses 78.7 97.7 Net Income 14.4 9.1Source: BRH FY2013 audited financial statements, Fund staff calculations.
Table 1: BRH Profit and Loss Accounts, US$ Millions
Assets millions of gourdes in millions of US$Gold 3,202 70.3Liquid FX Reserves 81,183 1,782.0Other FX Reserves 2,797 61.4Claims on the Public Sector 49,463 1,085.7Claims on the Private Sector 4,249 93.3Other Assets 5,920 129.9
Total 146,814 3,222.6
LiabilitiesForeign Liabilities 13,242 290.7Money in Circulation 23,865 523.8Commercial Bank Deposits and Reserves 57,601 1,264.3Public Sector Deposits 37,134 815.1Non-Bank Private Deposits 6,950 152.5BRH Bills Outstanding 4,857 106.6Capital Account 3,167 69.5Source: BRH, Fund Staff Calculations
Table 2: Structure of the BRH Balance Sheet, end-September 2014
HAITI
INTERNATIONAL MONETARY FUND 53
6. Most of Haiti’s FX reserves are held in corporate debt. According to the FY2013 audited financial statement, two-thirds of the BRH’s FX reserves (excluding gold and participation in international institutions) were held in corporate debt at end-FY2013.4 Most of the rest was collateral placed to conduct repurchase operations, which were subsequently unwound.5 Haiti’s FX reserves are managed by internationally-recognized firms with the goal of maintaining liquidity, are available for sale, and are held at market value. Fund staff confirmed that, as Haiti’s FX reserves are investment-grade and denominated in U.S. dollars, they are considered liquid for balance of payments purposes under the latest guidelines of the Balance of Payments and International Investment Position Manual (BPM6).
7. The BRH does not remit profits to the government as part of an agreement to capitalization. Article 59 of the BRH law states that 25 percent of net profits are to be distributed to the Treasury, 10 percent to a legal reserve, and the balance to special reserves for investment and expansion as determined by BRH Executive Board. However, as part of a memorandum of understanding to recapitalize the central bank that was agreed upon in the context of Haiti’s 2010 ECF arrangement, the BRH agreed with the MEF to not remit net profits to the Treasury.
C. State-Owned Enterprises
8. Haitian law defines state-owned enterprises (SOEs) as autonomous entities involved in financial, commercial and industrial activities.6 They operate under the commercial code and are expected to provide an economic and social return. They are created by law and their governance structure includes a management team and an executive board.7 They are under the administrative supervision of a sectoral ministry and their financial transactions are supervised by the Ministry of Finance and by the Court of Accounts (Cour Supérieure des Comptes et du Contentieux administrative). While SOEs enjoy administrative and financial autonomy, the government can intervene in their management if they fell into deficit.8 The government can propose to parliament the liquidation of SOEs that do not meet expectations. SOEs are owned fully or partially (mixed
4 The audited financial statement of BRH can be found at http://www.brh.net/etats_financiers_2013.pdf. The audit is qualified because of the BRH’s holdings of residual TELECO. The BRH owns about 97 percent of TELECO, which is valued at G 1.9 billion but which has not been revalued since 2001. In the absence of audited financial statements of TELECO, the audit is qualified. 5 See IMF 7th Review, IMF Country Report 14/105, available at http://www.imf.org/external/pubs/ft/scr/2014/cr14105.pdf 6 See the Decree of May 17, 2005 on organization of national administration. 7 According to Article 128 of the Decree of May 17, 2005, members of the executive board (3 to 9 members) are nominated by the government after approbation by the Senate, for a 3-year term renewable once. 8 Article 154 of decree of May 17, 2005 lists 4 circumstances under which the government could intervene: (i) deficit greater than to a third of the revenue of the previous year; (ii) the deficit exceeds 15 percent of the revenues of during three years over a five-year period; (iii) losses are higher than a third of the capita; and (iv) a court decision forces the SOE to pay debt obligations exceeding 80 percent of revenues.
HAITI
54 INTERNATIONAL MONETARY FUND
enterprises).9 Private sector participation in SOEs should be in line with the 1996 law on the modernization of public enterprises.
9. In the late 1990s, the government began a privatization program with the objective of injecting capital and increasing investment.10 The SOEs slated for privatization included a flour mill, a cement factory, the telephone company (TELECO), the electricity company (EDH), the national port authority (APN), the airport authority, an edible oil plant and two commercial banks (Banque nationale de crédit, BNC and Banque populaire d’Haïti, BPH). Only three enterprises were privatized, namely the flour mill (1998), the national cement factory (1999) and the telecommunications company TELECO (2010). Non financial public enterprises remaining in the state portfolio include the electricity distribution company (EDH), the national port authority (APN), the national airport authority (AAN), the social security office (ONA), the postal office (Office des Postes d’Haïti, OPH), a third-party vehicle insurance company (OAVCT), a labor and maternity insurance office (OFATMA), and a sugar factory (USJLDD). The government also has a 40 percent stake in NATCOM (former TELECO).11
10. Most SOEs are financially sound, with the key exception is EDH, which receives substantial government subsidies. 12 A few SOEs pay dividends to the central government, but their contribution to revenue is very limited (less than 0.1 percent of GDP in the FY2015 budget). The port authority (APN) was exempted from distributing dividends so that it can consolidate its capital base.
11. Only a few SOEs publish their financial statements on a regular basis. This is the case despite that the law requires SOEs and autonomous agencies to submit (on a regular basis) their financial statements to the Ministry of Finance and the Court of Accounts.13 In particular, EDH has not published its financial statements since 2007, which makes it difficult to have a full picture of its financial position. 14
9 See Article 118 (b). SOEs differ from several autonomous agencies carrying out government missions in the administrative, cultural or scientific areas (see Table 3). These agencies are defined by Article 118 (a); their budgets are financed by allocations of the central government budget, and their employees are subject to the civil service charter, even though they can benefit from special statutes. 10 In 1996, Haiti passed legislation on the modernization of public enterprises (Law of September 26, 1996), allowing for the privatization of 9 public enterprises by March 1998. Privatization could take the form of a management contract, a concession, or a capitalization (joint venture). In the case of a joint venture, the government would retain from 20 percent to 49 percent ownership. The privatization process was supervised by the Council of modernization of public enterprises (CMEP) established in 1997. 11 Financial public enterprises include two commercial banks (BNC and BPH). 12 See the Selected Issues Paper “Opportunities and Challenges for Growth”. 13 Articles 150 and 151 of the decree of May 17, 2005. 14 EDH, APN and DINEPA were audited for FY2005 and FY2006 under two IDA-financed budget support operation (Economic Governance Reform Operations I and II). With the assistance from the World Bank, an audit of EDH’s accounts is being conducted for the period 2007–14.
HAITI
INTERNATIONAL MONETARY FUND 55
12. The central government has a creditor position vis-à-vis a number of SOEs. Some SOEs have accumulated debts vis-à-vis the government, stemming from unpaid taxes or taxes collected from customers but not transferred to the Treasury (over 0.1 percent of GDP in FY2014). EDH has accumulated arrears (almost 1½ percent of GDP) to independent power producers, creating a contingent liability for the central government. In turn, local authorities have accumulated some arrears to EDH related to street lighting (0.5 percent of GDP). The legal framework does not prevent SOEs from contracting debt, although existing debt it is very limited and guaranteed by the central government. SOEs maintain a creditor position with the domestic banking system in the form of deposits (0.6 percent of GDP at end-February 2015).
D. The Road Maintenance Fund (FER)
13. The Road maintenance Fund (FER) is a financial autonomous agency created by law (of July 2003) with the mission to maintain road infrastructure on a sustainable basis. It is under the technical supervision of the Ministry of Public works. Like all autonomous agencies, it is also under the financial supervision of the Ministry of Finance, and its activities are submitted to the external audit by the Court of Accounts.
14. The FER is headed by a managing director, appointed by the Presidency, and operates under the supervision of a board established by an order (arrêté) of September 2005. The Board, chaired by the Minister of Public Works, includes 5 members representing the Ministry of Public Works (2), local authorities (1 currently designed by the Ministry of the interior), transporters (1) and petroleum companies (1).
15. The FER is charged with maintaining a list of eligible roads established by the Ministry of Public Works; the list is revised every two years, and is proposed by the Board of the FER.15 The domestic resources of FER, collected by the Tax and Customs departments, are generated by the following taxes and fees:
A charge on petroleum products (1Gourde per gallon of gasoline and diesel)
5 fees collected on automobiles
Fees collected on cigarettes, alcohols, driver’s licenses and passports
20 percent of road tolls.
15 The Ministry of Public Works is charged with maintaining roads that are not eligible to the FER.
HAITI
56 INTERNATIONAL MONETARY FUND
Table 3. Haiti: List of Autonomous Entities per Ministry and Category
Autonomous entities per MinistryEntities with administrative, cultural and scientific
mission
Financial, commercial and industrial entitities (State-
owned enterprises)
Ministry of Econmy and Finance (MEF)
Autorité portuaire nationale (APN) X
Office d’assurance-véhicules contre tiers (OAVCT) X
Unité de lutte contre la corruption (ULCC) X
Société nationale des parcs industriels (SONAPI) X
Fonds d’assistance économique et sociale (FAES) X
Banque de la République d’Haïti (BRH), organe de tutelle de la NATCOM et du FDI X
Banque nationale de crédit (BNC) X
Direction générale des Impôts (DGI) X
Bureau de monétisation (BMPAD) X
Administration générale des douanes (AGD) X
Banque populaire haïtienne(BPH) X
Fonds de développement frontalier X
Institut haïtien de statistiques et d’informatique (IHSI) X
Ministry of Planning and external cooperation
Centre de techniques de planification et d'économie appliquée (CTPEA) X
Centre national de l'information géo-spatiale (CNIGS). X
Conseil national des coopératives (CNC). X
Observatoire national de la pauvreté et de l'exclusion sociale (ONPES) X
Ministry of Public works, transport and communications
Autorité aéroportuaire nationale (AAN) X
Bureau des mines et de l'énergie (BME) X
Conseil national des télécommunications (CONATEL) X
Électricité d'Haïti (Ed’H) X
Fonds d'entretien routier (FER) X
Laboratoire national du bâtiment et des travaux publics (LNBTP) X
Office national de l'aviation civile (OFNAC) X
Office national du cadastre (ONACA) X
Service maritime de navigation d'Haïti (SEMANAH) X
Direction nationale d’eau potable et d’assainissement (DINEPA) X
Service métropolitain de collecte des résidus solides (SMCRS) X
Le Centre national des équipements (CNE) X
Ministry of Justice
Office national d’identification (ONI) X
Police nationale d’Haïti (PNH) X
Unité centrale de renseignements financiers (UCREF) X
HAITI
INTERNATIONAL MONETARY FUND 57
Table 3. Haiti: List of Autonomous Entities per Ministry and Category (continued)
Autonomous entities per MinistryEntities with administrative, cultural and scientific
mission
Financial, commercial and industrial entitities (State-
owned enterprises)
Ministry of of Social affairs (MAS) :
Office national d’assurance-vieillesse (ONA) X
Caisse d’assistance sociale (CAS ) X
Institut de bien-être social et de recherche (IBESR) X
Office national de l’artisanat (ONART) X
Office d’assurance travail et maternité (OFATMA) X
Office national de la migration (ONM) X
Ministry of Education and professional training
Institut national de formation professionnelle (INFP) X
Office national de partenariat en éducation (ONAPE) X
Programme national de cantines scolaires (PNCS) X
Ministry of Culture
Archives nationales d'Haïti X
Bibliothèque nationale d'Haïti X
École nationale des arts (ENARTS) X
Théâtre national X
Musée du panthéon national haïtien X
Bureau national d’ethnologie X
Institut de sauvegarde du patrimoine national (ISPAN) X
Presses nationales et Le Moniteur X
Radio nationale X
Télévision nationale d’Haïti (TNH) X
Journal l’Union (non fonctionnel) X
Bureau haïtien du droit d’auteur (BHDA) X
Ministry of Commerce and industry
Centre de facilitation des investissements (CFI) X
Office des postes d’Haïti X
Ministry of Agriculture, natural resources and rural development
Institut national de la réforme agraire (INARA) X
Organisme de développement de la Vallée de l’Artibonite (ODVA) X
Institut national du café haïtien) (INCAH) X
Bureau de crédit agricole (BCA) / non fonctionnel X
Coordination nationale de sécurité alimentaire (CNSA) X
Usine sucrière Jean Léopold Dominique de Darbonne (USJLDD) X
Ministry of Interior and local authorities
Direction de la Protection Civile X
Ministry of Environment
Agence nationale des aires protégées (ANAP) X
Source: Haitian Authorities
HAITI
58 INTERNATIONAL MONETARY FUND
16. The FER also receives contributions of bilateral donors (EU, France, and Canada) and multilateral institutions (World Bank, IDB). Under exceptional circumstances, the FER can borrow to finance its current spending, with Board approval.
17. Resources of the FER are deposited on a special account with the BRH (compte FER). By law, up to 10 percent of FER resources is used for current spending, while the remainder is used for road maintenance under regular activities (85 percent) and in case of emergencies (5 percent). The Ministry of Public Works manages spending related to road maintenance while the FER’s DG manages current spending. The budget for road maintenance is used for the national road network under the responsibility of the central government (70 percent), and the rest to roads under the responsibility of local authorities. FER resources are limited, with allocations of only G350–650 million (0.1 percent of GDP) during FY2013–2015 (Table 4).16
E. The PSUGO Fund
18. The PSUGO Fund was announced in May 2011 as one of the President’s 5-year priorities. The objective of the Fund was to mobilize needed resources to provide compulsory and free school access to 1.5 million disadvantaged children, under the universal, free and compulsory program (PSUGO). 17 The Fund would complement budgetary allocations to PSUGO that are executed under the investment budget of the Ministry of education (ME). The authorities decided that the Fund would be financed by the following fees on international telephone calls and money transfers:
US$0.05 on each incoming call minute, to be collected by the National Telecommunications Council (CONATEL);
(US$1.5 on money transfers (incoming or outgoing the country), to be collected by financial institutions, and transferred to the central bank (BRH).
19. The PSUGO Fund was expected to be effective from June 2011. Initial projections had established the collection capacity at US$360 million for the 5 years, with equal contributions from
16 The FY2014 and FY 2015 budget laws included FER spending under government investment, financed with withdrawals on FER’s bank account under domestic financing. Starting from FY2015, staff fiscal tables add FER revenue to government revenue. Movements on the FER’s bank account affect net bank credit to the central government. In February 2015, FER’s deposits with the central bank amounted to G220 million (l0.05 percent of GDP) 17 The PSUGO Fund would benefit primarily the Greater South, the Great North and the West and Central Plateau. The first schooling was to take place in September 2012 with 350,000 children.
Table 4: Haiti: Operations of the Road Fund (FER), 2013-2015(in millions of Gourdes)
Expenditure 769 995 600Wage bill 20 23 …Goods and services 11 10 …Other current spending 2 2 …Capital spending 737 961 …
Sources: FER, Ministry of Economy and Finance and Fund staff estimates
HAITI
INTERNATIONAL MONETARY FUND 59
the two sources. The Fund was to be managed by a council of 15 members, including BRH, and an independent international firm would be responsible for its audit.
20. At present, the Fund is operational but without a legal framework, since the bill on the establishment, organization and functioning of the Fund is still pending adoption by the parliament. In August 2012, the lower house of the parliament passed a bill on the Fund, with clarifications on the composition of the managing committee. But the bill has not yet been considered by the Senate. In the meantime, fees have been collected. With regard to the fee on money transfers, BRH’s circular 98 of May 2011 instituted the fee on money transfers for “cost of testing, certification, operation and inspection”.
21. The PSUGO Fund’s operations have essentially been extra budgetary. Resources of the Fund are deposited in a special account at the BRH, within the definition of Net Credit to the Central Government (NCG), captured within the program targets. Changes in deposits, resulting from the Fund’s revenue or expenditures, affect government financing through the change in NCG; however the Fund’s revenues and expenditures are not recorded in the table of budget execution as a counterpart.18 For program monitoring purposes, starting from FY2013, information on revenues and expenditure was included in the ECF’s table of government fiscal operations.
22. The PSUGO Fund’s spending for FY2012 and FY2013 was tentatively estimated using information on FNE revenues and changes in end-year deposits. The Fund’s resources averaged 18 The FY2014 and FY 2015 budget laws however included the Fund’s spending under government investment, while the Fund’s revenue is recorded under domestic financing (assumed withdrawals on the Fund’s special account). In staff fiscal tables the Fund’s revenue is added to government revenue.
Initial
balance
(BRH)
PCDR
Fees on
international
phone calls
(CONATEL)
Fees on
international
transfers (BRH)
Total resources
End-of year
balance
(BRH)
2012 0 467 1113 295 1875 79 1795
2013 79 0 1015 861 1954 250 1704
2014 250 0 818 495 1563 103 1460
2015 103 0 725 1087 1916 103 1812
Q1 103 0 240 434 674 324 350
2012 0.0 0.1 0.3 0.1 0.6 0.0 0.5
2013 0.0 0.0 0.3 0.2 0.5 0.1 0.5
2014 0.1 0.0 0.2 0.1 0.4 0.0 0.4
2015 0.0 0.0 0.2 0.3 0.5 0.0 0.4
Q1 0.0 0.0 0.1 0.1 0.2 0.1 0.1
Sources: Ministry of Economy and Finance; and staff estimates and projections.
1/ Expenditure for FY2014 as provided by the Budget Department; estimates for previous years.
2/ Data for 2015 are based on the budget law for FY2015, and execution for the first quarter of FY2015.
(percent of GDP)
Implied Expenditure
Table 5. Haiti: Operations of the PSUGO Fund, 2012-15 1/ 2/
Revenue
(millions of gourdes)
HAITI
60 INTERNATIONAL MONETARY FUND
G 1.9 billion (US$45 million) a year during FY2012–FY2013, of which G 1.6 billion (US$38.7 million) collected from telecommunications and money transfer fees and G 0.3 billion from transfers from PCDR resources (Table 5). Expenditure averaged G 1.7 billion per year, with the difference remaining in the Fund’sdeposits with the central bank. In FY2014, the Fund’srevenue was lower at G 1.6 billion, with spending estimated at G 1.5 billion. Figures for in the FY2015 budget show an increase both in revenue (G 1.9 billion) and spending (G 1.8 billion).
F. The Pension System
23. Haiti’s pension system comprises: (i) a private sector mandatory plan; and (ii) a civil service mandatory pension plan. To supplement the private sector plan, major corporations have developed voluntary pension schemes for their employees. But such schemes are protected by no legislation and are not supervised, and therefore no information is readily available. 19
24. The private sector mandatory plan is managed by ONA (Office National d’Assurance-Viellesse). ONA is State-owned enterprise regulated by a law of 1965 (modified by the organic law of August 28, 1967 and other subsequent decrees) and is under the technical supervision of the Ministry of Social Affairs. The law provides for a board with representatives of employers, workers and the government). The plan is funded by contributions by employees (6 percent of member’s wages) and employers (6 percent of member’s wages).
25. ONA provides coverage for old age, disability and survivors. Coverage includes (i) employees of formal private sector (industrial, commercial, agricultural firms); and (ii) certain categories of public sector employees, mainly in state-owned enterprises (SOEs).20 Self-employed, workers in the informal sector, and even civil servants can participate on a voluntary basis, on the condition that they provide a total contribution of 12 percent of their salary.
26. The mandatory plan provides the following benefits:
Old-age pension: 1/3 of average monthly salary during the last 10 years of contributions, for those who have contributed during a period of at least 20 years. Benefits are neither indexed nor adjusted for inflation. ONA has a restitution system for employees who do not meet the conditions for benefiting from the old-age pension (mainly the 20 year contribution period). The old-age pension represents more than 70 percent of total benefits.
Permanent disability pension: monthly pension is based on 1/5 of average monthly earning in the last 10 years before disability, for those who have contributed between 10 and 20 years. Benefits are neither indexed nor adjusted for inflation.
19 See the 2008 Financial System Stability Assessment (FSSA). 20 The retirement age (55 years) is low compared with LAC countries; e.g. 60 years for women and 65 years for men in Chile (World Bank, 2009). But also life expectancy at birth (64 years in 2011) is also the lowest (compared with over 70 years in most Caribbean countries). The age dependency ratio (old in percent of working-age population) is also the lowest (7.5 percent in 2012).
HAITI
INTERNATIONAL MONETARY FUND 61
Survivor pension: 1/2 of the pension, split among the surviving spouse and minor dependents
(less than 18). Benefits are neither indexed nor adjusted for inflation.
27. While the very low dependency ratio generates significant surpluses, ONA’s financial position remains weak.21 At end-2010, some 200k individuals contributed to the pension system compared with only 2k beneficiaries. The coverage rate is small (about 2 percent of the population). Annual contributions during FY2011 amounted to G 1.5 billion, for retiree benefits of only G 80 million and restitutions of G 20 millions. However, because of weak management and supervision (in part because the Board is not functional), the low return on investments (in part due to limited opportunities), the high provision for NPLs, the various shocks to domestic activity, and the high administrative costs (the wage bill is unusually high, representing 50 percent of total spending), ONA’s financial position is weak. A recent actuarial study (Delarue, 2014) found that ONA has been recording no new contributors, as the ONA scheme has become less attractive (pension benefits based on only 1/3 of the salary and discontinuation of mortgage loans). It concluded that ONA’s situation called for deep structural reforms.
28. The Civil Service Pension Plan is administered by the Direction de la Pension Civile (DPC) within the Ministry of Finance.22 The plan is mandatory for civil servants and is open to public sector contractual employees willing to contribute. Benefits are available at the age of 55 for public sector employees who have contributed to the plan (8 percent of the base salary). Until mid-1990, the government matched 100 percent of the employee contribution; government contribution has been reduced to 2–3 percent, but the government intends to increase its contribution in future budgets. The majority of retirement benefits represent old age benefits (pensions), which vary according to the length of the contribution period, with a 20-year minimum contribution. 23 The plan also offers survivor benefits for non-remarried spouses and children up to
21 ONA was created in 1965, but started providing pension benefits only twenty years later in 1985, which resulted in an accumulation of surpluses. Given the limited investment opportunities, ONA ventured into extensive and risky lending programs, including mortgage loans from 1974, for which it lacked the expertise, and with low repayment rates (Rajput, 201). Mortgage loans were discontinued in 2007. In February 2015, ONA’s deposits with the banking system amounted to G 4.7 billion (1.1 percent of GDP). 22 The Direction de la Pension Civile (DPC) essentially acts as a benefit payment agency. A coordination unit assists the DPC in the provision of benefits in various regional departments. 23 Since 2004, the plan provides reimbursements to agents who have contributed less than 20 years.
Table 6. Haiti: Benefits for Public Sector Employees
Age Years of contribution Restitution Rate Monthly ceiling (G)
age 24. A few exceptions apply to a few categories.24 Old age benefits are not adjusted for inflation (Table 6).
29. Civil servants benefit from other non-contributory benefits (MEF, 2014). Since 2007, public sector retirees benefit from medical insurance (medical and funeral services) fully covered by the government. Also, a few initiatives were recently introduced in favor of government employees and retirees, including: (i) since 2005, loans guaranteed by the Civil Service Pension Plan are extended by the Banque populaire haïtienne to retirees at an 18 percent interest rate; (ii) since 2008, the Direction de la Pension Civile (DPC) extends advances to employees at a 12 percent interest to allow the payment of the income tax; (iii) since 2009, retirement benefits are progressively paid through bank transfers, as payments by checks are costly and prone to errors; and (iv) a service is provided to retirees in filling out administrative formalities for the annual re-registration.
30. Due to a relatively less favorable dependency ratio, the system generates modest savings. In 2014, the number of retirees was 14k for 70k active contributors.25 Monthly employee contributions (G 79 million) barely cover monthly retirement pensions (G 69 million). Surpluses are kept on a commercial bank account (0.4 percent of GDP at end-March 2014) mainly invested in government T-bills. Recruitments in the police and social sectors are expected to increase the plan’s revenue base.
G. Municipalities
31. Aggregate spending by Municipalities is estimated at below 2 percent of GDP. Due to limited financial and technical constraints, municipalities do not carry out all the responsibilities established under the Constitution of Mars 1987and the Decree of February 2006 on local authorities (“charter of local authorities”).26 Spending by municipalities include social services related to police, cemeteries, markets, butcheries, the protection of sites, basic hygiene and health services, civil protection, and cultural infrastructure. Large municipalities (Carrefour, Port-au-Prince, Pétionville and Delmas) provide garbage collection services and public lighting. There are a total of 140 municipalities, with the largest municipalities located in the Port-au-Prince urban area and Cap Haïtien.
32. Spending is financed by a combination of national and local taxes. Resources include transfers from the central government and earmarked taxes (amounting to about 1 percent of GDP), that are transferred to Municipalities through the Ministry of the Interior. Other revenues include
24 Former Presidents, Prime Ministers and Ministers enjoy a special treatment, as well as high government officers (Grands Commis). Employees in the education sector and some employees in the health sector with a 25-year career also receive 100percent of their remuneration, up to G10,000. 25 The number of retirees includes about 3k retired military with monthly pensions of about G10 million. Following the dissolution of the army and of the military pension system, payments to the military retirees are reimbursed by the central government budget. 26 With USAID financial support, the Ministry of the Interior and Local Authorities preparer in 2011 a compendium of laws and decrees governing local authorities in Haiti.
HAITI
INTERNATIONAL MONETARY FUND 63
local taxes, (essentially real estate taxation), and fees on services provided by municipalities.27 Municipalities have accumulated arrears to EDH related to public lighting (0.5 percent of GDP at end-FY2014). They currently owe no debt to the domestic banking system.
33. Municipalities follow accountability rules governing the use of public resources. Their activities, conducted in the context of annual budgets, are subject to ex-post controls by the Court of Accounts. Spending must be in line with the procurement framework; a Decree of September 5, 2009 (on procurement) sets the thresholds for municipalities at lower levels, with even lower levels for smaller municipalities. Economic data on municipalities is lacking and reporting is delayed, sometimes by more than one year, making monitoring difficult.
27 These taxes are notably instituted by the Law of August 20, 1996 on the Contribution to the Fund for the Management and Development of Local Authorities, and the Law of September 28, 1987 on the business tax (patente).
HAITI
64 INTERNATIONAL MONETARY FUND
References Banque de la République d’Haiti (BRH), Audited Financial Statements for FY2013. December 2014, available at :http://www.brh.net/etats_financiers_2013.pdf.
Delarue, Antoine, 2014, “Rapport composante actuarielle – Composante 2”, Appendix II to a report prepared for the government on Hait’s pension system.
Fonds d’Entretien Routier (FER), 2015, « Etats Financiers pour la période allant du 1er octobre 2013 au 20 septembre 2014 », FER, February 2015.
Haiti Libre, 2011, “Haiti – Education: launch of the National Fund for Educatuion (FNE) by Martelly”, http://www.haitilibre.com/en/news-3034-haiti-education-launch-of-the-national-fund-for-education-fne-by-martelly-update-1h03pm.html.
International Monetary Fund, 2006, “Haiti: Request for a Three-Year Arrangement Under the Poverty Reduction and Growth Facility-Staff Report; Staff Press Release on the Executive Board Discussion; and Statement by the Executive Director for Haiti” (Country Report No. 06/441, Washington D.C.).
International Monetary Fund, 2008, “Haiti: Financial System Stability Assessment”, Coutry Report No. 08/112, march 2008, Washington D.C.
International Monetary Fund, 2010, “Haiti: 2010 Article IV Consultation and Request for a Three-Year Arrangement Under the Extended Credit Facility—Staff Report; Staff Supplement; Public Information Notice on the Executive Board Discussion; and Statement by the Executive Director for Haiti” (Country Report 10/263, Washington D.C.).
IMF Monetary Fund, 2014 “Haiti: Seventh Review under the Extended Credit Facility, Requests for Waiver of Nonobservance of Performance Criterion, and Modification of Performance Criteria—Staff Report; Press Release; and Statement by the Executive Director for Haiti.
Le Moniteur, 2005, « Décret Portant Organisation de l’Administration Centrale de l’Etat », September 27, 2005.
Ministère de l’Education Nationale et de la Formation Professionnelle (MENFP), 2014, « Programme de Scolarisation Universelle, Gratuite et Obligatoire (PSUGO) – Bilan annuel Exercice 2013-14 », MENFP, October 2014.
Ministry of Economy and Finances (MEF), 2014, « Créances Entreprises Publiques (Oct 2012 à Fév 2014) », Direction Générale des Impots (DGC), MEF.
Ministry of Economy and Finances (MEF), 2014, “Note on the pension system for public employees prepared” by the Direction de la Pension Civile (DPC).
HAITI
INTERNATIONAL MONETARY FUND 65
Ministère de l’Intérieur et des Collectivités territoriales de la Republique d’Haïti (MICT), 2011, « Recueil de textes normatifs annotés entourant l’action locale », MICT, April 2011.
Organic Law of August 28, 1967 creating and organizing Office National d’Assurance (ONA).
Rajput, Vishal, 2013, “Pension Reforms in Haiti: Retirement Savings Plan Along With a Credible Plan, 2013 - ojs.geneseo.edu.
"Social Security Programs Throughout the World: The Americas, 2009 – Haiti." Ssa.gov. Web. 15 Apr. 2012. <http://www.pension-watch.net/pensions/about-social-pensions/about-social-pensions/why-social-pensions/>.
The World Bank, 2009, “Strengthening Caribbean Pensions: Improving Equity and Sustainability”, Report No. 47673-LAC, Washington D.C.