Immunophenotypic analysis of acute
lymphocytic leukemia
Roger S. Riley, MD, PhD*, Davis Massey, MD, PhD, DDS,Colleen Jackson-Cook, PhD, Michael Idowu, MD, MPH,
Gina Romagnoli, MCI, MTDepartment of Pathology, Medical College of Virginia,
Hospitals of Virginia Commonwealth University, 403 North 13th Street,
Richmond, VA 23298-0250, USA
The identification and quantitation of cellular antigens through fluorochrome-
labeled monoclonal antibodies (‘‘immunophenotyping’’) is one of the most
important applications of the flow cytometer. The immunophenotypic identifica-
tion and classification of cells by flow cytometry began in the early 1980s with
the revolution in immunology that brought about the discovery of T- and B-cells.
This technology has now expanded to the analysis of other cells such as
monocytes, macrophages, myeloid stem cells, tumor cells and other cell types.
Clinically, immunophenotypic analysis is a critical part of the initial diagnosis
and classification of the acute leukemias since the primary basis of treatment
strategy depends upon antigenic parameters. In addition, immunophenotypic
analysis of the acute leukemias provides prognostic information not available by
other techniques, provides a sensitive means to monitor the progress of patients
after chemotherapy or bone marrow transplantation, and aids in detection of
minimal residual disease [1]. In addition to immunophenotype, a number of other
flow cytometric parameters are under evaluation that may provide additional
diagnostic or prognostic information. These include measurements of apoptosis,
multidrug resistance, leukemia-specific chimeric proteins, cytokine receptors, etc.
The major technical and clinical issues in the immunophenotypic analysis of
acute lymphocytic leukemia are addressed in this chapter. Other reviews of this
subject have been recently published [2–9].
0889-8588/02/$ – see front matter D 2002, Elsevier Science (USA). All rights reserved.
PII: S0889 -8588 (02 )00004 -7
* Corresponding author.
E-mail address: [email protected] (R.S. Riley).
Hematol Oncol Clin N Am
16 (2002) 245–299
Immunophenotypic analysis of acute leukemia
Leukemias represent abnormal proliferations of hematopoietic cells that are
arrested at a discrete stage of differentiation. Leukemias are classified into
acute and chronic forms based on a constellation of clinical and laboratory
findings. The acute leukemias are classifed into two subclasses: the lympho-
blastic (ALL) type and non-lymphoblastic (ANLL) type, based on morphologic,
cytochemical and immunophenotypic features. Each type is further subdivided
into prognostically and therapeutically relevant subtypes based on additional
immunologic, cytogenetic and molecular features. Unfortunately, the ANLLs
have proven to be heterogeneous and more difficult than the ALLs to classify
into precise subgroups.
Acute lymphoblastic leukemia (ALL) is the most common cancer in children.
It also is seen in adults, where it accounts for approximately 20% of acute
leukemias. A high rate of success recently has been achieved in treating child-
hood cases of ALL, but adult cases are generally more resistant to therapy.
Leukemic cells do not show abnormal morphologic changes in the same
manner as other tumors; therefore, the definitive diagnosis of leukemia or other
hematopoietic neoplasm can be made only by observing a shift in the distribution
or maturity of a cell population. Nearly three decades ago, the French-American-
British (FAB) group recognized the presence of increased immature hematopoi-
etic precursors in the acute leukemias. This resulted in a morphologic and
cytochemical criteria for subdividing ALL into three subtypes, and acute myelo-
genous leukemia (AML) into seven subtypes.
The subsequent development of the flow cytometer provided medical inves-
tigators with a powerful tool that rapidly led to advances in knowledge of the
biology of the acute leukemias. The flow cytometer was an ideal tool to apply
monoclonal antibodies to the study of human disease. To date, 247 classes (cluster
designations [CD]) of monoclonal antibodies have been discovered which recog-
nize distinct human differentiation antigens. Many of these monoclonal antibodies,
labeled with various fluorochromes, are commercially available in large quantities.
The flow cytometer also permits the study of large numbers (typically 10,000 to
30,000) of individual cells in a short period so that objective, quantitative data is
obtained. Furthermore, many different cellular parameters can be simultaneously
detected and recorded (ie, multiparametric analysis), and different cell popula-
tions can be separated or sorted in a functionally intact state for further study. Very
small numbers of leukemic cells also can be detected, far beyond the sensitivity of
conventional techniques. The analysis of small numbers of cells is important, not
only in the initial diagnosis of leukemia, but also in treated patients, where the
presence of residual or recurrent leukemia can be detected before the reappearance
of clinical symptoms. The recent World Health Organization (WHO) classifica-
tion of the acute leukemias, published in the monograph Pathology and Genetics
of Tumors of the Haematopoietic and Lymphoid Tissues, incorporates non-
morphologic data, including flow cytometry, and is followed in this article
(Fig. 1) [10].
R.S. Riley et al / Hematol Oncol Clin N Am 16 (2002) 245–299246
Flow cytometric analysis of large numbers of patients with hematopoietic
neoplasms revealed either maturation shifts or distribution shifts in blood cells. A
‘‘maturation shift’’ is the presence of a discrete population of cells expressing
immature surface antigens that normally disappear when the cell reaches the
mature state. Such a finding in hematopoietic cells suggests that the cells have
arrested at one stage of development. One such differentiation antigen is CD10
(cALLA), which is present on B-lymphocytes very early in development, but is
later lost. Since CD10+ cells are present in fewer than 16/1,000,000 cells in the
peripheral blood of normal individuals, CD10 has proven to be a very useful
marker for the diagnosis of precursor B-cell acute lymphoblastic leukemia (ALL)
and for detecting early relapse in precursor B-cell ALL. Another example is
CD1a that is present on thymocytes only during the phase when the cells exhibit
intermediate differentiation. The presence of large numbers of these cells in the
peripheral blood is very useful in the diagnosis of precursor T-cell ALL. A
maturation shift also can be detected by the presence of an early surface marker
that normally persists on the mature cells, while later surface markers are absent.
An example of this type of maturation shift is seen in B-lymphocytic malig-
nancies that demonstrate CD19 but lack CD20.
A ‘‘distribution shift’’ is the presence of a marked expansion of a population
of cells expressing mature surface antigens. Thus, the presence of a large
population of B lymphocytes with IgGk surface markers is indicative of
malignancy if cells with IgGl surface markers are present in normal numbers
or suppressed. This concept of ‘‘monoclonality’’ forms the basis for the
diagnosis of many hematopoietic neoplasms. Distribution shifts are very help-
ful when the cell population in question is normally low in number, (eg,
B-lymphocytes in the peripheral blood [about 20% of the lymphocytes] or in the
lymph node [about 40% of the lymphocytes]). Thus, if 95% of the peripheral
Fig. 1. World Health Organization classification of acute leukemia, 2001.
R.S. Riley et al / Hematol Oncol Clin N Am 16 (2002) 245–299 247
blood lymphocytes are immunophenotypically identified to be B-lymphocytes,
one can assume a diagnosis of malignant lymphoproliferative disorder of B-cell
type until proven otherwise. The interpretation of distribution shifts is much
more difficult if the cell population in question normally comprises the great
majority of the cells; eg, T-lymphocytes in the peripheral blood (about 80% of
the lymphocytes). Thus, if 95% of the peripheral blood lymphocytes are
immunophenotypically identified to be T-lymphocytes, one cannot assume a
diagnosis of malignant lymphoproliferative disorder of a T-cell type unless other
data are in support of such a diagnosis. The increase in the percentage of the
T cells could simply be within the reference range or represent a response to an
inflammation. Distribution shifts are much more suggestive of malignancies
when the increase in percentage of a cell population is also associated with a
marked increase in the absolute number of those cells, eg, 95% of the peripheral
blood lymphocytes exhibit a T-cell phenotype in a patient with a lymphocyte
count of 30,000/mL.
Technical considerations in clinical immunophenotypic analysis
The correct immunological classification of an acute leukemia or other
hematologic neoplasm requires strict application of the principles of flow cyto-
metric diagnosis as discussed by Dr. McCoy in this issue. Knowledge of the
technical capabilities and limitations of the flow cytometer is essential, as well
as proper specimen collection and preparation, accurate instrumental analysis,
appropriate quality control, accurate data interpretation, and prompt reporting of
the results in a format that is complete and easy to comprehend. The requesting
physician must understand the clinical utilization of flow cytometry and how the
results of an analysis can benefit a particular patient. The laboratory performing
the analysis must have well-maintained instrumentation, a thorough and up-to-
date procedure manual, an adequate number of well-trained and experienced
personnel, quality reagents, and a comprehensive scheme of quality control [11].
Cost-efficient flow cytometric analysis of neoplastic hematologic specimens
requires that each request be examined in light of the clinical and laboratory
findings and the morphological features of the peripheral blood, bone marrow or
other patient specimen. Flow cytometric analysis must then be conducted with
consideration of one or more definitive questions to be answered. Finally, the
data should be reviewed in light of the other clinical and laboratory findings
and additional studies performed or recommended if the initial questions are
not answered.
Flow cytometric analysis of any specimen requires the following steps:
� Specimen collection and transportation� Cell preparation and purification� Fluorescent probe application (staining)
R.S. Riley et al / Hematol Oncol Clin N Am 16 (2002) 245–299248
� Instrument analysis (data collection) and data storage� Data interpretation and reporting
Specimen collection and transportation
The successful outcome of a flow cytometric study begins with proper
specimen collection and prompt delivery of the specimen to the laboratory. To
order the appropriate assay and oversee the delivery of the proper specimen,
the physician must have complete information regarding the clinical utilization
of flow cytometry, specimen requirements, specimen delivery, and the operation
of the laboratory performing the analysis. The test requisition, whether written
or computerized, should include complete specimen demographic information,
the identity of the requesting physician, the identity of the assay being
requested, and some basic clinical information. A personal consultation with
a pathologist knowledgeable in flow cytometric analysis may be required in
complex clinical cases. The person collecting the specimen must be adequately
trained and knowledgeable about specimen requirements and any special col-
lection instructions for the assay ordered. Venipuncture should be performed as
described in NCCLS standard (H3-A4; Collection of Diagnostic Blood Speci-
mens by Venipuncture), with utmost regard for the safety of the phlebotomist
[11,12].
Each specimen container must be labeled with the name and identification
number of the patient, the date and time collected, the type of specimen, and
the initials of the person collecting the specimen. A completed requisition
form or electronic request with pertinent information must accompany the
specimen. Since cell autolysis and loss of surface markers occurs after spec-
imen collection, either prompt specimen analysis or preservation for later
analysis is required. Generally, cell viability and antigen expression are
maintained for at least 24 hours in peripheral blood or bone marrow cells
at room temperature in a collection tube containing heparin, ethylenediamine-
tetraacetic acid (EDTA), or acid citrate dextrose (ACD). Solid tissue and body
fluid specimens can also be transported or stored for a short period of time,
provided they are diluted with an equal volume of sterile RPMI containing 5%
fetal calf serum (RPMI/5% FCS), 100 U/mL of penicillin, and 100 mg/mL of
streptomycin [13]. If there is a delay in analysis longer than 24 hours, physical
separation of the cell population under investigation and cryopreservation in
liquid nitrogen is recommended. Specimen requirements for flow cytometric
analysis depend upon the cellularity of the specimen, the viability of the cells
in the specimen, and the type of analysis performed. Approximately 1 � 106
cells/mL (100,000 total) are required for each monoclonal antibody (or
antibody mixture) utilized in the analysis or for the determination of DNA
content. Under conditions of normal cellularity, 10 to 20 mL of peripheral
blood, 3 to 4 mL of bone marrow, or 0.5 gm (0.5 � 1 cm) of tissue will
provide adequate cells for most immunophenotypic panels. However, since
cytogenetic analysis, molecular studies, microbiologic cultures, and other
R.S. Riley et al / Hematol Oncol Clin N Am 16 (2002) 245–299 249
studies are usually performed in conjunction with flow cytometric analysis,
planning is required to assure an adequate total specimen volume and proper
sample collection.
Cell preparation and purification
The preparation of a specimen for flow cytometric analysis requires the
formation of a single cell suspension, the removal of cells that may interfere
with the analysis and the assessment of specimen adequacy. During this process,
cell viability and antigenicity must be maintained and the selective loss of cell
subpopulations must be avoided. Methods of specimen preparation that minimize
manipulation of the specimen are recommended to achieve these goals.
Fluorescent probe application
All immunofluorescent staining procedures require knowledge of several
factors that may influence the results. Assuming proper specimen collection,
storage and preparation for staining, the cells are stained with properly chosen
fluorescent-labeled monoclonal antibodies and incubated under appropriate
conditions. Dual-color immunophenotypic analysis is employed by some laborato-
ries for flow cytometric analysis of immunophenotypic specimens, but three- or
four-color analysis is highly recommended for cost efficiency and accurate analy-
sis of complex cell populations [2].
Generally, the laboratory should use the minimal number of monoclonal
antibodies to answer the clinical question under consideration. Unfortunately,
each patient is unique and there is no single staining panel for every clinical
circumstance. Monoclonal antibody selection for hematologic neoplasms requires
review of clinical information and other laboratory data, the specimen quantity
and quality, available laboratory resources, and other factors. For example,
monoclonal antibodies specific for CD3, CD7, CD10, CD13, CD14, CD19,
CD33, CD34, CD45 and HLA-DR antigens are adequate for the identification of
most acute leukemias [14,15]. However, additional antibodies are sometimes
necessary. Antibodies specific for T-cell antigens (ie, CD1a, CD2, CD5, CD4,
CD8) should be included in the presence of a mediastinal mass or suggestive
cellular features such as nuclear cleaving. Platelet-specific antibodies (ie, CD41,
CD61) should be used in the case of a leukemia with undifferentiated or
‘‘megakaryoblastic’’ features. Antibodies specific for surface heavy and light
chains should be included for a case with FAB-L3 morphology. Other B-cell-
specific antibodies (ie, anti-CD20, -CD22, -CD79a, and -IgM) may be necessary
to evaluate some B-ALLs. Other helpful antibodies include those that recognize
CD16, CD56, CDw65, CD117, TdT and cytoplasmic CD3. Anti-glycophorin-A
or anti-CD36 antibodies are extremely helpful in bone marrow specimens
containing erythroblasts, which are difficult to separate physically or electron-
ically from immature leukocytes. The simultaneous analysis of cell-surface and
intracellular antigens can be performed if the cell membrane is permeabilized
R.S. Riley et al / Hematol Oncol Clin N Am 16 (2002) 245–299250
before the addition of flourochrome-labeled monoclonal antibodies [16–31].
Unfortunately, the routine analysis of intracellular antigens by clinical flow
cytometry laboratories has been limited by technical difficulties, poor repro-
ducibility between laboratories, and difficulty in interpretation of the results.
Table 1 is a summary of the antigens commonly studied in flow cytometric
immunophenotypic analysis of hematopoietic neoplasms.
Instrument analysis and data storage
The analysis of a fluorochrome-labeled single cell suspension requires the
following steps:
� Turn on laser, computer, and electronics.� Check system pressure and vacuum gauges.� Check optical alignment, fluorescence standardization and color compen-
sation of instrument.� Test antibody integrity by verifying quality control samples.� Prepare and run specimens.� Analyze and store all data.
In the flow cytometer, labeled cells or other particles (microorganisms,
chromosomes, coated beads, etc) are aspirated by a sample probe into a flow
chamber where, under slight pressure, they are directed into a stream of fast
moving sheath fluid (non-fluorescent saline solution). The pressure of the sheath
fluid against the cell suspension aligns the cells in single file (hydrodynamic
focusing). Inside the flow chamber, the cells pass through a sensing area where a
laser beam (argon ion, krypton, helium-cadmium, helium-neon, etc) or other
high intensity light source (mercury arc, etc) is precisely focused. The intensity
of light deflected from the cell surface (forward angle light scatter [FALS]) and
internal structures or granules (side scatter [SS] or right angle light scatter
[RALS]) gives information about cell size, morphology, internal structure,
viability and granularity. Any fluorescent dyes attached to the cells are excited
by the laser light energy and emit fluorescence. Several photodiodes placed at
different angles to the detection zone measure light intensity and the resulting
electrical signals are amplified and passed to a computer for further processing
(Fig. 2). This process is accomplished at very low flow rates (typically 5000
cells/second).
Graphical representation of flow cytometric data is necessary to determine the
number and interrelationship of the cell populations which are present, to assess
the adequacy of the information, and to select the appropriate method for
additional graphical or statistical analysis. The basic forms of graphic repre-
sentation in flow cytometry include the two dimensional display (X-Y display,
scatter gram, ‘‘dot plot’’) and histogram (frequency distributions) (Fig. 3).
Multiparametric analysis is one of the most important capabilities of the flow
cytometer. At present, nearly all flow cytometers in clinical laboratories have the
R.S. Riley et al / Hematol Oncol Clin N Am 16 (2002) 245–299 251
Table 1
Characteristics of human leukocyte antigens for hematologic diagnosis
Antigen Normal cellular expression Major diagnostic application Biological function
Representative
commercial
antibodies
CD1a Cortical thymocytes, dendritic
reticular cells, langerhans cells
Precursor T-cell ALL and some
lymphoblastic lymphomas.
MHC class I-like molecule, associated
with b-2-microglobulin. May have
specialized role in antigen presentation,
including delivery of signals for
lymphocyte activation.
Postulated role in thymic
T-cell development.
T6, Leu6
CD2 T cells, thymocytes, NK cells Hematopoietic neoplasms of
T-cell lineage.
Sheep erythrocyte rosette receptor. LFA-3
(CD58) ligand. Adhesion molecule, can
activate T-cells.
T11, Leu5b, 9.6
CD3 T cells, thymocytes Hematopoietic neoplasms of
T-cell lineage.
Associated with the T-cell antigen
receptor. Required for cell surface
expression of and signal transduction
by TCR.
T3, Leu4
CD4 Thymocyte subsets, helper
and inflammatory T cells,
monocytes, macrophages
Sezary cell leukemia and some
hematopoietic neoplasms of
T-cell lineage.
Coreceptor for MHC class II molecules.
Binds lock on cytoplasmic face of membrane.
Receptor for HIV-I and HIV-2 gp120.
T4, Leu-3a
CD5 T cells, thymocytes,
B cell subset
B-CLL and most hematopoietic
neoplasms of T-cell lineage.
CD72 ligand Signal transduction through
antigen-specific receptor complex.
T-cell activation,
T1, Leu1,
T101, 10.2
CD7 Pluripotential hematopoietic cells,
thymocytes, major T-cell subset,
NK cells, early myeloid cells,
Hematopoietic neoplasms of
T-cell lineage.
T-and NK-cell activation. Leu9, 3A1, WT 1
CD8 Cytotoxic T cells, thymocyte
subsets, NK cells
Hematopoietic neoplasms of
T-cell lineage.
Coreceptor for MHC class I molecules.
Binds lck on cytoplasmic face of membrane.
Regulates function of CD3/TCR complex
T8, Leu2a
R.S.Riley
etal/Hem
atolOncolClin
NAm
16(2002)245–299
252
CD10 Early B lymphocytes, PMNs
B- and T-cell precursors, bone
marrow stromal cells
Precursor B-cell ALL and non-
Hodgkin lymphomas of follicular
cell center origin.
CALLA. Zinc metalloproteinase.
Neutral endopeptidase
CALLA, J5
CD11b Monocytes, granulocytes,
NK cells
Myelomonocytic leukemias,
particularly of FAB M4 and
M5 subclasses.
Mac-1. Cell adhesion molecule. Subunit
of integrin CR3 (associated with CD18).
Binds CD54, complement component
iC3b and extracellular matrix proteins.
MAC-1, CR1,
Mo1, OKM1
CD11c Myeloid cells, monocytes Hairy cell leukemia and related
hematopoietic neoplasms.
Cell adhesion molecule. Subunit of
integrin CR3 (associated with CD18).
Binds fibrinogen
Leu-M5
CD13 Myelomonocytic cells Leukemias of myeloid lineage. Zinc metalloproteinase. Aminopeptidase N My7, LeuM7
CD14 Myelomonocytic cells Myelomonocytic leukemias,
particularly of FAB M4 and
M5 subclasses.
Receptor for complex of LPS and
LPS binding protein (LBP)
LeuM3, Mo2, My4
CD15 Granulocytes, monocytes,
endothelial cells
Hodgkin’s lymphoma, other
hematopoietic neoplasms.
Lewis-x (Lex) antigen. Branched
pentasaccharide, expressed on
glycolipids and many cell surface
glycoproteins. Sialylated form is a
ligand for CD62E (ELAM).
Leu M1, My1
CD16 NK cells, granulocytes,
macrophages
Hematopoietic neoplasms of
NK-cell lineage.
FcgRIII. component of low affinity
Fc receptor (FcgRIII). Mediates
phagocytosis and ADCC.
OKNK,
Leu-11a,b,c
CD19 Pan B-cell antigen Precursor B-cell ALL and non-
Hodgkin lymphoma of
B-cell lineage.
Forms complex with CD21 (CR2)
and CD81 (TAPA-1). Coreceptor for
B-cells. Regulation of B-cell activation
B4, Leu12
CD20 B-cell antigen Precursor B-cell ALL and
non-Hodgkin lymphoma of
B-cell lineage.
Ca ++ channel, B-cell activation? B1, Leu16
CD21 Mature B cells, follicular
dendritic cell
Leukemia and lymphoma diagnosis. C3d/EBV-receptor (CR2). Coreceptor
for B-cells (with CD19 and CD81)
B2, CR2
(continued on next page)
R.S.Riley
etal/Hem
atolOncolClin
NAm
16(2002)245–299
253
Table 1 (continued )
Antigen Normal cellular expression Major diagnostic application Biological function
Representative
commercial
antibodies
CD22 Mature B cells Leukemia and lymphoma
diagnosis. Cytoplasmic CD22
is B cell lineage-specific antigen.
Cell adhesion molecule. Ig-mediated
adhesion of B-cells monocytes, T cells.
B3, Leu14, SHC11
CD23 Activated B cells, activated
macrophages, eosinophils,
follicular dendritic cells, platelets
Leukemia and lymphoma
diagnosis.
Low affinity receptor for IgE (Fc+RII).
Ligand for CD19:CD21:CD81 coreceptor.
Leu-20, B6
CD24 B cells, granulocytes Leukemia and lymphoma
diagnosis.
Possible human homologue of mouse
Heat Stable Antigen (HSA) or J11d.
BA-1
CD25 Activated T cells, activated
B cells, monocytes
Hairy cell leukemia, ATL/L,
other hematopoietic neoplasms.
TAC Interleukin 2 receptor alpha chain. TAC
CD30 Activated B-and T-cells Hodgkin’s lymphoma, anaplastic
large cell lymphoma.
Ki-1 Growth factor receptor. Ki-1, Ber-H2
CD33 Myeloid cells myeloid
progenitor cells, monocytes
Leukemias of myeloid lineage. Sialic acid adhesion molecule. My9, LeuM9, L4F3
CD34 Hematopoietic precursors,
capillary endothelium
Leukemias of early myeloid
lineage, lymphoblastic lymphoma.
Ligand for CD62 (L-selectin). HPCA-2, My10
CD36 Platelets, mature monocytes
and macrophages,
microvascular endothelial cells,
mammary endothelial cells,
during stages of erythroid cell
development and on some
macrophage derived
dendritic cells.
Erythroleukemia (AML, FAB-M6).
Reticulocyte pathophysiology.
Glycoprotein IV. Cell adhesion molecule
in platelet adhesion and aggregation,
platelet-monocyte and platelet-tumor cell
interaction. Scavenger receptor for oxidized
LDL and shed photoreceptor outer segments.
Recognition and phagocytosis of apoptotic
cells. Cytoadherence of Plasmodium
falciparum-infected erythrocytes.
FA6-152
CD38 Early B- and T-cells, activated
T cells, germinal center
B cells, plasma cells
Plasma cell dyscrasias, some
non-Hodgkin’s lymphomas.
Leukocyte activation. Leu17, T10
R.S.Riley
etal/Hem
atolOncolClin
NAm
16(2002)245–299
254
CD41 Megakaryocytes, platelets Acute leukemia of megakaryocytic
lineage (AML, FAB-M7).
aIIb integrin. Associates with CD61
to form GPIIb. Binds fibrinogen,
fibronectin, von Willebrand factor
and thrombospondin
GpIIbIIIa, PL-273
CD42b Megakaryocytes, platelets Acute leukemia of megakaryocytic
origin (AML, FAB-M7).
GPIb, vWF receptor. Binds von
Willebrand factor and thrombin.
Essential for platelet adhesion.
GP1b, FMC-25
CD43 T cells, myeloid cells, some
B cell lymphomas
Some T-cell lymphoproliferative
diseases.
Leukosialin, sialophorin binds CD54
(ICAM-1).
Leu22
CD45 Panhematopoietic All hematopoietic neoplasms. Leukocyte common antigen. Tyrosine
phosphatase, augments signalling through
antigen receptor of B-and T-cells.
T200, LCA
CD45RA B cells, T-cell subsets (naive
T-cells) monocytes
Isoforms of CD45 containing the
A exon.
2H4
CD45RO T-cell subsets, B-cell subsets,
monocytes, macrophages
isoform of CD45 containing none of
the A, B and C exons.
UCHL-1
CD55 Widespread cellular
distribution, hematopoietic
and non-hematopoietic cells
Absent or deficient in paroxysmal
nocturnal hemoglobinuria (PNH).
Decay Accelerating Factor (DAF).
Complement activation inhibitor. Binds
C3b, disassembles C3/C5 convertase
DAF
CD56 NK cells Hematopoietic neoplasms of
NK-cell lineage.
NKH-1. Cell adhesion molecule.
Isoform of Neural Cell Adhesion
Molecule (NCAM).
NKH-1, Leu19,
N-CAM
CD57 NK cells, subsets of T cells,
B cells and monocytes
Hematopoietic neoplasms of NK-cell
and T-cell lineage.
HNK-1. Oligosaccharide, found on
many cell surface glycoproteins.
HNK-1, Leu7
CD59 Many hematopoietic cells Absent or deficient in paroxysmal
nocturnal hemoglobinuria (PNH).
Protectin, Mac inhibitor. Complement
inhibitor. Binds comlement components
C8 and C9 to block assembly of
membrane attack complex.
MIRL
CD61 Megakaryocyte platelets,
megakaryocytes, macrophages
Acute leukemia of megakaryocytic
origin (AML, FAB-M7).
Integrin b3 subunit, associates with
CD41 (GPIIb/IIIa)(fibrinogen receptor)
or CD51 (vitronectin receptor).
Plt GPIIIa, 10-P61,
Y2/51
(continued on next page)
R.S.Riley
etal/Hem
atolOncolClin
NAm
16(2002)245–299
255
Table 1 (continued )
Antigen Normal cellular expression Major diagnostic application Biological function
Representative
commercial
antibodies
CD79a B cells (lineage specific) Hematopoietic neoplasms of
B-cell lineage.
Components of B cell antigen receptor,
required for cell surface expression and
signal transduction.
Mb-1
CD95 Widespread distribution Apo-1, Fas, TNF-like ligand. Transmits
apoptosis signal.
APO-1, Fas
CD103 Intestinal epithelial
lymphocytes Intraepithelial
lymphocytes, 2–6% of
peripheral blood lymphocytes
aE integrin. HML-1
CD117 Blast cells of myeloid lineage,
mast cells
Acute myeloid leukemias. c-kit. Stem Cell Factor (SCF) receptor.
Critical for stem cell survival and
progenitor cell replication/differentiation
17F11, 95C3,
YB5.BB
HLA-DR B cells, monocytes, activated
T cells, myeloid precursors
Hematopoietic neoplasms HLA Class II recptor. HLA-DR. Ia
Glycophorin A Erythrocytes, erythroid
precursors
Erythroleukemia (AML, FAB-M6). Glycophorin A, 10F7
TdT Lymphoblasts, thymocytes,
myeloblast subset
Acute leukemia and lymphoblastic
lymphoma
TdT
Myeloperoxidase
Data from Protein Reviews on the Web. CD MOLECULES. Human cell surface molecules recognized by the International Workshops on Human Leukocyte
Differentiation Antigens.http://www.ncbi.nlm.nih.gov/PROW/guide/45277084.htm.
R.S.Riley
etal/Hem
atolOncolClin
NAm
16(2002)245–299
256
capacity to simultaneously record and analyze three or four fluorescence signals
along with forward and right angle light scatter. The multiparametric capability of
the flow cytometer is often needed to analyze clinical specimens, which are rarely
Fig. 2. Immunophenotypic analysis of an acute leukemia by flow cytometry. (a) Fluorochrome-labeled
monoclonal antibody solutions are added to a cell suspension from a peripheral blood, bone marrow
aspirate, or lymph node. The tubes are incubated at room temperature for a short period. (b) The labeled
cell suspensions are passed through the flow cell of a flow cytometer. Many flow cytometers are
automated, but some models require the operator to process the tubes individually. More than 10,000
cells from each tube are typically analyzed to produce statistically valid information. (c) Each cell
passes individually through the highly focused laser beam of the flow cytometer, a process termed
single cell analysis. The fluorochrome of each labeled monoclonal antibody attached to the cell is
excited by the laser light and emits light of a certain wavelength. The cells also scatter light at multiple
angles. Photodetectors placed a forward angle and at right angles to the axis of the laser beam collect the
emitted or scattered light. Forward and right angle scatter signals, and as many as five fluorochrome
signals can be detected from each cell (multiparametric analysis). (d) The signals from each photodiode
are digitized and passed to a computer for storage, display, and analysis. Typically, all data recorded
from each cell is stored, for possible later recall for further analysis (‘‘list mode data storage’’). (e) A
variety of histograms for visual display can be generated automatically or at the discretion of the
operator. List mode data can also be transferred to a separate computer for analysis. Presently, most
commercial flow cytometers utilize a standardized file format for list mode storage, and a variety of
computer programs are commercially available for data analysis and display.
R.S. Riley et al / Hematol Oncol Clin N Am 16 (2002) 245–299 257
homogenous in nature, and most often are comprised of mixtures of normal and
neoplastic cells. The process of ‘‘gating’’ is used to identify one or more cell
populations of interest in a specimen and to electronically separate them from
normal cell populations, clinically nonrelevant cell populations or contaminants.
The proper gating of a neoplastic population is a subjective process that requires
knowledge of the normal cell composition of the specimen under analysis and
the proper combination of electronic signals. Generally, a graphic display of the
Fig. 3. Scattergram versus histogram display of flow cytometric data. The data is from a patient with
childhood ALLwith a B-cell phenotype. (a) The dual parametric scattergram shows the intensity of light
emission from FITC-labeled anti-CD10 (x-axis, log scale) and PE-labeled anti-CD19 (y-axis, log scale).
Each dot represents the data obtained from a single cell. In this case, the cells show bright, relatively
uniform expression of both CD10 and CD19, generating a tightly clustered dot pattern. (b) Single
channel histogram showing CD10 expression for the cells that were analyzed. The intensity of CD10
expression is shown on the x-axis (log scale), while the y-axis shows the number of cells showing each
level of brightness (linear scale). In this case, the ALL cells brightly express CD10 and generate a
homogenous peak.
R.S. Riley et al / Hematol Oncol Clin N Am 16 (2002) 245–299258
relevant light scatter and fluorescence signals are examined, the cell population(s)
of interest are identified and their boundaries are electronically demarcated with
circular, ovoid or polygonal boundaries (‘‘bitmaps’’). Then, the specimen is
further analyzed to provide specific information about the cells in each gate.
Electronic gating is essential for the efficiency of clinical flow cytometric
analysis, since large numbers of specimens can be analyzed without the need
for time consuming physical separation of cell populations prior to staining. Most
flow cytometers permit the simultaneous delineation of three or more cell
populations for gated analysis. Fortunately, flow cytometric data can be stored
in a ‘‘list mode’’ format so, if necessary, one can modify the original gates and
digitally reanalyze data later.
Any parameters acquired by the flow cytometer can be used as a signal for
electronic gating. From the late 1970s until the 1990s, most clinical flow
cytometers could acquire only two fluorescence signals in addition to forward
angle and side-scatter. At that time, gating was usually performed using forward
angle light scatter verses right angle light scatter for the selection of neoplastic
cell populations. However, leukemic blasts and normal lymphocytes often fell
into the same area of the histogram display and could not be separately gated for
analysis. The availability of three-color flow cytometers and the discovery that
leukemic blasts nearly always show less intense CD45 expression changed the
method of gating for leukemic analysis. Stelzer and associates, and later Borowitz
and collaborators, and Sun et al showed that a gating strategy combining CD45
expression versus RALS was far superior to FALS versus RALS for the identifi-
cation of leukemic cell populations in peripheral blood or bone marrow specimens
Fig. 3 (continued ).
R.S. Riley et al / Hematol Oncol Clin N Am 16 (2002) 245–299 259
[32–34]. Furthermore, CD45 was combined with multiple pairs of fluorescein
isothiocyanate (FITC) and phycoerythin (PE)-conjugated monoclonal antibodies
for three-color analysis of antigen expression in the specimens (Fig. 4). A recent
review of this technique has been published [35].
Data analysis, interpretation, and reporting
With full knowledge of the clinical facts, and the personal assurance of
adequate data collection and analysis, the flow cytometric histograms are
examined and interpreted with reference to the clinical question. During this
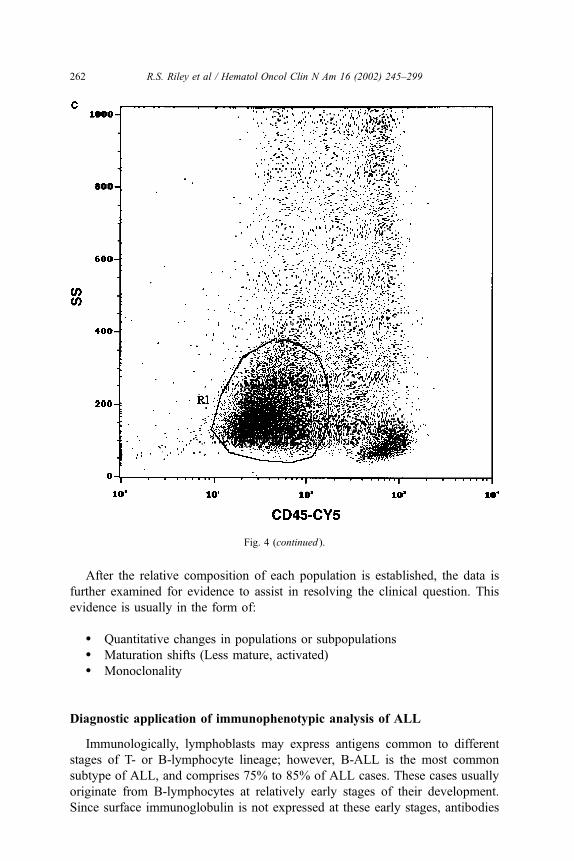
Fig. 4. Scattergrams of a bone marrow aspirate from a patient with ALL. (a) A scattergram of forward
angle light scatter (FALS, x-axis) vs. side scatter (SS, y-axis) shows a relatively homogenous cell
population with FALS and SS. (b) A scattergram of CD45 fluorescence intensity vs side scatter
permits the discrimination of blast cells (dim CD45 expression) from mature lymphocytes (bright
CD45 expression). The scattered cells with high side scatter and variable CD45 brightness are myeloid
cells. (c) A polygonal gate has been drawn for gated analysis of the blast cell population.
R.S. Riley et al / Hematol Oncol Clin N Am 16 (2002) 245–299260
process, the following questions should be answered for each cell population that
was identified:
� How many cell populations are present in the cell suspension? What is the
relative proportion of each?� How and to what degree do the cell populations differ from one another?� What classification group does each cell population fit? Are the cells
leukocytes? Are the cells of T-lymphoid, B-lymphoid, or myelomono-
cytic lineage?� What maturation antigens are present?� Do the light scatter properties and histological properties of the cells
correlate with their immunophenotypic features?� Are additional markers or laboratory procedures required for further
delineation of the cells?
Fig. 4 (continued ).
R.S. Riley et al / Hematol Oncol Clin N Am 16 (2002) 245–299 261
After the relative composition of each population is established, the data is
further examined for evidence to assist in resolving the clinical question. This
evidence is usually in the form of:
� Quantitative changes in populations or subpopulations� Maturation shifts (Less mature, activated)� Monoclonality
Diagnostic application of immunophenotypic analysis of ALL
Immunologically, lymphoblasts may express antigens common to different
stages of T- or B-lymphocyte lineage; however, B-ALL is the most common
subtype of ALL, and comprises 75% to 85% of ALL cases. These cases usually
originate from B-lymphocytes at relatively early stages of their development.
Since surface immunoglobulin is not expressed at these early stages, antibodies
Fig. 4 (continued ).
R.S. Riley et al / Hematol Oncol Clin N Am 16 (2002) 245–299262
against a series of B-specific antigens have been especially useful in the study
and diagnosis of these leukemias.
Precursor B-Cell ALL
The diagnosis of B-ALL primarily relies on the reactivity of two monoclonal
antibodies, CD19 and HLA-DR. Antibodies against the CD19 antigen have been
especially helpful because CD19 is the earliest B-lineage-specific antigen presently
known and it precedes the appearance of HLA-DR, CD10, CD20 and other
B-specific antigens. Lack of reactivity with CD19, for all practical purposes, rules
out a B-lineage of the leukemia. CD19 is present from the time of B-lineage
commitment of the hematopoietic stem cell through the stages of pre-B and mature
B-cell differentiation [36]. It is finally down regulated during terminal differenti-
ation of the B-lymphocyte into the plasma cell. Since CD19 expression is
maintained during B-cell neoplastic transformation, CD19 expression is useful
in diagnosis of leukemias and lymphomas of B-cell lineage [36,37]. Engagement of
the CD19 receptor leads to the activation of the Src family tyrosine kinase LCK
(p56lck), enhanced tyrosine phosphorylation of multiple substrates, and activation
of protein kinase C [38]. CD79a is useful in the rare B-cell malignancy with
equivocal CD19 expression [5,39]. Intense HLA-DR reactivity is very commonly
seen in B-ALL, most acute myelocytic leukemias and in a significant minority of
T-cell malignancies. For this reason, a negative reaction with HLA-DR is more
informative than a positive one in the diagnosis of B-ALL. The other monoclonal
antibodies against the B-cell related surface markers (such as CD10, CD20, CD21,
CD22, CD24, CD79a, cytoplasmic immunoglobulins, and surface immunoglobu-
lins) are useful in confirming B-lineage and in subclassification of the leukemia.
Equally important in the diagnosis of B-ALL is a lack of reactivity with T-lymphoid
and myeloid cell surface markers. The use of monoclonal antibodies to all three
main cell lines (B-lymphoid, T-lymphoid, and myeloid) in the evaluation of all
acute leukemias is critical in view of the frequently reported cases of acute leu-
kemia that demonstrate surface markers from more than a single cell line (Fig. 5).
The CD10 (cALLA) antigen, found commonly in childhood B-cell leukemia, is
an especially useful marker of leukemic cells in blood or CSF, since it is present
only on a very small fraction of normal cells. By multiparametric analysis,
approximately one cALLA+ cell among 100,000 normal lymphocytes can be
detected, providing a sensitive technique for the early detection of most childhood
leukemias. The level of CD10 expression is of prognostic significance, since it
correlates with chromosomal abnormalities. High CD10 levels (> 3� 104/cell) are
characteristic of hyperdiploidy, low CD10 levels (1.8–4� 103/cell) correlate with
a translocations between chromosomes 1 and 19 [t(1;19)], and undetectable CD10
levels (<1.2� 103/cell) are common in ALL patients with a translocation between
chromosomes 4 and 11 [t(4;11)(q21;q23)] translocation [40]. Rearrangement of the
IGH genes and the expression of CD15 are also characteristic of CD10� (PreB1)
ALL [41]. Aberrant overexpression of CD10 is found in nearly 44% of ALL cases,
and is maintained during disease relapse [40]. Children with precursor B-ALL and
R.S. Riley et al / Hematol Oncol Clin N Am 16 (2002) 245–299 263
the common t(12;21)(p13;q22) fusion gene (ETV6/AML1) show more intense
expression of the CD10 and HLA-DR antigens, and less intense expression of the
CD20, CD45, CD13, and CD34 antigens than t(12;21)� patients [42].
Adult patients with B-ALL and the BCR/ABL gene rearrangements [ie,
Philadephia chromosome, t(9;22)(q34;q11.2)] show a unique immunotphenotype
characterized by relatively bright and homogenous CD10 and CD34 expres-
R.S. Riley et al / Hematol Oncol Clin N Am 16 (2002) 245–299264
sion, aberrant CD13 expression, and dim, heterogenous expression of CD38 [43].
Table 2 summarizes many of the known correlations between immunophenotypic
characteristics and chromosomal abnormalities.
Flow cytometric determination of terminal deoxynucleotidyl transferase (TdT)
has also proven useful in the differentiation of reactive and lymphoblastic cells.
Unfortunately, TdT is technically more difficult to analyze than cell surface anti-
gens because of its intranuclear location. Presently, TdT analysis requires cellular
permeabilization with diethylene glycol-based red blood cell lysing solution, sapo-
nin, detergent, methanol, or other agents prior to staining with fluorochrome-
labeled anti-TdTmonoclonal antibodies [44–48]. Under these circumstances, flow
cytometric analysis of TdT was found to be rapid, reproducible, objective and
reliable in clinical practice. In a comparative study with other methods, TdT
analysis by flow cytometry was found to be 100% concordant with the results
obtained by the biochemical TdT assay, immunoperoxidase determination and
fluorescence microscopy [49]. Rare cases of T-ALL are negative for TdT.
Precursor T-Cell ALL
Leukemias of T-lineage (T-ALL) comprise 15% to 25% of ALL cases.
Clinically, most patients are older males who present with high peripheral blast
counts and mediastinal masses. Flow cytometric diagnosis of T-ALL is more
difficult than that of B-ALL for the following reasons:
� Demonstration of ‘‘monoclonality’’ is not as comfortably achieved in
T-ALL as it is in B-ALL where the cells could carry a single immuno-
globulin light chain kappa or lambda.� Markers that are detected only in the early phases of T-cell maturation
and are absent in mature T cells (eg, CD1b) are few and occur uncom-
monly in T-ALL as compared to the relatively more common occur-
rence of similar markers (eg, CD10 or cytoplasmic immunoglobulins)
in B-ALL.� HLA-DR is commonly absent in T-ALL but its occurrence in B-ALL is
very helpful because its reaction with anti-DR antibody is much more
intense in immature cells than in mature B-cells.
Fig. 5. Immunophenotypic analysis of a three-year-old female with ALL of B-cell lineage. (A)
Photomicrograph of the bone marrow showing a cluster of blast cells with fine chromatin texture,
inconspicuous nucleoli, and small amounts of cytoplasm. The blasts show FAB-L1 morphology by the
FAB classification scheme. (B) A histogram of CD45 expression versus side scatter showing a poly-
gonal gate. Approximately 76% of the total cell population showed the dim CD45 expression
characteristic of blasts and were included in the gate. (C) A scattergram of CD14 (x-axis) and CD34
expression (y-axis). The majority of the cells (83%) showed moderately bright CD34 expression, but
CD14 is negative. (D) A scattergram of CD10 (x-axis) and CD19 expression (y-axis) showing bright
dual expression of these antigens by more than 90% of the gated cells. (E) A scattergram of CD20
(x-axis) and CD5 expression (y-axis) showing heterogenous CD20 expression and negative staining
for CD5 by the gated cells.
R.S. Riley et al / Hematol Oncol Clin N Am 16 (2002) 245–299 265
Table 2
Correlations between immunophenotype characteristics and chromosomal abnormalities
Chrosomal abnormality Phenotypic characteristics Oncogene Frequency Clinical features
Hyperdiploid karyotype B-lineage immunophenotype.
Bright CD10 expression, grooved
or radially segmented blast nuclei
(Rieder’s cells).
— 2–9% adult
ALL patients.
Younger age at diagnosis.
Normal white blood count.
Hypodiploid karyotype Common ALL immunophenotype
with either FAB-L1 or
FAB-L2 morphology.
— 4–9% adult patients Younger patients, unfavorable
prognosis
Near tetraploid
karyotype
Precursor T-cell phenotype, L2
morphology, expression of
myeloid-associated antigens
(CD13, CD15, CD33).
— Older age at diagnosis
Normal karyotype T-lineage immunophenotype
in 18–38%
None 15–34% adults Intermediate age and white
blood count. Variable prognosis.
Tetraploid karyotype Frequent T-lineage
immunophenotype.
— Relatively good prognosis.
del(6p), del 6(q) Frequent T-lineage
immunophenotype.
5–10% of chromosomally
abnormal ALL cases, sole
change in two-thirds
Relatively good prognosis.
t(1;14)(p32;q11) T-ALL T-ALL, tald rearrangement.
CD1-CD2 +CD4-CD7+CD10-
phenotype
(Stage 1 thymic differentiation).
TAL-1/TCR 20% Good prognosis
t(1;19)(q23;p13) Pre-B ALL. FAB L1/L2 phenotype.
TdT+CD9+CD10+(dim)CD19 +
CD22 +HLA-DR+. Absence of CD20,
CD34, and myeloid-associated
antigens. Cytoplasmic Ig mu
expressed in most cases (C mu+).
E2A/PBX1 fusion
transcript in C mu+ cases
25% children, 3% adults Young age, low white blood
counts, unfavorable prognosis.
R.S.Riley
etal/Hem
atolOncolClin
NAm
16(2002)245–299
266
t(2;16)(p11.2;p11.2) B-lineage ALL. FAB-L1
phenotype. Low hyperdiploidy
(47–49 chromosomes) with
structural abnormalities.
? First noted in childhood ALL.
Variable WBC, high incidence
of relapse, poor prognosis
t(4;11)(q21;q23) Pre-B immunophenotype
(CD19 +CD24dimCD10-CD20-
/cylgM-sIgM-). Expression of
myeloid-associated antigens
(CD15, CDw65+).
IgH rearrangement.
AF4/MLL > 10% ALL
(50% infants, 3–7% adults).
Mostly female patients. Very
high white blood count, CNS
involvement, and very
poor outcome.
t(4;11)(q21;p14-15) FAB-L1 morphology. CD2,
CD5, CD7, CD10 (CALLA),
CD34, and HLA-DR. Frequent
expression of CD33.
Rearrangement of immunoglobulin
heavy- chain genes.
?
t(8;14)(q11.2;q32) CD10+ B-precursor phenotype ? Rare Children
t(8;14)(q24;q32)
t(8;14)(q24;q11)
t(2;8)(p12;q24)
Mature B-ALL, FAB-L3
phenotype
C-MYC/IgK 100% (ALL, FAB-M3),
5% all ALLs
t(9;22)(q34;q11.2) FAB-L2 morphology. Precursor
B-cell phenotype [TdT +CD10+
CD34 +CD38+ (dim)] with
expression of myeloid-associated
antigens. Deletion of chromosome
7 in 25% of childhood ALL
with t(9;22).
BCR/ABL 5% children, 10–30% adults Older patients with high white
blood count at presentation. Very
poor prognosis.
t(10;14)(q24;q11),
other t(14q11-q13)
translocations
Frequent T-lineage
immunophenotype.
NOX11/TCR 4–6% adult
ALL patients.
Favorable outcome
t(11;14)(p13;q11) T-ALL RHOM-2/TTG2 10%
(continued on next page)
R.S.Riley
etal/Hem
atolOncolClin
NAm
16(2002)245–299
267
Table 2 (continued )
Chrosomal abnormality Phenotypic characteristics Oncogene Frequency Clinical features
11q23 translocations
[t(4;11). t(1;11),
t(11;19)]
Early B-cell ALL ALL-1 (HRX) 5% adults,
70% infants
( < 18 months)
Extremely poor prognosis
t(11;19)(q23;p13) Pre-B immunophenotype
(CD19+ and Tdt+) with
expression of CD13 and CD33.
Heavy chain immunoglobulin
gene rearrangement. Mixed
myeloid/lymphoid lineage.
MLL Mostly in
male infants.
‘‘Hand-mirror’’ morphology,
predominately female patients
with an indolent course
t(12;21)(p13;q22) + Bright CD10 and HLA-DR
expression and relatively dim
expression of CD20, CD45,
CD135, and CD34. Heterogenous
CD34 expression. Lack of
CD9 expression
TEL/AML-1 > 20% of
precursor B-ALL.
Excellent prognosis.
t(14;18)(q32;q21) Pre-B phenotype without
expression of cytoplasmic or
membranous Ig. Frequent
complex chromosomal and
molecular abnormalities
involving at least the BCL-2
and c-MYC genes. Frequent
chromosomal abnormalities,
including translocation t(8;14)
and deletion of chromosome 9.
Ig heavy chain
(IgH)/BCL-2
Rare ALL patients.
80% of adults with
non-Hodgkin’s lymphoma
of follicular center cell origin.
Acute clinical presentation.
Nodal and/or extranodal disease,
massive bone marrow
infiltration and rapid increase
of circulating blast cells
of mature B cell phenotype.
High incidence of neuro-meningeal
relapse. Very poor prognosis.
R.S.Riley
etal/Hem
atolOncolClin
NAm
16(2002)245–299
268
� It is difficult to demonstrate distribution shifts in T-ALL because, T cells
are the dominant type of lymphocyte in most normal specimens. An
exception is the lymph node, where T lymphocytes comprise about 60% of
the total cell population.� The presence of almost a single subtype of T cell (CD4 or CD8) can be
seen in a number of non-malignant conditions.
There are several combinations of T-cell and T-cell related lymphocytic cell
surface markers that assign a T-cell lineage with varying degrees of certainty
(Fig. 6). As with all other immunophenotypic analysis, the clinical as well as
other investigational findings are an extremely important component of the final
diagnosis. Some of these combinations are described below:
� An almost unique population of cells showing positive reactions with CD7,
CD1a, CD3 and/or CD2, with cells showing simultaneous positivity with
CD4 and CD8, and with negative reactions to B-lymphocytic and
myelomonocytic cell surface markers is diagnostic of acute T-ALL in
any tissue except in thymus where the thymocytes normally express CD1a
and dual marking with CD4 and CD8 during their maturation.� An almost unique population of cells showing positive reactions with CD7,
CD3 and/or CD2, and negative reactions with CD4 and CD8, as well as
with B-lymphocytic and myelomonocytic cell surface markers also is
diagnostic of acute T-ALL in any tissue, including in thymus.� An almost unique population of cells showing positive reactions with
CD7, CD3 and/or CD2, CD4, or CD8, and with negative reactions with
B-lymphocytic and myelomonocytic cell surface markers is strongly sug-
gestive of acute T-ALL in any tissue, including the thymus. Since a CD4 or
CD8 phenotype can be a very dominant feature in many other situations, this
combination of markers should be evaluated with great caution. A marked
increase in CD8 lymphocytes to the point of outnumbering the CD4 positive
cells is less commonly seen than a CD4 domination because the CD8
positive T cells are normally much less numerous than the CD4 positive
cells. Marked CD8 domination over CD4 positive cells can be seen in HIV
infections, especially with superimposed opportunistic infections, and in
some other viral infections. Marked CD8 domination over CD4 positive
cells can be seen in Hodgkin’s disease and several autoimmune disorders.� An almost unique population of cells showing positive reactions with only
CD7 and with negative reactivity with CD3, CD2, CD4 and CD8 as well
as with B-lymphocytic and myelomonocytic cell surface markers is diag-
nostic of T-ALL provided sufficient number of B-lymphocytic and myelo-
monocytic cell surface markers have been used to rule out the presence of
other types of leukemias that display CD7.
The most sensitive marker for T-ALL appears to be the pan-T 40 kd antigen
defined by anti-Leu-9 (CD7). This marker has been detected in T-ALL with
R.S. Riley et al / Hematol Oncol Clin N Am 16 (2002) 245–299 269
Fig. 6. Immunophenotypic analysis of a 22-year-old male with ALL of T-cell lineage. (A) Photo-
micrograph of the bone marrow showing a cluster of blast cells with fine chromatin texture, incon-
spicuous nucleoli, and small amounts of cytoplasm. (B) A histogram of CD45 expression versus side
scatter showing a polygonal gate enclosing the CD45-dim blast cells. Approximately 99% of the total
cell population showed the dim CD45 expression characteristic of blasts and were included in the gate.
(C) A dual parameter scattergram of CD10 (x-axis) and CD19 expression (y-axis) showing a lack of
expression of either antigen by the gated cells. (D) A scattergram of CD20 (x-axis) and CD5 expression
(y-axis) showing moderately bright relatively homogenous CD5 expression and negative staining
for CD20 by the gated cells. (E) A scattergram of CD7 (x-axis) and CD33 expression (y-axis) show-
ing moderately bright relatively homogenous CD7 expression and negative staining for CD33 by the
gated cells.
R.S. Riley et al / Hematol Oncol Clin N Am 16 (2002) 245–299270
frequencies of greater than 95% to 100% [50–52]. Because of this high incidence
of CD7 positivity in T-ALL, a diagnosis of this type of leukemia should not be
made in the absence of CD7 positive cells. On the other hand, the presence of
CD7 positive blasts is by no means synonymous with a diagnosis of T-ALL,
because a large number of acute leukemias of B-lymphocytic and myelocytic
lineage have been associated with the expression of CD7 on the cell surface.
Zutter et al found as many as 26% of patients with acute myelocytic leukemias to
express CD7 [53]. Other authors have also reported a significant percentage of
acute leukemias that demonstrate CD7 (often with other T-cell markers) with
either intralineage or interlineage pattern. These observations emphasize the
following concepts in the diagnostic approach to T-ALL:
� A diagnosis of T-ALL should be made with great caution in the absence of
reactivity with CD7.� A diagnosis of T-ALL should generally be made when other T cell markers
(eg, CD2, CD3, CD5) are also present in addition to the CD7 antigen.� CD5 and CD2 are expressed in most cases of T-ALL.
Although this classification attempts to represent various levels of T-cell
maturation, Roper et al found no unique clinical features among the subgroups
and no difference in remission duration or survival [54].
Rare leukemias and lymphomas are derived from large granular cell/natural
killer cell (LGL/NK) precursors. The nomenclature of these neoplasms is less
than adequate, but they have been considered a subset of the LGL lymphopro-
liferative diseases, which include T-LGL leukemia (CD3+), NK-LGL leukemia
(CD3�), and LGL lymphocytosis (CD3� or +). Clinically NK-LGL leukemias
are aggressive neoplasms usually found in adults with extranodal involve-
ment. L2 lymphoblast-like morphology is present, with variable cell size,
round to moderately irregular nuclei, prominent nucleoli, and pale cytoplasm
without granules [55–57]. The usual phenotype is CD3�CD7±cytoplasmic
CD3±CD16�CD33+CD34+CD45�CD56+MPO�HLA-DR±TdT�. Germline
configurations of the T-cell receptor beta and gamma chain genes and Ig heavy
chain gene are usually present. Scott et al isolated a punitive precursor cell
common to myeloid and NK-cell lineages, and proposed the term myeloid/natural
killer cell acute leukemia for these neoplasms [58]. In infants, the blastic
cytologic features of the blast cells can be mistaken for conventional small,
round, blue cell tumors [59]. NK-LGL leukemias have been reported to arise in
patients with altered immune systems, including those undergoing solid organ
transplantation and those with chronic myelogenous leukemia, non-Hodgkin’s
lymphoma, essential thrombocythemia, and midline lethal granuloma [60–66].
T-LGL leukemias are rare neoplasms with monocytic features, which have been
mistaken for acute monocytic leukemia or hairy cell leukemia. The character-
istic immunophenotype is CD2+CD3+CD4CD8±CD11b+CD45+CD56+CD38+
[67,68]. Most of these tumors appear to have a relatively benign clinical course,
but aggressive forms have been described [67].
R.S. Riley et al / Hematol Oncol Clin N Am 16 (2002) 245–299 271
Diagnostic problems in immunophenotypic analysis
The vast majority of childhood and adult leukemias can be clearly assigned a
lymphoid or non-lymphoid lineage by immunophenotypic analysis. However, the
situation is more complex in cases of morphologically difficult or undifferentiated
leukemias, when ‘‘unusual’’ patterns of phenotypic expression are found, when
the results of immunophenotype do not correlate with other data, or in cases of
disease relapse. The differentiation between the major variants of precursor-B- and
T-ALL can also be a difficult problem. Under these circumstances, correlation of
the immunophenotypic results with morphology and other clinicopathologic and
laboratory features, and careful consideration of the relative significance of
immunophenotypic evidence, usually permits the correct lineage to be identified.
Correlation of FAB morphology and immunophenotype
A common misconception about clinical flow cytometry is that an absolute
‘‘correlation’’ exists between morphology and immunophenotype, so that immu-
nophenotypic analysis is often requested with the expectation of resolving
ambiguities in the morphologic interpretation (ie, AML, FAB-M4 versus -M5,
AML, FAB-M1 versus -M2, etc.). Unfortunately, there is no absolute correlation
between surface antigen expression and morphologic appearance [69]. The
closest correlations arise in the L3, M3, M6, and M7 leukemias, which have
distinctive morphology and phenotype. The remaining FAB categories show
characteristic immunophenotypes but ALL, FAB-L1 cannot be differentiated
from ALL, FAB-L2 by immunophenotype, nor can an AML, FAB-M1 from an
FAB-M2, or an AML, FAB-M4 from an M5. The subject is further complicated
by the presence of aberrant antigen expression (see below). These facts should be
provided to physicians who have unrealistic expectations from immunopheno-
typic analysis. Cytogenetic analysis may be helpful in these cases.
A few investigators have specifically examined the diagnostic effectiveness of
flow cytometric immunophenotypic analysis in leukemia diagnosis. These studies
revealed that ALLs can be successfully differentiated from ANLLs by morpho-
logy alone in 55% to 70% of cases, while an accurate lineage assignment could
be determined in >92% of cases by the addition of immunophenotypic analysis
[70–73]. Cytogenetic analysis, ultrastructural myeloperoxidase and platelet
peroxidase analyses were necessary for definitive diagnosis in a few cases.
Cytogenetic information contributed essential information, but it did not affect
immediate diagnosis or treatment. Surprisingly, the gene rearrangement studies
did not yield essential data in any case and in a few cases contributed equivocal
data. Another study of interobserver variability in leukemia diagnosis revealed a
concordance between observers of 63% for Wright-stained preparations alone,
89% for morphology and cytochemical stains, and 99% for light microscopy,
cytochemical stains, and immunophenotypic data [72–75].
Several new classification systems of acute leukemia have been proposed that
actively incorporate immunophenotypic data. For example, the French Groupe
R.S. Riley et al / Hematol Oncol Clin N Am 16 (2002) 245–299272
d’Etude Immunologique des Leucemies (GEIL) proposed a scoring system in
which individual markers in the B-, T- and myeloid-lineages are assigned weights
of 1.5, 1.0. or 0.5 points. Lineage assignment requires a score of at least two and
additional differentiation criteria are applied to T- and B-ALLs [69,76].
Aberrant antigen expression
Recently, as immunophenotypic analysis has been routinely applied to the
diagnosis of acute leukemias, ‘‘aberrant’’ cases have been reported which do not
fit into a normal immunologic classification scheme of leukocyte development, or
do not correspond to known stages of normal lymphoid development. Thus,
aberrant (‘‘variant’’, ‘‘unusual’’) antigen expression is the unexpected (but
reproducible and technically valid) expression of an antigen on a single leukemia
cell line, the lack of expression of an expected antigen, or the presence of two or
more distinct leukemia clones with different phenotypes [37,77]. These include
intralineage aberrance, myeloid antigen expression in T- and B-cell leukemias,
T-cell antigen expression in leukemias of B-cell lineage, lymphoid antigen
expression in non-lymphoid leukemias, etc. Generally, � 20% of lymphoblasts
must express the ‘‘unexpected’’ antigen under consideration to be deemed
significant. Some flow cytometric studies using large panels of monoclonal
antibodies have revealed that the majority of patients with ALL have at least one
incidence of aberrant antigen expression, and as many as two-thirds have two or
more aberrant phenotypes. Other studies have revealed a much lower incidence of
aberrant antigen expression, probably reflecting differences in immunopheno-
typic technique, monoclonal antibody specificity, and analytic methods among
different laboratories [78,79]. For example, CD45 blast gating was reported to
show a higher incidence of aberrant antigen exertion than the conventional
forward scatter/side scatter gate [80]. Ross and collaborators analyzed 39 adult
ALLs using a panel of 21 moAbs and found only two examples of cross-lineage
antigen expression.
However, intralineage aberrance was much more common, with about 50%
of B-precursor ALL cases and most cases of T-ALL deviating from normal
B-lineage or T-lineage marrow cells [81]. The authors concluded from the high
incidence of immunophenotypic heterogeneity that aberrant differentiation is
frequently involved in leukemogenesis [81].
Recent studies using three- or four-color immunophenotypic analysis have
confirmed a high incidence of immunologic aberrance in ALL. A recent study of
264 consecutive de novo precursor-B-ALL cases, using standardized flow cyto-
metric protocols and reagents from laboratories in six countries (European
BIOMED-1 Concerted Action), revealed immunopenotypic aberrance in nearly
all cases when four or five triple monoclonal antibody combinations were used
[82]. The incidence of cross-lineage antigen expression was 45%, mostly due to
aberrant coexpression of CD13 or CD33. A 91% incidence of immunophenotypic
aberrance was found in T-ALL. In a similar recent study, phenotypic aberrations
were found in 88% of cases of B-lineage ALL and all T-ALL patients. Two or more
R.S. Riley et al / Hematol Oncol Clin N Am 16 (2002) 245–299 273
aberrancies were found in 75% of patients. Overall, there was a 50% incidence of
lineage infidelity, a 68% of asynchronous antigen expression, a 4% incidence of
antigen overexpression, and a 28% incidence of ectopic phenotype [78].
Explanations for the origin of unexpected phenotypes vary [83,84]. Some may
represent malignant transformation of early ‘‘normal’’ multipotent hematopoietic
cell populations or rare subpopulations of ‘‘normal’’ progenitor cells which
coexpress antigens of different lineages (ie, ‘‘mixed lineage’’, ‘‘multiple lineage’’,
etc). Others may represent aberrant stemlines that reflect abnormal patterns of
differentiation (ie, ‘‘lineage infidelity’’, ‘‘lineage promiscuity’’, etc). The terms
‘‘asynchronous antigen expression’’, ‘‘biphenotypic leukemia’’, ‘‘metachronous
leukemia’’, ‘‘leukemias of indeterminate lineage’’, ‘‘multiple lineage reactivity’’,
‘‘immunophenotypic aberrance’’, ‘‘marker discrepancy’’, ‘‘ectopic antigens’’, etc
also have been used by different investigators [37,81,85–88].
Regardless of their origin and nomenclature, these cell populations often pose
difficulties in the interpretation of flow cytometric data. Fortunately, certain
patterns of aberrant antigen expression have been described, and common
principles of interpretation can be applied. The prognostic significance of unusual
antigen expression in acute leukemia is controversial, partially because of the
lack of large-scale studies. Definitions of various terms used for aberrant antigen
expression are presented in Table 3.
Aberrant antigen expression in B-ALL
The co-expression of myeloid cell surface antigens found in approximately
30–45% of children and adults with B-lineage ALL, and these neoplasms are
termed myeloid surface antigen-positive (My+) ALL [82,89,90]. The expression
of T-lineage antigens is less common in B-ALL. CD33 was the most common form
of aberrant antigen expression in My+-ALL, followed by CD13, CD11b, and CD7
[228]. A correlation of My+-ALL with CD10 expression and L2 morphology has
been found, while mature B-cell ALL cases are usually negative for myeloid
antigen expression [88,90,91]. Myeloid-associated antigens are most common in
childhood precursor B-cell ALL cases, and have a lower incidence in adult B-ALL
patients. In precursor B-ALL, CD33 was identified by Bradstock et al as the most
common form of aberrant antigen expression (11%), followed by CD13 (5%),
CD11b (4%), and CD7 (2%) [92,93]. The t(9;22) translocation is the most common
cytogenetic finding in My+-ALL, followed by 7q�, abnormalities of 11q with or
without a translocation, 20q�, and �5 [79,90,94,95]. Immunoglobulin heavy
chain gene rearrangements are also common in cases of My+-ALL with T-cell�phenotypes [89].
Subgroups of My+-ALL patients have been found which may have unique
clinical and biologic features. For example, in one study of children with B-ALL,
CD33 expression was identified in 15% at initial diagnosis and in 37% at relapse.
CD33+ patients were statistically older than those without CD33 expression, and
tended to have a poor outcome, although CD33 expression was not an inde-
pendent predictor of survival in multivariate analysis. CD33 expression was
R.S. Riley et al / Hematol Oncol Clin N Am 16 (2002) 245–299274
associated with coexpression of T-cell antigens, including CD2, CD4 and CD7. It
was proposed that CD33+ B-precursor ALL is derived from undifferentiated
hematopoietic cells minimally committed to B-cell lineage and that the more
frequent occurrence of CD33 expression at relapse may reflect clonal evolution or
the expansion of a CD33+ minor clone [96]. Myeloperoxidase positivity was
demonstrated in the bone marrow biopsy material of patients with precursor
B-ALL, utilizing both immunoperoxidase staining and Western blot analysis
[97]. These neoplasms frequently showed CD13 or CD15 coexpression and
evidence of t(9;22) by karyotype or polymerase chain reaction analysis.
Aberrant CD2 expression has been reported in a small proportion ( < 5%) of
patients with precursor B-cell ALL [98,99,100]. Patients with this entity usually
have a good to excellent prognosis. A punitive CD2+CD19+ biphenotypic normal
counterpart has been identified in fetal liver and bone marrow [100,101].
Table 3
Terminology for aberrant antigen expressiona
Term Definition
Asynchronous antigen expression
Intralineage aberrancy
Coexpression expression of early and late
differentiation antigens in abnormal
combinations (usually B-cells)
Biclonal acute leukemia Leukemias arising from separate transformation
events in distinct stem cells (not true hybrid)
Bilineal acute leukemia
Bilineage acute leukemia
Simultaneous distinct populations of leukemia
cells of more than one lineage
(usually one myeloid and one lymphoid)
Biphenotypic acute leukemia
Synchronous mixed-lineage acute leukemia
Leukemia with lineage marked promiscuity at
single cell level (single clone expressing both
myeloid and lymphoid antigens)
Bilineal synchronous acute leukemia Simultaneous distinct populations of leukemic
cells of more than one lineage
Bilineal metachronous (‘‘lineage switch’’)
Metachronous mixed lineage
Development of a new leukemia with a
different phenotype in a patient
(excludes therapy-induced second leukemia)
(usually ALL followed by AML)
Hybrid acute leukemia
‘‘Mixed’’ lineage acute leukemia
Leukemia with co-expressing lymphoid
and myeloid features
(includes biphenotypic and bilineal leukemias).
Balanced co-expression of different
lineage-specific antigens. Usually result from
transformation of a pluripotent cell.
Leukemia-associated phenotype
Lineage infidelity
Ectopic phenotype
Acute leukemias with single aberrant
(‘‘cross-lineage’’) antigen, usually a poorly
specific antigen, includes ALLs with
myeloid-associated antigens and AMLs with
lymphoid-associated antigens
‘‘Minimally differentiated’’
acute leukemia
Leukemias arising from very early myeloid
or lymphoid cells
Mixed lineage acute leukemia
a Modified and updated from [85] and [1,228].
R.S. Riley et al / Hematol Oncol Clin N Am 16 (2002) 245–299 275
Hurwitz et al [229] recently performed detailed immunophenotypic analysis
in 113 cases of B-lineage ALL, and reported the existence of sixteen different
complete immunophenotypes that did not correspond to normal B-cell devel-
opmental stages in the bone marrow. Overall, 78% of the cases showed
‘‘asynchronous’’ combinations of B-cell associated antigens. The authors postu-
lated that the majority of B-lineage leukemias exhibit ‘‘developmental asyn-
chrony’’ as compared to normal B-cells.
Lineage switch in acute leukemia is a rare phenomenon in which the leukemic
cell lineage changes from myeloid to lymphoid, or from lymphoid to myeloid.
Among 89 cases of childhood leukemia in relapse, Stass [102] identified six (7%)
cases of lineage switch documented by cytogenetic and immunophenotypic data.
In five cases the lineage switch was from ALL to ANLL, while one patient
converted from ANLL to ALL. Patients treated with agents specific for the
leukemia phenotype at release readily achieved second remission, while those
treated for the original phenotype failed to achieve remission. Postulated
mechanisms for lineage switch include: (1) eradication of the dominant clone
present at diagnosis, with expansion of a secondary clone with a different
phenotype, and (2) drug-induced changes in the original clone with amplification
or suppression of differentiation programs permitting phenotypic shift [102].
Aberrant antigen expression in T-ALL
A high incidence of intralineage antigen variation has been found in T-ALL. For
example, using triple antigen staining with TdT/CD7/cyCD3 and four other
antibody combinations, the investigators in the European BIOMED-1 Concerted
Action found at least one aberrant pattern 91% of T-ALL cases [103]. In most cases,
the aberrant neoplastic cells were found in areas of the flow cytometric histograms
normally devoid of cells, so that identification of disease persistence and relapse
could be readily identified. Overall, chromosome translocations involving regions
of T-cell receptor genes are present in about 24% of T-cell ALL cases [90]. The
existence of a commonmyeloid/T-lymphoid progenitor cell is suggested by similar
patterns of TCR delta rearrangements in cases of myeloid-positive T-ALL and
lymphoid-positive AML [104]. Interlineage antigen variation is less common in
T-ALL than in B-ALL, but is found in about 10% of T-ALL cases. Among the
reported cases of this phenomenon, HLA-DR is the usual ‘‘promiscuous’’ antigen,
but some cases of myeloid-positive (My+) T-ALL have been reported. For exam-
ple, Nakase et al reported a case of CD7+CD3�CD4+CD8�CD13+CD34+ ALL
(FAB-L2) with germline immunoglobulin heavy chain and T-cell receptor beta,
gamma and delta chain genes. Karyotypic analysis revealed complex abnormalities
involving chromosomes 5 and 7 [105].
Hematogones
Hematogones are B-lineage lymphoid precursor cell populations in the bone
marrow that may simulate acute lymphoblastic leukemia (ALL) or lymphoma.
R.S. Riley et al / Hematol Oncol Clin N Am 16 (2002) 245–299276
These precursor lymphoid cells are homogenous with condensed chromatin and
scant cytoplasm and may account for greater than 50% of bone marrow cells.
They are found in large numbers in normal infants and occasionally in adults in a
variety of hematologic and nonhematologic disorders [106,107].
Hematogones may express an antigen profile similar to that of neoplastic
lymphoblasts (eg, TdT, CD34, CD10, and various pan B-cell antigens); however,
Rimsza et al reported that hematogone-rich lymphoid proliferations exhibit a
spectrum of B-lymphoid differentiation antigen expression with predominance of
intermediate differentiated cells (CD19+, CD10+) and mature B-lineage cells
(surface immunoglobulin), heterogeneity of adhesion molecule expression (CD44,
CD54), and nonclustered bone marrow architectural distribution [107,108]. The
authors found that the expression of CD34, terminal deoxynucleotidyl transferase
(TdT)-positive cells as the smallest subset in a non-clustered pattern [108].
Hematogones, therefore, differ from neoplastic lymphoblasts by displaying a
maturational spectrum of antigen expression, whereas ALL displays an incom-
plete maturational spectrum and antigen aberrance. In addition, there is no
evidence of clonality by either cytogenetic or immunogenetic analysis in hema-
togones and the DNA content is normal. Hence, the expression of any of the pan
B-cell markers in isolation is not synonymous with new onset ALL or relapse.
Muehleck et al noted that TdT-positive cells in the bone marrow of a patient with
ALL in remission following chemotherapy or bone marrow transplantation do not
necessarily denote relapse [109].
The distinction of leukemic blasts from hematogones can be difficult by
morphologic examination alone. Even though hematogones express CD34 and
TdT, albeit in small quantities, this is usually in a non-clustered fashion [108].
Clusters of more than five CD34 and/or TdT-positive cells may be used to
differentiate hematogones from lymphoblasts [110]. However, Kallakury et al
reported that flow cytometric monitoring of post-therapy bone marrow specimens
from patients with precursor B-cell acute lymphoblastic leukemia, is inferior to
polymerase chain reaction (PCR) and concluded that PCR for antigen receptor
gene rearrangements is a valuable and specific tool, helpful in differentiating
hematogones from minimal residual disease in patients with treated ALL whose
bone marrow harbors increased precursor B-cells (hematogones) [111].
Bone marrow regeneration
Because of the toxicity of agents used in preparing the marrow for transplanta-
tion, transplanted marrow requires years to return to a healthy pretransplant state.
The myeloablative and conditioning regimens that purge malignant progenitors
from the marrow also purge and damage non-malignant hematopoietic and
stromal progenitor cells resulting in a diminished capacity for transplanted and
native stem cell renewal [112]. This deficit is not always apparent from exam-
ination of a post-transplant peripheral smear or marrow biopsy. A prolonged,
severe deficiency of erythroid and megakaryocyte marrow progenitors may persist
for many years post-transplant although peripheral blood cells and marrow
R.S. Riley et al / Hematol Oncol Clin N Am 16 (2002) 245–299 277
cellularity have reached pre-transplant levels. Colony forming units-fibroblasts
(CFU-f) the precursor stromal compartment for cells of the osteogenic lineage are
critical to hematopoietic cell survival, proliferation and differentiation. CFU-f
reconstitution may take as long as 12 years to reach pre-transplant numbers and is
solely of host origin [113].
The immediate post-transplant period is usually followed by 2 to 3 weeks of
marked marrow aplasia. By about 14 days post-transplant, aggregates of
hematopoietic precursors may be identified within the marrow. These are single
cell-type clusters of erythroid, myeloid, and undifferentiated colonies [114].
Hematopoiesis post-transplant is usually polyclonal but may be monoclonal
[115]. The kinetics of engraftment in part depends the source of donor cells
(peripheral blood stem cells [PBSC], cord blood, bone marrow), the dose of
infused CD34+ cells, the administration or the withholding of exogenous growth
factors, and HLA cross-matching [116]. The rate of marrow recovery is affected
by the homing efficiency and clonogenic potential of transplanted cells as well as
whether infused cells were expanded in vitro prior to infusion [117]. In vitro
expanded cells appear to have a reduced capacity to locate the marrow as
compared to fresh progenitors, which may compromise their biologic and clinical
utility [118]. G-CSF-mobilized PBSC are coming into wider use as an alternative
to autologous bone marrow transplantation. Trials with PBSC demonstrate earlier
engraftment of neutrophils, platelets, and red cells when using PBSC without an
increased risk of developing acute graft-versus-host disease (GVHD), though the
risk of chronic GVHD however is somewhat increased [119]. Mouse studies
suggest that PBSC transplantation brings about rapid hematopoietic recovery
with partly impaired B-cell immune reconstitution in the first month, and low
helper T-cell numbers for up to 12 months [120].
Evidence of marrow engraftment may be found first in the peripheral blood
and is heralded by the return of high fluorescence reticulocytes (HFR). HFR are
quickly reduced by ablative regimens, yet quickly recover after autologous or
allogeneic bone marrow transplantation before the emergence of neutrophils.
Automated flow cytometric reticulocyte counters are properly used to monitor
rising HFR numbers since manual estimation of their presence and numbers is
unreliable. Failure of mean reticulocyte volume (MRV) and reticulocyte mean
fluorescence intensity (MFI) values for HFR to increase early on post-transplant
may indicate primary graft failure and identify a group of patients who might
benefit from early rescue [121]. Restoration of granulopoiesis occurs more or less
simultaneously with erythropoiesis, reaching full marrow cellularity by 30 days
post-transplant. CD8 T-cells reach pre-transplant levels early and exceed normal
levels during the first several months, whereas CD4 T-cells require six to eight
months to recover. NK cell activity recovers quickly. Non-myeloablative treat-
ment before allogeneic transplantation permits near normal T-cell-dependent non-
MHC restricted mitogenic responses even in the early period after transplant
among patients with hematologic malignancies, while myeloablative condition-
ing results in decreased T-cell mitogenic capacity and slower immune recovery
[122]. Non-myeloablative conditioning also may permit faster development of
R.S. Riley et al / Hematol Oncol Clin N Am 16 (2002) 245–299278
immune response to residual host malignant cells and non-malignant abnormal
hematopoietic cells. B-cell numbers reach pre-transplant levels by the second
month and exceed normal after six to seven months.
Confirmation of engraftment may be achieved by blood cell isoenzyme
studies, determination of red cell antigens, chromosome analysis, and assessment
of immunoglobulin allotypes and DNA restriction fragment length polymor-
phisms. Bone marrow transplant donor-host chimerism may be assessed by PCR
or by analysis of fluorescent labeled variable number of tandem repeats (VNTR)
which appears to offer improved turnaround time, requires less DNA, and
provides superior resolution and sensitivity over the former method [123].
Minimal residual disease
Minimal residual disease (MRD) is the persistence of leukemic cells in the
bone marrow of other tissues after remission induction that is below the limit of
detection by conventional morphologic assessment. Presently, it is believed that
these residual leukemic cells are the possible source of disease relapse in many
patients who achieve ‘‘complete’’ morphologic remission from ALL and other
forms of leukemia. Unfortunately, the clinically relevant level of sensitivity for
MRD detection has not been established, nor has it been documented that
additional therapy to eradicate very small numbers of residual cells improves
survival for patients in clinical and morphologic remission.
Laboratory techniques for the detection of minimal residual disease must meet
four criteria, which include sensitivity (detection limit of at least 10� 3 cells),
specificity (ability to differentiate normal and malignant cells), reproducibility,
and applicability (easy standardization and rapid collection of results) [124,125].
Morphologic evaluation, with an overall detection limit of approximately 5%, is
clearly not suitable for the detection of minimal residual disease [126]. However,
immunophenotypic analysis, cytogenetics, fluorescence in situ hybridization
(FISH), Southern blotting, polymerase chain reaction (PCR), and other techni-
ques with detection limits of 10�2 to 10�4 cells have been applied, as well as the
clonogenic assay, which has a detection limit of � 10�4 [124]. The techniques
and application of minimal residual residual disease have been recently reviewed
by several authors [103,124,127–129].
Flow cytometric analysis is less sensitive than the polymerase chain technique
for MRD, but it is simple and rapid to perform, provides quantitative data, and
has adequate sensitivity in many leukemia cases. The detection of minimal
residual disease in leukemia by flow cytometric analysis is based on the presence
of aberrant immunophenotypic features that are not characteristic of normal cell
populations in the specimen under study. For example, the discovery of CD10+,
TdT+, or CD34+ cells in the cerebrospinal fluid is diagnostic of MRD, since
immature leukocytes with these markers are not normally present in the CSF. The
expression of TdT, cytoplasmic CD3, CD1a, or the dual phenotype CD4+/CD8+
by bone marrow cells is diagnostic of residual MRD in T-ALL, since cells with
these phenotypes are normally confined to the thymus. The detection of B-ALL
R.S. Riley et al / Hematol Oncol Clin N Am 16 (2002) 245–299 279
MRD is more difficult, since small numbers of immature B-cells are normally
present in the bone marrow. The majority of B-ALL cases have aberrant antigenic
features, including cross-lineage antigen expression (ie, TdT, T-cell, or myeloid
antigens), asynchronous antigen expression, or changes in the level of antigen
expression (ie, ‘‘dropped’’ or overexpressed antigens).
Ryan and collaborators were among the first to use multiparametric immuno-
phenotypic analysis for MRD detection in ALL. Utilizing FITC-labeled anti-
CD10 and dual parametric flow cytometry, they were able to detect one CD10+
lymphoblast/100,000 peripheral blood mononuclear cells [130]. Subsequently,
numerous investigators have confirmed the ability of two-color, three-color, and
more recently, four-color immunophenotypic analysis to detect small numbers of
phenotypically aberrant cells in ALL [131–140]. The search for new markers and
techniques of immunophenotypic analysis for MRD is also underway by several
investigators. For example, Weir and co-workers used two four-color combina-
tions of antibodies (CD19-APC/CD45-perCP/CD20-PE/CD10- FITC and CD19-
APC/CD45-perCP/CD9-PE/CD34-FITC) to identify reproducible patterns of
antigen expression in normal bone marrow. When applied to specimens with
precursor B-cell ALL, 81/82 cases (99%) showed cell populations outside of the
normal geometrical regions consistent with MRD. Dilution experiments revealed
a sensitivity of 10�4 [141] Ito et al stressed the superiority of using CD45/SSC
gating rather than FSC/SSC gating for MRD detection, and reported a sensitivity
of 10�5, which was 14-fold higher than the conventional procedure [80]. Chen
and co-workers reviewed a variety of proteins that show significant overexpres-
sion in B-ALL and found MRD estimates with CD58 to correlate well with those
of polymerase chain reaction amplification of immunoglobulin genes [142].
Boccuni and collaborators found dual staining for CD66c and CD10 to differ-
entiate even low percentages of residual leukemic cells (CD10+/CD66c+) from
normal regenerating early-B-cells (CD10+/CD66c�) in CD10+ early-B-ALL
following remission induction [143].
The availability of sensitive techniques for MRD detection has generated large
amounts of data regarding the prognostic significance of small clones of residual
leukemic cells following remission induction. Most of these studies have
demonstrated that MRD detection is a powerful technique for the prediction of
disease progression and outcome. In one study, the presence of � 0.01% at each
time point was associated with a higher relapse rate, with patients having a high
level of MRD at the end of induction or at week 14 showing a particularly poor
outcome. The predictive value of MRD remained even after adjusting for adverse
presenting features [144,145]. Another group evaluated the prognostic signifi-
cance of residual disease after induction therapy and immediately prior to bone
marrow transplantation. There was a 3.28 fold risk of relapse after bone marrow
transplantation in the presence of leukemic lymphoblasts by multidimensional
flow cytometry, even when morphologic evaluation and cytogenetic analysis was
negative [146]. A few studies have not confirmed the prognostic significance of
posttherapy monitoring of bone marrow specimens from patients with precursor
B-cell ALL. Kallakury found no evidence of monoclonally rearranged antigen
R.S. Riley et al / Hematol Oncol Clin N Am 16 (2002) 245–299280
receptor genes in 11 of 14 patients suspicious for MRD by multiparametric flow
cytometric analysis [111]. Furthermore, ten of the 11 patients remained in
remission at 73 months, suggesting that the flow cytometric findings were of a
false-positive nature [111].
Body fluids
Central nervous system (CNS) involvement by acute lymphocytic leukemia is a
significant clinical problem in spite of recent improvement in treatment regimens.
Meningeal disease at initial diagnosis is a risk factor for later CNS and bone
marrow relapse, a poor response to therapy, and decreased survival. In addition,
isolated CNS relapses decrease the chance for survival and require treatment that
has adverse consequences. The identification of leukemic cells in the cerebrospi-
nal fluid (CSF) is a major means of diagnosing meningeal involvement. Conven-
tional cytopathologic examination of Papanicolau-stained cytospin preparations is
the standard technique for the detection of CSF blast cells, but has a significance
incidence of false-negative results [147]. Consequently, there is a great interest in
ancillary techniques, including flow cytometric immunophenotypic analysis and
molecular diagnostic methods, for blast cell identification.
Immunophenotypic analysis of CSF specimens in leukemic patients has relied
upon conventional methods of minimal disease detection in the bone marrow and
other body tissues, including the recognition of maturation shifts, distribution
shifts, and aberrant antigen expression [148–150]. In particular, monoclonal
antibodies specific for TdT have been especially useful for the detection of CSF
B-ALL lymphoblasts, while TdT and CD1a are helpful in cases of T-ALL [151].
These studies have also demonstrated an association of CSF involvement with the
more developmentally mature antigenic phenotypes. In this regard, Donskoy and
collaborators demonstrated that 88% of patients with CSF leukemic involvement
demonstration of the CD22, CD23, cytoplasmic immunoglobulin heavy chain,
and/or surface IgMmarkers [148]. A study using polymerase chain reaction (PCR)
assays of the bone marrow in T-ALL patients with isolated CNS relapse
demonstated a high incidence of submicroscopic involvement, possibly indicating
the bone marrow as the origin of disease resurgence that is first detected clinically
in the CNS [152]. However, another study using multiparametric flow cytometry
and blast colony assays did not confirm this association, suggesting that other
mechanisms may be involved in the etiology of leukemic CNS involvement [153].
Prognostic significance of immunophenotypic analysis of all
Acute childhood leukemia is one of the few success stories in oncology, with a
cure achieved in more than two-thirds of patients with conventional chemother-
apy. Presently, permanent remission (‘‘cure’’) occurs in about 70% of children
with ALL, and 30–40% of those with AML treated with modern chemother-
apeutic regimens [83]. The improvement of treatment outcome in leukemia has
R.S. Riley et al / Hematol Oncol Clin N Am 16 (2002) 245–299 281
increasingly resulted from the identification of subgroups of acute leukemia with
different clinical, immunologic, and prognostic features, and from the application
of subgroup-specific therapy. Although the relationship between the immuno-
phenotype and other cellular features is not completely understood at this time,
surface antigen expression is a major POG (Pediatric Oncology Group) criteria
for the assignment of individual patients to treatment groups in order to predict
prognosis, assess the relative effectiveness of different treatment regimens, and
design leukemia species-specific therapy [154,155]. The significance of the
immunophenotype in adult leukemia is more controversial, and the ‘‘cure’’ rate
is only about 33% [156,157].
Prognostic significance of immunophenotype in B-ALL
Age and leukocyte count at presentation are the most important prognostic
factors for childhood acute leukemia [158]. Although immunophenotypic data is
useful in the context of ALL diagnosis and classification, CD10 is presently the
only leukocyte antigen with independent prognostic significance, or upon which
specific therapeutic decision making is made. At present, the information for all
diagnostic procedures is best used to determine the risk group of the patient, upon
which therapeutic decisions are based. For example, experimental therapies may
be justified for high-risk patients with ALL, while antimetabolite-based therapy
might be employed to minimize long-term sequelae in children in favorable
prognostic groups [158].
CD10 expression
The CD10 antigen commonly regarded as the most prognostically significant
surface marker in childhood B-ALL, where it is used to divide B-precursor cell
ALL into subgroups with excellent and good prognosis; however, not all studies
have confirmed the prognostic significance of CD10 expression. In one large study,
the overall incidence of CD10 expression was 94% in patients with B-lineage ALL
and 40% in T-ALL. Although CD10 expression was associated with favorable
presenting features, including age >1 year, lower leukocyte count (< 50 � 109/L),
or increased DNA content (leukemic cell DNA index >1.16, or hyperdiploidy >50
chromosomes), it had no independent prognostic significance [159]. Children with
weak CD10 have been reported to be older than those strongly expressing CD10,
and to have a significantly higher incidence of splenomegaly [160]. Among adults,
the incidence of CD10+(weak) ALL was significantly higher in female patients;
however, in neither children nor adults was the heterogeneity of CD19 expres-
sion a statistically significant determinant of complete remission rate or disease
free survival.
CD10+CD19+CD34+ immature B-progenitor immunophenotype has been
studied as an independent prognostic factor in childhood ALL. For example, in
a large cohort of 2028 children with ALL, the CD10+CD19+CD34+ was asso-
R.S. Riley et al / Hematol Oncol Clin N Am 16 (2002) 245–299282
ciated with favorable characteristics and slightly better event-free survival for
children with ALL, and a subset of infants with significantly better outcomes [161].
CD20 and CD45 expression
The prognostic significance of the intensity of surface membrane antigen
expression has been extensively evaluated in the Pediatric Oncology Group
(POG) Study. In large cohorts of children with newly diagnosed B-ALL, they
found that both CD45 intensity > 75% and CD20 intensity > 25% correlated with
significantly poorer outcome in children older than one year. In addition, CD45
intensity and CD20 intensity were independent of previously reported poor
prognostic factors, including the National Cancer Institute (NCI) risk group,
ploidy, trisomies of 4 and 10, and adverse translocations including t(1;19),
t(9;22), and t(4;11) [162].
The lack of CD45 expression is a favorable prognostic factor in childhood
B-ALL. This feature has been reported to be associated with an excellent
response to multi-agent chemotherapy, lower leukocyte counts and serum lactic
dehydrogenase levels, hyperdiploidy >50, and a DNA index >1.15 [163]. In this
regard, Ludwig et al attributed the worse prognosis of the pre-pre-B or pre-B
phenotype to the distinct biological (eg, chromosomal aberrations) and clinical
features (eg, high tumor cell load) of these subgroups, and could not confirm the
independent value of immunophenotyping in predicting outcome [157,164,165].
CD34 expression
The expression of the CD34 antigen has been identified as a favorable prog-
nostic factor for both disease-free and overall survival in childhood ALL [166]. In
addition, there was a significant association of CD34 expression with an absence of
extramedullary involvement, lower LDH levels, lower WBC counts, and lower
proliferative activity than CD34-ALL. Although Cascavilla et al [166] did not as-
sociate CD34 expression with clinical outcome in adult ALL, it was identified as an
adverse prognostic factor in adult ALL in a study by Thomas and coworkers [167].
Aberrant antigen expression
B-ALL clones showing inter- or intralineage antigen expression are easy to
detect by multiparametric flow cytometry, and their presence at diagnosis and at
different treatment phases has been extensively evaluated as prognostic indicators.
In general, the presence of interlineage aberrance in ALL appears to be an adverse
prognostic indicator in comparison to patients with monophenotypic lekemias. In
particular, during the past decade a number of investigators using different flow
cytometric staining and analytic techniques have found that myeloid antigen
expression in both childhood and adult ALL significantly correlates with short
disease-free survival, a short duration of first remission, and a high relapse rate at
all treatment phases [88,168–171]. In a recent study of adult patients with
biphenotypic leukemia, it was concluded that their poor prognosis justified a
R.S. Riley et al / Hematol Oncol Clin N Am 16 (2002) 245–299 283
more aggressive treatment procedure, including high-dose AraC or the use of Pgp
modulators for first-line therapy [172]. The association with myeloid antigen
expression in ALL appears weaker, and there is no correlation with no significant
differences observed between conventional and aberrant ALL in the distribution of
sex, age, leukocyte count, hemoglobin concentration, platelet count, blast count,
French-American-British (FAB) type, lymphadenopathy, or organomegaly [170].
In one recent study, the presence of >1% aberrant B-lineage cells in the bone
marrow after induction therapy at two consecutive time-points predicted relapse in
the majority of cases [173]. Hara et al identified CD33 expression as the strongest
univariate predictor of event-free survival in precursor B-cell but did not have
significance in multivariate analysis [96].
Recent advances in ALL therapymay have impacted the prognostic significance
of immunophenotypic features. In one study of adult ALL, in patients treated with
modified CALGB therapy incorporating central nervous system prophylaxis,
cyclophosphamide and the early use of L- asparaginase into the backbone of
daunorubicin, vincristine and prednisone, there were no significant differences
in response rates, remission duration, or survival in those patients coexpressing
myeloid antigens [174]. In T-ALL, the number of T-markers expressed was of
prognostic significance, with patients expressing six or more markers having
significantly longer disease-free survival and survival compared with patients
expressing three or fewermarkers. The Philadelphia chromosomewas significantly
associated with B-LIN ALL cases which coexpressed CD19, CD34, and CD10,
while the majority of t(4;11) cases were CD19+, CD34+ but CD10� [174].
P-Glycoprotein expression
The resistance of tumor cells to one or more chemotherapeutic agents
(chemoresistance) is one of the major obstacles to effective chemotherapy.
Therefore, the discovery of the mechanism through which some tumor cells evade
the effect of multiple chemotherapeutic agents (ie, ‘‘multidrug resistance’’)
generated great interest. Multidrug resistance was first described by Kessel and
collaborators in 1998 [175]. Numerous reports of multidrug resistance were
subsequently detailed in the literature, and laboratory studies suggested that the
phenomenon occurred at the level of the plasma membrane. In 1972, studies by
Dano indicated that the major mechanism of MDR was an energy-dependent
physical extrusion of the drugs from the cell [176]. Subsequent studies by Ling and
coworkers led to the discovery of a class of integral membranes (P-glycoproteins)
as the site of the membrane efflux pump [177,178]. More recently, the amino acid
sequence of P-glycoprotein has been elucidated, and the responsible gene (multi-
drug resistance gene, MDR1) has been identified and cloned [179]. Multidrug
resistance was a common feature of a variety of human tumors, and explains many
cases of incomplete or partial responses to chemotherapy, as well as the chemo-
resistance of recurrent tumors. In some tumors multidrug resistance is a de novo
property of the neoplastic cells, while in other cases it is acquired after trials with
one or more chemotherapeutic agents. MDR expression can be determined by four
R.S. Riley et al / Hematol Oncol Clin N Am 16 (2002) 245–299284
techniques, including flow cytometry, immunocytochemistry, functional assays,
and RT-PCR [180].
In contrast to many other human tumors, P-glycoprotein expression does not
appear to be a significant prognostic indicator. Wuchter et al could not correlate
the functional activity of P-glycoprotein with immunophenotypical subgroups,
response to induction chemotherapy, relapse rate, or overall survival in adults
with ALL, while Kanerva found no correlation with the white blood cell count,
age, sex, cytogenetic characteristics, event-free survival, or overall survival in
childhood ALL [181–183]. However, several different monoclonal antibodies
are available for P-glycoprotein analysis by flow cytometry and/or immunocy-
tochemistry, and multiple techniques have been described for measuring the
functional activity of P-glycoprotein [184–188]. In view of discordant results
among different analytic techniques and different laboratories, standardization of
technology may be needed before definitive conclusions can be reached regard-
ing the prognostic significance of MRD in ALL [189].
DNA index, apoptosis, and cell cycle-associated parameters
The incidence of atypical DNA content in leukemias and other hematologic
neoplasms is lower than in neoplasms of the solid tissues. In ALL, aneuploid
stemlines have been identified in approximately 25% to 50% of reported cases
[190–195]. Many investigators have identified DNA aneuploidy as a favorable
prognostic indicator in childhood ALL. In this regard, Look and collaborators
found ALL patients with a DNA index >1.16 to have a significantly better
outcome than analysis, the DNA index had prognostic significance independent
of other commonly utilized parameters, including leukocyte count, race, and age.
Furthermore, ALL cases with CD10 antigen expression showed a higher
frequency of aneuploid stemlines than CALLA-negative ALL (P < 0.003) or
ANLL (P < 0.001). These investigators found childhood ALL patients with near-
tetraploid stem lines to form a distinct subgroup characterized by an older age,
T-cell immunophenotype, cross-lineage expression of myeloid antigens, FAB-L2
morphology, and a high incidence of relapse or death from disease [196]. High
values for DNA content, RNA content, and proliferative activity were reported in
L3 leukemia/Burkitt’s lymphoma [197].
Nearly all lymphoblasts have been reported to express bcl-2. There are no
apparent fluctuations during the different phases of the cell cycle. High levels of
bcl-2 are associated with CD34 expression in some studies, but bcl-2 expression
was not shown a significant indicator of prognosis in ALL patients by several
investigators [198,199].
Other immunophenotypic parameters
The CD95 (Fas/APO-1) antigen is a 40–50kDa cell surface glycoprotein and a
member of the NGF receptor superfamily that is expressed on a variety of cell
lines, including most leukocytes. Anti-CD95 antibodies induce apoptosis in
R.S. Riley et al / Hematol Oncol Clin N Am 16 (2002) 245–299 285
activated T- and B-cells, NK-cells and thymocytes through the Fas signaling
mechanism [200–202]. The Fas system is an integral part of the normal cell death
machinery, and aberrant CD95 expression may be involved in tumor growth. A
benign autoimmune lymphoproliferation syndrome (ALPS) in humans has been
associated with mutations of CD95 [203]. The CD45 antigen is expressed in T- and
B-cell ALL, with a higher level of expression in T-ALL [204,205]. In pre-B ALL,
CD95 antigen expression on blast cells was a favorable prognostic sign asso-
ciated with CD10 antigen expression and an increased relapse-free and total
survival [206].
The CD9 (BA-2) antigen is a 24–27kDa glycoprotein and a member of the
tetraspanin (TM4) superfamily of membrane proteins [207,208]. The CD9 antigen
has been implicated in cell regulation and aggregation in B-cells and platelets, and
as a regulator of cell motility in a variety of cell lines. The lack of CD9 and CD20
expression (or only partial positivity of these antigens) was reported to be 88%
sensitive and 71% specific for the t(12;21)(p13;q22) translocation and TEL-
AML1 rearrangement, with a positive predictive value of 47% [209].
The adhesion markers include the beta 1-integrins (CD49c, CD49d, CD49e,
CD49f), b2-integrins (CD11a, CD11b, CD11c), CD44, and CD54. The prog-
nostic significance of adhesion marker expression is the topic of several recent
studies. Although Hara and collaborators found the frequencies of CD11a,
CD49f, and CD44 expression to be significantly higher in CD34+ pre-B
childhood ALL than in CD34� pre-B ALL, only CD54 expression had inde-
pendent prognostic significance. The presence of CD54 on the cell surface was an
adverse prognostic factor associated with a poor prognosis. The estimated 5-year
event-free survival was 42.3% for CD54+ B-ALL compared with 70.3% for
CD54� patients (P < 0.05) [210].
Prognostic significance of immunophenotype in T-ALL
In a study sponsored by the Pediatric Oncology Group (POG), recursive
partitioning analysis revealed aWBC level of < 50� 103/mL as the most important
single favorable prognostic factor in childhood ALL [211]. In patients with WBC
levels of < 50 � 103/mL, expression of CD5 was the most important predictor of
event-free survival, whereas expression of the THY antigen was important at
higher WBC levels. Pui and colleagues found CD10 expression to be an
independent prognostic marker in T-ALL, with the lack of CD10 expression in-
dependently associated with an adverse prognosis (P = 0.02) [159]. In their study
of 90 childhood T-ALL patients, there were no differences between CD10� and
CD10+ cases in clinical features or karyotypic patterns, with the exception of a
lower frequency of central nervous system leukemia and a higher frequency of 9p
abnormalities in the former subgroup. CD7+CD4�CD8� acute leukemia is a
distinct clinical subtype of T-ALL with an especially poor prognosis [158]. These
leukemias predominately affect males (< 35 or > 65 years) who present with
mediastinal and/or thymic masses, a high peripheral WBC count, and skin and
CNS involvement [212].
R.S. Riley et al / Hematol Oncol Clin N Am 16 (2002) 245–299286
The prognostic significance of myeloid antigen expression in ALL is contro-
versial. Although it has been identified as an adverse prognostic factor in both
childhood and adult ALL by most investigators, its independent prognostic
significance is doubtful. Bradstock et al found that unusual antigen expression
in precursor B-ALL was a good prognostic marker, while HLA-DR expression in
T-ALL was associated with a poor disease outcome [92,93]. Wiersma and
collaborators [171] found that myeloid-antigen expression significantly decreased
the estimated disease-free survival, while Pui et al [213] found that myeloid
antigen expression had no prognostic significance. In adult patients with ALL,
Boldt et al found that the mortality rate was 85% greater in cases of myeloid
positivity (MY+ ALL) in comparison to conventional ALL [91]. Sulak et al
found that 7 out of 118 cases of adult acute leukemias that were biphenotypic for
myeloid and B- lymphocytic surface markers behaved more aggressively than the
others [88]. Boucheix and collaborators correlated CD10 coexpression in adult
T-ALL with better disease-free survival, compared with the CD10-T-ALL [214].
The T-ALL phenotype CD1�CD2+CD4�CD7+CD10� has been associated
with the t(1;14)(p32;q11), an alteration in the TAL1 gene (tald rearrangement), and
very good to excellent prognosis [215]. A subgroup of CD3+4�8� T-ALL ex-
pressing the gd T-cell receptor has been identified. In contrast to the more common
type of TCRabT-ALL, patients with TCRgd+ leukemia present at a very young age
with very high white blood cell counts, and no mediastinal enlargement [216].
In adult leukemia, older age, high WBC count at diagnosis, non-T-cell
immunophenotype, Philadelphia chromosome (Ph)-positive karyotype, medi-
astinal mass, anemia, CNS involvement, and longer time to achieve remission
have been identified as risk factors for systemic relapse [214]. Unfortunately, one
or more of these features are present in the majority (60–70%) of patients with
adult ALL, with a potential cure rate of 20% to 25%. In contrast, the cure rate is
much higher (20–25%) in the minority without risk factors [217]. Short-term,
dose-intensive therapy that alternates hyperfractionated doses of cyclophospha-
mide with high-dose cytarabine (ara-C) and methotrexate has been advocated for
patients with mature B-ALL, while ara-C/cyclophosphamide combinations dur-
ing maintenance therapy are currently favored for patients with T-cell.
Congenital, infant, and adult ALL are special subtypes that show different
biologic behavior than classic childhood ALL. In infant ALL, Basso and
collaborators correlated event-free survival with older age, relatively low WBC
count (<100,000/mm3), CD10 expression, and the lack of myeloid antigen
expression [218,219]. In adult ALL, risk factors include older age, high present-
ing white blood cell count, non-T-cell immunophenotype, Ph-positive karyotype,
and longer time to achieve remission [214]. In this disease, the expected cure rate
is 20% to 25% for the high-risk group, versus 60% to 70% for patients without
risk factors [214]. Modification of the dose-intensity of induction and consol-
idation-intensification therapy, incorporating new anti-ALL agents into the
regimens, improving autologous BMT results (eg, purging, conditioning regi-
mens), and appropriately using risk-oriented investigational strategies have been
suggested as possible strategies to improve outcome in adult-ALL [220,221].
R.S. Riley et al / Hematol Oncol Clin N Am 16 (2002) 245–299 287
Spath-Schwalbe et al [222] studied ALL in patients >59 years of age. The
following subtypes were identified: common ALL (14/26), T-ALL, six had null-
ALL, three had myeloid antigen-positive ALL with both lymphoid and myeloid
markers, and one had B-ALL. Although 43% of patients treated with chemo-
therapy achieved complete remission, the median survival was only 5 months.
The major reason for the poor outcome was a high mortality during intensive
induction therapy due to toxicity of treatment and a short remission duration
[222]. Congenital leukemia is an aggressive disease that presents at birth or
shortly afterward with a phenotype that can vary [223,224].
Summary and future prospects
ALL is a common hematologic malignancy characterized by the proliferation
of immature lymphoid (blast) cells in the bone marrow. ALL leukemogenesis is
not completely understood, but involves cellular and molecular dysregulation of
the normal process of T- and B-cell growth and differentiation. ALL blast cells are
phenotypically different from normal lymphoid precursors because of the disor-
dered leukemogenesis, although ALL patients show great heterogeneity in the
degree of variation. Until the 1980s, the diagnosis and classification of ALL relied
upon morphology, cytochemistry, and karyotypic analysis in conjunction with
clinical and routine laboratory data. More recently, the information obtained from
multiparametric flow cytometric immunophenotypic analysis has become a
critical part of ALL diagnosis. In addition, immunophenotypic analysis provides
prognostic information not available by other techniques, provides a sensitive
means to monitor the progress of patients after chemotherapy or bone marrow
transplantation, and aids in the detection of minimal residual disease. Multi-
parametric, single cell immunophenotypic analysis by flow cytometry is per-
formed with panels of fluorochrome-labeled monoclonal antibodies that recognize
specific epitopes of different cell surface antigens. Single cell analysis of a
statistically significant number of cells with the flow cytometer permits the
recognition of maturation shifts, distribution shifts, or aberrant antigen expression
that characterizes a leukemic cell population. Flow cytometric immunophenotypic
analysis was initially performed by simultaneously labeling each cell with one or
two different labeled monoclonal antibodies, but recent advances in flow cyto-
metric instrumentation and computer technology now permit simultaneous label-
ing with three, four, or even five monoclonal antibodies per cell. As the
progression of technology continues unabated, reagents and instrumentation under
development today will undoubtedly result in further modifications of acute
leukemia classification and diagnosis. One technology under evaluation at this
time is laser-scanning cytometry, which permits slide-based, individual cell
immunophenotypic analysis, morphologic evaluation, and morphometric studies.
Laser scanning cytometry appears especially useful for the evaluation of fine
needle aspirates and similar specimens where the small number of cells is a major
disadvantage for flow cytometric analysis [225,226]. Eventually, conventional
R.S. Riley et al / Hematol Oncol Clin N Am 16 (2002) 245–299288
flow or slide-based immunophenotypic analysis may be replaced by microarray
analysis or similar techniques may permit the rapid, relatively inexpensive
concurrent determination of more than 50 leukocyte differentiation antigens [227].
References
[1] Lo Coco F, Foa R. Diagnostic and prognostic advances in the immunophenotypic and genetic
characterization of acute leukaemia. Eur J Haematol 1995;55:1–9.
[2] Basso G, Buldini B, De Zen L, et al. New methodologic approaches for immunophenotyping
acute leukemias. Haematologica 2001;86:675–92.
[3] CampanaD, BehmFG. Immunophenotyping of leukemia. J ImmunolMethods 2000;243:59–75.
[4] Huh YO, Ibrahim S. Immunophenotypes in adult acute lymphocytic leukemia. Role of flow
cytometry in diagnosis and monitoring of disease. Hematol Oncol Clin North Am 2000;14:
1251–65.
[5] Lai R, Juco J, Lee SF, et al. Flow cytometric detection of CD79a expression in T-cell acute
lymphoblastic leukemias. Am J Clin Pathol 2000;113:823–30.
[6] Melnick SJ. Acute lymphoblastic leukemia. Clin Lab Med 1999;19:169–86.
[7] Orfao A, Schmitz G, Brando B, et al. Clinically useful information provided by the flow
cytometric immunophenotyping of hematological malignancies: current status and future direc-
tions. Clin Chem 1999;45:1708–17.
[8] Sullivan JG, Wiggers TB. Immunophenotyping leukemias: the new force in hematology. Clin
Lab Sci 2000;13:117–22.
[9] Weir EG, Borowitz MJ. Flow cytometry in the diagnosis of acute leukemia. Semin Hematol
2001;38:124–38.
[10] Jaffe ES, Harris NL, Stein H, et al. Pathology and genetics of tumours of haematopoietic and
lymphoid tissues (World Health Organization Classification of tumours: 3). Lyon, France:
International Agency for Research on Cancer, 2001.
[11] Owens MA, Vall HG, Hurley AA, et al. Validation and quality control of immunophenotyping
in clinical flow cytometry. J Immunol Methods 2000;243:33–50.
[12] Standards. National clinical laboratory: procedures for the collection of diagnostic blood speci-
mens by venipuncture; Approved standard. 4th edition. Wayne, PA: NCCLS; 1987.
[13] Hensleigh PA, Waters VB, Herzenberg LA. Human T lymphocyte differentiation antigens:
effects of blood sample storage on Leu antibody binding. Cytometry 1983;3:453–5.
[14] Braylan RC, Orfao A, Borowitz MJ, et al. Optimal number of reagents required to evaluate
hematolymphoid neoplasias: results of an international consensus meeting. Cytometry
2001;46:23–7.
[15] Macey MG, McCarthy DA, Milne T, et al. Comparative study of five commercial reagents for
preparing normal and leukaemic lymphocytes for immunophenotypic analysis by flow cyto-
metry. Cytometry 1999;38:153–60.
[16] Bardales RH, Al-Katib AM, Carrato A, et al. Detection of intracytoplasmic immunoglobulin by
flow cytometry in B- cell malignancies. J Histochem Cytochem 1989;37:83–9.
[17] Drach D, Drach J, Glassl H, et al. Flow cytometric detection of cytoplasmic antigens in acute
leukemias: implications for lineage assignment. Leuk Res 1993;17:455–61.
[18] Farahat N, van der Plas D, Praxedes M, et al. Demonstration of cytoplasmic and nuclear
antigens in acute leukaemia using flow cytometry. J Clin Pathol 1994;47:843–9.
[19] Glasova M, Konikova E, Kusenda J, et al. Evaluation of different fixation-permeabilization
methods for simultaneous detection of surface, cytoplasmic markers and DNA analysis by flow
cytometry in some human hematopoietic cell lines. Neoplasma 1995;42:337–46.
[20] Gore S, Kastan M, Civin C. Flow cytometric identification of intracellular antigens: detection of
minimal residual leukemia. Bone Marrow Transplant 1990;6(Suppl 1):39–41.
[21] Groeneveld K, te Marvelde JG, van den Beemd MW, et al. Flow cytometric detection of
R.S. Riley et al / Hematol Oncol Clin N Am 16 (2002) 245–299 289
intracellular antigens for immunophenotyping of normal and malignant leukocytes. Leukemia
1996;10:1383–9.
[22] Kappelmayer J, Gratama JW, Karaszi E, et al. Flow cytometric detection of intracellular
myeloperoxidase, CD3 and CD79a. Interaction between monoclonal antibody clones, fluoro-
chromes and sample preparation protocols. J Immunol Methods 2000;242:53–65.
[23] Knapp W, Majdic O, Strobl H. Flow cytometric analysis of intracellular myeloperoxidase and
lactoferrin in leukemia diagnosis. Recent Results Cancer Res 1993;131:31–40.
[24] Konikova E, Glasova M, Kusenda J, et al. Intracellular markers in acute myeloid leukemia
diagnosis. Neoplasma 1998;45:282–91.
[25] Lan HY, Hutchinson P, Tesch GH, et al. A novel method of microwave treatment for
detection of cytoplasmic and nuclear antigens by flow cytometry. J Immunol Methods
1996;190:1–10.
[26] Lanza F, Latorraca A, Moretti S, et al. Comparative analysis of different permeabilization
methods for the flow cytometry measurement of cytoplasmic myeloperoxidase and lysozyme
in normal and leukemic cells. Cytometry 1997;30:134–44.
[27] Pizzolo G, Vincenzi C, Nadali G, et al. Detection of membrane and intracellular antigens by
flow cytometry following ORTHO PermeaFix fixation. Leukemia 1994;8:672–6.
[28] Sartor M, Bradstock K. Detection of intracellular lymphoid differentiation antigens by flow
cytometry in acute lymphoblastic leukemia. Cytometry 1994;18:119–22.
[29] Slaper-Cortenbach IC, Admiraal LG, Kerr JM, et al. Flow-cytometric detection of terminal
deoxynucleotidyl transferase and other intracellular antigens in combination with membrane
antigens in acute lymphatic leukemias. Blood 1988;72:1639–44.
[30] Stewart CC. Clinical applications of flow cytometry. Immunologic methods for measuring cell
membrane and cytoplasmic antigens. Cancer 1992;69:1543–52.
[31] Tiirikainen MI. Evaluation of red blood cell lysing solutions for the detection of intracellular
antigens by flow cytometry. Cytometry 1995;20:341–8.
[32] Borowitz MJ, Guenther KL, Shults KE, et al. Immunophenotyping of acute leukemia by flow
cytometric analysis. Use of CD45 and right-angle light scatter to gate on leukemic blasts in
three- color analysis. Am J Clin Pathol 1993;100:534–40.
[33] Stelzer GT, Shults KE, Loken MR. CD45 gating for routine flow cytometric analysis of human
bone marrow specimens. Ann N Y Acad 1993;677:265–80.
[34] Sun T, Sangaline R, Ryder J, et al. Gating strategy for immunophenotyping of leukemia and
lymphoma. Am J Clin Pathol 1997;108:152–7.
[35] Vial JP, Lacombe F. Immunophenotyping of acute leukemia: utility of CD45 for blast cell
identification. Methods Cell Biol 2001;64:343–58.
[36] Scheuermann RH, Racila E. CD19 antigen in leukemia and lymphoma diagnosis and immu-
notherapy. Leuk Lymphoma 1995;18:385–97.
[37] Sun T, Ngu M, Henshall J, et al. Marker discrepancy as a diagnostic criterion for lymphoid
neoplasms. Diagn Clin Immunol 1988;5:393–9.
[38] Waddick KG, Chae HP, Tuel-Ahlgren L, et al. Engagement of the CD19 receptor on human
B-lineage leukemia cells activates LCK tyrosine kinase and facilitates radiation-induced apop-
tosis. Radiat Res 1993;136:313–9.
[39] Astsaturov IA, Matutes E, Morilla R, et al. Differential expression of B29 (CD79b) and mb-1
(CD79a) proteins in acute lymphoblastic leukaemia. Leukemia 1996;10:769–73.
[40] Lavabre-Bertrand T, Janossy G, Ivory K, et al. Leukemia-associated changes identified by
quantitative flow cytometry: I. CD10 expression. Cytometry 1994;18:209–17.
[41] Lenormand B, Bene MC, Lesesve JF, et al. PreB1 (CD10-) acute lymphoblastic leukemia: im-
munophenotypic and genomic characteristics, clinical features and outcome in 38 adults and
26 children. The Groupe d’Etude Immunologique des Leucemies. Leuk Lymphoma 1998;28:
329–42.
[42] De Zen L, Orfao A, Cazzaniga G, et al. Quantitative multiparametric immunophenotyping in
acute lymphoblastic leukemia: correlation with specific genotype. I. ETV6/AML1 ALLs iden-
tification. Leukemia 2000;14:1225–31.
R.S. Riley et al / Hematol Oncol Clin N Am 16 (2002) 245–299290
[43] Tabernero MD, Bortoluci AM, Alaejos I, et al. Adult precursor B-ALL with BCR/ABL gene
rearrangements displays a unique immunophenotype based on the pattern of CD10, CD34,
CD13 and CD38 expresssion. Leukemia 2001;15:406–414.
[44] Farahat N, Lens D, Morilla R, et al. Differential TdT expression in acute leukemia by flow
cytometry: a quantitative study. Leukemia 1995;9:583–7.
[45] Hechinger MK, Hernandez AM, Barr NJ, et al. A clinical laboratory approach to the evaluation
of terminal deoxynucleotidyl transferase (TdT) by flow cytometry (FCM). J Clin Lab Anal
1994;8:211–8.
[46] Perry A, Duenzl ML, Ansari MQ. Flow cytometric terminal deoxynucleotidyltransferase anal-
ysis. Evaluation of Triton X-100 and methanol permeabilization methods compared with im-
munofluorescence microscopy. Arch Pathol Lab Med 1994;118:1119–22.
[47] Roma AO, Kutok JL, Shaheen G, et al. A novel, rapid, multiparametric approach for flow
cytometric analysis of intranuclear terminal deoxynucleotidyl transferase. Am J Clin Pathol
1999;112:343–8.
[48] Syrjala MT, Tiirikainen M, Jansson SE, et al. Flow cytometric analysis of terminal deoxynu-
cleotidyl transferase. A simplified method. Am J Clin Pathol 1993;99:298–303.
[49] Bardales RH, Carrato A, Fleischer M, et al. Detection of terminal deoxynucleotidyl transferase
(TdT) by flow cytometry in leukemic disorders. J Histochem Cytochem 1989;37:509–13.
[50] Garand R, Vannier JP, Bene MC, et al. Comparison of outcome, clinical, laboratory, and
immunological features in 164 children and adults with T-ALL. The Groupe d’Etude Immu-
nologique des Leucemies. Leukemia 1990;4:739–44.
[51] Link M, Warnke R, Finlay J, Amylon M, Miller R, Dilley J, et al. A single monoclonal antibody
identifies T-cell lineage of childhood lymphoid malignancies. Blood 1983;62:722–8.
[52] Morishima Y, Kobayashi M, Yang SY, Collins NH, Hoffman MK, Dupont B. Functionally dif-
ferent T-lymphocytic subpopulations determined by their sensitivity to complement-dependent
cell lysis with the monoclonal antibody 4A. J Immunol 1982;129:1091–8.
[53] Zutter MM, Martin PJ, Hanke D, et al. CD7+ acute non-lymphocytic leukemia: evidence for an
early multipotential progenitor. Leuk Res 1990;14:23–6.
[54] Roper M, Crist WM, Metzgar R, et al. Monoclonal antibody characterization of surface anti-
gens in childhood T-cell lymphoid malignancies. Blood 1983;61:830–7.
[55] Dunphy CH, Gregowicz AJ, Rodriguez G. Natural killer cell acute leukemia with myeloid
antigen expression. A previously undescribed form of acute leukemia. Am J Clin Pathol
1995;104:212–5.
[56] Prieto J, Rios E, Parrado A, et al. Leukaemia of natural killer cell large granular lymphocyte
type with HLA-DR-CD16–CD56bright+ phenotype. J Clin Pathol 1996;49:1011–3.
[57] Suzuki R, Yamamoto K, Seto M, et al. CD7+ and CD56+ myeloid/natural killer cell precursor
acute leukemia: a distinct hematolymphoid disease entity. Blood 1997;90:2417–28.
[58] Scott AA, Head DR, Kopecky KJ, et al. HLA-DR-, CD33+, CD56+, CD16- myeloid/natural
killer cell acute leukemia: a previously unrecognized form of acute leukemia potentially mis-
diagnosed as French-American-British acute myeloid leukemia-M3. Blood 1994;84:244–55.
[59] Natkunam Y, Cherry AM, Cornbleet PJ. Natural killer cell precursor acute lymphoma/leukemia
presenting in an infant. Arch Pathol Lab Med 2001;125:413–8.
[60] Dekoninck A, Cartuyvels R, Magerman K, et al. Natural killer (NK) cell leukaemia in a patient
with a B cell non- Hodgkin’s lymphoma. Clin Lab Haematol 2000;22:115–7.
[61] Murase T, Suzuki R, Tashiro K, et al. Blast crisis of chronic myelogenous leukemia exhibiting
immunophenotypic features of a myeloid/natural killer cell precursor. Int J Hematol 1999;69:
89–91.
[62] Nagai M, Bandoh S, Tasaka T, et al. Secondary myeloid/natural killer cell precursor acute
leukemia following essential thrombocythemia. Hum Pathol 1999;30:868–71.
[63] NatkunamY,Warnke RA, Zehnder JL, et al. Aggressive natural killer-like T-cell malignancywith
leukemic presentation following solid organ transplantation. Am JClin Pathol 1999;111:663–71.
[64] Okuda T, Sakamoto S, Deguchi T, et al. Hemophagocytic syndrome associated with aggressive
natural killer cell leukemia. Am J Hematol 1991;38:321–3.
R.S. Riley et al / Hematol Oncol Clin N Am 16 (2002) 245–299 291
[65] Soler J, Bordes R, Ortuno F, et al. Aggressive natural killer cell leukaemia/lymphoma in two
patients with lethal midline granuloma. Br J Haematol 1994;86:659–62.
[66] Warzynski MJ, White C, Golightly MG, et al. Natural killer lymphocyte blast crisis of chronic
myelogenous leukemia. Am J Hematol 1989;32:279–86.
[67] Sun T, Cohen NS, Marino J, et al. CD3+, CD4-, CD8- large granular T-cell lymphoproliferative
disorder. Am J Hematol 1991;37:173–8.
[68] Warzynski MJ, Rosen MH, Golightly MG, et al. An acute form of T gamma lymphoprolifer-
ative disease presenting with massive splenomegaly– importance of immunophenotyping for
diagnosis. Clin Immunol Immunopathol 1993;67:100–8.
[69] Bene MC, Castoldi G, Knapp W, et al. Proposals for the immunological classification of acute
leukemias. European Group for the Immunological Characterization of Leukemias (EGIL).
Leukemia 1995;9:1783–6.
[70] Boban D, Sucic M, Markovic-Glamocak M, et al. Correlation of morphological FAB classi-
fication and immunophenotyping: value in recognition of morphological, cytochemical and
immunological characteristics of mixed leukaemias. Eur J Cancer 1993;8:1167–72.
[71] Krause JR, Penchansky L, Contis L, et al. Flow cytometry in the diagnosis of acute leukemia.
Am J Clin Pathol 1988;89:341–6.
[72] Schumacher HR, Shrit MA, Kowal-Vern A, et al. Acute leukemia and related entities. Impact of
new technology. Arch Pathol Lab Med 1991;115:331–7.
[73] Sullivan MP, Pullen DJ, Crist WM, et al. Clinical and biological heterogeneity of child-
hood B cell acute lymphocytic leukemia: implications for clinical trials. Leukemia 1990;4:
6–11.
[74] Browman GP, Neame PB, Soamboonsrup P. The contribution of cytochemistry and immuno-
phenotyping to the reproducibility of the FAB classification in acute leukemia. Blood 1986;
68:900–5.
[75] Neame PB, Soamboonsrup P, Browman GP, et al. Classifying acute leukemia by immunopheno-
typing: a combined FAB- immunologic classification of AML. Blood 1986;68:1355–62.
[76] Garand R, Bene MC. A new approach of acute lymphoblastic leukemia immunophenotypic
classification: 1984–1994 the GEIL experience. Groupe d’Etude Immunologique des Leuce-
mies. Leuk Lymphoma 1994;13:1–5.
[77] Penchansky L, Kaplan SS, Krause JR. Multiple lineage reactivity in childhood leukemia.
Pediatr Pathol 1990;10:217–29.
[78] Garcia Vela JA, Monteserin MC, Delgado I, et al. Aberrant immunophenotypes detected by
flow cytometry in acute lymphoblastic leukemia. Leuk Lymphoma 2000;36:275–84.
[79] Hanson CA, Abaza M, Sheldon S, et al. Acute biphenotypic leukaemia: immunophenotypic and
cytogenetic analysis. Br J Haematol 1993;84:49–60.
[80] Ito S, Ishida Y, Murai K, et al. Flow cytometric analysis of aberrant antigen expression of blasts
using CD45 blast gating for minimal residual disease in acute leukemia and high-risk myelo-
dysplastic syndrome. Leuk Res 2001;25:205–11.
[81] Ross CW, Stoolman LM, Schnitzer B, et al. Immunophenotypic aberrance in adult acute
lymphoblastic leukemia. Am J Clin Pathol 1990;94:590–9.
[82] Lucio P, Gaipa G, van Lochem EG, et al. BIOMED-I concerted action report: flow cytometric
immunophenotyping of precursor B-ALL with standardized triple-stainings. BIOMED-1 Con-
certed action investigation of minimal residual disease in acute leukemia: international stand-
ardization and clinical evaluation. Leukemia 2001;15:1185–92.
[83] Pui CH. Childhood leukemias. N Engl J Med 1995;332:1618–30.
[84] Quijano CA, Moore 2nd D, Arthur D, et al. Cytogenetically aberrant cells are present in the
CD34+CD33–38–19� marrow compartment in children with acute lymphoblastic leukemia.
Leukemia 1997;11:1508–15.
[85] Check IJ, Napoli VM. When is acute lymphoblastic leukemia biphenotypic, hybrid, mixed
lineage, or biclonal? ASCP Immunopathology Check Sample (IP-92) 1991;15:1–6.
[86] Greaves MF, Chan LC, Furley AJ, et al. Lineage promiscuity in hemopoietic differentiation and
leukemia. Blood 1986;67:1–11.
R.S. Riley et al / Hematol Oncol Clin N Am 16 (2002) 245–299292
[87] Kaplan SS, Penchansky L, Stolc V, et al. Immunophenotyping in the classification of
acute leukemia in adults. Interpretation of multiple lineage reactivity. Cancer 1989;63:
1520–7.
[88] Sulak LE, Clare CN, Morale BA, et al. Biphenotypic acute leukemia in adults. Am J Clin Pathol
1990;94:54–8.
[89] Childs CC, Hirsch-Ginsberg C, Walters RS, et al. Myeloid surface antigen-positive acute
lymphoblastic leukemia (My+ ALL): immunophenotypic, ultrastructural, cytogenetic, and mo-
lecular characteristics. Leukemia 1989;3:777–83.
[90] Khalidi HS, Chang KL, Medeiros LJ, et al. Acute lymphoblastic leukemia. Survey of immu-
nophenotype, French- American-British classification, frequency of myeloid antigen expres-
sion, and karyotypic abnormalities in 210 pediatric and adult cases. Am J Clin Pathol
1999;111:467–76.
[91] Boldt DH, Kopecky KJ, Head D, et al. Expression of myeloid antigens by blast cells in acute
lymphoblastic leukemia of adults. The Southwest Oncology Group experience. Leukemia
1994;8:2118–26.
[92] Bradstock KF. The diagnostic and prognostic value of immunophenotyping in acute leukemia.
Pathology 1993;25:367–74.
[93] Bradstock KF, Kirk J, Grimsley PG, et al. Unusual immunophenotypes in acute leukaemias:
incidence and clinical correlations. Br J Haematol 1989;72:512–8.
[94] Carbonell F, Swansbury J, Min T, et al. Cytogenetic findings in acute biphenotypic leukaemia.
Leukemia 1996;10:1283–7.
[95] Lim LC, Heng KK, Vellupillai M, et al. Molecular and phenotypic spectrum of de novo
Philadelphia positive acute leukemia. Int J Mol Med 1999;4:665–7.
[96] Hara J, Hosoi G, Okamura T, et al. CD33+ B-cell precursor acute lymphoblastic leukemia in
children: a distinct subgroup of B-cell precursor acute lymphoblastic leukemia. Int J Hematol
1995;61:77–84.
[97] Arber DA, Snyder DS, Fine M, et al. Myeloperoxidase immunoreactivity in adult acute lym-
phoblastic leukemia. Am J Clin Pathol 2001;116:25–33.
[98] Dunphy CH, Chu JY. Aberrant CD2 expression in precursor-B acute lymphoblastic leukemia of
childhood. Am J Hematol 1996;52:224–6.
[99] Lenormand B, Vannier JP, Bene MC, et al. CD2 + CD19 + acute lymphoblastic leukaemia in 16
children and adults: clinical and biological features. Groupe d’Etude Immunologique des Leu-
cemies (G.E.I.L.). Br J Haematol 1993;83:580–8.
[100] Uckun FM, Gaynon P, Sather H, et al. Clinical features and treatment outcome of children with
biphenotypic CD2+ CD19+ acute lymphoblastic leukemia: a Children’s Cancer Group study.
Blood 1997;89:2488–93.
[101] Uckun FM, Muraguchi A, Ledbetter JA, et al. Biphenotypic leukemic lymphocyte precursors in
CD2+CD19+ acute lymphoblastic leukemia and their putative normal counterparts in human
fetal hematopoietic tissues. Blood 1989;73:1000–15.
[102] Stass SA, Mirro J. Lineage heterogeneity in acute leukaemia: acute mixed-lineage leukaemia
and lineage switch. Clin Haematol 1986;15:811–27.
[103] Porwit-MacDonald A, Bjorklund E, Lucio P, et al. BIOMED-1 concerted action report: flow
cytometric characterization of CD7+ cell subsets in normal bone marrow as a basis for the
diagnosis and follow-up of T cell acute lymphoblastic leukemia (T-ALL). Leukemia 2000;
14:816–25.
[104] Schmidt CA, Przybylski G, Tietze A, et al. Acute myeloid and T-cell acute lymphoblastic
leukaemia with aberrant antigen expression exhibit similar TCRdelta gene rearrangements.
Br J Haematol 1996;92:929–36.
[105] Nakase K, Kita K, Sekine T, et al. CD7, CD4 and myeloid antigen-positive acute lymphoblastic
leukemia. Int J Hematol 1993;59:41–6.
[106] Davis RE, Longacre TA, Cornbleet PJ. Hematogones in the bone marrow of adults. Immuno-
phenotypic features, clinical settings, and differential diagnosis. Am J Clin Pathol 1994;102:
202–11.
R.S. Riley et al / Hematol Oncol Clin N Am 16 (2002) 245–299 293
[107] Longacre TA, Foucar K, Crago S, et al. Hematogones: a multiparameter analysis of bone
marrow precursor cells. Blood 1989;73:543–52.
[108] Rimsza LM, Larson RS, Winter SS, et al. Benign hematogone-rich lymphoid proliferations can
be distinguished from B-lineage acute lymphoblastic leukemia by integration of morphology,
immunophenotype, adhesion molecule expression, and architectural features. Am J Clin Pathol
2000;114:66–75.
[109] Muehleck SD, McKenna RW, Gale PF, et al. Terminal deoxynucleotidyl transferase (TdT)-
positive cells in bone marrow in the absence of hematologic malignancy. Am J Clin Pathol
1983;79:277–84.
[110] Rimsza LM, Viswanatha DS, Winter SS, et al. The presence of CD34+ cell clusters predicts
impending relapse in children with acute lymphoblastic leukemia receiving maintenance che-
motherapy. Am J Clin Pathol 1998;110:313–20.
[111] Kallakury BV, Hartmann DP, Cossman J, et al. Posttherapy surveillance of B-cell precursor
acute lymphoblastic leukemia. Value of polymerase chain reaction and limitations of flow
cytometry. Am J Clin Pathol 1999;111:759–66.
[112] Domenech J, Roingeard F, Binet C. The mechanisms involved in the impairment of hemato-
poiesis in autologous bone marrow transplantation. Leuk Lymphoma 1997;24:239–56.
[113] Galotto M, Berisso G, Delfino L, et al. Stromal damage as consequence of high-dose chemo/
radiotherapy in bone marrow transplant recipients. Exp Hematol 1999;27:1460–6.
[114] Cline MJ, Gale RP, Golde DW. Discrete clusters of hematopoietic cells in the marrow cavity of
man after bone marrow transplantation. Blood 1977;50:709–12.
[115] Turhan AG, Humphries RK, Phillips GL, et al. Clonal hematopoiesis demonstrated by X-linked
DNA polymorphisms after allogeneic bone marrow transplantation. N Engl J Med 1989;320:
1655–61.
[116] Keever-Taylor CA, Klein JP, Eastwood D, et al. Factors affecting neutrophil and platelet
reconstitution following T cell-depleted bone marrow transplantation: differential effects of
growth factor type and role of CD34(+) cell dose. Bone Marrow Transplant 2001;27:791–800.
[117] Szilvassy SJ, Meyerrose TE, Ragland PL, et al. Differential homing and engraftment properties
of hematopoietic progenitor cells from murine bone marrow, mobilized peripheral blood, and
fetal liver. Blood 2001;98:2108–15.
[118] Szilvassy SJ, Bass MJ, Van Zant G, et al. Organ-selective homing defines engraftment kinetics
of murine hematopoietic stem cells and is compromised by Ex vivo expansion. Blood 1999;
93:1557–66.
[119] Bensinger WI, Storb R. Allogeneic peripheral blood stem cell transplantation. Rev Clin Exp
Hematol 2001;5:67–86.
[120] Schlenke P, Sheikhzadeh S, Weber K, et al. Immune reconstitution and production of intra-
cellular cytokines in T lymphocyte populations following autologous peripheral blood stem cell
transplantation. Bone Marrow Transplant 2001;28:251–7.
[121] Torres A, Sanchez J, Lakomsky D, et al. Assessment of hematologic progenitor engraftment by
complete reticulocyte maturation parameters after autologous and allogeneic hematopoietic
stem cell transplantation. Haematologica 2001;86:24–9.
[122] Morecki S, Gelfand Y, Nagler A, et al. Immune reconstitution following allogeneic stem cell
transplantation in recipients conditioned by low intensity vs myeloablative regimen. Bone
Marrow Transplant 2001;28:243–9.
[123] Luhm RA, Bellissimo DB, Uzgiris AJ, et al. Quantitative evaluation of post-bone marrow
transplant engraftment status using fluorescent-labeled variable number of tandem repeats.
Mol Diagn 2000;5:129–38.
[124] Stock W, Estrov Z. Studies of minimal residual disease in acute lymphocytic leukemia. Hematol
Oncol Clin N Am 2000;14:1289–1305.
[125] van Dongen JJ, Szczepanski T, de Bruijn MA, et al. Detection of minimal residual disease in
acute leukemia patients. Cytokines Mol Ther 1996;2:121–33.
[126] Campana D. Monitoring minimal residual disease in acute leukemia: expectations, possibilities
and initial clinical results. Int J Clin Lab Res 1994;24:132–8.
R.S. Riley et al / Hematol Oncol Clin N Am 16 (2002) 245–299294
[127] Deptala A, Mayer SP. Detection of minimal residual disease. Methods Cell Biol 2001;64:
385–420.
[128] Felgar RE. Minimal residual disease detection by flow cytometry: can it serve as a predictor of
future relapse? Leuk Res 2001;25:409–11.
[129] Sievers EL, Radich JP. Detection of minimal residual disease in acute leukemia. Curr Opin
Hematol 2000;7:212–6.
[130] Ryan DH, Mitchell SJ, Hennessy LA, et al. Improved detection of rare CALLA-positive cells
in peripheral blood using multiparameter flow cytometry. J Immunol Methods 1984;74:
115–28.
[131] Campana D. Applications of cytometry to study acute leukemia: in vitro determination of drug
sensitivity and detection of minimal residual disease. Cytometry 1994;18:68–74.
[132] Campana D, Neale GA, Coustan-Smith E, et al. Detection of minimal residual disease in acute
lymphoblastic leukemia: the St Jude experience. Leukemia 2001;15:278–9.
[133] Drach J, Drach D, Glassl H, et al. Flow cytometric determination of atypical antigen expression
in acute leukemia for the study of minimal residual disease. Cytometry 1992;13:893–901.
[134] Dworzak MN, Stolz F, Froschl G, et al. Detection of residual disease in pediatric B-cell
precursor acute lymphoblastic leukemia by comparative phenotype mapping: a study of five
cases controlled by genetic methods. Exp Hematol 1999;27:673–81.
[135] Farahat N, Morilla A, Owusu-Ankomah K, et al. Detection of minimal residual disease in
B-lineage acute lymphoblastic leukaemia by quantitative flow cytometry. Br J Haematol
1998;101:158–64.
[136] Gore SD, Kastan MB, Goodman SN, et al. Detection of minimal residual T cell acute lympho-
blastic leukemia by flow cytometry. J Immunol Methods 1990;132:275–86.
[137] Macedo A, Orfao A, Ciudad J, et al. Phenotypic analysis of CD34 subpopulations in normal
human bone marrow and its application for the detection of minimal residual disease. Leukemia
1995;9:1896–901.
[138] Nagler A, Condiotti R, Rabinowitz R, et al. Detection of minimal residual disease (MRD) after
bone marrow transplantation (BMT) by multi-parameter flow cytometry (MPFC). Med Oncol
1999;16:177–87.
[139] Orfao A, Ciudad J, Lopez-Berges MC, et al. Acute lymphoblastic leukemia (ALL): detection of
minimal residual disease (MRD) at flow cytometry. Leuk Lymphoma 1994;13:87–90.
[140] Uckun FM, Gaynon PS, Stram DO, et al. Bone marrow leukemic progenitor cell content in
pediatric T-lineage acute lymphoblastic leukemia patients with an isolated extramedullary first
relapse. Leuk Lymphoma 2001;40:279–85.
[141] Weir EG, Cowan K, LeBeau P, et al. A limited antibody panel can distinguish B-precursor acute
lymphoblastic leukemia from normal B precursors with four color flow cytometry: implications
for residual disease detection. Leukemia 1999;13:558–67.
[142] Chen JS, Coustan-Smith E, Suzuki T, et al. Identification of novel markers for monitoring
minimal residual disease in acute lymphoblastic leukemia. Blood 2001;97:2115–20.
[143] Boccuni P, Di Noto R, Lo Pardo C, et al. CD66c antigen expression is myeloid restricted in
normal bone marrow but is a common feature of CD10+ early-B-cell malignancies. Tissue
Antigens 1998;52:1–8.
[144] Coustan-Smith E, Behm FG, Sanchez J, et al. Immunological detection of minimal residual
disease in children with acute lymphoblastic leukaemia. Lancet 1998;351:550–4.
[145] Coustan-Smith E, Sancho J, Hancock ML, et al. Clinical importance of minimal residual
disease in childhood acute lymphoblastic leukemia. Blood 2000;96:2691–6.
[146] Wells DA, Sale GE, Shulman HM, et al. Multidimensional flow cytometry of marrow can
differentiate leukemic from normal lymphoblasts and myeloblasts after chemotherapy and bone
marrow transplantation. Am J Clin Pathol 1998;110:84–94.
[147] Hutt PJ, Sabio H, Gilchrist GS, et al. Childhood acute lymphoblastic leukemia: are routine end-
of-therapy bone marrow and cerebrospinal fluid examinations necessary? Mayo Clin Proc
1996;71:854–6.
[148] Donskoy E, Tausche F, Altman A, et al. Association of immunophenotype with cerebrospinal
R.S. Riley et al / Hematol Oncol Clin N Am 16 (2002) 245–299 295
fluid involvement in childhood B-lineage acute lymphoblastic leukemia. Am J Clin Pathol
1997;107:608–16.
[149] Homans AC, Barker BE, Forman EN, et al. Immunophenotypic characteristics of cerebrospinal
fluid cells in children with acute lymphoblastic leukemia at diagnosis. Blood 1990;76:1807–11.
[150] Subira D, Castanon S, Roman A, et al. Flow cytometry and the study of central nervous disease
in patients with acute leukaemia. Br J Haematol 2001;112:381–4.
[151] Hooijkaas H, Hahlen K, Adriaansen HJ, et al. Terminal deoxynucleotidyl transferase (TdT)-
positive cells in cerebrospinal fluid and development of overt CNS leukemia: a 5-year follow-
up study in 113 children with a TdT-positive leukemia or non- Hodgkin’s lymphoma. Blood
1989;74:416–22.
[152] Neale GA, Pui CH, Mahmoud HH, et al. Molecular evidence for minimal residual bone marrow
disease in children with ‘isolated’ extra-medullary relapse of T-cell acute lymphoblastic leuke-
mia. Leukemia 1994;8:768–75.
[153] Uckun FM, Gaynon PS, Stram DO, et al. Paucity of leukemic progenitor cells in the bone
marrow of pediatric B- lineage acute lymphoblastic leukemia patients with an isolated extra-
medullary first relapse. Clin Cancer Res 1999;5:2415–20.
[154] Abshire TC, Buchanan GR, Jackson JF, et al. Morphologic, immunologic and cytogenetic
studies in children with acute lymphoblastic leukemia at diagnosis and relapse: a Pediatric
Oncology Group study. Leukemia 1992;6:357–62.
[155] Bassan R, Biondi A, Benvestito S, et al. Acute undifferentiated leukemia with CD7+ and
CD13+ immunophenotype. Lack of molecular lineage commitment and association with poor
prognostic features. Cancer 1992;69:396–404.
[156] Hoelzer D. Therapy and prognostic factors in adult acute lymphoblastic leukaemia. Baillieres
Clin Haematol 1994;7:299–320.
[157] Ludwig WD, Reiter A, Loffler H, et al. Immunophenotypic features of childhood and adult
acute lymphoblastic leukemia (ALL): experience of the German Multicentre Trials ALL-BFM
and GMALL. Leuk Lymphoma 1994;13:71–6.
[158] Ribeiro RC, Pui CH. Prognostic factors in childhood acute lymphoblastic leukemia. Hematol
Pathol 1993;7:121–42.
[159] Pui CH, Rivera GK, Hancock ML, et al. Clinical significance of CD10 expression in childhood
acute lymphoblastic leukemia. Leukemia 1993;7:35–40.
[160] Rego EM, Tone LG, Garcia AB, et al. CD10 and CD19 fluorescence intensity of B-cell
precursors in normal and leukemic bone marrow. Clinical characterization of CD10(+strong)
and CD10(+weak) common acute lymphoblastic leukemia. Leuk Res 1999;23:441–50.
[161] Uckun FM, Sather H, Gaynon P, et al. Prognostic significance of the CD10+CD19+CD34+
B-progenitor immunophenotype in children with acute lymphoblastic leukemia: a report from
the Children’s Cancer Group. Leuk Lymphoma 1997;27:445–57.
[162] Borowitz MJ, Shuster J, Carroll AJ, et al. Prognostic significance of fluorescence intensity of
surface marker expression in childhood B-precursor acute lymphoblastic leukemia. A Pediatric
Oncology Group Study. Blood 1997;89:3960–6.
[163] Behm FG, Raimondi SC, Schell MJ, et al. Lack of CD45 antigen on blast cells in childhood
acute lymphoblastic leukemia is associated with chromosomal hyperdiploidy and other favor-
able prognostic features. Blood 1992;79:1011–6.
[164] Ludwig WD, Bartram CR, Ritter J, et al. Ambiguous phenotypes and genotypes in 16 children
with acute leukemia as characterized by multiparameter analysis. Blood 1988;71:1518–28.
[165] Ludwig WD, Harbott J, Bartram CR, et al. Incidence and prognostic significance of immuno-
phenotypic subgroups in childhood acute lymphoblastic leukemia: experience of the BFM
study 86. Recent Results Cancer Res 1993;131:269–82.
[166] Cascavilla N, Musto P, D’Arena G, et al. Adult and childhood acute lymphoblastic leukemia:
clinico-biological differences based on CD34 antigen expression. Haematologica 1997;82:
31–7.
[167] Thomas X, Archimbaud E, Charrin C, et al. CD34 expression is associated with major adverse
prognostic factors in adult acute lymphoblastic leukemia. Leukemia 1995;9:249–53.
R.S. Riley et al / Hematol Oncol Clin N Am 16 (2002) 245–299296
[168] Ciudad J, et al, San Miguel JF, Lopez-Berges MC, et al. Detection of abnormalities in B-cell
differentiation pattern is a useful tool to predict relapse in precursor-B-ALL. Br J Haematol
1999;104:695–705.
[169] Ciudad J, San Miguel JF, Lopez-Berges MC, et al. Prognostic value of immunophenotypic
detection of minimal residual disease in acute lymphoblastic leukemia. J Clin Oncol 1998;16:
3774–81.
[170] Kurec AS, Belair P, Stefanu C, et al. Significance of aberrant immunophenotypes in childhood
acute lymphoid leukemia. Cancer 1991;67:3081–6.
[171] Wiersma SR, Ortega J, Sobel E, et al. Clinical importance of myeloid-antigen expression in
acute lymphoblastic leukemia of childhood. N Engl J Med 1991;324:800–8.
[172] Legrand O, Perrot JY, Simonin G, et al. Adult biphenotypic acute leukaemia: an entity with
poor prognosis which is related to unfavourable cytogenetics and P-glycoprotein over- expres-
sion. Br J Haematol 1998;100:147–55.
[173] Griesinger F, Piro-Noack M, Kaib N, et al. Leukaemia-associated immunophenotypes (LAIP)
are observed in 90% of adult and childhood acute lymphoblastic leukaemia: detection in
remission marrow predicts outcome. Br J Haematol 1999;105:241–55.
[174] Czuczman MS, Dodge RK, Stewart CC, et al. Value of immunophenotype in intensively treated
adult acute lymphoblastic leukemia: cancer and leukemia Group B study 8364. Blood 1999;
93:3931–9.
[175] Kessel D, Beck WT, Kukuruga D, et al. Characterization of multidrug resistance by fluorescent
dyes. Cancer Res 1991;51:4665–70.
[176] Dano K. Active outward transport of daunomycin in resistant Ehrlich ascites tumor cells.
Biochim Biophys Acta 1973;323:466–83.
[177] Ling V. Multidrug resistance and P-glycoprotein expression. Ann N Y Acad Sci 1987;507:
7–8.
[178] Ling V, Gerlach J, Kartner N. Multidrug resistance. Breast Cancer Res Treat 1984;4:89–94.
[179] Ueda K, Cornwell MM, Gottesman MM, et al. The MDR1 gene, responsible for multidrug-
resistance, codes for P-glycoprotein. Biochem Biophys Res Commun 1986;141:956–62.
[180] Krishna R, Mayer LD. Multidrug resistance (MDR) in cancer. Mechanisms, reversal using
modulators of MDR and the role of MDR modulators in influencing the pharmacokinetics of
anticancer drugs. Eur J Pharm Sci 2000;11:265–83.
[181] Kanerva J, Tiirikainen MI, Makipernaa A, et al. Initial P-glycoprotein expression in childhood
acute lymphoblastic leukemia: no evidence of prognostic impact in follow-up. Pediatr Hematol
Oncol 2001;18:27–36.
[182] Wattel E, Lepelley P, Merlat A, et al. Expression of the multidrug resistance P glycoprotein in
newly diagnosed adult acute lymphoblastic leukemia: absence of correlation with response to
treatment. Leukemia 1995;9:1870–4.
[183] Wuchter C, Leonid K, Ruppert V, et al. Clinical significance of P-glycoprotein expression and
function for response to induction chemotherapy, relapse rate and overall survival in acute
leukemia. Haematologica 2000;85:711–21.
[184] Brophy NA, Marie JP, Rojas VA, et al. MDR1 gene expression in childhood acute lympho-
blastic leukemias and lymphomas: a critical evaluation by four techniques. Leukemia 1994;8:
327–35.
[185] Homolya L, Hollo M, Muller M, et al. A new method for a quantitative assessment of
P-glycoprotein-related multidrug resistance in tumour cells. Br J Cancer 1996;73:849–55.
[186] Maslak P, Hegewisch-Becker S, Godfrey L, et al. Flow cytometric determination of the multi-
drug-resistant phenotype in acute leukemia. Cytometry 1994;17:84–93.
[187] Maynadie M, Lizard G, Solary E, et al. Multidrug resistance phenotype evaluation by immuno-
fluorescence and functional tests: comparison of two monoclonal antibodies and three fluores-
cent dyes in three cells lines. Anticancer Res 1994;14:2605–9.
[188] Pall G, Spitaler M, Hofmann J, et al. Multidrug resistance in acute leukemia: a comparison of
different diagnostic methods. Leukemia 1997;11:1067–72.
[189] Marie JP, Huet S, Faussat AM, et al. Multicentric evaluation of the MDR phenotype in
R.S. Riley et al / Hematol Oncol Clin N Am 16 (2002) 245–299 297
leukemia. French Network of the Drug Resistance Intergroup, and Drug Resistance Network of
Assistance Publique-Hopitaux de Paris. Leukemia 1997;11:1086–94.
[190] Andreeff M, Darzynkiewicz Z, Sharpless TK, et al. Discrimination of human leukemia subtypes
by flow cytometric analysis of cellular DNA and RNA. Blood 1980;55:282–93.
[191] Barlogie B, Stass S, Dixon D, et al. DNA aneuploidy in adult acute leukemia. Cancer Genet
Cytogenet 1987;28:213–28.
[192] Diamond LW, Nathwani BN, Rappaport H. Flow cytometry in the diagnosis and classification
of malignant lymphoma and leukemia. Cancer 1982;50:1122–35.
[193] Hiddemann W, Wormann B, Messerer D, et al. Analysis of the cellular DNA and RNA content
in acute leukemias by flow cytometry. J Cancer Res Clin Oncol 1990;116:507–12.
[194] Hiddemann W, Wormann B, Ritter J, et al. Frequency and clinical significance of DNA
aneuploidy in acute leukemia. Ann N Y Acad Sci 1986;468:227–40.
[195] Suarez C, Miller DR, Steinherz PG, et al. DNA and RNA determination in 111 cases of
childhood acute lymphoblastic leukaemia (ALL) by flow cytometry: correlation of FAB clas-
sification with DNA stemline and proliferation. Br J Haematol 1985;60:677–86.
[196] Pui CH, Carroll AJ, Head D, et al. Near-triploid and near-tetraploid acute lymphoblastic
leukemia of childhood. Blood 1990;76:590–6.
[197] Walle AJ. Identification of L3 leukemia and Burkitt’s lymphoma cells by flow cytometric
quantitation of nuclear and cellular RNA and DNA content. Leuk Res 1986;10:303–12.
[198] Campos L, Sabido O, Sebban C, et al. Expression of BCL-2 proto-oncogene in adult acute
lymphoblastic leukemia. Leukemia 1996;10:434–8.
[199] Tsurusawa M, Saeki K, Katano N, et al. Bcl-2 expression and prognosis in childhood acute
leukemia. Children’s Cancer and Leukemia Study Group. Pediatr Hematol Oncol 1998;15:
143–55.
[200] Krammer PH. CD95’s deadly mission in the immune system. Nature 2000;407:789–95.
[201] Krammer PH. CD95(APO-1/Fas)-mediated apoptosis: live and let die. Adv Immunol 1999;
71:163–210.
[202] Sharma K, Wang RX, Zhang LY, et al. Death the Fas way: regulation and pathophysiology of
CD95 and its ligand. Pharmacol Ther 2000;88:333–47.
[203] Puck JM, Sneller MC. ALPS: an autoimmune human lymphoproliferative syndrome associated
with abnormal lymphocyte apoptosis. Semin Immunol 1997;9:77–84.
[204] Beltinger C, Kurz E, Bohler T, et al. CD95 (APO-1/Fas) mutations in childhood T-lineage acute
lymphoblastic leukemia. Blood 1998;91:3943–51.
[205] Karawajew L, Wuchter C, Ruppert V, et al. Differential CD95 expression and function in T and
B lineage acute lymphoblastic leukemia cells. Leukemia 1997;11:1245–52.
[206] Baryshnikov A, Polosukhina ER, Tupitsin NN, et al. CD95 (FAS/APO-1) antigen is a new
prognostic marker of blast cells of acute lymphoblastic leukaemia patients. Adv Exp Med Biol
1999;457:251–8.
[207] Engel P, Tedder TF. New CD from the B cell section of the Fifth International Workshop on
Human Leukocyte Differentiation Antigens. Leuk Lymphoma 1994;13:61–4.
[208] Maecker HT, Todd SC, Levy S. The tetraspanin superfamily: molecular facilitators. FASEB J
1997;11:428–42.
[209] Borowitz MJ, Rubnitz J, Nash M, et al. Surface antigen phenotype can predict TEL-AML1
rearrangement in childhood B-precursor ALL: a Pediatric Oncology Group study. Leukemia
1998;12:1764–70.
[210] Hara J, Matsuda Y, Fujisaki H, et al. Expression of adhesion molecules in childhood B-lineage-
cell neoplasms. Int J Hematol 2000;72:69–73.
[211] Shuster JJ, Falletta JM, Pullen DJ, et al. Prognostic factors in childhood T-cell acute lympho-
blastic leukemia: a Pediatric Oncology Group study. Blood 1990;75:166–73.
[212] Kurtzberg J, Waldmann TA, Davey MP, et al. CD7+, CD4-, CD8- acute leukemia: a syndrome
of malignant pluripotent lymphohematopoietic cells. Blood 1989;73:381–90.
[213] Pui CH, Raimondi SC, Head DR, et al. Characterization of childhood acute leukemia with
multiple myeloid and lymphoid markers at diagnosis and at relapse. Blood 1991;78:1327–37.
R.S. Riley et al / Hematol Oncol Clin N Am 16 (2002) 245–299298
[214] Boucheix C, David B, Sebban C, et al. Immunophenotype of adult acute lymphoblastic leu-
kemia, clinical parameters, and outcome: an analysis of a prospective trial including 562 tested
patients (LALA87). French Group on Therapy for Adult Acute Lymphoblastic Leukemia.
Blood 1994;84:1603–12.
[215] Kikuchi A, Hayashi Y, Kobayashi S, et al. Clinical significance of TAL1 gene alteration in
childhood T-cell acute lymphoblastic leukemia and lymphoma. Leukemia 1993;7:933–8.
[216] Alfsen GC, Beiske K, Holte H, et al. T-cell receptor tau delta +/CD3+4–8-T- cell acute
lymphoblastic leukemias: a distinct subgroup of leukemias in children. A report of five cases.
Blood 1991;77:2023–30.
[217] Preti HA, Huh YO, O’Brien SM, et al. Myeloid markers in adult acute lymphocytic leukemia.
Correlations with patient and disease characteristics and with prognosis. Cancer 1995;76:
1564–70.
[218] Basso G, Putti MC, Cantu-Rajnoldi A, et al. The immunophenotype in infant acute lympho-
blastic leukaemia: correlation with clinical outcome. An Italian multicentre study (AIEOP). Br J
Haematol 1992;81:184–91.
[219] Basso G, Rondelli R, Covezzoli A, et al. The role of immunophenotype in acute lymphoblastic
leukemia of infant age. Leuk Lymphoma 1994;15:51–60.
[220] Kantarjian HM. Adult acute lymphocytic leukemia: critical review of current knowledge. Am J
Med 1994;97:176–84.
[221] Preti HA, Kantarjian HM. Acute lymphocytic leukemia in adults: an update. Tex Med
1994;90:52–9.
[222] Spath-Schwalbe E, Heil G, Heimpel H. Acute lymphoblastic leukemia in patients over 59 years
of age. Experience in a single center over a 10-year period. Ann Hematol 1994;69:291–6.
[223] McCoy Jr. JP, Overton WR. Immunophenotyping of congenital leukemia. Cytometry 1995;22:
85–8.
[224] McCoy Jr. JP, Travis SF, Blumstein L, et al. Congenital leukemia: report of two cases. Cytometry
1995;22:89–92.
[225] Clatch RJ, Foreman JR, Walloch JL. Simplified immunophenotypic analysis by laser scanning
cytometry. Cytometry 1998;34:3–16.
[226] Clatch RJ, Walloch JL, Zutter MM, et al. Immunophenotypic analysis of hematologic malig-
nancy by laser scanning cytometry. Am J Clin Pathol 1996;105:744–55.
[227] Belov L, de la Vega O, dos Remedios CG, et al. Immunophenotyping of leukemias using a
cluster of differentiation antibody microarray. Cancer Res 2001;61:4483–9.
[228] Buccheri V, Matutes E, Dyer MJ, Catovsky D. Lineage commitment in biphenotypic leukemia.
Leukemia 1993;7:919–27.
[229] Hurwitz CA, Loken MR, Graham ML, Karp JE, Borowitz MJ, Pullen DJ, et al. Asynchronous
antigen expression in B-lineage acute lymphoblastic leukemia. Blood 1998;72:299–307.
R.S. Riley et al / Hematol Oncol Clin N Am 16 (2002) 245–299 299