30
José Roberto Díaz-Reza Jorge Luis García-Alcaraz Valeria Martínez-Loya Impact Analysis of Total Productive Maintenance Critical Success Factors and Benefits

José Roberto Díaz-Reza Jorge Luis García-Alcaraz Valeria Martínez-Loya
Impact Analysis of Total Productive MaintenanceCritical Success Factors and Benefits

Impact Analysis of Total Productive Maintenance

José Roberto Díaz-Reza • Jorge Luis García-AlcarazValeria Martínez-Loya
Impact Analysis of TotalProductive MaintenanceCritical Success Factors and Benefits
123

José Roberto Díaz-RezaUniversidad Autónoma de Ciudad JuárezCiudad Juárez, Chihuahua, Mexico
Jorge Luis García-AlcarazUniversidad Autónoma de Ciudad JuárezCiudad Juárez, Chihuahua, Mexico
Valeria Martínez-LoyaUniversidad Autónoma de Ciudad JuárezCiudad Juárez, Chihuahua, Mexico
ISBN 978-3-030-01724-8 ISBN 978-3-030-01725-5 (eBook)https://doi.org/10.1007/978-3-030-01725-5
Library of Congress Control Number: 2018956606
© Springer Nature Switzerland AG 2019This work is subject to copyright. All rights are reserved by the Publisher, whether the whole or partof the material is concerned, specifically the rights of translation, reprinting, reuse of illustrations,recitation, broadcasting, reproduction on microfilms or in any other physical way, and transmissionor information storage and retrieval, electronic adaptation, computer software, or by similar or dissimilarmethodology now known or hereafter developed.The use of general descriptive names, registered names, trademarks, service marks, etc. in thispublication does not imply, even in the absence of a specific statement, that such names are exempt fromthe relevant protective laws and regulations and therefore free for general use.The publisher, the authors and the editors are safe to assume that the advice and information in thisbook are believed to be true and accurate at the date of publication. Neither the publisher nor theauthors or the editors give a warranty, express or implied, with respect to the material contained herein orfor any errors or omissions that may have been made. The publisher remains neutral with regard tojurisdictional claims in published maps and institutional affiliations.
This Springer imprint is published by the registered company Springer Nature Switzerland AGThe registered company address is: Gewerbestrasse 11, 6330 Cham, Switzerland

This work is dedicated, to my mother SocorroDíaz, who since the first day has given me herunconditional love and has alwaysencouraged me to be a better person.To my aunt Gela for being another pillarof the family.To my brother (Demetrio), who has alwaysbeen an unconditional support.To my sister-in-law Marisol, for being the onewho has always been a great support.To my sisters (Laura and Juani) foraccompanying my mother, Aunt, and nephews(Zaid, Yair, Iram, Yael and Sofia), who arethe joy of the family … Thank you very muchfor everything that each one has contributedto my life.RP!
José Roberto Díaz-Reza
Humans take inspiration when they set agoal. To me, my family is my inspiration,which is why I dedicate this book to:God. I thank Him for everything.To my parents; my life teachers.To my children (Jorge Andres and MarianaOdette), they are the reason to be of my life,

my greatest pillars, and strengths.To my wife, Ana Blanca Rodríguez-Rendon,for her unconditional support in all theprojects that I’ve undertaken.To my brothers and sisters, who have taughtme the best lessons at home.Those brothers who recognize me and acceptme as such.
Jorge Luis García-Alcaraz
To God for being my guidance allowing me toreach this stage of my life, providing me lightand strength every time I need it.To my parents (Rosa and Rafael) for theirunconditional love, trust, and because they’vealways have supporting me on my decisions,ideas, goals, dreams, and mistakes.To my sister (Dilia) for being my accompliceand friend, besides all the support andunconditional motivation to never givemyself up.
Valeria Martínez-Loya

Foreword
It is always a pleasure to have the scoop of reading a book before it is published,which is an advantage that only the ones who are invited to write a foreword have.On this occasion, I have read the book titled Impact Analysis of Total ProductiveMaintenance—Critical success factors and Benefits that is written by José RobertoDíaz-Reza, Jorge Luis García-Alcaraz, and Valeria Martínez-Loya, all of them fromthe Autonomous University of Ciudad Juarez in Mexico. In general terms, this bookarises from the need that exists in the industrial field to link the different criticalfactors or activities associated with the Total Productive Maintenance (TPM)implementation programs along with the benefits obtained from itself.
The authors divide their book into five parts, which are divided into chapters,according to an addressed theme. In addition, these parts are briefly describedbelow in order to motivate the reader to look at its content:
Part I is called Concepts and Evolution of TPM, where the authors have carriedout a literature review to understand what has been achieved by that lean manu-facturing tool over time, as well as the different approaches and applications thathave been given in different industrial sectors. In addition, the analysis that isreported regarding the magazines that publish about TPM, years, and industrialsectors is significant, since they are required to keep their machines and equipmenton their productive systems in optimal conditions.
Part II is called Activities and Benefits Associated with TPM, which lists 75activities reported in the literature review that are required to achieve the success ofthis tool in a productive system, which are human and operational. In the same way,22 benefits are listed that can be associated with the proper TPM implementation,which are divided into those related with the organization, the productivity indexesin the company, and the employees’ safeness. In addition, that section presents anidea about what should be performed to incorporate TPM, as well as what amanager may expect in response to the actions he or she takes. Also, it is relevant tomention that each of the activities and benefits is widely analyzed through a lit-erature review, and its study and importance in this book are justified.
vii
Part III has been called Research Problem, Objectives, and Methodology, wherethe authors define the problems that exist in their environment regarding the TPMimplementation. Moreover, it is argued that there are many activities associatedwith TPM where 75 have been identified, as well as benefits; however, there are nostudies that seek to relate them directly and indirectly, also there is no quantificationabout the effect that these activities have on the benefits. Thus, the objective of thisbook is to present through structural equation models, the relationships betweenthose activities that are required to implement TPM and the benefits that areobtained. In addition, a series of sequential activities that the authors carry out inorder to fulfill this goal are defined, where the data gathered from the sector, itsvalidation, and the generation of the causal models can be mentioned.
Part IV is called Validation and Analysis of Data, where the authors alreadyapplied the methodology to generate validity indexes from data obtained about theindustrial sector. Additionally, in this process, some of the activities and benefits aredeleted to improve those indexes, and as well as to generate stronger structuralequation models. Also, a descriptive analysis of the TPM tasks and benefits isreported, where central tendency measures and dispersion are described, whichallows a discussion from a univariable perspective.
Finally, Part V is called Estructural Equation Models and it has been consideredthat in this section, questions that researchers asked at the beginning of their book areanswered, because it is where the required tasks for TPM are completely related to thebenefits obtained. As a matter of fact, there are two types of structural equationmodels: the simple ones, in which an activity is linked to a benefit, therefore they arepresented on purpose, since they are easy to understand, as the authors are introducingmore and more difficult models to the second ones that they call complexes, wherefour variables already intervene. In addition, it is important to see how a sensitivityanalysis is performed for each complex to determine the probability of occurrencefrom the variables when there are at their low and high values.
I hope that readers on this book will find the usage that is sought in it, since theoutcomes will allow identifying the main activities associated with the TPMimplementation and the benefits that are obtained. In addition, I know that manyreaders may mention that relationships are sometimes logical and have commonsense, but a real contribution of this book is that it quantifies that relationship andwill make it easier for those interested to focus their attention on activities that arecrucial for their business in a specific way.
Tudela, Spain Juan Ignacio Latorre-BielDepartment of Engineering
Public University of Navarra—Campus Tudela
Cali, Colombia Diego Fernando Manotas DuqueDepartment of Industrial Engineering
Universidad del Valle
viii Foreword
Preface
Nowadays, production systems must be highly competitive, so the resourcesadministration is for the company survival in order to obtain as much benefits asthey can, therefore, many lean manufacturing tools are applied, and one aims thatthe machinery and equipment have a high availability level to be able to attendproduction orders at any time, which is called total productive maintenance (TPM).In addition, the main reason to study TPM is that the damaged machines canrepresent unused resources and undelivered production orders in time or withquality out from certain specifications, which logically affect the image andeconomic profitability in the company.
Furthermore, TPM has proven its efficiency throughout history, that is whymanagers from many companies pursue to implement it into their productive sys-tems, and often they do not have enough information about how to carry out theimplementation process as well as about the coordination of the different aspectsthat intervene on it. In addition, there’s a book entitled Impact Analysis of TotalProductive Maintenance—Critical Success Factors and Benefits, where based onliterature review TPM is proposed; it is identical to the main activities required toguarantee the success of TPM, as well as its benefits.
However, it is important to understand why the impact of the activities is con-sidered in TPM programs to achieve its benefits. In this book, for its study, theactivities and benefits are divided into different groups called latent variables andanalyzed through structural equation models that allow them to be related.Additionally, there is a high trust level that this type of models will help managersfocus on activities that are significantly depending on their company’s needs, asthey can identify those activities that affect the benefits they want to acquire.
Moreover, the book is divided into 13 chapters, which are integrated into fiveparts, which are briefly discussed in the part below:
Part I is about two introductory chapters and its content is the following:Chapter 1 is titled TPM Background, which lists some concepts of TPM over
time and from different contexts, the approaches that have been assigned to thistool, the objectives that are aimed to achieve, the losses that may be obtained if
ix
TPM it is not applied properly, as well as a sequence of activities that must becarried out to implement it.
In Chap. 2, which is titled TPM Literature Review, the importance of TPM in theindustry is described and a literature review is presented, where some graphs areillustrated to represent the articles that are published per year in that TPM area, thetype of publication, the names of the scientific journals, the sectors where the casestudies are reported, and the main editorial houses that disseminate this type ofresearch. Likewise, with the objective to motivate the reader, some success storiesfrom some companies that have applied TPM in diverse industrial sectors arepresented.
Part II has two chapters, which are described below:Chapter 3 is titled Activities Associated with the Success of TPM, which is one
of the most important and it is the basis for the definition of all the other chapters,since it describes a total of 75 activities, which are grouped into categories, asso-ciated with human and operational factors. Also, a description for each of theseactivities is mentioned, as well as a literature review about their importance in theTPM implementation process, which is justified.
Chapter 4 is titled Benefits Associated with the TPM Implementation in theIndustry and as its name suggests, it reports 22 benefits from TPM, which aredivided according to their focus and repercussion, therefore, they are divided intothree categories: the benefits for the organization, productivity, and security. Inaddition, as in the previous chapter, a justification for each of these benefits isestablished based on a literature review.
Part III is also composed of two chapters, which are described below:Chapter 5 is entitled Definition of the Problem and Objective of the Research,
which presents the need to relate the 75 activities that are included in Chap. 3 alongwith the 22 benefits from Chap. 4. Also, the importance to perform each of theseactivities in order to obtain the benefits that TPM can offer, since, although it isknown that this relationship exists, there is no quantification of it. Thus, theobjective of this book is to present a set of models that allow relating the activitiesrequired for TPM with the benefits obtained.
Chapter 6 is entitled Methodology, which displays a list of eight activities thatare carried out in chronological order to achieve the objective previously discussedin Chap. 5. In addition, it is vital to mention that the methodology includes field-work to gather information from the industry, integrating the experience fromseveral experts in the maintenance area. Also, the data is validated statistically,purified, and analyzed throughout the means of causal models allowing to use thestructural equation modeling technique, which shows the relationships betweenactivities and benefits.
Part IV includes two chapters, where the data analysis is described:Chapter 7 is entitled Validation of Variables, which are integrated into structural
equation models. In this case, the activities associated with human factors aredivided into Work culture, Suppliers, Managerial commitment, and Clients, whilethe operational factors are divided into PM Implementation, TPM implementation,
x Preface
Technological status, Layout, and Warehouse management and the benefits aredivided into organizational, safety, and productivity. In addition, for each oneof these variables, efficiency indexes are obtained in order to know if the activitiesand benefits actually contribute to its explanation.
Chapter 8 is titled Descriptive Analysis, which reports a series of indexes andparameters associated with the characteristics of the sample and the data obtained.In addition, 397 cases from the surveys applied to the maquila sector are reported,as well as the sectors involved in the study, the gender, and years of experiencefrom the participants responding to the survey, as well as the position within it areanalyzed. Additionally, regarding activities and benefits, since they are estimated ona Likert scale, the median is reported as a central tendency measure, and theinterquartile range as a measure of dispersion.
In Part V, which includes five chapters, the structural equation models aredescribed, where the activities required for TPM are related to the benefits; thesechapters are described below:
Chapter 9 is titled Simple Models, where three simple structural equation modelsare reported, which integrate only one activity with a benefit from TPM, which areduly justified. Similarly, a list of all the possible relationships that may existbetween the variables associated with the activities and the benefits is addressed,but they are no longer fully explained, since only the dependent indexes are indi-cated. In addition, in this chapter, the quantifications that determine the relationshipbetween the variables (activities and benefits) start to show up.
Chapter 10, which is titled Structural Equation Models: Human Factor—Part I,presents two complex structural equation models, where the activities associatedwith human factors are related to other activities, since it is assumed that there isdependency between them. Also, a sensitivity analysis is reported at the end of eachmodel, which indicates the probabilities of occurrence for each of the variablestogether and independently.
Chapter 11 is titled Structural Equation Models-Human Factor—Part II, whichpresents two complex structural equation models, where the activities associatedwith the human factor in the TPM implementation are already linked with thebenefits obtained from the tool. Also, the analyzes are interesting, since here thefirst causal models appear, which allow managers to identify the activities wherethey should focus their efforts on.
Chapter 12 is called Structural Equation Models-Technical Factors, as its nameindicates, it relates the technical factors associated with the activities required toimplement TPM with the benefits, and two complex models come out. In addition,as in other models, the hypotheses are presented and justified with a literaturereview; they are validated, and a conclusion is written from themselves.
Finally, Chap. 13 is titled Structural Equation Models—MethodologicalFactors, which presents a complex structural equation model that integrates themethodological factors and a second-order integrative model that coordinates all theassociated variables in a single model along with the activities and benefits, whichis incorporated by three latent variables. Also, this is the most significant model,
Preface xi

because it is the one allowing to observe from a general perspective the importancethat human resources have in the TPM implementation.
Authors hope that the content of this book will contribute to understand man-agers and decision-makers in the TPM implementation, the relevance of this tool,the appropriate management of the machinery and equipment available in theirproduction systems, and identify the tasks that are essential to acquire a specificbenefit focusing their efforts on it. In addition, we hope that enthusiast, academics,and researchers can find this as a useful book for understanding the TPM in industrywith real applications.
Ciudad Juárez, Mexico José Roberto Díaz-RezaJorge Luis García-Alcaraz
Valeria Martínez-Loya
xii Preface

Acknowledgements
The present project would not have been completed without the support of manypeople who were directly and indirectly involved, and therefore, the authors want tothank the following people and institutions:
• To all the maintenance managers and associated areas that answered our surveyto gather data from their industry, who commented on it, and allowed the accessto their companies.
• To all those students and coworker teachers who helped during the gatheringdata process from the companies.
• To the National Council of Science and Technology (CONACYT), whichthrough the project called Thematic Network of Optimization IndustrialProcesses has supported this project.
• To the Secretariat of Public Education of Mexico, who through the Program forProfessional Teacher Development (PRODEP) have supported this project.
• Special thanks to the Autonomous University of Ciudad Juárez (UACJ), ourwork and study place, for their financial support during the book translation andediting process.
• Also, our gratefulness to Alejandra Bautista, who is responsible for translatingthe book, and her advice and patience has contributed to this project.
xiii

Contents
Part I Concepts and Evolution of TPM
1 TPM Background . . . . . . . . . . . . . . . . . . . . . . . . . . . . . . . . . . . . . . 31.1 TPM Definition . . . . . . . . . . . . . . . . . . . . . . . . . . . . . . . . . . . 31.2 TPM Evolution and Origin . . . . . . . . . . . . . . . . . . . . . . . . . . . 61.3 TPM Objectives . . . . . . . . . . . . . . . . . . . . . . . . . . . . . . . . . . . 81.4 TPM and Big Losses . . . . . . . . . . . . . . . . . . . . . . . . . . . . . . . 81.5 TPM Origin . . . . . . . . . . . . . . . . . . . . . . . . . . . . . . . . . . . . . . 91.6 TPM Implementation Steps . . . . . . . . . . . . . . . . . . . . . . . . . . . 101.7 TPM Pillars . . . . . . . . . . . . . . . . . . . . . . . . . . . . . . . . . . . . . . 11
1.7.1 Pillar 1: Autonomous Maintenance (Jishu Hozen) . . . . 121.7.2 Pillar 2: Focused Improvement (Kobetsu Kaizen) . . . . . 141.7.3 Pillar 3: Planned Maintenance (PM) . . . . . . . . . . . . . . 151.7.4 Pillar 4: Quality Maintenance (Hinshitsu Hozen) . . . . . 161.7.5 Pillar 5: Education and Training . . . . . . . . . . . . . . . . . 161.7.6 Pillar 6: Office TPM (OTPM) . . . . . . . . . . . . . . . . . . . 171.7.7 Pillar 7: Safety, Hygiene, and Environment (SHE) . . . . 181.7.8 Pillar 8: Developed Management . . . . . . . . . . . . . . . . . 18
References . . . . . . . . . . . . . . . . . . . . . . . . . . . . . . . . . . . . . . . . . . . . 19
2 TPM Literature Review . . . . . . . . . . . . . . . . . . . . . . . . . . . . . . . . . 232.1 TPM Importance . . . . . . . . . . . . . . . . . . . . . . . . . . . . . . . . . . . 232.2 TPM Publishing . . . . . . . . . . . . . . . . . . . . . . . . . . . . . . . . . . . 24
2.2.1 Publications Per Year . . . . . . . . . . . . . . . . . . . . . . . . . 242.2.2 Type of Publication . . . . . . . . . . . . . . . . . . . . . . . . . . 252.2.3 Scientific Magazines Publications . . . . . . . . . . . . . . . . 262.2.4 Industrial Sectors . . . . . . . . . . . . . . . . . . . . . . . . . . . . 272.2.5 Editorial Publications . . . . . . . . . . . . . . . . . . . . . . . . . 29
2.3 TPM Successful Cases Background . . . . . . . . . . . . . . . . . . . . . 292.4 TPM Successful Cases in the Industry . . . . . . . . . . . . . . . . . . . 30
xv

2.4.1 TPM in the International Manufacturing Industry . . . . . 312.4.2 TPM in the Electronic Industry . . . . . . . . . . . . . . . . . . 312.4.3 TPM in the Pharmaceutical Industry . . . . . . . . . . . . . . 322.4.4 TPM in the Automotive Industry . . . . . . . . . . . . . . . . . 342.4.5 TPM in the Industry and Psychology . . . . . . . . . . . . . . 352.4.6 TPM in the Textile Industry . . . . . . . . . . . . . . . . . . . . 362.4.7 TPM in Automotive Industry . . . . . . . . . . . . . . . . . . . 37
2.5 Conclusions . . . . . . . . . . . . . . . . . . . . . . . . . . . . . . . . . . . . . . 37References . . . . . . . . . . . . . . . . . . . . . . . . . . . . . . . . . . . . . . . . . . . . 38
Part II Activities and Benefits Associated with TPM
3 Activities Associated with the Success of TPM . . . . . . . . . . . . . . . . 433.1 Introduction . . . . . . . . . . . . . . . . . . . . . . . . . . . . . . . . . . . . . . 433.2 Activities Associated with Human Factor . . . . . . . . . . . . . . . . . 44
3.2.1 Work Culture . . . . . . . . . . . . . . . . . . . . . . . . . . . . . . . 443.2.2 Suppliers . . . . . . . . . . . . . . . . . . . . . . . . . . . . . . . . . . 483.2.3 Managerial Commitment . . . . . . . . . . . . . . . . . . . . . . . 503.2.4 Clients . . . . . . . . . . . . . . . . . . . . . . . . . . . . . . . . . . . . 52
3.3 Activities Associated with Operational Factor . . . . . . . . . . . . . . 533.3.1 Preventive Maintenance Implementation . . . . . . . . . . . 533.3.2 Total Productive Maintenance Implementation
(Implementation Style) . . . . . . . . . . . . . . . . . . . . . . . . 553.3.3 Technological Status . . . . . . . . . . . . . . . . . . . . . . . . . . 593.3.4 Layout . . . . . . . . . . . . . . . . . . . . . . . . . . . . . . . . . . . . 613.3.5 Warehouse Management . . . . . . . . . . . . . . . . . . . . . . . 62
References . . . . . . . . . . . . . . . . . . . . . . . . . . . . . . . . . . . . . . . . . . . . 64
4 Benefits Associated with the TPM Implementationin the Industry . . . . . . . . . . . . . . . . . . . . . . . . . . . . . . . . . . . . . . . . 694.1 Introduction . . . . . . . . . . . . . . . . . . . . . . . . . . . . . . . . . . . . . . 694.2 Benefits for the Company . . . . . . . . . . . . . . . . . . . . . . . . . . . . 704.3 Productivity Benefits . . . . . . . . . . . . . . . . . . . . . . . . . . . . . . . . 714.4 Safety Benefits . . . . . . . . . . . . . . . . . . . . . . . . . . . . . . . . . . . . 72References . . . . . . . . . . . . . . . . . . . . . . . . . . . . . . . . . . . . . . . . . . . . 73
Part III Research Problem, Objectives and Methodology
5 Definition of the Problem and Objective of the Research . . . . . . . . 775.1 Critical Success Factors of TPM . . . . . . . . . . . . . . . . . . . . . . . 775.2 TPM Benefits . . . . . . . . . . . . . . . . . . . . . . . . . . . . . . . . . . . . . 795.3 Research Problem . . . . . . . . . . . . . . . . . . . . . . . . . . . . . . . . . . 79
xvi Contents
5.4 Research Objective . . . . . . . . . . . . . . . . . . . . . . . . . . . . . . . . . 805.4.1 General Objective . . . . . . . . . . . . . . . . . . . . . . . . . . . . 805.4.2 Specific Objectives . . . . . . . . . . . . . . . . . . . . . . . . . . . 80
References . . . . . . . . . . . . . . . . . . . . . . . . . . . . . . . . . . . . . . . . . . . . 81
6 Methodology . . . . . . . . . . . . . . . . . . . . . . . . . . . . . . . . . . . . . . . . . . 836.1 Introduction . . . . . . . . . . . . . . . . . . . . . . . . . . . . . . . . . . . . . . 836.2 Literature Review . . . . . . . . . . . . . . . . . . . . . . . . . . . . . . . . . . 836.3 Initial Questionnaire: Experts Validation . . . . . . . . . . . . . . . . . 846.4 Final Questionnaire . . . . . . . . . . . . . . . . . . . . . . . . . . . . . . . . . 85
6.4.1 Section 1. Demographic Data . . . . . . . . . . . . . . . . . . . 856.4.2 Section 2. Critical Success Factors of Total
Productive Maintenance . . . . . . . . . . . . . . . . . . . . . . . 866.4.3 Section 3. TPM Benefits . . . . . . . . . . . . . . . . . . . . . . . 866.4.4 Rating Scale . . . . . . . . . . . . . . . . . . . . . . . . . . . . . . . . 87
6.5 Questionnaire Application . . . . . . . . . . . . . . . . . . . . . . . . . . . . 876.5.1 Sample . . . . . . . . . . . . . . . . . . . . . . . . . . . . . . . . . . . 876.5.2 Gathering Data . . . . . . . . . . . . . . . . . . . . . . . . . . . . . . 88
6.6 Data Entry and Analysis . . . . . . . . . . . . . . . . . . . . . . . . . . . . . 886.7 Data Depuration . . . . . . . . . . . . . . . . . . . . . . . . . . . . . . . . . . . 89
6.7.1 Identification of Missing Values . . . . . . . . . . . . . . . . . 896.7.2 Identification of Outliers . . . . . . . . . . . . . . . . . . . . . . . 896.7.3 Standard Deviation Analysis . . . . . . . . . . . . . . . . . . . . 906.7.4 Normal Distribution . . . . . . . . . . . . . . . . . . . . . . . . . . 906.7.5 Homoscedastic Analysis . . . . . . . . . . . . . . . . . . . . . . . 916.7.6 Collinearity Analysis . . . . . . . . . . . . . . . . . . . . . . . . . 91
6.8 Descriptive Analysis . . . . . . . . . . . . . . . . . . . . . . . . . . . . . . . . 926.8.1 Sample Descriptive Analysis . . . . . . . . . . . . . . . . . . . . 926.8.2 Data Descriptive Analysis . . . . . . . . . . . . . . . . . . . . . . 92
6.9 Data Validation. . . . . . . . . . . . . . . . . . . . . . . . . . . . . . . . . . . . 946.9.1 R-Square and Adjusted R-Squared . . . . . . . . . . . . . . . . 946.9.2 Q-Square . . . . . . . . . . . . . . . . . . . . . . . . . . . . . . . . . . 956.9.3 Integrated Reliability . . . . . . . . . . . . . . . . . . . . . . . . . 956.9.4 Cronbach’s Alpha Index . . . . . . . . . . . . . . . . . . . . . . . 956.9.5 Average Variance Extracted (AVE) . . . . . . . . . . . . . . . 966.9.6 Full Collinearity Variance Inflation Factor . . . . . . . . . . 96
6.10 Structural Equation Modeling . . . . . . . . . . . . . . . . . . . . . . . . . 976.10.1 The Modeling Hypothesis . . . . . . . . . . . . . . . . . . . . . . 986.10.2 Direct Effects . . . . . . . . . . . . . . . . . . . . . . . . . . . . . . . 996.10.3 Indirect Effects . . . . . . . . . . . . . . . . . . . . . . . . . . . . . . 1016.10.4 Total Effects . . . . . . . . . . . . . . . . . . . . . . . . . . . . . . . 101
Contents xvii
6.10.5 Effects Size . . . . . . . . . . . . . . . . . . . . . . . . . . . . . . . . 1026.10.6 Efficiency Modeling Indexes . . . . . . . . . . . . . . . . . . . . 102
6.11 Sensitivity Analysis . . . . . . . . . . . . . . . . . . . . . . . . . . . . . . . . . 105References . . . . . . . . . . . . . . . . . . . . . . . . . . . . . . . . . . . . . . . . . . . . 106
Part IV Validation and Analysis of Data
7 Validation of Variables . . . . . . . . . . . . . . . . . . . . . . . . . . . . . . . . . . 1137.1 Introduction . . . . . . . . . . . . . . . . . . . . . . . . . . . . . . . . . . . . . . 1137.2 Validation of Variables in Models . . . . . . . . . . . . . . . . . . . . . . 114
7.2.1 Model One . . . . . . . . . . . . . . . . . . . . . . . . . . . . . . . . 1157.2.2 Model Two . . . . . . . . . . . . . . . . . . . . . . . . . . . . . . . . 1167.2.3 Model Three . . . . . . . . . . . . . . . . . . . . . . . . . . . . . . . 1167.2.4 Model Four . . . . . . . . . . . . . . . . . . . . . . . . . . . . . . . . 1177.2.5 Model Five . . . . . . . . . . . . . . . . . . . . . . . . . . . . . . . . 1187.2.6 Model Six . . . . . . . . . . . . . . . . . . . . . . . . . . . . . . . . . 1197.2.7 Model Seven . . . . . . . . . . . . . . . . . . . . . . . . . . . . . . . 1197.2.8 Model Eight . . . . . . . . . . . . . . . . . . . . . . . . . . . . . . . . 120
7.3 Observed Variables in Latent Variables . . . . . . . . . . . . . . . . . . 1217.4 Conclusions . . . . . . . . . . . . . . . . . . . . . . . . . . . . . . . . . . . . . . 125
8 Descriptive Analysis . . . . . . . . . . . . . . . . . . . . . . . . . . . . . . . . . . . . 1278.1 Descriptive Analysis of the Sample . . . . . . . . . . . . . . . . . . . . . 127
8.1.1 Gender and Industrial Sector . . . . . . . . . . . . . . . . . . . . 1278.1.2 Participants Jerarquical Job Position and Work
Experience . . . . . . . . . . . . . . . . . . . . . . . . . . . . . . . . . 1288.2 Descriptive Analysis: Items in Success Factors of TPM . . . . . . 129
8.2.1 Work Culture . . . . . . . . . . . . . . . . . . . . . . . . . . . . . . . 1308.2.2 Suppliers . . . . . . . . . . . . . . . . . . . . . . . . . . . . . . . . . . 1318.2.3 Preventive Maintenance Implementation . . . . . . . . . . . 1328.2.4 Total Productive Maintenance Implementation . . . . . . . 1338.2.5 Technological Status . . . . . . . . . . . . . . . . . . . . . . . . . . 1358.2.6 Layout . . . . . . . . . . . . . . . . . . . . . . . . . . . . . . . . . . . . 1368.2.7 Warehouse Management . . . . . . . . . . . . . . . . . . . . . . . 1378.2.8 Management Commitment . . . . . . . . . . . . . . . . . . . . . 1388.2.9 Customers . . . . . . . . . . . . . . . . . . . . . . . . . . . . . . . . . 139
8.3 TPM Benefits . . . . . . . . . . . . . . . . . . . . . . . . . . . . . . . . . . . . . 1408.3.1 Descriptive Analysis: Company Benefits . . . . . . . . . . . 1408.3.2 Descriptive Analysis: Productivity Benefits . . . . . . . . . 1418.3.3 Descriptive Analysis: Security Benefits . . . . . . . . . . . . 142
References . . . . . . . . . . . . . . . . . . . . . . . . . . . . . . . . . . . . . . . . . . . . 143
xviii Contents

Part V Estructural Equation Models
9 Simple Models . . . . . . . . . . . . . . . . . . . . . . . . . . . . . . . . . . . . . . . . . 1499.1 Simple Model A: Work Culture—Benefits for the
Organization . . . . . . . . . . . . . . . . . . . . . . . . . . . . . . . . . . . . . . 1499.1.1 Hypothesis—Model A . . . . . . . . . . . . . . . . . . . . . . . . 1499.1.2 Validation of the Variables—Model A . . . . . . . . . . . . . 1509.1.3 Efficiency Indexes—Model A . . . . . . . . . . . . . . . . . . . 1509.1.4 Results and Conclusion—Model A . . . . . . . . . . . . . . . 1519.1.5 Sensitivity Analysis—Simple Model A . . . . . . . . . . . . 152
9.2 Simple Model B: Managerial Commitment—SafetyBenefits . . . . . . . . . . . . . . . . . . . . . . . . . . . . . . . . . . . . . . . . . 1539.2.1 Hypothesis—Model B . . . . . . . . . . . . . . . . . . . . . . . . 1539.2.2 Validation of the Variables—Model B . . . . . . . . . . . . . 1549.2.3 Efficiency Indexes—Model B . . . . . . . . . . . . . . . . . . . 1559.2.4 Results and Conclusion—Model B . . . . . . . . . . . . . . . 1559.2.5 Sensitivity Analysis—Simple Model B . . . . . . . . . . . . 156
9.3 Simple Model C: TPM Implementation—ProductivityBenefits . . . . . . . . . . . . . . . . . . . . . . . . . . . . . . . . . . . . . . . . . 1589.3.1 Hypothesis—Model C . . . . . . . . . . . . . . . . . . . . . . . . 1589.3.2 Validation of the Variables—Model C . . . . . . . . . . . . . 1599.3.3 Efficiency Indexes—Model C . . . . . . . . . . . . . . . . . . . 1599.3.4 Results and Conclusions—Model C . . . . . . . . . . . . . . . 1609.3.5 Sensitivity Analysis—Model C . . . . . . . . . . . . . . . . . . 161
9.4 Simple Hypotheses—Work Culture . . . . . . . . . . . . . . . . . . . . . 1639.4.1 Results—Work Culture . . . . . . . . . . . . . . . . . . . . . . . . 1649.4.2 Conclusions and Industrial Implications—Work
Culture . . . . . . . . . . . . . . . . . . . . . . . . . . . . . . . . . . . 1669.5 Simple Hypotheses—Suppliers . . . . . . . . . . . . . . . . . . . . . . . . 167
9.5.1 Results—Suppliers . . . . . . . . . . . . . . . . . . . . . . . . . . . 1689.5.2 Conclusions and Industrial Implications—Suppliers . . . 170
9.6 Simple Hypotheses—PM Implementation . . . . . . . . . . . . . . . . . 1719.6.1 Results—PM Implementation Process . . . . . . . . . . . . . 1729.6.2 Conclusions and Industrial Implications—PM
Implementation . . . . . . . . . . . . . . . . . . . . . . . . . . . . . . 1749.7 Simple Hypotheses—TPM Implementation . . . . . . . . . . . . . . . . 176
9.7.1 Results—TPM Implementation . . . . . . . . . . . . . . . . . . 1769.7.2 Conclusions and Industrial Implications—PM
Implementation . . . . . . . . . . . . . . . . . . . . . . . . . . . . . . 1789.8 Simple Hypotheses—Technological Status . . . . . . . . . . . . . . . . 180
9.8.1 Results—Technological Status . . . . . . . . . . . . . . . . . . 1819.8.2 Conclusions and Industrial
Implications—Technological Status . . . . . . . . . . . . . . . 182
Contents xix

9.9 Simple Hypotheses—Layout . . . . . . . . . . . . . . . . . . . . . . . . . . 1849.9.1 Results—Layout . . . . . . . . . . . . . . . . . . . . . . . . . . . . . 1859.9.2 Conclusions and Industrial Implications—Layout . . . . . 186
9.10 Simple Hypotheses—Warehouse Management . . . . . . . . . . . . . 1879.10.1 Results—Warehouse Management . . . . . . . . . . . . . . . . 1889.10.2 Conclusions and Industrial Implications—Warehouse
Management . . . . . . . . . . . . . . . . . . . . . . . . . . . . . . . 1899.11 Simple Hypotheses—Managerial Commitment . . . . . . . . . . . . . 190
9.11.1 Results—Managerial Commitment Process . . . . . . . . . 1919.11.2 Conclusions and Industrial Implications—Managerial
Commitment . . . . . . . . . . . . . . . . . . . . . . . . . . . . . . . . 1929.12 Simple Hypotheses—Clients . . . . . . . . . . . . . . . . . . . . . . . . . . 193
9.12.1 Results—Clients . . . . . . . . . . . . . . . . . . . . . . . . . . . . . 1939.12.2 Conclusions and Industrial Implications—Clients . . . . . 194
References . . . . . . . . . . . . . . . . . . . . . . . . . . . . . . . . . . . . . . . . . . . . 196
10 Structural Equation Models: Human Factor—Part I . . . . . . . . . . . 20110.1 Complex Model 1 . . . . . . . . . . . . . . . . . . . . . . . . . . . . . . . . . . 201
10.1.1 Hypotheses—Complex Model 1 . . . . . . . . . . . . . . . . . 20110.1.2 Efficiency Indexes—Complex Model 1 . . . . . . . . . . . . 20510.1.3 Results—Complex Model 1 . . . . . . . . . . . . . . . . . . . . 20510.1.4 Industrial Conclusions and Implications—Complex
Model 1 . . . . . . . . . . . . . . . . . . . . . . . . . . . . . . . . . . . 20910.1.5 Sensitivity Analysis—Complex Model 1 . . . . . . . . . . . 209
10.2 Complex Model 2 . . . . . . . . . . . . . . . . . . . . . . . . . . . . . . . . . . 21610.2.1 Hypotheses . . . . . . . . . . . . . . . . . . . . . . . . . . . . . . . . 21710.2.2 Efficiency Indexes—Complex Model 2 . . . . . . . . . . . . 22010.2.3 Results—Complex Model 2 . . . . . . . . . . . . . . . . . . . . 22110.2.4 Conclusions and Industrial Implications—Complex
Model 2 . . . . . . . . . . . . . . . . . . . . . . . . . . . . . . . . . . . 22510.2.5 Sensitivity Analysis—Complex Model 2 . . . . . . . . . . . 225
References . . . . . . . . . . . . . . . . . . . . . . . . . . . . . . . . . . . . . . . . . . . . 232
11 Structural Equation Models-Human Factor—Part II . . . . . . . . . . . 23511.1 Complex Model 3 . . . . . . . . . . . . . . . . . . . . . . . . . . . . . . . . . . 235
11.1.1 Hypotheses . . . . . . . . . . . . . . . . . . . . . . . . . . . . . . . . 23511.1.2 Efficiency Indexes—Complex Model 3 . . . . . . . . . . . . 23911.1.3 Results—Complex Model 3 . . . . . . . . . . . . . . . . . . . . 24011.1.4 Conclusions and Industrial Implications—Complex
Model 3 . . . . . . . . . . . . . . . . . . . . . . . . . . . . . . . . . . . 24411.1.5 Sensitivity Analysis—Complex Model 3 . . . . . . . . . . . 245
11.2 Complex Model 4 . . . . . . . . . . . . . . . . . . . . . . . . . . . . . . . . . . 25411.2.1 Hypotheses—Complex Model 4 . . . . . . . . . . . . . . . . . 25511.2.2 Efficiency Indexes—Complex Model 4 . . . . . . . . . . . . 258
xx Contents

11.2.3 Results—Complex Model 4 . . . . . . . . . . . . . . . . . . . . 25911.2.4 Conclusions and Industrial Implications—Complex
Model 4 . . . . . . . . . . . . . . . . . . . . . . . . . . . . . . . . . . . 26311.2.5 Sensitivity Analysis—Complex Model 4 . . . . . . . . . . . 264
References . . . . . . . . . . . . . . . . . . . . . . . . . . . . . . . . . . . . . . . . . . . . 272
12 Structural Equation Models-Technical Factors . . . . . . . . . . . . . . . . 27512.1 Complex Model 5 . . . . . . . . . . . . . . . . . . . . . . . . . . . . . . . . . . 275
12.1.1 Hypotheses . . . . . . . . . . . . . . . . . . . . . . . . . . . . . . . . 27512.1.2 Efficiency Indexes—Complex Model 5 . . . . . . . . . . . . 27912.1.3 Results—Complex Model 5 . . . . . . . . . . . . . . . . . . . . 27912.1.4 Conclusions and Industrial Implications—Complex
Model 5 . . . . . . . . . . . . . . . . . . . . . . . . . . . . . . . . . . . 28312.1.5 Sensitivity Analysis—Complex Model 5 . . . . . . . . . . . 284
12.2 Complex Model 6 . . . . . . . . . . . . . . . . . . . . . . . . . . . . . . . . . . 29212.2.1 Hypotheses—Complex Model 6 . . . . . . . . . . . . . . . . . 29312.2.2 Efficiency Indexes—Complex Model 6 . . . . . . . . . . . . 29612.2.3 Results—Complex Model 6 . . . . . . . . . . . . . . . . . . . . 29612.2.4 Conclusions and Industrial Implications—Complex
Model 6 . . . . . . . . . . . . . . . . . . . . . . . . . . . . . . . . . . . 30012.2.5 Sensitivity Analysis—Complex Model 6 . . . . . . . . . . . 302
References . . . . . . . . . . . . . . . . . . . . . . . . . . . . . . . . . . . . . . . . . . . . 309
13 Structural Equation Models—Methodological Factors . . . . . . . . . . 31313.1 Complex Model 7 . . . . . . . . . . . . . . . . . . . . . . . . . . . . . . . . . . 313
13.1.1 Hypotheses . . . . . . . . . . . . . . . . . . . . . . . . . . . . . . . . 31313.1.2 Efficiency Indexes . . . . . . . . . . . . . . . . . . . . . . . . . . . 31613.1.3 Results—Complex Model 7 . . . . . . . . . . . . . . . . . . . . 31713.1.4 Conclusions and Industrial Implications—Complex
Model 7 . . . . . . . . . . . . . . . . . . . . . . . . . . . . . . . . . . . 32113.1.5 Sensitivity Analysis—Complex Model 7 . . . . . . . . . . . 322
13.2 Integrator Model . . . . . . . . . . . . . . . . . . . . . . . . . . . . . . . . . . . 32913.2.1 Hypotheses—Integrator Model . . . . . . . . . . . . . . . . . . 33013.2.2 Validation of Variables—Integrator Model . . . . . . . . . . 33213.2.3 Efficiency Indexes . . . . . . . . . . . . . . . . . . . . . . . . . . . 33313.2.4 Results—Integrator Model . . . . . . . . . . . . . . . . . . . . . 33413.2.5 Conclusions and Industrial Implications—Integrator
Model . . . . . . . . . . . . . . . . . . . . . . . . . . . . . . . . . . . . 33713.2.6 Sensitivity Analysis—Integrator Model . . . . . . . . . . . . 338
References . . . . . . . . . . . . . . . . . . . . . . . . . . . . . . . . . . . . . . . . . . . . 344
Contents xxi

List of Figures
Fig. 1.1 TPM pillars. . . . . . . . . . . . . . . . . . . . . . . . . . . . . . . . . . . . . . . . . 11Fig. 2.1 Publications per year. . . . . . . . . . . . . . . . . . . . . . . . . . . . . . . . . . 25Fig. 2.2 Type of publication. . . . . . . . . . . . . . . . . . . . . . . . . . . . . . . . . . . 26Fig. 2.3 Magazine publications . . . . . . . . . . . . . . . . . . . . . . . . . . . . . . . . 27Fig. 2.4 Publications in the industrial sector. . . . . . . . . . . . . . . . . . . . . . . 28Fig. 2.5 Editorial publications . . . . . . . . . . . . . . . . . . . . . . . . . . . . . . . . . 29Fig. 5.1 Research problem . . . . . . . . . . . . . . . . . . . . . . . . . . . . . . . . . . . . 80Fig. 6.1 Proposed methodology . . . . . . . . . . . . . . . . . . . . . . . . . . . . . . . . 84Fig. 6.2 A simple model . . . . . . . . . . . . . . . . . . . . . . . . . . . . . . . . . . . . . 98Fig. 6.3 A complex model . . . . . . . . . . . . . . . . . . . . . . . . . . . . . . . . . . . . 98Fig. 6.4 An evaluated complex model . . . . . . . . . . . . . . . . . . . . . . . . . . . 99Fig. 8.1 Participants industrial sector and gender . . . . . . . . . . . . . . . . . . . 128Fig. 9.1 Proposed simple model A . . . . . . . . . . . . . . . . . . . . . . . . . . . . . . 150Fig. 9.2 Evaluated simple model A . . . . . . . . . . . . . . . . . . . . . . . . . . . . . 151Fig. 9.3 Proposed simple model B . . . . . . . . . . . . . . . . . . . . . . . . . . . . . . 154Fig. 9.4 Evaluated model B . . . . . . . . . . . . . . . . . . . . . . . . . . . . . . . . . . . 155Fig. 9.5 Proposed model C . . . . . . . . . . . . . . . . . . . . . . . . . . . . . . . . . . . 158Fig. 9.6 Evaluated model C . . . . . . . . . . . . . . . . . . . . . . . . . . . . . . . . . . . 160Fig. 10.1 Proposed hypotheses from Complex Model 1. . . . . . . . . . . . . . . 204Fig. 10.2 Evaluated Complex Model 1. . . . . . . . . . . . . . . . . . . . . . . . . . . . 206Fig. 10.3 Proposed hypotheses from Complex Model 2. . . . . . . . . . . . . . . 220Fig. 10.4 Evaluated Complex Model 2. . . . . . . . . . . . . . . . . . . . . . . . . . . . 221Fig. 11.1 Proposed hypotheses—Complex Model 3. . . . . . . . . . . . . . . . . . 239Fig. 11.2 Evaluated Complex Model 3. . . . . . . . . . . . . . . . . . . . . . . . . . . . 240Fig. 11.3 Proposed hypotheses—Complex Model 4. . . . . . . . . . . . . . . . . . 258Fig. 11.4 Evaluated Complex Model 4. . . . . . . . . . . . . . . . . . . . . . . . . . . . 259Fig. 12.1 Proposed hypotheses from the Complex Model 5 . . . . . . . . . . . . 278Fig. 12.2 Evaluated Complex Model 5. . . . . . . . . . . . . . . . . . . . . . . . . . . . 280Fig. 12.3 Proposed hypotheses from Complex Model 6. . . . . . . . . . . . . . . 295Fig. 12.4 Evaluated Complex Model 6. . . . . . . . . . . . . . . . . . . . . . . . . . . . 297Fig. 13.1 Proposed hypotheses from Complex Model 7. . . . . . . . . . . . . . . 316
xxiii

Fig. 13.2 Evaluated Complex Model 7. . . . . . . . . . . . . . . . . . . . . . . . . . . . 317Fig. 13.3 Hypotheses—Integrator Model . . . . . . . . . . . . . . . . . . . . . . . . . . 332Fig. 13.4 Evaluated Integrator Model. . . . . . . . . . . . . . . . . . . . . . . . . . . . . 334
xxiv List of Figures

List of Tables
Table 1.1 TPM evolution through time (Nakajima 1989;Peng 2012) . . . . . . . . . . . . . . . . . . . . . . . . . . . . . . . . . . . . . . . 7
Table 6.1 Rating scale . . . . . . . . . . . . . . . . . . . . . . . . . . . . . . . . . . . . . . 87Table 7.1 Validation indexes and type of validity . . . . . . . . . . . . . . . . . 115Table 7.2 Validity indexes from model one . . . . . . . . . . . . . . . . . . . . . . 115Table 7.3 Validity indexes from model two . . . . . . . . . . . . . . . . . . . . . . 116Table 7.4 Validity indexes from model three . . . . . . . . . . . . . . . . . . . . . 117Table 7.5 Validity indexes from model four. . . . . . . . . . . . . . . . . . . . . . 118Table 7.6 Validity indexes from model five . . . . . . . . . . . . . . . . . . . . . . 118Table 7.7 Validity indexes from model six . . . . . . . . . . . . . . . . . . . . . . 119Table 7.8 Validity indexes from model seven . . . . . . . . . . . . . . . . . . . . 120Table 7.9 Validity indexes from model eight . . . . . . . . . . . . . . . . . . . . . 121Table 7.10 Summary of items in the latent variables . . . . . . . . . . . . . . . . 122Table 8.1 Descriptive analysis: gender and industrial sector. . . . . . . . . . 128Table 8.2 Job position and work experience . . . . . . . . . . . . . . . . . . . . . 129Table 8.3 Descriptive analysis: work culture . . . . . . . . . . . . . . . . . . . . . 130Table 8.4 Descriptive analysis: suppliers . . . . . . . . . . . . . . . . . . . . . . . . 131Table 8.5 Descriptive analysis: preventive maintenance
implementation . . . . . . . . . . . . . . . . . . . . . . . . . . . . . . . . . . . . 132Table 8.6 Descriptive analysis: total productive maintenance
implementation . . . . . . . . . . . . . . . . . . . . . . . . . . . . . . . . . . . . 134Table 8.7 Descriptive analysis: technological status . . . . . . . . . . . . . . . . 135Table 8.8 Descriptive analysis: layout . . . . . . . . . . . . . . . . . . . . . . . . . . 136Table 8.9 Descriptive analysis: warehouse management. . . . . . . . . . . . . 137Table 8.10 Descriptive analysis: management commitment . . . . . . . . . . . 138Table 8.11 Descriptive analysis: customers . . . . . . . . . . . . . . . . . . . . . . . 139Table 8.12 Descriptive analysis: company benefits. . . . . . . . . . . . . . . . . . 140Table 8.13 Descriptive analysis: productivity benefits . . . . . . . . . . . . . . . 141Table 8.14 Descriptive analysis: security benefits. . . . . . . . . . . . . . . . . . . 142Table 9.1 Validation of latent variables in model A. . . . . . . . . . . . . . . . 150Table 9.2 Sensitivity analysis––simple model A . . . . . . . . . . . . . . . . . . 152
xxv

Table 9.3 Validation of the latent variables in model B . . . . . . . . . . . . . 155Table 9.4 Sensitivity analysis––simple model B. . . . . . . . . . . . . . . . . . . 157Table 9.5 Validation of the variables—model C . . . . . . . . . . . . . . . . . . 159Table 9.6 Sensitivity analysis—simple model C. . . . . . . . . . . . . . . . . . . 162Table 9.7 Relationships between Work culture and other variables . . . . 164Table 9.8 Relationships between Suppliers and other variables . . . . . . . 168Table 9.9 Relationships between the PM implementation
and other variables . . . . . . . . . . . . . . . . . . . . . . . . . . . . . . . . . 173Table 9.10 Relationships between the TPM implementation and other
variables . . . . . . . . . . . . . . . . . . . . . . . . . . . . . . . . . . . . . . . . . 177Table 9.11 Relationships between Technological status and other
variables . . . . . . . . . . . . . . . . . . . . . . . . . . . . . . . . . . . . . . . . . 181Table 9.12 Relationships between Technological status and other
variables . . . . . . . . . . . . . . . . . . . . . . . . . . . . . . . . . . . . . . . . . 185Table 9.13 Relationships between Warehouse management
and other variables . . . . . . . . . . . . . . . . . . . . . . . . . . . . . . . . . 188Table 9.14 Relationships between Managerial commitment
and other variables . . . . . . . . . . . . . . . . . . . . . . . . . . . . . . . . . 191Table 9.15 Relationships between Clients and other variables . . . . . . . . . 194Table 10.1 R-squared contribution—Complex Model 1 . . . . . . . . . . . . . . 207Table 10.2 Total indirect effects—Complex Model 1. . . . . . . . . . . . . . . . 208Table 10.3 Total effects—Complex Model 1 . . . . . . . . . . . . . . . . . . . . . . 208Table 10.4 Sensitivity analysis: Clients and Suppliers (H1)—Complex
Model 1 . . . . . . . . . . . . . . . . . . . . . . . . . . . . . . . . . . . . . . . . . 210Table 10.5 Sensitivity analysis: Clients and Managerial commitment
(H2)—Complex Model 1 . . . . . . . . . . . . . . . . . . . . . . . . . . . . 211Table 10.6 Sensitivity analysis: Suppliers and Managerial commitment
(H3)—Complex Model 1 . . . . . . . . . . . . . . . . . . . . . . . . . . . . 212Table 10.7 Sensitivity analysis: Clients and Work culture
(H4)—Complex Model 1 . . . . . . . . . . . . . . . . . . . . . . . . . . . . 213Table 10.8 Sensitivity analysis: Suppliers and Work culture
(H5)—Complex Model 1 . . . . . . . . . . . . . . . . . . . . . . . . . . . . 214Table 10.9 Sensitivity analysis: Managerial commitment
and Work culture—Complex Model 1 . . . . . . . . . . . . . . . . . . 216Table 10.10 R-squared contribution—Complex Model 2 . . . . . . . . . . . . . . 222Table 10.11 Total indirect effects—Complex Model 2. . . . . . . . . . . . . . . . 223Table 10.12 Total effects—Complex Model 2 . . . . . . . . . . . . . . . . . . . . . . 224Table 10.13 Sensitivity analysis: Managerial commitment
and Technological status—Complex Model 2 . . . . . . . . . . . . 226Table 10.14 Sensitivity analysis: Work culture and Technological
status—Complex Model 2 . . . . . . . . . . . . . . . . . . . . . . . . . . . 227Table 10.15 Sensitivity analysis: Managerial commitment and TPM
implementation—Complex Model 2 . . . . . . . . . . . . . . . . . . . . 229
xxvi List of Tables
Table 10.16 Sensitivity analysis: Work culture and TPMimplementation—Complex Model 2 . . . . . . . . . . . . . . . . . . . . 230
Table 10.17 Sensitivity analysis: Technological status and TPMimplementation—Complex Model 2 . . . . . . . . . . . . . . . . . . . . 231
Table 11.1 R-squared contribution—Complex Model 3 . . . . . . . . . . . . . . 242Table 11.2 Sum of indirect effects—Complex Model 3 . . . . . . . . . . . . . . 242Table 11.3 Total effects—Complex Model 3 . . . . . . . . . . . . . . . . . . . . . . 243Table 11.4 Sensitivity analysis: managerial commitment and suppliers
(H1)—Complex Model 3 . . . . . . . . . . . . . . . . . . . . . . . . . . . . 246Table 11.5 Sensitivity analysis: managerial commitment and benefits
for the organization (H2)—Complex Model 3 . . . . . . . . . . . . 247Table 11.6 Sensitivity analysis: suppliers and benefits for the
organization (H3)—Complex Model 3 . . . . . . . . . . . . . . . . . . 249Table 11.7 Sensitivity analysis: managerial commitment and
productivity benefits (H4)—Complex Model 3 . . . . . . . . . . . . 250Table 11.8 Sensitivity analysis: suppliers and productivity benefits
(H5)—Complex Model 3 . . . . . . . . . . . . . . . . . . . . . . . . . . . . 252Table 11.9 Sensitivity analysis: benefits for the organization and
productivity benefits (H6)—Complex Model 3 . . . . . . . . . . . . 253Table 11.10 R-squared contribution—Complex Model 4 . . . . . . . . . . . . . . 261Table 11.11 Total indirect effects—Complex Model 4. . . . . . . . . . . . . . . . 261Table 11.12 Total effects—Complex Model 4 . . . . . . . . . . . . . . . . . . . . . . 262Table 11.13 Sensitivity analysis: suppliers and layout (H1)—Complex
Model 4 . . . . . . . . . . . . . . . . . . . . . . . . . . . . . . . . . . . . . . . . . 264Table 11.14 Sensitivity analysis: suppliers with benefits for the
organization (H2)—Complex Model 4 . . . . . . . . . . . . . . . . . . 266Table 11.15 Sensitivity analysis: layout and benefits for the organization
(H3)—Complex Model 4 . . . . . . . . . . . . . . . . . . . . . . . . . . . . 267Table 11.16 Sensitivity analysis: suppliers and security benefits
(H5)—Complex Model 4 . . . . . . . . . . . . . . . . . . . . . . . . . . . . 269Table 11.17 Sensitivity analysis: layout and security benefits
(H5)—Complex Model 4 . . . . . . . . . . . . . . . . . . . . . . . . . . . . 270Table 11.18 Sensitivity analysis: benefits for the organization and
security benefits (H6)—Complex Model 4 . . . . . . . . . . . . . . . 271Table 12.1 R-squared contribution—Complex Model 5 . . . . . . . . . . . . . . 281Table 12.2 Total indirect effects—Complex Model 5. . . . . . . . . . . . . . . . 282Table 12.3 Total effects—Complex Model 5 . . . . . . . . . . . . . . . . . . . . . . 283Table 12.4 Sensitivity analysis: Technological status and Layout
(H1)—Complex Model 5 . . . . . . . . . . . . . . . . . . . . . . . . . . . . 285Table 12.5 Sensitivity analysis: Technological status and PM
implementation (H2)—Complex Model 5 . . . . . . . . . . . . . . . . 287Table 12.6 Sensitivity analysis: Layout and PM implementation
(H3)—Complex Model 5 . . . . . . . . . . . . . . . . . . . . . . . . . . . . 287
List of Tables xxvii

Table 12.7 Sensitivity analysis: Technological status and TPMimplementation (H4)—Complex Model 5 . . . . . . . . . . . . . . . . 288
Table 12.8 Sensitivity analysis: Layout and TPM implementation(H5)—Complex Model 5 . . . . . . . . . . . . . . . . . . . . . . . . . . . . 290
Table 12.9 Sensitivity analysis: PM implementation and TPMimplementation (H6)—Complex Model 5 . . . . . . . . . . . . . . . . 291
Table 12.10 R-squared decomposition––Complex Model 6 . . . . . . . . . . . . 298Table 12.11 Total indirect effects—Complex Model 6. . . . . . . . . . . . . . . . 299Table 12.12 Total effects––Complex Model 6 . . . . . . . . . . . . . . . . . . . . . . 300Table 12.13 Sensitivity analysis: PM implementation and Warehouse
management (H1)—Complex Model 6 . . . . . . . . . . . . . . . . . . 302Table 12.14 Sensitivity analysis: PM implementation and Benefits
for the Company (H2)—Complex Model 6 . . . . . . . . . . . . . . 304Table 12.15 Sensitivity analysis: Warehouse management and Benefits
for the company (H3)—Complex Model 6 . . . . . . . . . . . . . . . 305Table 12.16 Sensitivity analysis: PM implementation and Productivity
benefits (H4)—Complex Model 6. . . . . . . . . . . . . . . . . . . . . . 306Table 12.17 Sensitivity analysis: Warehouse management and
Productivity benefits (H5)—Complex Model 6. . . . . . . . . . . . 308Table 13.1 Size effects—Complex Model 7 . . . . . . . . . . . . . . . . . . . . . . . 319Table 13.2 Total indirect effects, effects size, and p-values . . . . . . . . . . . 320Table 13.3 Total effects, size effects, and p-values. . . . . . . . . . . . . . . . . . 320Table 13.4 Sensitivity analysis: Technological status and TPM
implementation (H1)—Complex Model 7 . . . . . . . . . . . . . . . . 322Table 13.5 Sensitivity analysis: Technological status and Benefits
for the organization (H2)—Complex Model 7 . . . . . . . . . . . . 324Table 13.6 Sensitivity analysis: TPM implementation and Benefits
for the organization (H3)—Complex Model 7 . . . . . . . . . . . . 325Table 13.7 Sensitivity analysis: Technological status and Safety
benefits (H4)—Complex Model 7 . . . . . . . . . . . . . . . . . . . . . . 327Table 13.8 Sensitivity analysis: TPM implementation and Safety
benefits (H4)—Complex Model 7. . . . . . . . . . . . . . . . . . . . . . 328Table 13.9 Validity indexes—Integrator Model . . . . . . . . . . . . . . . . . . . . 333Table 13.10 R-squared contribution—Integrator Model . . . . . . . . . . . . . . . 335Table 13.11 Total effects—Integrator Model . . . . . . . . . . . . . . . . . . . . . . . 336Table 13.12 Sensitivity analysis: Human factor and Operating
factor—Integrator Model . . . . . . . . . . . . . . . . . . . . . . . . . . . . 338Table 13.13 Sensitivity analysis: Human factor and Benefits—Integrator
Model. . . . . . . . . . . . . . . . . . . . . . . . . . . . . . . . . . . . . . . . . . . 340Table 13.14 Sensitivity analysis: Operating factor and
Benefits—Integrator Model . . . . . . . . . . . . . . . . . . . . . . . . . . 341Table 13.15 Possible combined scenarios arrangement . . . . . . . . . . . . . . . 342Table 13.16 Sensitivity analysis: Human factor and Operating
factor along with Benefits—Integrator Model. . . . . . . . . . . . . 343
xxviii List of Tables

Part IConcepts and Evolution of TPM

Chapter 1TPM Background
Abstract Total Productive Maintenance is considered a lean manufacturing toolincreasingly used within the current industrial environments. Therefore, theobjective of this chapter is to present a series of concepts and definitions describedthroughout the literature review, discuss them, and show its evolution as well.
1.1 TPM Definition
According to the literature review, there are some definitions about the TPMconcept, therefore, with the purpose of having a broader knowledge and approach,which, although it has changed over time, still has the same basis. In addition, thefollowing is a list of definitions about TPM.
• TPM is productive maintenance carried out by all the employees through smallgroups of activities (Nakajima 1989).
• TPM is an innovative maintenance approach that optimizes the equipmenteffectiveness, eliminates breakdowns, and promotes the operators’ autonomousmaintenance (Nakajima 1988).
• TPM is an association between the maintenance and productive functions in theorganization to improve product quality, reduce waste, reduce manufacturingcosts, increase equipment availability, and improve the company’s maintenancestatus (Rhyne 1990).
• TPM is a production-driven improvement methodology that is designed tooptimize equipment reliability and ensure the efficient management in plantassets (Ginder et al. 1995).
• TPM is reduced to understanding the following strategies (Suzuki 1996):
– Maximizing the overall efficiency of the team,– Establishing a comprehensive preventive maintenance (PM) system that
covers the entire life of the team,– Involving all the departments that plan, use, and maintain equipment,
© Springer Nature Switzerland AG 2019J. R. Díaz-Reza et al., Impact Analysis of Total Productive Maintenance,https://doi.org/10.1007/978-3-030-01725-5_1
3

– Involve all employees from the senior management along with the machineoperators,
– Promote the PM through an organized management, that is, through a smallgroup of autonomous activities.
• TPM is not a maintenance program itself, it is a team management program thatcombines and promotes the concepts of continuous improvement, and totalquality as well as the employees’ empowerment to achieve zero stoppages anddefects (Stephens 2004).
• TPM is a procedure to introduce maintenance considerations into the organi-zation’s activities. It involves an operative and maintenance team that worktogether to reduce waste, minimize downtimes, and improve the final productquality (Eti et al. 2004).
• TPM is a methodology that aims to increase the availability/effectiveness of theexisting equipment in a certain situation, through the effort of minimizing entries(improving and maintaining the equipment at an optimum level to reduce thelife cycle cost), and the investment in human resources that results in a betterhardware usage (Chan et al. 2005).
• TPM is a larger part of a Lean initiative, and its goal is generally to improveuptime and equipment reliability (Press 2005).
• TPM is a philosophy that involves the entire organization, which increases theknowledge levels, performance, efficiency, and teamwork in each area (Sunet al. 2003).
• TPM is a maintenance program, which implies a recently defined concept forplants and equipment maintenance; it can be considered as the “medical sci-ence” for industrial machines (Mâinea et al. 2010).
• TPM represents a system for the effective technology process usage (Friedliet al. 2010).
• TPM is a set of techniques to ensure that each machine in a production processcan always perform the required tasks (Anvari et al. 2014).
• TPM is a continuous improvement process focused on structured teams thatseeks to optimize production effectiveness by identifying and eliminatingequipment losses as well as production efficiency, throughout the productionsystem life cycle through the employees’ active participation at all levels of theoperational hierarchy (Attri et al. 2013a).
• TPM is a maintenance management approach focused on involving all theemployees of an organization in the equipment improvement. It consists of avariety of methods, known for the maintenance management experience that areeffective in improving reliability, quality, and production (Das et al. 2014).
• TPM includes maintenance prevention, maintenance improvement, and pre-ventive maintenance (Benjamin 1997; Filho and Utiyama 2016).
• TPM is the combination of preventive maintenance activities and the TotalQuality Management philosophy to create a TPM culture by providing
4 1 TPM Background
integration with maintenance, engineering, and management units to ensure thatemployees protect the equipment and the machinery that they use and ensurethat machines work always correctly (Arslankaya and Atay 2015).
• TPM is a proactive approach that aims to identify problems as soon as possible,and plans to avoid any problems before they happen; its slogan is zero errors,zero accidents, and zero losses (Kiran 2016).
• TPM is widely used to improve the effective equipment usage and to obtain aworld-class manufacturing system in quality and cost terms (Shinde and Prasad2017).
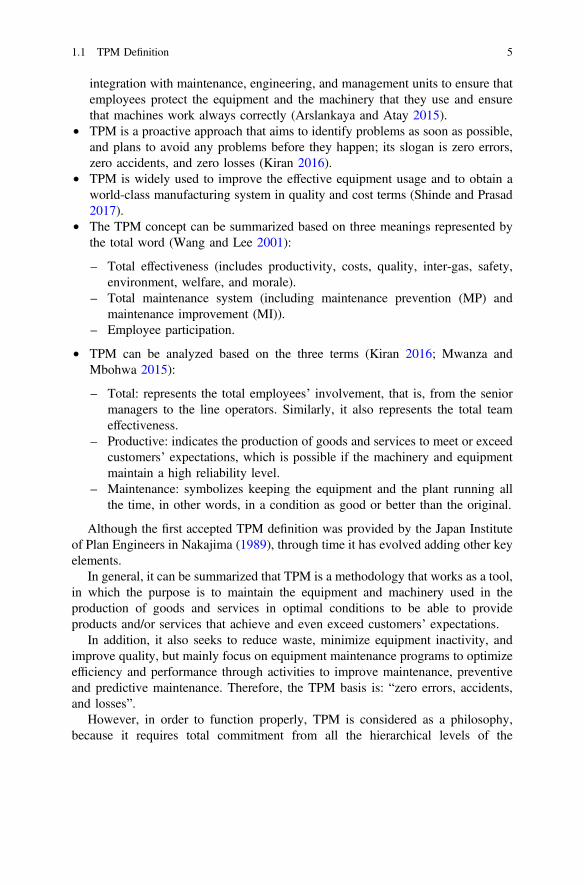
• The TPM concept can be summarized based on three meanings represented bythe total word (Wang and Lee 2001):
– Total effectiveness (includes productivity, costs, quality, inter-gas, safety,environment, welfare, and morale).
– Total maintenance system (including maintenance prevention (MP) andmaintenance improvement (MI)).
– Employee participation.
• TPM can be analyzed based on the three terms (Kiran 2016; Mwanza andMbohwa 2015):
– Total: represents the total employees’ involvement, that is, from the seniormanagers to the line operators. Similarly, it also represents the total teameffectiveness.
– Productive: indicates the production of goods and services to meet or exceedcustomers’ expectations, which is possible if the machinery and equipmentmaintain a high reliability level.
– Maintenance: symbolizes keeping the equipment and the plant running allthe time, in other words, in a condition as good or better than the original.
Although the first accepted TPM definition was provided by the Japan Instituteof Plan Engineers in Nakajima (1989), through time it has evolved adding other keyelements.
In general, it can be summarized that TPM is a methodology that works as a tool,in which the purpose is to maintain the equipment and machinery used in theproduction of goods and services in optimal conditions to be able to provideproducts and/or services that achieve and even exceed customers’ expectations.
In addition, it also seeks to reduce waste, minimize equipment inactivity, andimprove quality, but mainly focus on equipment maintenance programs to optimizeefficiency and performance through activities to improve maintenance, preventiveand predictive maintenance. Therefore, the TPM basis is: “zero errors, accidents,and losses”.
However, in order to function properly, TPM is considered as a philosophy,because it requires total commitment from all the hierarchical levels of the
1.1 TPM Definition 5


