+ All Categories
Home > Documents > Impact of Acknowledgments on Application …rek/Research/Papers/WPC15.pdfImpact of Acknowledgments...

Impact of Acknowledgments on Application …rek/Research/Papers/WPC15.pdfImpact of Acknowledgments...

Date post: 10-Apr-2018
Category:
Upload: leminh
View: 214 times
Download: 1 times
Share this document with a friend
26
Impact of Acknowledgments on Application Performance in 4G LTE Networks Brett Levasseur 1 Mark Claypool 2 Robert Kinicki 2 Published online: 23 July 2015 Ó Springer Science+Business Media New York 2015 Abstract Fourth generation (4G) Long Term Evolution (LTE) is a new mobile phone network standard designed to provide both the capacity and Quality of Service (QoS) needed to support multimedia applications. Recent research in LTE has explored modifi- cations to QoS setups, creating MAC layer schedulers and modifying the current QoS architecture. However, what has not been fully explored are the effects of LTE retrans- mission choices and capabilities on applications and quality of experience. This work examines the impact of LTE wireless acknowledgment modes and timer settings on Voice over IP (VoIP), file transfer and video streaming applications. Issues explored include interaction between application performance, network transport protocols, LTE acknowl- edgment mode, and wireless conditions. Network Simulator 3 simulations show that LTE retransmissions improve FTP throughput. With delay sensitive applications, such as VoIP and video, the benefits of LTE retransmissions are dependent on the loss rate and specific LTE settings. LTE providers should configure their networks to use retransmission policies appropriate for the type of application traffic. Keywords LTE Retransmission RLC MAC t-Reordering t-StatusProhibit This work is sponsored by the Department of the Air Force under Air Force Contract FA8721-05-C-0002. Opinions, interpretations, conclusions and recommendations are those of the author and not necessarily endorsed by the United States Government. & Brett Levasseur [email protected] Mark Claypool [email protected] Robert Kinicki [email protected] 1 MIT Lincoln Laboratory, 244 Wood Street, Lexington, MA, USA 2 Worcester Polytechnic Institute, 100 Institute Road, Worcester, MA, USA 123 Wireless Pers Commun (2015) 85:2367–2392 DOI 10.1007/s11277-015-2910-4
Transcript

Impact of Acknowledgments on Application Performancein 4G LTE Networks

Brett Levasseur1 • Mark Claypool2 • Robert Kinicki2

Published online: 23 July 2015� Springer Science+Business Media New York 2015

Abstract Fourth generation (4G) Long Term Evolution (LTE) is a new mobile phone

network standard designed to provide both the capacity and Quality of Service (QoS)

needed to support multimedia applications. Recent research in LTE has explored modifi-

cations to QoS setups, creating MAC layer schedulers and modifying the current QoS

architecture. However, what has not been fully explored are the effects of LTE retrans-

mission choices and capabilities on applications and quality of experience. This work

examines the impact of LTE wireless acknowledgment modes and timer settings on Voice

over IP (VoIP), file transfer and video streaming applications. Issues explored include

interaction between application performance, network transport protocols, LTE acknowl-

edgment mode, and wireless conditions. Network Simulator 3 simulations show that LTE

retransmissions improve FTP throughput. With delay sensitive applications, such as VoIP

and video, the benefits of LTE retransmissions are dependent on the loss rate and specific

LTE settings. LTE providers should configure their networks to use retransmission policies

appropriate for the type of application traffic.

Keywords LTE � Retransmission � RLC � MAC � t-Reordering � t-StatusProhibit

This work is sponsored by the Department of the Air Force under Air Force Contract FA8721-05-C-0002.Opinions, interpretations, conclusions and recommendations are those of the author and not necessarilyendorsed by the United States Government.

& Brett [email protected]

Mark [email protected]

Robert [email protected]

1 MIT Lincoln Laboratory, 244 Wood Street, Lexington, MA, USA

2 Worcester Polytechnic Institute, 100 Institute Road, Worcester, MA, USA

123

Wireless Pers Commun (2015) 85:2367–2392DOI 10.1007/s11277-015-2910-4

1 Introduction

The increase in mobile technology capabilities has turned mobile traffic’s penetration into

Internet traffic penetration. In 2013, Cisco reported that the Internet added over 500 million

mobile devices with 77 % of this growth due to smartphones [9]. Global mobile data traffic

grew 81 % and mobile video traffic accounted for 53 % of all mobile data traffic. Fourth

generation (4G) connections generated 14.5 times more traffic on average than non-4G

connections. While 4G provided only 2.9 % of all mobile connections in 2013, it generates

30 % of the mobile traffic and is predicted to handle half of all mobile traffic by 2018.

A common networking dilemma is managing throughput while minimizing response

time. This is especially challenging for wireless networks where communicating nodes are

often mobile, resulting in adaptive wireless capacities due to signal quality fluctuations

caused by interference from obstructions and radio wave emitting sources. Wireless net-

works address the variability in signal quality with multiple channels, encoding redun-

dancy and retransmissions.

The choice of retransmission strategy can have a large impact on end user applications.

4G Long Term Evolution (LTE) provides retransmissions at two different network layers

with several parameters that control retransmission strategies. These parameter settings

vary the impact of LTE retransmission schemes on the quality of experience for the

wireless end users’ applications. Selecting the best parameter settings is complicated

because applications such as email or file transfer need error-free transmissions while

applications such as Voice over IP (VoIP) require minimal network delay and can accept

occasional loss. Additionally, LTE timers interact with these parameters to determine when

wireless data is lost and to trigger retransmissions. However, to the best of our knowledge

there has been no systematic exploration of the effects of 4G LTE retransmissions and

timer settings on application performance.

Previous research into LTE retransmissions focused on one of two retransmission

techniques at the Medium Access Control (MAC) and Radio Link Control (RLC) layers in

LTE but not both. Kawser et al. [15] looked at how using the maximum number of MAC

layer retransmissions does not always improve the total amount of data lost. Makidis [16]

simulated RLC retransmissions with Web and FTP traffic. While this work demonstrates

the impact of using retransmissions it does not consider any of the adjustable parameters

with the RLC layer. Other research into LTE retransmissions like Asheralieva et al. [6]

looked at VoIP simulations in LTE with and without MAC layer retransmissions. How-

ever, this work did not investigate the impact of the RLC layer retransmissions.

Our paper examines the effects of 4G LTE configurations on the retransmission of last

hop data for delay sensitive applications (e.g., VoIP and MPEG video) and throughput

sensitive applications (e.g., file transfer). We enhanced the NS-3 simulator to support the

use of negative acknowledgments (NACKs) in 4G LTE acknowledged mode (AM), one

component of the LTE specification not implemented in this simulator. Detailed simula-

tions with varied wireless loss rates demonstrate the sensitivity of application performance

to LTE timer settings and guide recommendations for when LTE should use acknowledged

mode versus unacknowledged mode for delay sensitive and throughput sensitive

applications.

The rest of this paper is organized as follows: Sect. 2 provides 4G LTE background;

Sect. 3 details other research into LTE retransmissions; Sect. 4 describes our extensions to

the LTE specification in NS-3 and our LTE experiments; Sect. 5 analyzes the results; and

Sect. 6 summarizes our conclusions and possible future work.

2368 B. Levasseur et al.

123

2 Background

Figure 1 shows the two main components in an LTE network. The Evolved Packet Core

(EPC) connects a wireless access point or eNodeB to an IP network and the Evolved

Universal Mobile Telecommunications System Terrestrial Radio Access (E-UTRA) con-

nects the eNodeB to phones, tablets and computers (User Equipment or UEs). The

E-UTRA interface includes two LTE link layers between the physical and IP layer—the

Media Access Control (MAC) and Radio Link Control (RLC) layers. Sitting above the

physical layer, the MAC layer handles scheduling, notification of transmission opportu-

nities and retransmissions. Located above the MAC layer, the RLC handles out of order

arrival, error correction and, optionally, retransmission of data not recovered by the MAC

layer.

2.1 Physical Resource Blocks

The physical layer handles transmitting data over radio waves between the eNodeB and the

UE. LTE transmits data in physical resource blocks (PRBs). One PRB takes up a 0.5 ms

unit of time, called a slot, and 15 kHz of radio bandwidth. The more contiguous radio

frequencies a LTE network has the more data can be sent in parallel. The smallest physical

resource LTE can send is a transport block that occupies a 1 ms transmission time interval

(TTI) (2 slots). The number of PRBs used is determined by the scheduler based on

availability in the network. The maximum number of PRBs in a transport block is 100.

2.2 Channel Quality

Similar to other wireless standards, LTE monitors the quality of the wireless signal and

adjusts the encoding rate of transmissions for better performance. A UE regularly checks

the received signal quality and reports a channel quality indicator (CQI) value. The CQI is

a number from one to fifteen that represents the encoding scheme and code rate to use

during transmissions. A value of one indicates a poor signal quality while a value of fifteen

indicates the best possible signal. Table 1 lists the exact modulation method and coding

rate for each CQI value. The code rate indicates how many bits transmitted out of every

1024 bits contain user data. The efficiency column indicates the spectral efficiency of the

radio resources or the amount of user data that is transmitted in bits/s/Hz. While the UE

requests a specific CQI from the eNodeB, there is no guarantee that the eNodeB will use

this modulation and encoding scheme. The CQI represents the data encoding scheme and

code rate to use such that the block error rate (BLER) of received data is at most

10 % [10]. BLER is a major metric in determining exactly how LTE sends data.

Fig. 1 Evolved packet core

Impact of Acknowledgments on Application Performance in 4G LTE… 2369

123

2.3 Hybrid Automatic Repeat Request (HARQ)

The LTE transport block is the data packet sent across the wireless link. The MAC layer

handles retransmission of transport blocks with Hybrid Automatic Repeat Request

(HARQ). When a transport block arrives, the MAC layer uses forward error correction

(FEC) and parity bits to check for errors [2]. If no errors are detected, the MAC layer

receiver sends an ACK to the MAC sender and passes the data up to the higher layers. If

errors are detected, the MAC layer receiver sends a NACK and keeps the transport block to

possibly combine it with other retransmitted copies of the damaged data to recreate the

original data through a soft combination process [2]. For downlink transmissions (from the

eNodeB to the UE), HARQ sends up to three retransmissions [5]. If any MAC layer

packets arrive without error or if the MAC layer soft combines any set of them to produce a

valid packet, HARQ sends the packet up to the RLC layer. If, after three retransmissions,

HARQ cannot reproduce the transport block through soft combining, the block is treated as

lost.

The HARQ acknowledgment approach is a stop-and-wait protocol. New data is only

sent once a transport block is acknowledged or the maximum number of retransmissions is

reached. To improve transmission efficiency, the MAC layer maintains multiple HARQ

processes. These processes transmit and wait for acknowledgments one after another to use

all the transmission opportunities. The number of HARQ processes depends on the

duplexing scheme, with eight HARQ processes used with Frequency Division Duplexing

(FDD) and the number of processes for Time Division Duplexing (TDD) depending on the

specific downlink/uplink configuration.

When using eight HARQ processes, a transmission from one process arrives at the

receiving node during a slot. The receiver takes up to 4 ms to determine if the data arrived

successfully or not. The receiver can then send an ACK or NACK back to the sender. The

sender waits another 4 ms before either resending the previous data or sending new data.

Table 1 CQI values [3]CQI index Modulation Code rate � 1024 bits Efficiency

bits/s/Hz

0 Out of range

1 QPSK 78 0.1523

2 QPSK 120 0.2344

3 QPSK 193 0.3770

4 QPSK 308 0.6016

5 QPSK 449 0.8770

6 QPSK 602 1.1758

7 16QAM 378 1.4766

8 16QAM 490 1.9141

9 16QAM 616 2.4063

10 64QAM 466 2.7305

11 64QAM 567 3.3223

12 64QAM 666 3.9023

13 64QAM 772 4.5234

14 64QAM 873 5.1152

15 64QAM 948 5.5547

2370 B. Levasseur et al.

123

This makes a round trip time of 8 ms when using frequency division duplexing

(FDD) [10]. Since the downlink has a maximum of three retransmissions and the round trip

time for the MAC layer using FDD is 8 ms, then the longest interval a transport block can

take is 28 ms before the MAC layer gives up on the transmission.

2.4 RLC Acknowledged/Unacknowledged Mode

The RLC layer provides segmentation and reassembly between the original data frames

and those encoded in the transport blocks [1]. The RLC retransmission scheme employs

two transmission modes—acknowledged mode (AM) and unacknowledged mode (UM).

Both RLC modes wait for a set interval of time based on a timer to correct out of order data

(due to MAC layer HARQ retransmissions). UM only waits for reordering before sending

current data to higher layers whereas AM sends ACKs and NACKs for data not recovered

by the MAC layer.

To support these transmission modes, the RLC layer uses timers and state variables.

Both modes use the t-Reordering timer to control the RLC wait interval on out of order

MAC data before either: (1) considering the data lost and handing off to the next network

layer (in UM mode), or (2) updating which RLC layer packets to ACK or NACK (in AM

mode). This timer gives the MAC’s HARQ process a chance to recover the lost data. If

t-Reordering is set too low, data the MAC layer could still recover may be discarded as lost

(UM) or NACKed prematurely for retransmission (AM). If t-Reordering is set too high,

received data may be held unnecessarily long before requesting a retransmission (AM) or

delivering it to upper layers (UM).

AM has an additional t-StatusProhibit timer that controls transmission of STATUS

messages. STATUS is an RLC control message that preempts user data messages. An AM

STATUS message sends ACKs and NACKs between the eNodeB and the UE. STATUS

messages are either polled by the sender or triggered on the receiver during certain events.

AM mode sets t-StatusProhibit after sending a STATUS message to prevent sending

another STATUS message until the timer expires. When t-StatusProhibit is set too low,

many duplicate STATUS messages may congest the transmission medium, but if t-Sta-

tusProhibit is set too high, the RLC sender may continue transmitting new data when old

data needs to be retransmitted.

2.5 LTE Quality of Service (QoS)

One of the main goals for 4G network technologies is to provide QoS support to handle

demand for multimedia applications. The LTE specification defines some goals and

capabilities to provide QoS and leaves other components up to implementers.

LTE uses bearers, which are a set of network configuration settings that uniquely

identify groups of packet flows to receive the same QoS treatment [11]. There is a high

level end-to-end bearer that logically connects the UE to the entity with which they are

interacting. In reality, this bearer is made up of multiple components that need to deal with

the specific protocols and physical layer capabilities that make up the LTE network. For

instance, the bearer that connects the UE to the eNodeB is called a radio bearer as it deals

with the physical radio interface. In LTE, QoS features can be applied from the UE

connected to the radio interface to the packet gateway. Subsequently, the data is trans-

mitted over the open Internet where the LTE network can no longer manage QoS.

LTE maps traffic to bearers using packet filters known as Traffic Flow Templates (TFT).

A TFT filters packets based on protocol, IP address range, port numbers and

Impact of Acknowledgments on Application Performance in 4G LTE… 2371

123

uplink/downlink direction. All packet flows mapped to a particular bearer receive the same

packet-forwarding treatment including scheduling, queue management and other QoS

techniques [11]. There is one bearer per QoS class. While a UE has multiple bearers, each

is classified as Guaranteed Bit Rate (GBR) or non-GBR. As their names suggest, GBR

bearers support a minimal bit rate for all of its packet flows while non-GBR bearers make

no such promise.

Bearers are also classified based on their creation scheme. A bearer can be either a

default bearer or a dedicated bearer [11]. The default bearer is created when the UE first

connects to the LTE network. This default bearer is also a non-GBR bearer as it must exist

regardless of the current network conditions. A dedicated bearer is any other bearer created

to satisfy a particular QoS requirement. The TFT of the default bearer allows all traffic,

while each dedicated bearer gets a specific TFT to separate its traffic from other flows.

3 Related Work

As cellular networks and mobile devices have become more common, so too has research

into these areas. This section covers research in LTE, broadly categorized into four areas:

application use (Sect. 3.1), measurement studies (Sect. 3.2), retransmission use (Sect. 3.3)

and VoIP and FTP studies (Sect. 3.4).

3.1 Applications in Cellular Networks

Xu et al. [21] examined the types of applications used by phones across the US by a tier-1

cellular network provider. They collected data from all links within the network from the

radio access (cell phone towers) to the Internet over a one week period in August 2010.

The authors found that 20 % of mobile applications dealt with content local to the users

such as local news and radio stations. Many applications had identifiable usage patterns,

such as news applications in the morning and games when traveling. Personalized Internet

radio was responsible for the most data use, more than 3 TB of data over the week. This

demonstrates that streaming audio is a popular application for mobile devices.

Bohmer et al. [8] studied the applications users ran on their mobile phones including

how and where the users employed these applications. The authors created an Android

application that collected data on when applications were installed, opened, closed, and

updated. The authors collected data for 4125 users from August 2010 to January 2011.

They found that users spent an average of about 59 min/day on their mobile devices.

Mobile application were also most likely used for communication through phone calls,

emails, texts and other communication applications. This research concludes that people

regularly use mobile phones for communication type applications (i.e., delay sensitive

applications).

3.2 LTE Measurements

Huang et al. [14] examined data collected from an LTE network in a US city in October

2012. The authors characterized the network protocols, network characteristics and types

of applications used in the data set. They found that TCP made up about 95 % of traffic

flows and 97 % of bytes transmitted. UDP accounted for the majority of the remaining

flows and bytes used. Downlink data sent from the tower to the phone generated the

2372 B. Levasseur et al.

123

majority of the data in the network. Of the top 5 % of flows (by payload size), about 75 %

were related to video or audio applications. The authors also found that about 38 % of TCP

flows did not have any TCP layer retransmissions. Unfortunately, the authors did not have

access to RLC or other LTE settings.

3.3 Retransmissions

Kawser et al. [15] investigated saving radio resources by limiting the maximum number of

Hybrid Automatic Repeat Request (HARQ) retransmissions. Their reasoning was that for

nodes experiencing poor radio conditions, issuing three retransmissions would not provide

a successful transmission or soft combination sufficient to recover the lost data. The

authors used an LTE link layer simulator to examine the difference in the bit error rate of

the wireless transmission with poor signal strength. Their results show only a small per-

formance improvement when using the full three retransmissions. The authors suggest that

for poor radio conditions, HARQ should only send one or two retransmissions. This study

does not include retransmissions from the RLC layer and does not consider the impact of

RLC retransmissions on application performance.

Makidis [16] implemented and evaluated the 4G Radio Link Control (RLC) layer

acknowledged mode (AM). He implemented RLC in ns-2 and tested it with TCP based

applications including Web browsing over HTTP and FTP traffic. The simulations show

that RLC AM works well with applications that experience contention. Comparing RLC

AM with two other selective repeat protocols, he shows that adaptive selective repeat is the

most effective when maximizing TCP throughput. The throughput for Web browsing

traffic in RLC AM is significantly lower than both the selective repeat variants. RLC AM

performs better when dealing with large FTP file transfers. While this work examines RLC

AM, the author did not investigate its interaction with the other LTE layers. This is

problematic as the loss rate applied to these simulations does not account for MAC layer

HARQ retransmissions. Moreover, the author did not implement RLC UM or run any tests

with this option.

3.4 VoIP and FTP in LTE

Asheralieva et al. [6] simulated running VoIP applications over LTE. The authors focused

on two packet scheduling mechanisms and whether or not to use HARQ. Their simulations

took into account scheduling along with the physical and MAC layers. The authors find

that HARQ can improve QoS for VoIP services, but they did not include the RLC layer that

handles the reordering of packets during loss nor did they consider if the RLC layer was

enforcing retransmission of lost packets.

Masum et al. [17] examined the end-to-end delay of VoIP applications in LTE net-

works. The authors used the OPNET simulator and created representative networks to

examine a baseline VoIP network, a congested VoIP network and a congested VoIP and

FTP network. In these scenarios, they modified UE speed, packet loss and the available

bandwidth. They discovered that when there is no mobility, the end-to-end delay is slightly

higher for networks congested with only VoIP traffic. In the other scenarios, the end-to-end

delay was better when nodes were mobile. In congested VoIP networks the speed of the

mobile UE had little impact on packet loss. For networks with mixed VoIP-FTP traffic,

stationary nodes saw little packet loss while mobile nodes experienced more loss. How-

ever, their work does not consider the RLC layer settings and there is no information on the

performance in the MAC or RLC layers.

Impact of Acknowledgments on Application Performance in 4G LTE… 2373

123

4 Approach

Our research uses the NS-3 simulator1 to examine the impact of adjusting RLC parameters

on the performance of applications running over 4G LTE networks. Specifically, this paper

considers three mobile applications with distinct QoS criteria and network characteristics:

Voice over IP (VoIP), file transfer (FTP) and video streaming. VoIP applications send a

small volume of data at a relatively low transmission rate, and need a low packet delay and

packet loss rate. In contrast, typically high volume FTP applications require zero loss while

tolerating short-term delays as long as the overall file transfer throughput is high. Video

streaming requirements depend on the use of the video—a video stream of a television

show or movie often uses TCP to ensure all of the data arrives and is relatively insensitive

to delay, while a video conference often uses UDP to support interactive conversations and

requires a low delay.

4.1 Simulator Additions

The LTE module2 for NS-3 version 3.16 did not support using NACKs in Acknowledged

Mode (AM). After several months of discussing this issue at the NS-3 user forum,3 we

developed NACK support for the NS-3 simulator.

The initial contribution was a change to the creation of the RLC STATUS Packet Data

Unit (PDU) to enable it to serialize and de-serialize NACK sequence numbers (SNs). The

ACK SN field in the RLC STATUS PDU represents the highest SN that can be ACKed

followed by SNs for each of the NACKed PDUs. Originally, the LTE simulator did not

support the use of the NACK SN. Instead the simulator always sent back one NACK in the

status message with a value of 1024. Our contribution to the code allowed a set of SNs to

be added to the status PDU that would be listed as NACKed.

For the code that adds the NACK sequence numbers, when the RLC AM code con-

structs a STATUS PDU it iterates over its receive window to find missing PDUs and adds

them to a list for the STATUS PDU. Adding these numbers to the PDU involved creating

serialization code in which to embed the sequence numbers, and creating corresponding

de-serialization code to extract the numbers later. The ACK SN field holds the highest

sequence number that can be ACKed at the time of the STATUS message. The RLC AM

state variable, called VR(MS), stores this value.

Along with the ACK SN, the STATUS message contains a NACK SN for each PDU

missing up to the ACKed SN or as many that can fit into a maximum-sized transport block

(taking into account the other required STATUS PDU fields).

Once the code to add a list of NACK sequence numbers worked correctly, our next set

of additions to the simulator involved determining which sequence numbers needed to be

ACKed or NACKed for a STATUS PDU. The receiving side of the RLC AM layer has five

state variables: VR(R), VR(MR), VR(X), VR(MS) and VR(H). These variables hold the

sequence numbers for the lower bound of the window, upper bound of the window,

sequence number after the PDU triggering the reordering timer, ACK sequence number

and the largest sequence number seen so far, respectively.

1 http://www.nsnam.org/.2 http://networks.cttc.es/mobile-networks/software-tools/lena/.3 https://groups.google.com/forum/#!topic/ns-3-users/CEfmMX3IRBw.

2374 B. Levasseur et al.

123

Initially the developers thought that the only sequence numbers that could be NACKed

were those higher than the sequence number ACKed. The reason for this arose from a

difference in understanding the RLC specification [1] concerning incrementing the vari-

able VR(MS). Specifically section 5.1.3.2.3 of [1] states:

When a RLC data PDU with SN = x is placed in the reception buffer, the receiving

side of an AM RLC entity shall: if all byte segments of the AMD PDU with SN =

VR(MS) are received: update VR(MS) to the SN of the first AMD PDU with SN

[current VR(MS) for which not all byte segments have been received; [1]

This statement indicates that VR(MS) grows up to the first missing PDU and therefore

only sequence numbers larger than the ACK can be used for NACK. The reason for this

disconnect is due in part to the writing in the specification document. Section 5.1.3.2.3

gives the impression that VR(MS) cannot allow sequence numbers smaller than ACK to be

used for a NACK. However, section 5.1.3.2.4 of [1] indicates that when the t-reordering

timer expires, VR(MS) is incremented to the SN of the first PDU with a sequence number

CVR(X) for which not all byte segments have been received. In general, the specification

has several unclear cases where it indicates a variable behaves a particular way, and then

another section sometimes pages away would add a caveat for when the behavior deviates.

In this case, after discussing this issue with the developers, they updated the code to

account for incrementing VR(MS) when t-Reordering expires. Additionally, we added

code to enable the transmitting node to use NACKs to trigger resending missing data and

we modified the mechanism that updated the state variables.

4.2 Simulation Setup

This paper uses the network topology in Fig. 2 for all the simulations discussed. This

configuration ensures the 4G LTE wireless link from the access point (eNodeB) to the user

equipment (UE) is the bottleneck by having the connection from the server to the packet

gateway (PGW) be a high-capacity wired connection. Table 2 itemizes the Internet and

LTE settings for our NS-3 simulations. See Sect. 2 for details on some of the indicated

LTE parameters. Some of the default LTE parameters that we did not adjust include the

EARFCN values (which defines the LTE channel carrier number for downlink and uplink),

poll PDU, poll Bytes and t-PollRetransmit (which impacts the sender’s frequency for

requesting RLC STATUS messages).

NS-3 has a built-in trace-driven fading model which takes as input a file containing a

matrix of time, a section of the radio spectrum, and the signal-to-noise ratio (SINR). The

model applies the trace SINR at the specified time and section of the radio spectrum by

adjusting the base SINR of any data transmitted at a given time and location. We use an

Fig. 2 4G LTE simulation network

Impact of Acknowledgments on Application Performance in 4G LTE… 2375

123

analytic model to induce wireless traffic loss into the LTE simulations by having either the

fading trace make no adjustments or by having the SINR set low enough that any data sent

at that time and position is lost.

A two-state Gilbert–Elliot [12] model, depicted in Fig. 3, induces the simulated packet

loss. The ‘‘good’’ state (X = 0) has a low packet loss rate while the ‘‘bad’’ state (X = 1)

has a high packet loss rate, with transition probabilities (p01 and p02) between the states.

We set the probabilities based on the model used by Gordo and Daniel [13], who also

simulated LTE. The good state has a probability of 0 for loss while the bad state has a

probability of 1 for loss. The overall amount of loss is determined by the time interval that

the model remains in the bad state.

In the following simulations the smallest time interval considered is the 1 ms trans-

mission time interval (TTI). During any TTI in the simulation the SINR may be low

enough that no data is successfully received. This represents a ‘‘loss’’. The total amount of

loss applied to a simulation’s radio environment indicates the number of TTIs where the

SINR is low enough that any data sent is lost divided by the total number of TTIs in the

simulation. Note that the simulation may or may not have data to send over the wireless

link when the SINR is low enough to induce a loss. We chose the block error rate target of

10 % in controlling the total number of TTI losses.

The only remaining variable is the number and length of loss bursts. In this case, a loss

burst is any number of consecutive TTIs where any data sent is lost. The length of the burst

events results in a packet-level loss if it is longer than the number of MAC layer HARQ

retransmissions. During our simulations, we vary the number and length of bursts to test

different retransmission scenarios.

We introduce the following variables:

• a—The total number of TTIs.

Table 2 NS-3 settingsInternet

Capacity PGW-server 100 Gb/s

Latency PGW-server 20 ms

MTU 1500 bytes

LTE

Distance eNodeB to UE 5 km

EARFCN UL 100

EARFCN DL 18,100

# PRBs 100

eNodeB Transmit Power 20 dBm

UE Transmit Power 10 dBm

CQI 8 (no loss)

RLC AM Buffer Size Unlimited

RLC UM Buffer Size 1 Mbytes

RLC AM max retransmit threshold 5

Poll PDU 1

Poll Bytes 50 bytes

t-PollRetransmit 100 ms

t-Reordering (default) 40 ms

t-StatusProhibit (default) 20 ms

2376 B. Levasseur et al.

123

• d—The total number of lost TTIs.

• ok—The number of burst losses of length k.

With these variables, we calculate the probability of moving from the good to the bad

state using Eq. 1 and the probability of staying in the bad state using Eq. 2 [13].

p01 ¼P1

k¼1 ok

að1Þ

1� p10 ¼P1

k¼1ðk � 1Þ � ok

d � 1ð2Þ

With the chosen transition state variables, the Gilbert model generates the fading trace

file for NS-3 to simulate bursty LTE traffic behavior.

4.3 Modeling Applications

While varying RLC parameters and timer settings, this investigation focuses on VoIP, FTP

and MPEG video over UDP performance. During a series of NS-3 LTE simulations, we

adjust the wireless loss rate, the use of RLC AM and UM and the settings of the timers t-

Reordering and t-StatusProhibit. The suggested settings from the LTE specification [4]

guide our timer setting choices.

The simulated UDP VoIP application sends constant bitrate traffic at 64 Kb/s to align

with the G.711 encoding standard [19]. We compute the mean opinion score (MOS) [7], a

scale from 1 (bad) to 5 (good) to measure the effects of delay and packet loss on the QoS of

VoIP conversations. While the overall MOS average over time may be high, users react

negatively when a VoIP conversation experience a low MOS at some point during the

conversation. Hence, we compute the MOS over each average talkspurt4 interval and use

the lowest MOS score as the VoIP QoS performance metric. The average talkspurt interval

is 4.14 s based on a Bell Labs measurement study [18].

The simulated FTP application transmits as much data as possible using TCP New Reno

(the default congestion control algorithm in NS-3) and we use throughput as FTP’s per-

formance metric.

The simulated video takes its input from a trace file that defines an MPEG 4 video

stream with Intra-coded frames (I), Predicted-coded frames (P) and Bi-directional coded

frames (B). The trace file lists four columns for a row number, frame type, time to send the

packet and size of the packet in bytes, shown by example in Table 3.

Fig. 3 Gilbert–Elliot model (based on [13])

4 A talkspurt is the amount of time a person speaks continuously before pausing.

Impact of Acknowledgments on Application Performance in 4G LTE… 2377

123

The video application reads the trace file and sends UDP packets for the video frames at

the specified time intervals. The trace file used in the simulations, obtained from the

Technische Universitat Berlin,5 is for a soccer match and has an average bit rate of about

1.05 Mb/s. This application breaks video frames larger than 1460 bytes into multiple IP

packets prior to transmission. We examine packet loss, frame arrivals and delay and use the

time to transmit a frame (frame delay) and the rate of frame playout (frame rate) as video

performance metrics.

5 Results

This section analyzes the results of LTE measurements and three sets of NS-3 LTE

simulation experiments:

• We analyze channel quality indicator (CQI) mobile measurements to determine an

appropriate CQI setting for the subsequent simulations (Sect. 5.1).

• Employing uniform wireless loss, the first experiment set compares the performance of

RLC using acknowledged mode (AM) against RLC with unacknowledged mode (UM)

for VoIP, FTP and MPEG video applications (Sect. 5.2).

• Modeling bursty wireless loss, the second experiment set varies the t-Reordering and

t-StatusProhibit timers to assess their impact on the behavior of wireless VoIP, FTP and

MPEG video applications (Sect. 5.3).

• The third experiment set fixes the timers for VoIP, FTP and MPEG video and varies the

wireless loss rate to measure the impact of using RLC AM and UM for these three

applications (Sect. 5.4).

5.1 CQI Measurements

In order to determine an appropriate CQI value for the simulations, we measured CQI

values for a 4G LTE network in New England over a range of physical locations.

Table 3 Example MPEG frametrace

Frame number Frame type Time (ms) Length (bytes)

1 I 0 7559

2 P 120 3442

3 B 40 1865

4 B 80 2021

5 P 240 2282

6 B 160 1532

7 B 200 1853

8 P 360 2216

9 B 280 1515

10 B 320 1664

... ... ... ...

5 http://www-tkn.ee.tu-berlin.de/research/trace/trace.html.

2378 B. Levasseur et al.

123

We built an Android application (app) for mobile phones that automatically records the

CQI value every 2 min. Our measurement study consisted of running the app on a Sam-

sung Galaxy Nexus phone with the Android API 4.2.2 for one week, covering areas from

Bristol, Middlesex, Norfolk, Plymouth and Worcester counties throughout a normal work

week. Figure 4 shows the area of the measurement in Massachusetts with data collection

points indicated by yellow pins. With the customized app running over the depicted region,

we collected 5070 CQI data points.

Figure 5 divides the measurements broadly into two categories with the top graph

(Fig. 5a) containing data where the phone was mobile on urban, suburban and intra-city

roads and the bottom graph (Fig. 5b) including data from several particular cities where the

phone was stationary or moved at walking speeds for long periods of time. The road speeds

for the urban and suburban road measurements varied between 0 and 40 mph, while the

intra-city road speeds were 40–65 mph. In both graphs, the horizontal axis is the CQI and

the vertical axis is the cumulative distribution of CQI values.

Figure 5a indicates that in both suburban and urban areas the mobile phone mostly

recorded a CQI value of eight with the former having more CQI values lower than eight

and the latter having more CQI values higher than eight and about 35 % being at the

maximum CQI of 15. While traveling on roads between cities, there was a greater range in

CQI values requested.

Figure 5b demonstrates that in all three cities the phone mostly requested a value of

eight as well, with the CQI distributions roughly the best for larger cities (Worcester) than

the smaller towns of New Bedford and Concord (the smallest). Based on these graphs, as

indicated in Table 2, the simulations used a fixed CQI value of eight.

Fig. 4 Map of CQI measurement area

Impact of Acknowledgments on Application Performance in 4G LTE… 2379

123

5.2 RLC AM and UM

The first set of NS-3 experiments analyzes the impact of RLC using AM versus RLC using

UM on VoIP, FTP and MPEG video. The wireless loss rate for these tests is set to a

uniform 25 %.

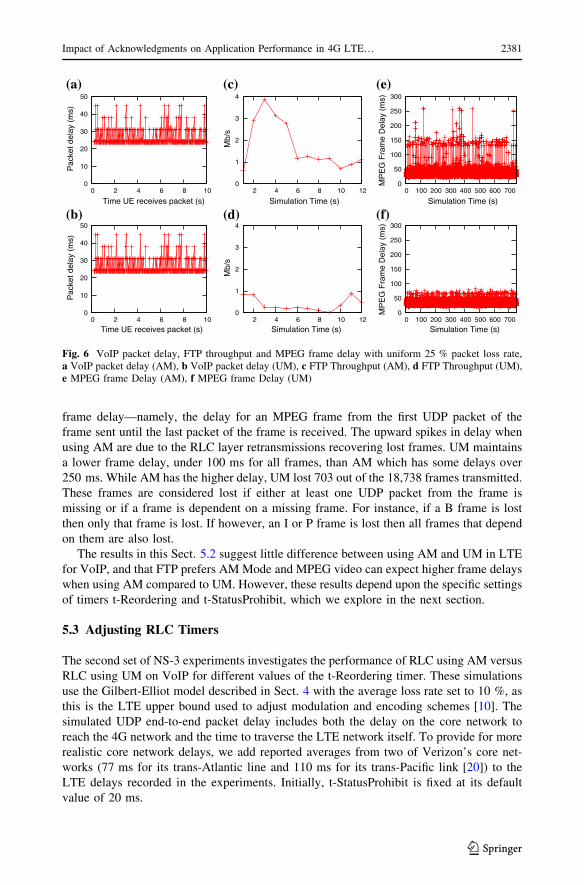
Figure 6a graphs the VoIP results using AM and Fig. 6b provides VoIP results for UM.

The x-axis is the time (in seconds) when the UE receives each VoIP packet. The y-axis is

the recorded packet delay in milliseconds. The delays for AM and UM are quite similar

since VoIP puts such a small capacity demand on LTE. With uniform random loss, many

loss events occur during intervals when the VoIP application is not transmitting. Addi-

tionally, the low VoIP bitrate means RLC AM retransmissions have little impact on UDP

packet delay when compared to UM delay results.

Figure 6c graphs throughput for FTP using AM and Fig. 6d provides FTP throughput

using UM where the x-axis is time and the y-axis is throughput in Mb/s. The graphs

indicate that LTE using AM yields higher FTP throughputs compared to LTE using UM.

By recovering lost encapsulated TCP packets via AM retransmissions, the RLC layer

reduces the number of TCP packets lost. With UM, the TCP server encounters more packet

loss which reduces its sending rate either through fast retransmit or when returning to slow

start.

Figure 6e, f provide results from a simulated UDP video application in terms of MPEG

frame delays for AM and UM respectively. With time on the x-axis, the y-axis is MPEG

0

0.1

0.2

0.3

0.4

0.5

0.6

0.7

0.8

0.9

1

0 2 4 6 8 10 12 14

Per

cent

CQI

UrbanSuburban

Roads

(a)

(b)

0

0.1

0.2

0.3

0.4

0.5

0.6

0.7

0.8

0.9

1

0 2 4 6 8 10 12 14

Per

cent

CQI

ConcordNew Bedford

Worcester

Fig. 5 CDFs of CQImeasurements, a CQIs for urban,suburban and traveling roads,b CQIs for particular cities andtowns

2380 B. Levasseur et al.

123

frame delay—namely, the delay for an MPEG frame from the first UDP packet of the

frame sent until the last packet of the frame is received. The upward spikes in delay when

using AM are due to the RLC layer retransmissions recovering lost frames. UM maintains

a lower frame delay, under 100 ms for all frames, than AM which has some delays over

250 ms. While AM has the higher delay, UM lost 703 out of the 18,738 frames transmitted.

These frames are considered lost if either at least one UDP packet from the frame is

missing or if a frame is dependent on a missing frame. For instance, if a B frame is lost

then only that frame is lost. If however, an I or P frame is lost then all frames that depend

on them are also lost.

The results in this Sect. 5.2 suggest little difference between using AM and UM in LTE

for VoIP, and that FTP prefers AM Mode and MPEG video can expect higher frame delays

when using AM compared to UM. However, these results depend upon the specific settings

of timers t-Reordering and t-StatusProhibit, which we explore in the next section.

5.3 Adjusting RLC Timers

The second set of NS-3 experiments investigates the performance of RLC using AM versus

RLC using UM on VoIP for different values of the t-Reordering timer. These simulations

use the Gilbert-Elliot model described in Sect. 4 with the average loss rate set to 10 %, as

this is the LTE upper bound used to adjust modulation and encoding schemes [10]. The

simulated UDP end-to-end packet delay includes both the delay on the core network to

reach the 4G network and the time to traverse the LTE network itself. To provide for more

realistic core network delays, we add reported averages from two of Verizon’s core net-

works (77 ms for its trans-Atlantic line and 110 ms for its trans-Pacific link [20]) to the

LTE delays recorded in the experiments. Initially, t-StatusProhibit is fixed at its default

value of 20 ms.

0

10

20

30

40

50

0 2 4 6 8 10

Pac

ket d

elay

(m

s)

Time UE receives packet (s)

(a)

(b)

(c)

(d)

(e)

(f)

0

10

20

30

40

50

0 2 4 6 8 10

Pac

ket d

elay

(m

s)

Time UE receives packet (s)

0

1

2

3

4

2 4 6 8 10 12

Mb/

s

Simulation Time (s)

0

1

2

3

4

2 4 6 8 10 12

Mb/

s

Simulation Time (s)

0

50

100

150

200

250

300

0 100 200 300 400 500 600 700

MP

EG

Fra

me

Del

ay (

ms)

Simulation Time (s)

0

50

100

150

200

250

300

0 100 200 300 400 500 600 700

MP

EG

Fra

me

Del

ay (

ms)

Simulation Time (s)

Fig. 6 VoIP packet delay, FTP throughput and MPEG frame delay with uniform 25 % packet loss rate,a VoIP packet delay (AM), b VoIP packet delay (UM), c FTP Throughput (AM), d FTP Throughput (UM),e MPEG frame Delay (AM), f MPEG frame Delay (UM)

Impact of Acknowledgments on Application Performance in 4G LTE… 2381

123

The VoIP results shown in Fig. 7a for AM and Fig. 7b for UM indicate the t-Reordering

timer settings in milliseconds on the x-axis with VoIP packet delay on the y-axis. The two

trendlines represent delays for an Atlantic core network and a Pacific core network,

respectively. From the graphs, regardless of RLC mode, as t-Reordering increases, the

average UDP VoIP packet delay increases. However, AM retransmissions cause extra

wireless delays which yield slightly higher UDP packet delays in Fig. 7a than the UM

delays seen in Fig. 7b. For both AM and UM, the lowest MOS scores are all around 4.5

which corresponds to good user call quality. Hence, the strategy of setting t-Reordering to

its lowest value seems attractive for providing optimal VoIP QoS. However, setting the

timer too low stifles potential MAC layer recoveries. To avoid unnecessary lost MAC

packets in UM and extra retransmissions in AM, t-Reordering must be set high enough to

permit the MAC layer recovery process to complete (i.e., approximately 28 ms (see

Sect. 2.3). The closest recommended timer setting higher than this interval is 30 ms [4].

The FTP results shown in Fig. 7c for AM and Fig. 7d for UM have t-Reordering timer

setting in milliseconds on the x-axis with FTP throughout in Mb/s on the y-axis. Each data

point is the average throughput shown with the standard deviation as an error bar. The error

bar shows the maximum and minimum throughput recorded over the entire simulation run.

The average throughputs vary considerably with t-Reordering, but the high standard

deviations suggest few general trends. Generally, FTP throughput over AM is higher than

FTP throughput over UM for all t-Reordering settings.

t-Reordering (ms)

0

20

40

60

80

100

120

140

160

0 50 100 150 200

Pac

ket d

elay

(m

s)

AtlanticPacific

0

20

40

60

80

100

120

140

160

0 50 100 150 200

Pac

ket d

elay

(m

s)

t-Reordering (ms)

AtlanticPacific

t-Reordering (ms)

0

2

4

6

8

0 50 100 150 200

Mb/

s

0

2

4

6

8

0 50 100 150 200

Mb/

s

t-Reordering (ms)

(a)

(b)

(c)

(d)

Fig. 7 Adjusting t-Reordering for VoIP and FTP, a VoIP average packet delay (AM), b VoIP averagepacket delay (UM), c FTP Throughput (AM), d FTP Throughput (UM)

2382 B. Levasseur et al.

123

Figure 8a, c provide MPEG video performance for AM while Fig. 8b, d show MPEG

behavior for UM. The x-axes for all these graphs are the t-Reordering timer settings in

milliseconds. For the graphs on the left, the y-axes are the MPEG frame delays in mil-

liseconds, and for the graphs on the right the y-axes are the MPEG frame rates in f/s. All

data points are average values, shown with standard deviation error bars. From the graphs,

the average frame delay is similar for both AM and UM, with AM having a slightly higher

standard deviation due to some retransmissions. The average frame rates are 25 f/s for AM

for all values of t-Reordering, but only 24 f/s for UM for t-Reordering values above 30 ms

and only 20 f/s for t-Reordering values below 30 ms. This performance dip is because the

timers are set too low to recover any lost frames even with HARQ retransmissions.

While UM has a lower standard deviation for average frame delay, it does have more

lost frames. Table 4 shows the percent of lost frames for each of the t-Reordering settings.

As for the VoIP and FTP applications, if t-Reordering is set low (less than 30 ms) the MAC

layer cannot recover as much data. With MPEG, the video frame dependencies result in

about 19 % of the video frames being lost when t-Reordering is 0 ms. When t-Reordering

is set to 30 ms or higher, the MAC layer has a chance to recover the lost data, resulting in

about a 5 % frame loss rate. Since the setting of t-Reordering has little impact on delay,

and a setting of 30 ms or higher improves the percent of lost packets for UM, values above

30 ms are highly recommended.

0

100

200

300

400

500

0 50 100 150 200

MP

EG

Fra

me

Del

ay (

ms)

t-Reordering (ms)

0

100

200

300

400

500

0 50 100 150 200

MP

EG

Fra

me

Del

ay (

ms)

t-Reordering (ms)

0

100

200

300

400

500

0 50 100 150 200

MP

EG

Fra

me

Del

ay (

ms)

t-Reordering (ms)

0

5

10

15

20

25

30

35

0 50 100 150 200

MP

EG

Fra

mes

per

s

t-Reordering (ms)

0

5

10

15

20

25

30

35

0 50 100 150 200

MP

EG

Fra

mes

per

s

t-Reordering (ms)

0

5

10

15

20

25

30

35

0 50 100 150 200

MP

EG

Fra

mes

per

s

t-Reordering (ms)

(a) (c)

(b) (d)

Fig. 8 Adjusting t-Reordering for MPEG, a MPEG frame delay (AM), b MPEG frame delay (UM),c MPEG frame rate (AM), d MPEG frame rate (UM)

Impact of Acknowledgments on Application Performance in 4G LTE… 2383

123

For the MPEG simulations there is no one value for t-Reordering that produces the best

performance in both AM and UM. The best results for AM come with the timer set from 50

to 90 ms, while the best UM settings range from 15 to 60 ms.

The next series of experiments fix t-Reordering at 40 ms (the NS-3 default) and vary the

t-StatusProhibit timer. As described in Sect. 2, the t-StatusProhibit timer only applies to

AM where it controls STATUS messages containing ACKs and NACKs.

Figure 9a, b include VoIP performance results with the x-axis for both graphs indicating

t-StatusProhibit settings in milliseconds. Since STATUS messages controlled by this timer

only exist in RLC AM there are no UM tests to report unlike the tests where t-Reordering is

tested. In Fig. 9a, the y-axis is the VoIP packet delay in milliseconds, and in Fig. 9b, the

y-axis is the lowest talkspurt MOS. Both graphs have trendlines indicating experiments

with added Atlantic and Pacific delays. The two graphs demonstrate that t-StatusProhibit

has a greater impact on VoIP QoS than t-Reordering. Generally, lowering t-StatusProhibit

reduces the VoIP packet delay and increases the MOS. The exception being cases such as

the t-StatusProhibit setting of 450 ms where the anomalous MOS improvement is likely

due to interaction between the two timers. Specifically, when RLC enables t-StatusPro-

hibit, the node cannot send STATUS messages, but it does update the set of packets to

retransmit after t-Reordering expires. If t-StatusProhibit starts and then t-Reordering

expires, any new packets that need to be NACKed have to wait until t-StatusProhibit

expires. For example, if t-StatusProhibit is 400 ms and t-Reordering expires slightly later,

almost 400 ms must pass before the NACK STATUS message is sent. However, if

t-StatusProhibit is set to 450 ms, t-Reordering may expire when t-StatusProhibit is not

running and a STATUS message can be sent earlier.

While lower t-StatusProhibit timers yield better VoIP performance for AM, the lower

timer settings also increase STATUS message frequency. Since STATUS messages pre-

empt user data, they reduce the user’s uplink throughput. While measuring uplink per-

formance traffic is outside the scope of this investigation, our recommendation is to use

50 ms for t-StatusProhibit when sending VoIP traffic.

The FTP results shown in Fig. 9c have the t-StatusProhibit setting in milliseconds on the

x-axis and FTP throughput in Mb/s on the y-axis. Each data point is the average FTP

throughput at that t-Reordering setting with a standard deviation error bar. From the graph,

as for VoIP, setting t-StatusProhibit too high has a negative impact on TCP throughput.

The best FTP throughputs are when t-StatusProhibit is set to 75 ms.

Figure 10a, b graph MPEG (AM) results for a variety of t-StatusProhibit settings in

milliseconds on the x-axis. The y-axis in Fig. 10a is the MPEG frame delay in milliseconds

Table 4 MPEG frames lost withUM

t-Reordering (ms) Frame loss (%)

0 18.6

5 18.0

30 5.0

40 5.0

50 5.0

70 5.0

100 5.0

150 5.0

200 5.0

2384 B. Levasseur et al.

123

while it is the MPEG frame rate in f/s in Fig. 10b. Each data point is the average at that

t-StatusProhibit setting with a standard deviation error bar.

Based on Fig. 10a, unlike the previous experiments with t-Reordering, the t-Sta-

tusProhibit setting affects the frame delay. The higher settings of the timer produce both a

higher average delay and a higher standard deviation. In Fig. 10b, the frame rate remains at

25 f/s for all the settings. However, there is no one setting for the timer that is clearly better

than the others. Setting the timer too low can cause multiple STATUS messages that

preempt sending user data, while setting the timer too high can delay feedback of lost data

to the sender. To balance these concerns, we set t-StatusProhibit to 75 ms for subsequent

experiments.

0

100

200

300

400

500

0 100 200 300 400 500

Pac

ket d

elay

(m

s)

t-StatusProhibit (ms)

AtlanticPacific

1

2

3

4

5

0 100 200 300 400 500

Wor

st M

OS

t-StatusProhibit (ms)

AtlanticPacific

0

2

4

6

8

0 100 200 300 400 500

Mb/

s

t-StatusProhibit (ms)

(a)

(b)

(c)

Fig. 9 Adjustingt-StatusProhibit for VoIP andFTP, a VoIP average packetdelay (AM), b VoIP worse MOS(AM), c FTP Throughput (AM)

Impact of Acknowledgments on Application Performance in 4G LTE… 2385

123

5.4 Fixed Timers and Varied Wireless Loss

This section presents VoIP, FTP and MPEG experiments that use timer settings based on

the previous sections’ results while utilizing the bursty loss model described in Sect. 4 to

study LTE wireless application performance over varying loss rates for both AM and UM.

The VoIP experiments fix t-Reordering and t-StatusProhibit to 30 and 50 ms, respec-

tively, while varying the wireless loss rates from 5 to 35 % in five percent increments.

Figure 11a, b display results for an Atlantic VoIP session and a Pacific VoIP session,

respectively. For both graphs, the x-axes are the overall percent wireless loss and the

y-axes are the lowest talkspurt MOS values. There are two trendlines for each graph, one

for AM and one for UM. With these fixed timers, VoIP quality is slightly better using AM

compared to UM for up to 20 % loss. However, the differences are negligible as call

quality at or near MOS 4 is considered good. For loss rates of 25 % and higher, VoIP

quality is much better with UM. At these higher loss rates, the negative effect due to delays

caused by the many AM VoIP retransmissions significantly outweighs the negative effect

on MOS caused by more lost UDP packets when using UM.

The FTP experiments fix t-Reordering and t-StatusProhibit to 50 and 70 ms, respec-

tively, while varying the wireless loss rates from 5 to 50 % in 5 % increments.

Figure 11c, d graph the results. The top graph provides FTP throughput in Mb/s for loss

rates from 5 to 25 % and the bottom graph displays FTP throughput in Mb/s for loss rates

from 40 to 50 %. There are two trendlines for each graph, one for AM and one for UM.

Since the models driving these simulations require two distinct input sets from the equa-

tions that generate the fading trace files, we present these results separately.

0

100

200

300

400

500

0 100 200 300 400 500

MP

EG

Fra

me

Del

ay (

ms)

t-StatusProhibit (ms)

0

5

10

15

20

25

30

35

0 100 200 300 400 500

MP

EG

Fra

mes

per

s

t-StatusProhibit (ms)

(a)

(b)

Fig. 10 Adjustingt-StatusProhibit for MPEG,a MPEG frame delay (AM),b MPEG frame rate (AM)

2386 B. Levasseur et al.

123

1

2

3

4

5

5 10 15 20 25 30 35

Wor

st M

OS

Percent loss

AMUM

1

2

3

4

5

5 10 15 20 25 30 35

Wor

st M

OS

Percent loss

AMUM

0

2

4

6

8

5 10 15 20 25

Mb/

s

Percent Loss

AM Avg RateUM Avg Rate

0

2

4

6

8

30 35 40 45 50

Mb/

s

Percent Loss

AM Avg RateUM Avg Rate

(a)

(b)

(c)

(d)

Fig. 11 Fixed t-Reordering andt-StatusProhibit with differentloss rates for VoIP and FTP,a VoIP Worst Talkspurt MOS(Atlantic), b VoIP WorstTalkspurt MOS (Pacific), c FTPThroughput (low loss), d FTPThroughput (high loss)

Impact of Acknowledgments on Application Performance in 4G LTE… 2387

123

0

100

200

300

400

500

600

700

800

5 10 15

MP

EG

Fra

me

Del

ay (

ms)

Percent Loss

AMUM

0

100

200

300

400

500

600

700

800

20 25

MP

EG

Fra

me

Del

ay (

ms)

Percent Loss

AMUM

0

5

10

15

20

25

30

35

40

5 10 15

MP

EG

Fra

mes

per

s

Percent Loss

AMUM

0

5

10

15

20

25

30

35

40

20 25

MP

EG

Fra

mes

per

s

Percent Loss

AMUM

(a)

(b)

(c)

(d)

Fig. 12 Fixed t-Reordering andt-StatusProhibit with differentloss rates for MPEG, a MPEGframe delay (low loss), b MPEGframe delay (high loss), c MPEGframe rate (low loss), d MPEGframe rate (high loss)

2388 B. Levasseur et al.

123

At average loss rates of 5 %, FTP has higher throughput over AM than over UM since

MAC layer retransmissions can recover much of the lost data without RLC AM retrans-

missions. Below an average loss rate of 10 %, there is a crossover point where FTP over

AM sends more retransmission to make up for lost data, resulting in lower performance.

However, there is a second crossover point above the 10 % average loss rate, where FTP

over AM consistently has higher throughput than does FTP over UM until average loss

rates of about 50 % where neither mode deals with the losses well and FTP throughput is

extremely low.

The MPEG experiments fix t-Reordering and t-StatusProhibit to 30 and 75 ms,

respectively while varying the wireless loss rates from 5 to 50 % in 5 % increments.

Figure 12a, b depict the LTE simulated results for MPEG video frame delays and

Fig. 12c, d provide MPEG video frame rate results. The top graph in each pair of fig-

ures covers loss rates from 5 to 15 % and the bottom graph in each pair of figures includes

loss rates from 20 to 25 %. Again, these results are shown in separate graphs since two

distinct input sets are required for the equations that generate the fading trace files. For all

graphs, the x-axes are the overall percent loss. In Fig. 12a, b the y-axes are the MPEG

frame delays in milliseconds while the y-axes are the MPEG frame rates in f/s for Fig. 12c,

d. Each graph has two trendlines, one for AM and one for UM.

When the loss rate is 10 % or less, there is little difference in MPEG performance over

AM or UM. As the loss rates increase, the delays on arriving frames increase for MPEG

video over AM, while MPEG video over UM has a near constant delay. Conversely, frame

rate drops for MPEG video over UM as the loss rate increases. The RLC layer retrans-

missions increase the delay for the frames but without these retransmissions the packets are

lost, decreasing frame rates.

Table 5 lists the percentage of MPEG frames lost when sending MPEG video over UM.

An MPEG frame is considered lost if at least one of the UDP packets that make up the

frame is lost, or if the frame is dependent on a frame that was lost. From the table, when the

loss rate reaches 20 %, nearly a quarter of all MPEG frames are lost, whereas MPEG video

over AM loses no frames, but has an average frame delay over 100 ms. Whether the delay

is more significant than the loss depends upon the application requirements, with inter-

active MPEG video sessions (e.g., a video conference) being more sensitive to delays than

non-interactive sessions (e.g., video on demand).

6 Conclusion

The growth and deployment of wireless 4G technologies heightens the need to better

understand 4G Long Term Evolution (LTE) and its influence on the variety of application

types that use this technology. In particular, users run applications with a range of QoS

Table 5 MPEG frames lost withUM

Wireless loss (%) MPEG frames loss (%)

5 5.6

10 5.0

15 13.3

20 24.0

25 31.9

Impact of Acknowledgments on Application Performance in 4G LTE… 2389

123

requirements, from delay sensitive (e.g., Voice over IP), to throughput intensive (e.g., file

transfer) to relatively constant bitrates (e.g., video streaming). LTE has several transmis-

sion mechanisms and timers to support the variety of end-user applications, but there has

yet to be a systematic exploration of the effects of LTE retransmissions and timer settings

on application performance.

This study examines the impact of 4G LTE timers t-Reordering and t-StatusProhibit and

the choice of Radio Link Control (RLC) Acknowledged Mode (AM) versus RLC Unac-

knowledged Mode (UM) on VoIP, file transfer and video streaming applications running

over 4G LTE cellular networks. This investigation enhanced support to the NS-3 simulator

for both AM and UM and focused on carefully designed NS-3 simulation experiments to

understand the impact of a range of loss and timer settings on application performance.

These experiments yield practical guidelines for LTE timer settings while producing a

detailed comparison of the impact of using AM versus UM to improve application quality

of experience.

Our simulation results indicate that for UDP VoIP, setting t-Reordering and t-Sta-

tusProhibit to 30 and 50 ms, respectively, and using AM improves call quality with up to a

20 % packet loss rate on the wireless link, compared with UM. For FTP file transfers,

t-Reordering and t-StatusProhibit set to 50 and 75 ms, respectively, demonstrate that AM

provides higher TCP throughputs than does UM. For MPEG video, setting t-Reordering

and t-StatusProhibit to 30 and 75 ms, respectively, and using UM maintains a lower

average frame delay and lower frame loss compared with AM. However, while UM

maintains a lower average delay, the resulting lost frames mean that UM has a lower

average frame rate.

In general, delay sensitive applications such as VoIP experience better quality when run

over RLC UM while throughput sensitive applications such as FTP perform better with the

extra retransmissions of AM. Applications such as MPEG video over UDP need to con-

sider the trade off of frame delay and frame loss in choosing AM versus UM.

The t-Reordering timer is best set at a level sufficiently high to permit the MAC layer to

effectively recover LTE transport blocks, while the t-StatusProhibit timer is best set low to

not adversely delay RLC ACKs and NACKs, but not so low that the network spends an

inordinate number of transmissions opportunities sending higher priority AM STATUS

messages.

Potential future work on understanding the 4G LTE technology include investigating

other RLC retransmission settings and considering other application types running in

mobile 4G environments. Conducting a more in-depth empirical study into channel quality

indicator (CQI) variability would enable researchers to determine the effectiveness of CQI

relative to wireless loss and possibly lead to further study of the RLC timer settings.

Moreover, LTE can use different RLC settings for different radio bearers, and LTE traffic

flow templates can be used to filter traffic onto multiple radio bearers. Future work could

expand evaluation of different applications, e.g., network games, varying RLC layer set-

tings and adding more features to the NS-3 LTE simulator to further the applicability of the

simulator.

References

1. 3GPP. 3rd Genervation Partnership Project; Technical Specification Group Radio Access Network;Evolved Universal Terrestrial Radio Access (E-UTRA); Radio Link Control (RLC) protocol

2390 B. Levasseur et al.

123

specification (Release 8). Technical Specification 36.322v8.0.0, 3GPP, December 2007. http://www.3gpp.org/ftp/Specs/html-info/36322.htm.

2. 3GPP. 3rd Genervation Partnership Project; Technical Specification Group Radio Access Network;Evolved Universal Terrestrial Radio Access (E-UTRA) Medium Access Control (MAC) protocolspecification (Release 8). Technical Specification 36.321v8.2.0, 3GPP, May 2008. http://www.3gpp.org/ftp/Specs/html-info/36321.htm.

3. 3GPP. 3rd Genervation Partnership Project; Technical Specification Group Radio Access Network;Evolved Universal Terrestrial Radio Access (E-UTRA); Physical layer procedures (Release 8). Tech-nical Specification 36.213v8.4.0, 3GPP, September 2008. http://www.3gpp.org/ftp/Specs/html-info/36213.htm.

4. 3GPP. 3rd Genervation Partnership Project; Technical Specification Group Radio Access Network;Evolved Universal Terrestrial Radio Access (E-UTRA); Radio Resource Control (RRC) Protocolspecification (Release 8). Technical Specification 36.331v8.10.0, 3GPP, March 2008. http://www.3gpp.org/ftp/Specs/html-info/36331.htm.

5. 3GPP. 3rd Generation Partnership Project; Technical Specification Group Radio Access Network;Evolved Universal Terrestrial Radio Access (E-UTRA); Base Station (BS) radio transmission andreception (Release 8). Technical Specification 36.104v8.13.0, 3GPP, July 2012. http://www.3gpp.org/DynaReport/36104.htm.

6. Asheralieva, A., Khan, J. Y., & Mahata, K. (2011). Performance analysis of voip services on the ltenetwork. In Australasian telecommunication networks and applications conference (ATNAC), 2011 (pp.1–6).

7. Bangun, R. A., Dutkiewicz, E., & Anido, G. J. (1999). An analysis of multi-player network gamestraffic. In 1999 IEEE 3rd workshop on multimedia signal processing (pp. 3–8).

8. Bohmer, M., Hecht, B., Schoning, J., Kruger, A., & Bauer, G. (2011). Falling asleep with angry birds,facebook and kindle: A large scale study on mobile application usage. In Proceedings of the 13thinternational conference on human computer interaction with mobile devices and services, ACM (pp.47–56).

9. Cisco. Cisco visual networking index: Global mobile data traffic forecast update, 2013–2018. Technicalreport, Cisco, 2014. http://www.cisco.com/en/US/solutions/collateral/ns341/ns525/ns537/ns705/ns827/white_paper_c11-520862.pdf.

10. Dahlman, E., Parkvall, S., & Skold, J. (2011). 4G LTE/LTE—Advanced for mobile broadband. Oxford:Academic Press.

11. Ekstrom, H. (2009). QoS control in the 3GPP evolved packet system. Communications Magazine, IEEE,47(2), 76–83.

12. Gilbert, E. N. (1960). Capacity of a burst-noise channel. Bell System Technical Journal, 39(5),1253–1265.

13. Gordo, N., & Daniel, A. (2009). Evaluating video quality degradation from data packet losses in an lteenvironment. Master’s thesis, Lulea University of Technology, Universitetsomradet, Porsn, 971 87Lulea, Sweden.

14. Huang, J., Qian, F., Guo, Y., Zhou, Y., Xu, Q., Mao, Z. M., et al. (2013). An in-depth study of LTE:Effect of network protocol and application behavior on performance. In Proceedings of the ACMSIGCOMM 2013 conference on SIGCOMM, SIGCOMM ’13, ACM, New York, NY, USA (pp. 363–374).

15. Kawser, T. M., Hamid, N. I. B., Hasan, N., Alam, M. S., & Rahman, M. M. (2012). Limiting HARQretransmissions in downlink for poor radio link in LTE. International Journal of Information andElectronics Engineering, 2, 707–709.

16. Makidis, M. (2007). Implementing and evaluating the RLC/AM protocol of the 3GPP specification.Master’s thesis, Athens University of Economics and Business.

17. Masum, E., & Babu, J. (2011). End-to-end delay performance evaluation for VoIP in the LTE network.Master’s thesis, Blekinge Institue of Technology.

18. Norwine, A. C., & Murphy, O. J. (1938). Characteristic time intervals in telephonic conversation. BellSystem Technical Journal, 17(2), 281–291.

19. International Telecommunication Union. Pulse code movulation (PCM) of vlice frequencies. TechnicalSpecification G.711, ITU-T, November 1988. https://www.itu.int/rec/dologin_pub.asp?lang=e&id=T-REC-G.711-198811-I!!PDF-E&type=items.

20. Verizon. IP Lagency Sstatistics, April 2014. http://www.verizonenterprise.com/about/network/latency/.21. Xu, Q., Erman, J., Gerber, A., Mao, Z., Pang, J., & Venkataraman, S. (2011). Identifying diverse usage

behaviors of smartphone apps. In Proceedings of the 2011 ACM SIGCOMM conference on Internetmeasurement conference, ACM (pp. 329–344).

Impact of Acknowledgments on Application Performance in 4G LTE… 2391

123

Brett Levasseur obtained a Bachelor’s degree in Computer Sciencefrom the Worcester Polytechnic Institute in 2008. He joined the staff ofMIT Lincoln Laboratory in 2008. Brett then received his Master’sdegree in Computer Science from the Worcester Polytechnic Institutein 2014.

Mark Claypool joined Worcester Polytechnic Institute (WPI) aftercompleting his Ph.D. in Computer Science from the University ofMinnesota in 1997. His Ph.D. Thesis, Quality Planning for DistributedCollaborative Multimedia Applications, included methods for pre-dicting the performance of multimedia applications based on a user-level quality model. He received tenure and promotion to AssociateProfessor in 2004 and promotion to Full Professor in 2009. His overallresearch interests include multimedia networking, congestion control,and network games over wired and wireless networks.

Robert Kinicki is a Full Professor in the Computer Science Depart-ment at Worcester Polytechnic Institute. Dr. Kinicki earned his Ph.D.degree in Computer Science from Duke University in 1978. His cur-rent research interests include wireless network performance, wirelesssensor networks and the Internet of Things. He has served as a refereefor IEEE Transactions on Computers and IEEE Transactions forCommunications. He is currently the Guest Editor for a JLPEA SpecialIssue on ‘‘Low Power Wireless Sensing and the Internet of Things’’.

2392 B. Levasseur et al.

123


Recommended