Page 1
Impact of environmental and genetic regulation of skeletal muscle
metabolism on metabolic response in women with overweight or obesity:
Molecular and cellular analyses and genetic association studies
Abishankari Rajkumar
Thesis submitted to the
Faculty of Graduate and Postdoctoral Studies
in partial fulfillment of the requirements for the
Doctorate in Philosophy degree in Biochemistry
Department of Biochemistry, Microbiology and Immunology
Faculty of Medicine
University of Ottawa
© Abishankari Rajkumar, Ottawa, Canada, 2018
Page 2
ii
ABSTRACT
The following doctoral thesis focuses on genetic and environmental factors that influence
skeletal muscle metabolism in women with overweight or obesity. The effects of Acyl-CoA
Synthetase Long-Chain 5 (ACSL5) genotype on fatty acid metabolism was studied in vitro, ex
vivo and in vivo. The effects of the environmental toxicant mono-(2ethylhexyl) phthalate
(MEHP) was also studied in vitro and in vivo.
Statistical analyses illustrated how ACSL5 rs2419621 [T] allele carriers, with overweight or
obesity had a greater reduction in their fat mass and visceral fat and greater increases in their
percentage lean mass post diet/exercise intervention vs. non-carriers. This was paralleled with
increased in vitro and in vivo fatty acid oxidation and ex vivo mitochondrial respiration within
[T] allele carriers vs. non-carriers. Interestingly, it was noted that carriers of the polymorphism
had increased levels of the ACSL5 683aa isoform in skeletal muscle, which was found to be
localized in the mitochondria to a greater extent, playing a greater role in fatty acid oxidation
vs. 739aa isoform. This explains in part why carriers of the polymorphism are more responsive
to lifestyle interventions vs. non-carriers.
Studies conducted in women with obesity who participated in the National Health and
Nutrition Examination Survey (NHANES) demonstrated an association between increased
urinary MEHP and increased plasma fatty acid levels. In vitro work in C2C12 myotubes
exposed to MEHP displayed a reduction in fatty acid oxidation and mitochondrial respiration.
An increase in basal glycolysis was paralleled with increased levels of hexokinase II protein
expression in C2C12 myotubes exposed to increasing levels of MEHP. Thus, these results
suggest that increased exposure to MEHP as well as urinary MEHP contributes towards
dysfunction in glucose and fatty acid utilization at both the muscle and whole-body level.
Page 3
iii
Hence, women with obesity may be more susceptible to the metabolic effects of MEHP,
increasing their chances of metabolic dysfunction.
The following thesis, provides a more comprehensive view on the effects of both genetics and
environmental factors on metabolic response within women with overweight and obesity. This
provides insights into factors that should be considered for personalized medicine, to improve
treatment options for combatting this disease.
Page 4
iv
ACKNOWLEDGEMENTS
The following thesis requires the utmost thanks to a number of lovely people.
Foremost, I would like to thank both my supervisors Dr. Frédérique Tesson and Dr. Mary-
Ellen Harper. Through out the many years I have been in your labs, your extensive knowledge,
advice and guidance has contributed towards my growth as a biochemist. While I look up to
both of you as not only my supervisors but as successful scientists, I will be retaining all the
lab skills and words of wisdom you have passed on to me over these years. Additionally, while
I will be receiving a Ph.D. degree is Biochemistry, I have also grasped paramount knowledge
on epidemiology and population statistics, broadening my expertise within the scientific field.
You have taught me that leadership not only requires diplomacy but also kindness and
patience. Thank you.
I would also like to thank my thesis advisory committee Dr. Céline Aguer and Dr. Denis
Prud’homme for guiding me through out my doctoral research and providing me suggestions
on how I could better my project. Your positive criticism and research suggestions have helped
me in completing my project. Thank you for all your help.
Dr. Gilles Lamothe, you have been my statistics guru for the past 5 years. Thank you for being
so patient and helping me out even when it was last minute! I have acquired so much statistical
knowledge from you and for that I’m truly grateful.
To all the lovely members of both Dr. Tesson and Dr. Harper’s labs. I’m a firm believer in the
importance of working in a positive environment. Thanks for providing that for me! The
continuous laughter and happiness that radiated from all of you will be thoroughly missed.
Page 5
v
Hannah, you have become one of my best friends. Your huge heart and welcoming personality
made my experience in the lab super comfortable! We have shared many years of happiness,
sadness, stress and while our time in the lab together is coming to an end, we both know this
is only the beginning of a long-lasting friendship. Thanks for all your advice through out the
years. Whether it was research-related or life-related, it helped me grow as both a scientist and
person! You are a very determined, rational and kind individual. I only wish the best for you
and your future endeavors. Stephen! While you are no longer in the lab with us, you definitely
deserve a huge thank you. The three years spent together as lab mates grew into an amazing
friendship which I won’t forget! From late nights at the lab working on statistics to all the
goofy memories we have had together, thanks for being a great friend and lab mate. To my
ladies at the Harper lab: Ava, Rajaa and Chantal. Thanks for the laughter, kindness and
friendship. From helping each other with trouble-shooting experiments to just destressing
about life, we have definitely made some great memories. You are all highly intelligent,
determined, kind and not to mention, pretty ladies! I know all of you will be successful in your
career paths. Dave and Georges, the two awesome men in our lab- thanks for all the dancing,
singing and laughter- both of you have such a positive aura around you! Good luck on your
future endeavors! I would also like to thank both Pierrette Bolongo from Dr. Tesson’s lab and
Jian Xuan from Dr. Harper’s lab for managing and organizing the lab. For all the previous
students in Dr. Tesson’s lab who helped with the ACSL5 and MEHP project: Jessica Chan,
Katyanna Menard and Suzanne Simba, thank you. You have definitely helped in propagating
these projects forward.
Finally, I need to give a huge thank you to my entire family. Without your help this Ph.D thesis
would not have been possible. Thanks for passing down all the knowledge and experience you
Page 6
vi
have had in research. You have motivated me through the hardest of times, while
congratulating me from the smallest of accomplishments to the acceptance of my first Ph.D
publication! I know I can always count on you. From driving me to the lab late at night so I
can meet an experimental time-point, to the times I have practised presentations with you-
your patience with me has been quite remarkable! Thank you, grandma and grandpa, for
always telling me to pursue my dreams. If not for your advice, I would not be here enjoying
what I do. I love you all so much and any future success I have will always be in part due to
you.
Page 7
vii
TABLE OF CONTENTS
ABSTRACT……………………………………………………………………………ii-iii
ACKNOWLEDGEMENTS……………………………………………………………iv-vi
TABLE OF CONTENTS……………………………………………………………...vii-xii
LIST OF ABBREVIATIONS………………………………………………………....xii-xiv
LIST OF FIGURES…………………………………………………………………...xv-xvi
LIST OF TABLES……………………………………………………………...…….xvii-xviii
1 CHAPTER ONE: GENERAL INTRODUCTION………………………………….1-58
1.1 Obesity, the disease………………………………………………………………..1
1.2 Population Statistics on Obesity…………………………………………………...2-3
1.3 Co-morbidities of Obesity…………………………………………………………3-4
1.4 Multi-Factorial Influences on Obesity…………………………………………….4-16
1.4.1 Obesity and Behavioural Factors………………………………………..4-6
1.4.1.1 Obesity and Food Intake………………………………………4-5
1.4.1.2 Obesity and Physical Inactivity………………………………..5-6
1.4.2 Obesity and Environmental Factors……………………………………..6-12
1.4.2.1 Obesity and Socio-Demographics……………………………..7-9
1.4.2.1.1 Age and Sex Effects on Obesity..……………………7
1.4.2.1.2 Obesity, Ethnicity and Economic Status…………….7-9
1.4.2.2 Obesity and Environmental Pollutants………………………...9-11
1.4.2.2.1 Obesity and Phthalate (PAE) Esters ………………...9-11
1.4.2.3 Obesity and Gut Microbiome………………………………….11-12
1.4.3 Obesity and Endocrine Medical Conditions…………………………….12-13
1.4.4 Obesity and Genetics…………………………………………………….13-15
1.4.4.1 Obesity and Genetic Conditions……………………………….13
1.4.4.2 Obesity and Heritability……………………………………….13-15
1.4.5 Obesity and Epigenetics…………………………………………………15-16
1.5 Management and Treatment Options……………………………………………...16-21
1.5.1 Obesity and Lifestyle Changes…………………………………………..17-19
Page 8
viii
1.5.2 Obesity and Pharmacotherapy…………………………………………...19-20
1.5.3 Obesity and Bariatric Surgery…………………………………………...20-21
1.6 Skeletal Muscle, Fatty Acid Metabolism and Obesity…………………………….21-36
1.6.1 Skeletal Muscle: Structure and Function..……………………………….22-24
1.6.2 Skeletal Muscle and Obesity…………………………………………….24
1.6.3 Mitochondria and Obesity……………………………………………….25-27
1.6.4 Cellular Metabolism and Obesity………………………………………..27-35
1.6.4.1 Acyl-CoA Synthetases and Obesity…………………………...28-32
1.6.4.1.1 ACSL5 and Obesity………………………………….30-32
1.6.4.2 Fatty Acid and Glucose Oxidation/Mitochondrial
Bioenergetics…………………………………………………………..32-35
1.6.5 Skeletal Muscle, Fatty Acid Metabolism and Obesity…………………..35-36
1.7 Research Objectives and Hypotheses……………………………………………...36-37
1.8 References………………………………………………...……………………….38-58
2 CHAPTER TWO:
THE ASSOCIATION BETWEEN ACSL5 RS2419621 GENOTYPE AND RESPONSE
OF WOMEN WITH OBESITY AND OVERWEIGHT TO LIFESTYLE
INTERVENTIONS…………………………………………………………...……….59-84
2.1 Statement of Manuscript Status and Contributions………………………..60
2.1.1 Statement of Manuscript Status……………………………….....60
2.1.2 Contribution Statement…………………………………….…….60
2.1.3 Competing Interest Statement…………………………………...60
2.2 Abstract……………………………………………………………………61
2.3 Introduction………………………………………………………………..61-63
2.4 Methods……………………………………………………………………63-68
Subjects………………………………………………………………...63
Ethics, consent and permissions……………………………………….63
MONET and CAO intervention studies………………………………..64
Studied variables………………………………………………………65
Isolation of DNA and rs2419621 genotyping using TaqMan
MGB probe-based assay chemistry……………………………………65-66
Page 9
ix
Statistical analysis……………………………………………………..66-68
2.5 Results……………………………………………………………………...68-70
Comparison of pre- and post-intervention anthropometric
variables' values in each studied cohort and test for intervention
effects…………………………………………………………………...68-69
Association analysis between ACSL5 rs2419621 genotype
and changes in anthropometric variables following the lifestyle
intervention……………………………………………………………..69
Comparison of pre- and post-intervention anthropometric
variables' values in women with obesity from each cohort
studied and test for lifestyle intervention effect………………………...69-70
Association analysis between ACSL5 rs2419621 genotype
and changes in anthropometric variables following the lifestyle
intervention in MONET and CAO women with obesity………………...70
2.6 Discussion…………………………………………………………………..70-74
2.7 Conclusion………………………………………………………………….74
2.8 References……………………………………………………………….…74-76
2.9 Tables………………………………………………………………………77-84
3 CHAPTER THREE:
DETERMINING THE CELLULAR AND MOLECULAR MECHANISMS
BY WHICH RS2419621 ACSL5 POLYMORPHISM EXERTS ITS EFFECT……….85-116
3.1 Statement of Manuscript Status and Contributions………………………...86
3.1.1 Statement of Manuscript Status…………………………………..86
3.1.2 Contribution Statement…………………………………………...86
3.1.3 Competing Interest Statement…………………………………….86
3.2 Abstract……………………………………………………………………..87-88
3.3 Background…………………………………………………………………88-90
3.4 Materials and Methods……………………………………………………...90-97
Individuals participating in the study..…………………………………90
Isolation of rectus abdominis human primary myotubes and
vastus lateralis tissue…………………………………………………...91
Cell Cultures……………………………………………………………91
Construction of Vectors………………………………………………...91-92
Page 10
x
Transfection of C2C12 myoblast with human ACSL5 cDNA…………..92
Immunostaining………………………………………………………...92-93
14C Palmitate oxidation studies………………………………………...93-94
Western blot analyses…………………………………………………..94-95
High Resolution Respirometry of Biopsied Muscle…………………….95
Respiratory Quotient Related Measurements…………………………..96-97
3.5 Results………………………………………………………………………97-101
Functionality studies on the effect of human ACSL5 long and
short protein isoform overexpression on fatty acid metabolism
in vitro…………………………………………………………….……97
Subcellular localization of transiently overexpressed human
ACSL5 long and short protein isoforms in C2C12 cells……………….98
ACSL5 protein expression levels and subcellular localization
in human myotube cultures from rs2419621 T allele carriers
and non-carriers………………………………………………………..99-100
Fatty acid oxidation and oxygen consumption in biopsied muscle
tissue and myotubes from rs2419621 T allele carriers and
non-carriers…………………………………………………………….100
Association analysis between ACSL5 rs2419621 genotype and
respiratory quotient related measurements post MONET lifestyle
intervention in women with overweight or obesity…………………....100-101
3.6 Discussion…………………………………………………………………101-105
3.7 Conclusions………………………………………………………………..105
3.8 References…………………………………………………………………106-108
3.9 Figures…………………………………………………………………….109-114
3.10 Tables…………………………………………………………………….115-116
4 CHAPTER FOUR: STUDYING THE ENVIRONMENTAL TOXICANT
MEHP AND ITS EFFECTS ON FATTY ACID METABOLISM IN VITRO
AND IN VIVO- AN ENVIRONMENTAL ASSOCIATION STUDY
AND CELLULAR/MOLECULAR MECHANISTIC APPROACH…………………117-145
4.1 Statement of Manuscript Status and Contributions………………………..118
4.1.1 Statement of Manuscript Status………………………………….118
4.1.2 Contribution Statement…………………………………………..118
4.1.3 Competing Interest Statement……………………………………118
Page 11
xi
4.2 Abstract……………………………………………………………………119
4.3 Introduction………………………………………………………………..120-122
4.4 Methodology………………………………………………………………122-126
NHANES 2003-2004 Study Data Analysis……..……………………....122-123
NHANES 2003-2004 Study Statistical Analyses……………………….123
Cell Culture……………………………………………………………123-124
MEHP Exposure………………………………………………………124
MEHP Cytotoxicity Test……………………………………………….124
14C Palmitate Fatty Acid Oxidation Assessment……………..………..124-125
Mitochondrial Respiration Measurement from Seahorse
Mitochondrial Stress Test, Glycolytic Stress Test and Fatty Acid
Oxidation Test…………………………………………………………125
Western Blot Analysis………………………………………………….126
C2C12 In Vitro Studies Statistical Analyses……………………………126
4.5 Results……………………………………………………………………..127-130
MEHP and plasma omega-6 fatty acid levels in women
with obesity in the NHANES 2003-2004 study………………………...127
Evaluation of MEHP cytotoxicity on C2C12 cells…………….………127-128
The effects of MEHP on exogenous fatty acid oxidation
and mitochondrial respiration in C2C12 myotubes…………..……….128
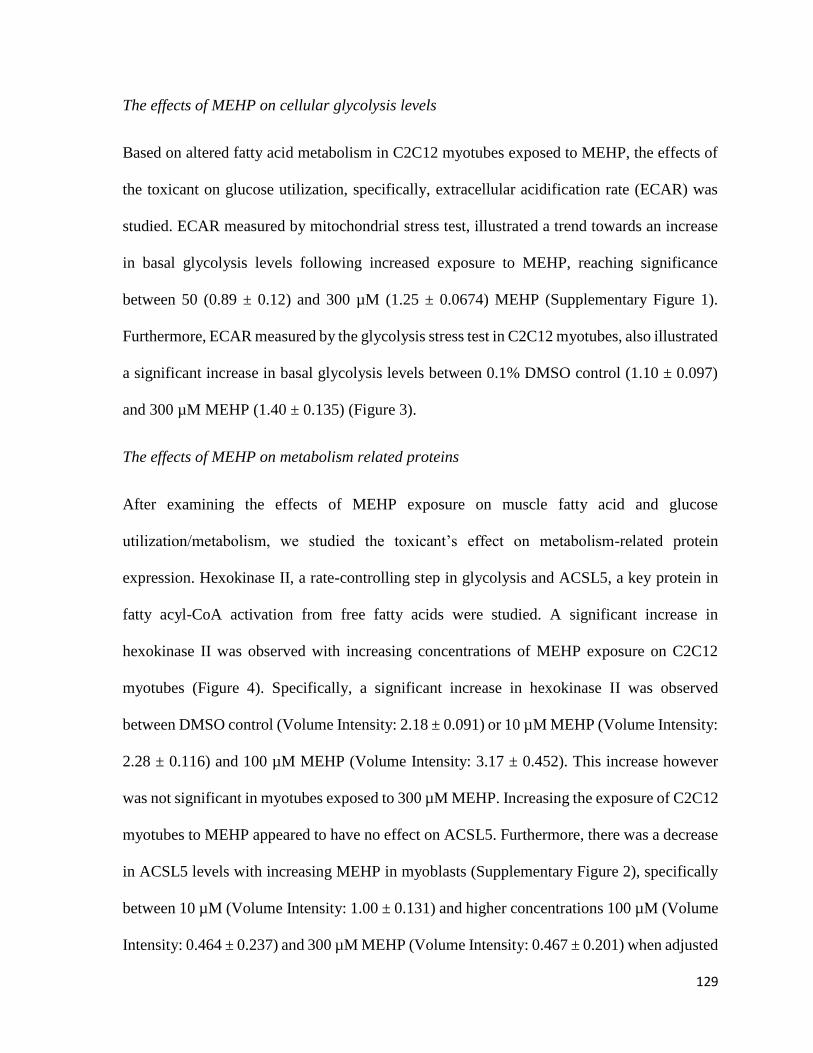
The effects of MEHP on cellular glycolysis levels…………...………..129
The effects of MEHP on metabolism related proteins…………………129-130
4.6 Discussion…………………………………………………………………130-134
4.7 References………………………………………………………………....134-139
4.8 Figures…………………………………………………………………….140-144
4.9 Tables……………………………………………………………………..145
5 GENERAL DISCUSSION………………………………………………………….146-160
5.1 References…………………………………………………………………157-160
6 APPENDIX………………………………………………………………………….161-173
6.1 Supplementary Figures/Tables for Chapter Three…………………………161-167
6.2 Supplementary Figures for Chapter Four…………………………………..168-169
Page 12
xii
6.3 Supplemental Methodology for Chapter 3…………………………………170-173
LIST OF ABBREVIATIONS
AA Arachidonic Acid
ACSBG Acyl-CoA Synthetase Bubblegum
ACSL Acyl-CoA Synthetase Long Chain
ACSM Acyl-CoA Synthetase Medium Chain
ACS Acyl-CoA Synthetase
ACSS Acyl-CoA Synthetase Short Chain
ADP Adenosine Diphosphate
ASP Acid Soluble Products
ATP Adenosine Triphosphate
BGS Bovine Growth Serum
BMI Body Mass Index
BPA Bisphenol A
CAO Complications Associated with Obesity
CHMS Canadian Health Measures Survey
COX Cyclooxygenase
CPT1 Carnitine Palmitoyltransferase 1
CPT2 Carnitine Palmitoyltransferase 2
CRP C-Reactive Protein
CS Citrate Synthase
CT Computerized Tomography
DEHP Di-(2-ethylhexyl) phthalate
DHA Docosahexaenoic Acid
DMEM Dulbecco’s Modified Eagle Media
DMSO Dimethyl Sulfoxide
DXA/DEXA Dual-energy X-ray Absorptiometry
DRP-1 Dynamin Related Protein- 1
Page 13
xiii
ECAR Extracellular Acidification Rate
EECD Electronic Entertainment and Communication Devices
ETC Electron Transport Chain
FBS Fetal Bovine Serum
FCCP Carbonyl Cyanide p-trifluoromethoxyphenylhydrazone
FTO Fat Mass and Obesity-Associated
GLA Gamma-Linolenic Acid
GLP-1 Glucagon-like Peptide-1
GWAS Genome Wide Association Studies
HDL-C High-Density Lipoprotein- Cholesterol
HOMA-IR Homeostatic Model Assessment- Insulin Resistance
HPLC-ESI-MS/MS High Performance Liquid Chromatograph-Electrospray Ionization-
Tandem Mass Spectrometry
IRES Internal Ribosome Entry Site
LDL-C Low Density Lipoprotein- Cholesterol
LEP Leptin
LEPR Leptin Receptor
MAM Mitochondrial Associated Membranes
MBzP Methylbenzylpiperazine
MEHHP Mono-(2-ethyl-5-hydroxyhexyl) Phthalate
MEHP Mono-(2-ethylhexyl) Phthalate
MFN-1/2 Mitofusin-1/2
MHC Myosin Heavy Chain
MHNCH Cyclohexane-1,2-dicarboxylic Acid-Mono(hydroxy-isononyl) ester
MONET Montréal-Ottawa New Emerging Team
MRI Magnetic Resonance Imaging
NB Naltreoxone/Bupropion
NCHS National Center for Health Statistics
NHANES National Health and Nutrition Examination Survey
NHES National Health Examination Survey
Page 14
xiv
OCR Oxygen Consumption Rate
OPA-1 Optic Atrophy-1
PAE Phthalate Ester
PCOS Polycystic Ovary Syndrome
PCR Polymerase Chain Reaction
PI Propidium Iodide
POP Persistent Organic Pollutant
PPARG Peroxisome Proliferator-Activated Receptor Gamma
PT Phentermine/Topiramate
ROS Reactive Oxygen Species
RQ Respiratory Quotient
SEM Standard Error of the Mean
SD Standard Deviation
SDS-PAGE Sodium Dodecyl Sulfate Polyacrylamide Gel Electrophoresis
SLC27a Solute Carrier Family 27 Member 1
SNP Single Nucleotide Polymorphism
T2D Type 2 Diabetes
TCA Tricarboxylic Acid Cycle
TIM Translocase of the Inner Membrane
TMPD N,N,N’,N’-Tetramethyl-p-phenylenediamine Dihydrochloride
UCP Uncoupling Protein
VO2 Volume of Oxygen
VCO2 Volume of Carbon Dioxide
WHO World Health Organization
Page 15
xv
LIST OF FIGURES
CHAPTER THREE: DETERMINING THE CELLULAR AND MOLECULAR
MECHANISMS BY WHICH RS2419621 ACSL5 POLYMORPHISM EXERTS ITS
EFFECT.
Figure 1: a) C-14 Palmitic Acid Oxidation into Complete and Incomplete
Fatty Acid Oxidation……………………………………………………………….....109-110
Figure 2: ACSL5 long and short human isoform-YFP tagged
colocalization in mitochondria and endoplasmic reticulum in C2C12 myoblasts……111-112
Figure 3: ACSL5 rs2419621 genotype effect on protein levels, fatty acid
oxidation and oxygen consumption on human muscle samples………………………113-114
CHAPTER FOUR: STUDYING THE ENVIRONMENTAL TOXICANT MEHP AND ITS
EFFECTS ON FATTY ACID METABOLISM IN VITRO AND IN VIVO- AN
ENVIRONMENTAL ASSOCIATION STUDY AND CELLULAR/MOLECULAR
MECHANISTIC APPROACH
Figure 1: MEHP cytotoxicity in C2C12 myotubes……………………………………140
Figure 2: Effects of MEHP on C2C12 myotube’s fatty acid oxidation
and mitochondrial respiration…………………………………………………………141-142
Figure 3: Assessment of the effects of MEHP on cellular glycolysis
levels in the presence of exogenous glucose…………………………………………..143
Figure 4: The effects of MEHP on metabolism related proteins……………………....144
6 APPENDIX
6.1 SUPPLEMENTARY FIGURES/TABLES FOR CHAPTER THREE
Supplementary Figure 1: Protein alignment of Human ACSL5 long (739aa)
and short (683aa) protein isoforms with mouse ACSL5 (683aa) and rat ACSL5
(683aa)- Both mouse and rat ACSL5 are 81% identical to the Human short
protein isoform of ACSL5……………………………………………………………..161-162
Supplementary Figure 2: Mouse ACSL5 colocalization in Endoplasmic
Reticulum and Mitochondria…………………………………………………………..163
Supplementary Figure 3: ACSL5 protein isoform expression within human
muscle sample (HMS) and HepG2 cells……………………………………………….164
Page 16
xvi
Supplementary Figure 4: Immunofluorescence images stained for human ACSL5
and Tom20 in human Rectus Abdominis cells derived-myotubes ……….…………...165
6.2 SUPPLEMENTAL FIGURES FOR CHAPTER FOUR
Supplementary Figure 1 : The effects of MEHP on cellular endogenous
mitochondrial respiration and glycolysis………………………………………………168
Supplementary Figure 2: The effects of MEHP on ACSL5 levels in
C2C12 myoblasts………………………………………………………………………169
Page 17
xvii
LIST OF TABLES
CHAPTER TWO: THE ASSOCIATION BETWEEN ACSL5 RS2419621 GENOTYPE AND
RESPONSE OF WOMEN WITH OBESITY AND OVERWEIGHT TO LIFESTYLE
INTERVENTIONS.
Table 1: Best Subset Regression Analysis conducted on MONET and
CAO women with overweight or obesity……………………………………………...77
Table 2: Best Subset Regression Analysis conducted on MONET and CAO
women with obesity…………………………………………………………………...78
Table 3: Pre- and post-intervention anthropometric variable values from
MONET and CAO women with overweight or obesity……………………………….79
Table 4: Regression analysis comparing CC carriers of MONET to CAO
in women with overweight or obesity………………………………………………...80
Table 5: Regression analysis comparing CT/TT carriers of MONET to CAO
in women with overweight or obesity…………………………………………………81
Table 6: Regression analysis studying lifestyle intervention effect in CT/TT
vs CC women with overweight or obesity…………………………………………….82
Table 7: Pre- and post-intervention anthropometric variable values from MONET
and CAO studies in women with obesity……………………………………………...83
Table 8: Regression analysis studying lifestyle intervention effect in CT/TT
vs CC women with obesity……………………………………………………………84
CHAPTER THREE: DETERMINING THE CELLULAR AND MOLECULAR
MECHANISMS BY WHICH RS2419621 ACSL5 POLYMORPHISM EXERTS ITS
EFFECT.
Table 1: Ottawa Hospital Weight Management Clinic patient information whose
tissue and cells were used for analyses.……………………………………………….115
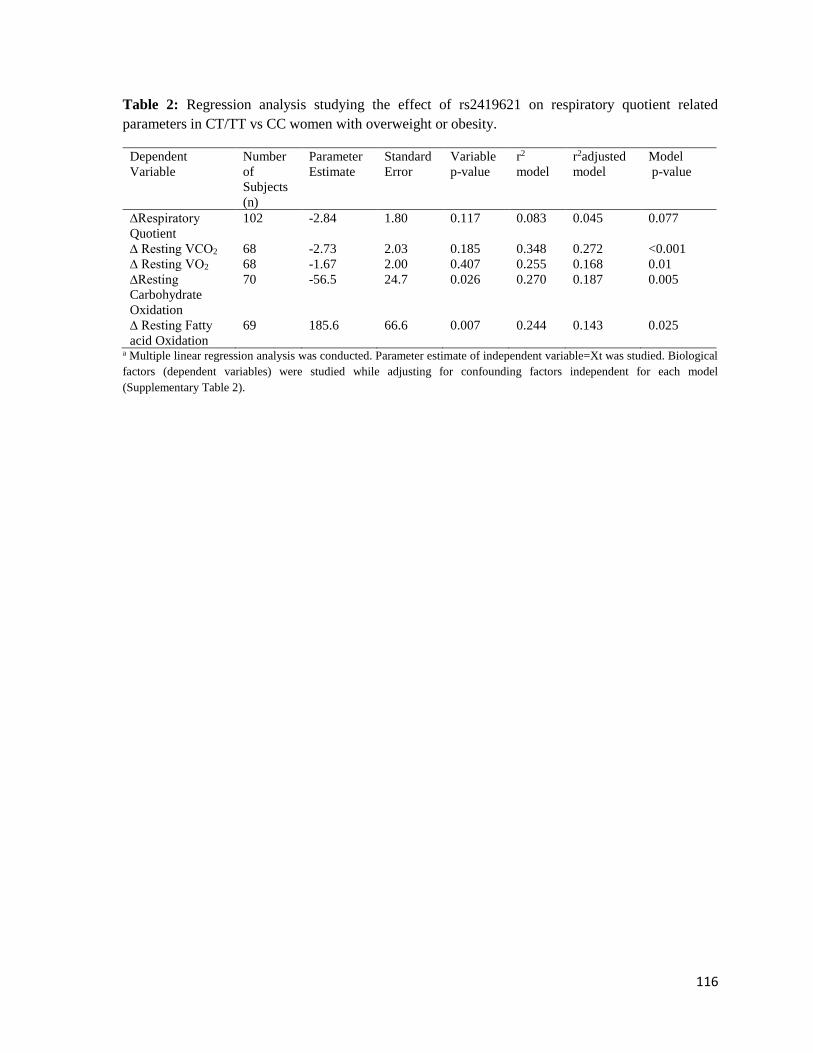
Table 2: Regression analysis studying the effect of rs2419621 on respiratory
quotient related parameters in CT/TT vs. CC women with overweight
or obesity………………………………………………………………………......….116
CHAPTER FOUR: STUDYING THE ENVIRONMENTAL TOXICANT MEHP AND ITS
EFFECTS ON FATTY ACID METABOLISM IN VITRO AND IN VIVO- AN
ENVIRONMENTAL ASSOCIATION STUDY AND CELLULAR/MOLECULAR
MECHANISTIC APPROACH
Page 18
xviii
Table 1: Characteristics of women with obesity enrolled in NHANES 2003-2004……145
Table 2: Backward regression analysis studying the modulators of plasma
omega-6 fatty acid (Arachidonic Acid (AA) and Gamma-Linolenic Acid (GLA))
levels within adult women with obesity who participated in NHANES 2003-2004
study……………………………………………...…………………………………......145
6 APPENDIX
6.1 SUPPLEMENTARY FIGURES/TABLES FOR CHAPTER THREE
Supplementary Table 1: Descriptive statistics on Montréal Ottawa New
Emerging Team participants with obesity or overweight pre/post intervention……….166
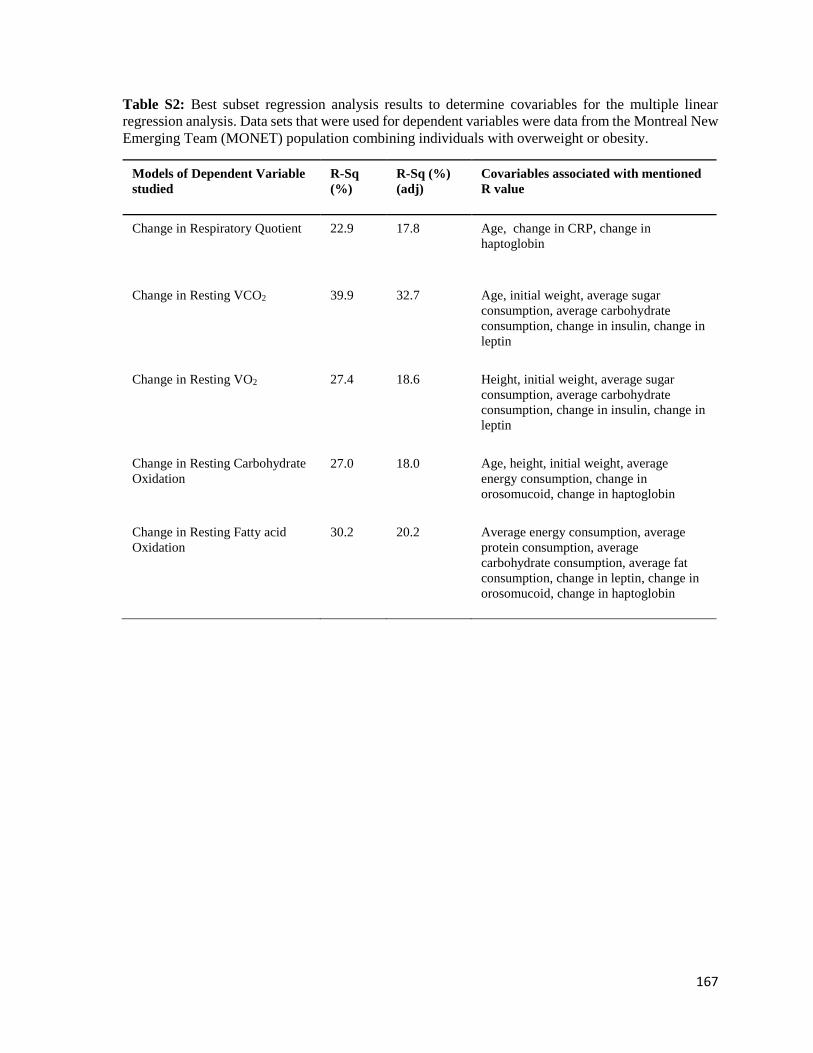
Supplementary Table 2: Best Subset Regression Analysis results to
determine covariables for the multiple linear regression analysis. Data
sets that were used for dependent variables were data from the
Montreal New Emerging Team (MONET) population combining
individuals with overweight or obesity………………………………...........................167
Page 19
1
CHAPTER ONE: GENERAL INTRODUCTION
1.1 Obesity, the disease
What defines a disease? Such a term is characterized as a pathological condition in a living
system, resulting in the impairment of standard functions and the manifestation of particular
signs and symptoms 1. While certain conditions such as diabetes and cancer can be readily
characterized as diseases, an intricate condition such as obesity, which contributes to the
development of a plethora of comorbidities, was only recently pronounced as a disease by both
the Canadian and American medical associations as well as the World Health Organization 2–
4. Obesity is a consequence of disrupted energy balance, specifically when the scales have
been tipped towards an increase in dietary energy intake vs energy expenditure. Thus, this
disease is defined as the accumulation of excess abnormal fat within the human body, with a
body mass index (BMI) ≥ 30kg/m2, while overweight is characterized by a BMI of 25-29.9
kg/m2 5. While BMI measurement is the most common approach to establishing whether an
individual suffers from obesity, other modes of determination include waist circumference
measurements where over 35 inches (88.9 cm) in Caucasian women, and over 40 inches (101.6
cm) in Caucasian men were deemed to be risk factors for obesity-related metabolic
complications6. Furthermore, modes of measurement including waist circumference, waist-
to-hip ratio, Dual Energy X-ray Absorptiometry (DEXA), Computerized Tomography (CT)
and Magnetic Resonance Imaging (MRI), allow for the accurate measurements of fat
deposition within the human body, facilitating precise measurement of abdominal/central
obesity, known to contribute towards the onset of diseases such as type 2 diabetes (T2D) and
cardiovascular disease7,8.
Page 20
2
1.2 Population Statistics on Obesity
A 2015 study published in the New England Journal of Medicine, reported that a total of 107.7
million children and 603.7 million adults globally were affected by obesity, while the
prevalence of the disease was shown to have doubled since the 1980s in 73 countries9.
Furthermore, while the frequency of obesity was 5% in children and 12% in adults, a higher
percentage of obesity was noted amongst women in comparison to men across all ages9.
Specifically, women between the ages of 60 to 64 and men 50-54 had the highest prevalence
of obesity9. These observations parallel previous findings in 2014 by the World Health
Organization, where 1.9 billion adults were determined to be overweight world-wide, while
600 million adults were suffering from obesity5.
The Canadian Health Measures Survey (CHMS), a Canadian nation-wide survey conducted
to study the health status of the general population, observed that 62% of Canadian adults were
either obese or overweight between 2012-2013, while the prevalence of obesity had doubled
since 1978/7910. The National Health and Nutrition Examination Survey (NHANES), the
American equivalent nation-wide survey, illustrated that 36.5% of U.S adults and 17% of
youth suffered from obesity between 2011-201411. While the prevalence of obesity was
roughly the same between sexes in Canadian adults (males= 27% vs females= 26% ), similar
to world-wide population statistics, a higher prevalence of obesity was observed amongst U.S
women (38.3%) in comparison to men (34.3%)10,11. Nevertheless, a higher percentage of
middle-aged and older adults suffered from obesity in comparison to younger adults in both
Canada and United States10,11. Regarding ethnicity, a higher percentage of obesity was noted
within adults and youth of Caucasians, African-Americans and Hispanic descent, in
comparison to Asians within United States11.
Page 21
3
A disease once classified as a “high-income country problem”, has become a global concern
in low and middle-income countries as well5. Population statistics documented by the World
Health Organization has documented 10.6 million individuals in 2014 with obesity in Africa
alone5. Furthermore, it has been noted that overweight and obesity accounts for a higher
percentage of deaths worldwide in comparison to underweight5.
1.3 Co-morbidities of Obesity
Obesity has been shown to promote an increased risk in developing chronic diseases. As a
result, a considerable increase in medical care costs have been reported in North America,
with the United states estimated to contribute roughly $147 billion dollars/year towards
medical care expenses12. Obesity has been shown to increase mortality through metabolic
impairment and co-morbidities , specifically through increased susceptibility to cardiovascular
disease13. Studies have reported obesity to be positively associated with mortality, with
increases as high as two- to three- folds14. Recent global studies on the effects of obesity on
mortality have displayed an association between overweight and obesity with an increased all-
cause mortality in Asia, Europe, Australia and North America15.
Obesity increases the risk for disrupted glucose uptake and metabolism, specifically insulin
resistance, which precedes and predicts type 2 diabetes mellitus16–18. Other co-morbidities of
obesity include dyslipidemia and cardiovascular diseases (i.e., hypertension and stroke)19–22.
Sleep apnea, osteoarthritis, hyperuricemia and gall bladder disease have been shown to be
influenced by increased weight gain/obesity, while infertility, polycystic ovary syndrome and
reproductive hormonal imbalances are associated with the disease as well13,18,23–26. Cancer has
been associated with obesity, comprising of colorectal, prostate, endometrial, breast and gall
bladder cancers13,18,27. Finally, increased obesity has been shown to be associated with
Page 22
4
psychological problems including depression and as a result promote a binge-eating
disorder13,28.
1.4 Multi-Factorial Influences on Obesity
The etiology of obesity is linked with behavioral, environmental, genetic and epigenetic
factors. The subsequent section elaborates on these factors in the development and progression
of this disease.
1.4.1 Obesity and Behavioural Factors
Behavioral risk factors contributing to the pathology of diseases include lack of physical
activity and poor diet. Thus, the following subsection focuses on the effects of physical activity
and diet on weight gain/obesity.
1.4.1.1 Obesity and Food Intake
Energy balance, characterized by the relationship between energy intake and output, can lead
to obesity, when the scales are tipped towards energy intake. Thus, one of the major
contributors to weight gain and obesity, is the nutritional diet, specifically the amount of
calories consumed by drinking and eating. Cross-sectional and prospective studies focused on
examining the effects of junk food intake on weight gain in both younger and older adults,
illustrated a significant positive association between the frequency of fast food
consumption/restaurant visits with BMI29–32. An experimental trial conducted on 891 women
between the ages of 20-45, where intake of fast food was measured via questionnaire, revealed
its increased association with total energy intake and body weight gain33. However, while
increased consumption of food or overfeeding has been associated with weight gain,
undernutrition in utero has previously been shown to predispose offspring to obesity at a later
Page 23
5
stage in life. Specifically, the 1990 Barker theory, also known as the “foetal origins
hypothesis”, initially based on observations during the Dutch famine 1944-1945, postulates
that the fetal adaptation to undernutrition in utero, can permanently alter its metabolism and
physiology34,35. The results is an increased risk of disease development later in life, including
obesity36. Work conducted in our lab, has provided more insight into the effects of in utero
undernutrition, where we have observed altered metabolic physiology through skeletal muscle
energetics37. This has been shown to hinder the response to adulthood hypocaloric diets and
has been postulated to be an effect of mitochondrial dysfunction37. Therefore, the following
concept of “double-burden of malnutrition” addressed, is defined as co-existence of
undernutrition along with overweight and obesity38.
While, undernutrition in utero has been shown to play a role in post-natal obesity development,
overnutrition in utero which is more prominent within Western societies has been shown to
contribute to obesity as well. Specifically in rodent studies, offspring from dams fed a high-
fat diet during pregnancy, have reported increased body fat accumulation39–42.
1.4.1.2 Obesity and Physical Inactivity
While, overfeeding and in utero undernutrition have both been illustrated to play a role in
obesity, physical inactivity can contribute to weight gain. A population-based 7 year
prospective study conducted between 1985/86-1992/93 studying American men and women
between the ages of 18-30 yrs. , displayed a significant association between decreased physical
fitness and increased weight gain in both sexes43. This observation was also noted within a
prospective follow-up study conducted on a Finnish population, illustrating a significant
increased association between becoming inactive during the adolescence to adulthood
transition with overweight in males, obesity in males and females, and severe abdominal
Page 24
6
obesity within females44. Studies on youth also paralleled previous observations noted on
adults, where a decline in physical activity was associated with increase in BMI and skinfold
thickness in girls45.
Studies focused on observing the effects of television and video games on childhood obesity,
have concluded that both sedentary behaviours result in increased weight gain. Specifically, a
1985 study on the National Health Examination Survey (NHES) Cycles II and III focused on
examining children within the United States, observed a significant association between the
time spent watching television and prevalence of obesity46. The following observations were
also noted within American adults, where men who viewed television more than 3 hours a day
had a greater susceptibility to developing obesity in comparison to men who viewed television
1 hour/day47. Interestingly, recent findings on the effects of bedroom electronic entertainment
and communication devices (EECD), have reported an improvement in weight status in
children who have no access to EECDs within their bedrooms48. No access to EECDs
including TV and video games, presented improved sleep duration, quality and efficiency, all
previously shown to influence weight gain49,48. Thus, findings confirm the effects of video
game/TV access on sleep quality and obesity.
1.4.2 Obesity and Environmental Factors
Environmental factors, such as socio-demographics, environmental pollutants and gut
microbiome have been shown to contribute towards weight gain/obesity. The following
subsection focuses on these following factors.
Page 25
7
1.4.2.1 Obesity and Socio-Demographics
The following section will focus on the effects of age, sex, ethnicity and economic status on
obesity.
1.4.2.1.1 Age and Sex Effects on Obesity
Global population statistics conducted by the New England Journal of Medicine have reported
an increased frequency of obesity within adults (12%) vs children (5%), while the highest
prevalence of obesity was noted with women between the ages of 60 to 64 and men 50-54,
clearly demonstrating an age-effect with obesity9. Cross-sectional studies conducted on men
and women have shown that both BMI and waist-to-hip ratio is affected with increasing
age50,51. Sex-effects have been previously observed in global population studies, where a
higher percentage of obesity was noted amongst women in comparison to men across all ages9.
However, this global trend has not been observed when studying the Canadian population
solely, as women and men were equally shown to be affected by obesity10. Furthermore, results
remain inconsistent when studying the effects of sex on obesity in childhood and
adolescence52. Specifically, while males were demonstrated to have increased prevalence of
obesity within East Asian countries, females had greater prevalence for obesity within the
Middle East52. Thus, while further elucidation is required, it is evident that sex plays a role in
obesity.
1.4.2.1.2 Obesity, Ethnicity and Economic Status
Obesity has been shown to be influenced by ethnicity. Literature overviews have revealed a
greater total body fat within individuals of Asian background, in comparison to Caucasian
Europeans displaying the same BMI53. Specifically, south Asian background were observed
Page 26
8
to have a higher chance of developing abdominal obesity, thus increasing the risk for co-
morbidities such as type 2 diabetes and cardiovascular disease54,55. Studies conducted on the
National Health and Examination Survey between the years 1999-2010, illustrated an
increased rate of obesity within non-Hispanic black women in comparison to Mexican
American, Hispanic and Non-Hispanic Caucasian women56.
Interestingly, while an individual’s ethnic background could contribute towards weight gain/
obesity via genetics, cultural perception on what is subjectively deemed as obesity, has shown
to influence weight gain within society as well. While obesity has been acknowledged by the
World Health Organization and the Canadian and American Medical Associations as a
disease, an individual with increased weight may also be perceived as more healthy, beautiful,
stronger and fertile in different parts of the world57–59. Previous research conducted on children
in the U.S reported more acceptance with weight gain and larger body proportions within
African-American children in comparison to Caucasians60,61.Furthermore, a cross-sectional
survey conducted on rural women from South Africa reported a lack of concern with weight,
while individuals with overweight and obesity also did not want to lose weight62.
While, the effects of ethnicity on obesity are evident, weight gain/ obesity is highly influenced
by the economic status of the region of interest. In particular, higher rates of obesity have been
observed within low income populations in developed countries, while higher income
populations are more susceptible to obesity within developing countries63,64. The previous
observation alludes to the increased globalization observed with higher income classes within
developing countries, providing individuals with increased accessibility of cheap high caloric
food65. This has been validated by cross-sectional studies on Moroccan adults, where a positive
Page 27
9
association was observed between risk of overweight and obesity and average family income
in men51.
1.4.2.2 Obesity and Environmental Pollutants
Environmental pollutants are defined as chemicals that result in adverse ecological and health
consequences due to their introduction into the surrounding air, water, soil and food66.
Environmental pollutants encompass a wide array of chemicals, including but not limited to
persistent organic pollutants (POP), phthalates (PAE), bisphenol A (BPA) and pesticides66.
The concept of an “obesogen”, emphasizes the effects of certain chemicals in promoting
increased fat accumulation and obesity by altering lipid metabolism and adipogenesis within
the body67. While chemicals such as BPA have consistently shown a positive correlation
between increased exposure and obesity, the obesogenic effects of chemicals such as PAEs
have been shown to be affected by factors including age66,68–71. Due to increased exposure of
PAEs through our diet, the following section will focus on the effects of PAEs on weight
gain/obesity.
1.4.2.2.1 Obesity and Phthalate (PAE) Esters
Phthalate esters are esterified phthalic acids, predominantly used as a plasticizer to allow
increased flexibility and durability of plastics72. The most common source of human exposure
to phthalates is through the diet72,73. Furthermore, phthalates have a decreased propensity to
covalently bind onto consumer product matrices, resulting in humans having increased
susceptibility to the adverse health effects caused by phthalate exposure72,73. Previous research
on U.S women illustrated increase in weight gain with increase in urinary phthalate
metabolites phthalic acid, methylbenzylpiperazine (MBzP) and monobutyl phthalate, while
Page 28
10
elderly women also experienced an increase in waist circumference, total fat mass and
subcutaneous adipose tissue with increased circulating concentrations of mono-isobutyl
phthalate68,74. While conflicting results have been observed on the effects of phthalate
metabolite exposure on children, a dose-response relationship between monoethyl phthalate
and increased BMI/waist circumference was observed in overweight children75.
One of the primary phthalate plasticizers used in Canada is di (2-ethylhexyl) phthalate
(DEHP)76. A common chemical compound found in food packaging, medical devices and
cosmetics, DEHP’s mode of human exposure consists of dermal layer, inhalation and
ingestion76. DEHP is broken down to its preferentially absorbed monoester derivative form,
mono-(2ethylhexyl) phthalate (MEHP)76,77. On average, Canadians have been documented to
have daily exposure intakes ranging from 5.8 to 19.0 µg/kg, with medical environments
increasing daily intake up to 167.9mg/day78,79.
Previous studies on the effects of DEHP, MEHP and an oxidative DEHP metabolite mono(2-
ethyl-5-hydroxyhexyl) phthalate (MEHHP), have shown a positive association between
anthropometric indices related with abdominal obesity (including waist circumference and
waist-to-hip ratio) as well as BMI, and increased urinary DEHP metabolites in adults and
children80–84. Interestingly, studies on women have also revealed an increase in MEHP to
MEHHP (product of MEHP oxidation) ratio with increasing BMI and waist circumference,
thus exhibiting a disrupted or slower rate of oxidative metabolism of the toxicant with
increasing adiposity80. Whether the following disruption is a consequence of decreased P450
enzymatic activity responsible for MEHP oxidation, or an overtly decreased metabolic rate
requires further elucidation80. Regardless, such a decrease in MEHP oxidation, may result in
increased endocrine disrupting effects, dysregulation of the overall energy balance and thus
Page 29
11
alter fatty acid utilization within these individuals caused by increased exposure to MEHP80.
In vitro work focused on understanding the cellular effects of MEHP, have illustrated the
toxicant as a potential endocrine disruptor by behaving as a potential PPARγ- agonist85.
Specifically, Feige et al. 2007 reported a dose-dependent cellular activation of a PPARγ
receptor element (PPRE)-firefly luciferase reporter, in the presence of the adipogenic
transcription factor PPARγ85. This was observed when studying COS7, Hela and muscle
C2C12 cells when exposed to MEHP85. Furthermore, models predicting the potential
interaction of MEHP with PPARγ, displayed MEHP to bind with the ligand binding domain
of PPARγ similarly to rosiglitazone, a known PPARγ agonist85.
1.4.2.3 Obesity and Gut Microbiome
The human body is known to consist of over 2000 species of bacteria, with the majority found
within our gut86. One of the primary and crucial research findings illustrating the importance
of the gut microbiota in the development of adiposity, was by Bäckhed et al. 2004, where
germ-free mice in the absence or presence of a higher caloric intake, had a 40% reduction in
total body fat than mice raised conventionally in the presence of microorganisms87,88.
However, following the introduction of a microbial environment into the gut of the germ-free
mice, total body fat and hepatic triglycerides significantly increased87. To affirm that the gut
microbiota composition’s effect on obesity was causal and not a consequence, transplantation
of gut microbiota of lean and obese mice into a germ-free host, illustrated an increase in
adiposity with “obese microbiota” vs “lean microbiota”89. Previous research on the distal gut
microbiota composition between lean vs obese adults, have displayed a lower percentage of
Bacteroidetes and an increased amount of Firmicutes with obesity90. Furthermore, the
composition of the diet was shown to influence the gut microbiota, where introducing a low-
Page 30
12
caloric diet inducing weight loss, appeared to increase the Bacteroidetes to Firmicutes ratio
within individuals90. However, conflicting results have been also observed in other studies,
where no differences or an increase in Bacteroidetes was noted in individuals with obesity91–
93. Regardless, changes in gut microbiome composition has been shown to influence adiposity.
In order to further study the effects gut microbiome composition and increased adiposity, a
randomized-control trial was conducted on pregnant women, to study the effects of gut
microbiota manipulation on adiposity and weight gain in children94. The study illustrated that
perinatal probiotic intervention controlled the initial phase of weight gain in the first 24-48
months of age, but did not effect weight gain following 48 months of age94. Furthermore,
probiotic introduction in pregnant women appeared to result in trends towards a decreased
birth-weight adjusted mean BMI in 4 years old children, illustrating the importance of early
gut microbiota in a child’s growth rate94.
Currently, crowd-funded citizen science projects such as the American Gut Project exist to
enable participants to learn more about their gut microbiota95. Such projects provide the ability
to learn about the association between the human gut microbiome and health by studying the
effects of factors such as diet, alcohol consumption and disease95.
1.4.3 Obesity and Endocrine Medical Conditions
Endocrine-related conditions, that disrupt the energy balance of an individual due to altered
hormonal levels can influence weight gain/obesity96. Thus, endocrine disorders such as
hypothyroidism, Cushing’s syndrome, polycystic ovarian syndrome and certain cancers such
as craniopharyngioma play a role in weight gain97–100. Thyroid hormones are responsible for
controlling the body’s metabolism via pathways such as fatty acid oxidation and glycolysis,
while also regulating food intake97. Thyroid hormones have previously been associated with
Page 31
13
thermogenesis and metabolic rate, while also contributing towards an alteration in BMI and
obesity101. Cushing’s syndrome, a consequence of high levels of cortisol exposure, has been
shown to be associated with weight gain/adiposity by increased levels of adipocyte
differentiation and adipogenesis98. While obesity has been shown to affect polycystic ovarian
syndrome (PCOS) due to increased insulin resistance in PCOS patients with obesity, the
excess androgen levels found within individuals with PCOS, has been shown to be a key factor
in the development of central obesity as well99. Finally, cancers such as craniopharingioma,
where tumours arise within the hypothalamic-pituitary region, have been shown to contribute
towards hypothalamic obesity, a condition irresponsive to exercise and diet, while still being
associated with abnormal food seeking behaviors100.
1.4.4 Obesity and Genetics
The following section will focus on the effects of genetics on obesity, specifically studying
the effects of mutations and single nucleotide polymorphisms (SNPs) on the disease.
1.4.4.1 Obesity and Genetic Conditions
Genetic factors have been shown to contribute towards the development of obesity. Some of
the genetic conditions including Prader-Willi syndrome, Bardet-Biedl syndrome, Alström
syndrome and Cohen syndrome have been shown to lead towards increased weight
gain/obesity102–105.
1.4.4.2 Obesity and Heritability
Obesity has been characterised as a highly heritable disease, with studies illustrating an
increased susceptibility to the disease when a family member suffers from obesity106. Previous
research conducted on twin adoption and family studies have reported varying ranges of
heritability estimates for BMI (16-85%) and body fat percentage (35-63%)106–115. Monogenic
Page 32
14
obesity, representing a small percentage of obesity cases, is a condition that severely affects
individuals as early as childhood, has been reported in 176 human obesity cases and is
influenced by mutations found in 11 genes including but not limited to leptin (LEP) and leptin
receptor (LEPR)106,116. Additionally, SNPs are one of the genetic aspects known to factor into
the development of obesity. SNPs are single position nucleotide changes commonly found in
the DNA within a population117. Genome-wide association studies (GWAS), have been shown
to be successful in determining genome-wide set of genetic variants/SNPs in individuals to
study genetically-associated traits including diseases118. Obesity has been shown to be
influenced by SNPs found within genes known to regulate metabolic processes as well as
adipocyte differentiation, triglyceride metabolism and leptin regulation106,119. Specifically, a
review published by Yang et al. 2007, has illustrated that in 426 studies, 127 candidate genes
presented positive associations between SNPs and obesity-related phenotypes, with 22 of these
genes exhibiting a positive association with obesity in at least five studies106. These genes
include, peroxisome proliferator-activated receptor gamma (PPARG), LEPR, and uncoupling
proteins UCP1, 2 and 3106.
Peroxisome proliferator-activated receptor gamma, is a nuclear receptor responsible for
regulating genes that play a role in lipid and glucose metabolism and is a master regulator of
adipogenesis120. One of these response genes speculated to be regulated by PPARG is acyl-
CoA synthetase long chain 5 (ACSL5), known to esterify intracellular free fatty acids into
fatty acyl-CoA molecules121. A polymorphism found on this gene (rs2419621), characterised
by a C to T transition in the promoter region of the gene, has been shown to be associated with
increased rate of weight loss within post-menopausal women with obesity122. With an allele
frequency of roughly 22%, rs2419621 has been shown to produce an additional EBOX site on
Page 33
15
top of the two commonly found sites, as well as increasing the expression of the downstream
gene in vitro123. A section of the following Ph.D thesis will be focusing on the effects of the
rs2419621 polymorphism on obesity-related phenotypes, as well as its effect on fatty acid
metabolism both in vitro and ex vivo.
1.4.5 Obesity and Epigenetics
Epigenetics, are heritable changes that influence the expression and function of genes without
altering the DNA sequence of an individual124. Epigenetic changes including DNA
methylation (i.e., promoter region CpG methylation) and histone modifications such as
acetylation and methylation, can be influenced by external factors including environmental
and behavioral modifications, resulting in consequences such as altered gene expression levels
and genomic imprinting, where alleles can be silenced/activated due to parental origin125–127.
Epigenetics can be affected by both the pre-natal and post-natal environment of an individual.
Recent studies have illustrated a positive association between maternal pre-pregnancy obesity
and excessive neonatal adiposity/growth128. Furthermore, maternal methyl-donor dietary
intake alters foetal development as well as DNA methylation status of metastable epialleles129.
Additionally, studying human fetal DNA methylation analyses, have illustrated the effects of
overnutrition during pregnancy as well as high pre-pregnancy maternal BMI on altered DNA
methylation in metabolic genes in offspring cord blood DNA130,131. Interestingly, pregnant
women with obesity who underwent bariatric surgery to increase weight loss were shown to
give birth to children with decreased susceptibility to obesity as well as altered DNA
methylation profile of metabolism-related genes132,133. Furthermore, the Barker hypothesis has
also noted how starvation in utero can also lead to overweight in adulthood as well as diseases
associated with obesity including cardiovascular problems and diabetes34–36. These findings
Page 34
16
have been shown to be in part due to epigenetic changes in utero, illustrating how maternal
nutritional imbalances can alter fetal development and susceptibility to disease such as
obesity134,135.
Human and rodent studies have revealed how epigenetic changes can be influenced by age,
toxicity exposure and diet136. Consumption of a high-fat diet has been shown to alter the DNA
methylation status of genes, in adipose tissue and skeletal muscle of both humans and
mice126,137,138. Furthermore, dietary omega-3 supplementation as well as caloric restriction
have also presented epigenetic changes in both blood leukocytes and subcutaneous adipose
tissue in humans respectively139,140. Studies on exercise examining individuals with obesity
and T2D, have presented altered DNA methylation in genes responsible for fatty acid
metabolism and glucose transport, following 16 weeks of chronic exercise training141.
Previous work studying epigenotoxic effects, the study of toxicants or “obesogen” influence
on epigenetics, have illustrated how BPA exposure through the diet, results in altered
expression of metastable epialleles such as Agouti in mice142. Studies conducted in zebrafish,
have also reported an alteration in DNA methylation status and consequently an increased
expression in genes involved in adipogenesis, with increased exposure to the obesogen,
MEHP143. Thus, factors such as behaviour and environment have shown to regulate pre- and
post-natal epigenetic changes, influencing weight and adiposity.
1.5 Management and Treatment Options
The treatment modality implemented for obesity, is reliant on not only BMI and body fat
distribution, but also requires the consideration of co-morbidities, age, sex, ethnicity, genetics
and psychosocial etiologies144. Thus, overweight and obesity treatment guidelines typically
Page 35
17
rely on a two-step process of 1) assessing the degree of obesity and exposure to risk factors
and co-morbidities, followed by 2) management consisting of reduction, control and
maintenance of both weight loss and associated risk factors following the treatment144,145.
Previous guidelines on the treatment and management of overweight and obesity, have
illustrated how, while a weight reduction by 3-5% may improve cardiovascular risk factors,
a 10% reduction could significantly ameliorate complications associated with the obesity145.
Details on assessing the degree of obesity and co-morbidities can be found in sections 1.1 and
1.3. The following section will focus on obesity treatment/management.
1.5.1 Obesity and Lifestyle Changes
Lifestyle changes to manage and treat obesity consist of low-caloric diets, increased physical
activity and behavioral modifications to shift from a positive to a negative energy balance145.
Thus, this shift requires an energy deficit via reduced diet energy intake. However, due to the
possible presence of co-morbidities and altered health status, various modes of reducing
dietary energy intake exist. These include recommendation of a specific systematic energy
intake target (i.e., 1200-1500 kcal/day for women, and 1500-1800 kcal/day for men),
estimated energy deficit goals for an individual, such as a 30% energy deficit or methods
through which diet composition is altered to eliminate certain food groups145. Dietary
approaches that promote weight loss include, but are not limited to, high protein diets (calorie
composition: 25% protein; 30% fat; 45% carbohydrate), low carbohydrate diets (<30g/d of
carbohydrates) and low fat diets (20% of calories from fat)145. The Mediterranean diet, initially
observed and documented by Ancel Keys in the 1960s, consists of meals rich in fruits,
vegetables and legumes, low in meat, while olive oil represents the main source of fat146.
Previous epidemiolocal studies on the effects of the Mediterranean diet on obesity, have
Page 36
18
illustrated a reduction in BMI with increased adherence and consumption of the diet within
cohort studies147. While diets and meal replacements are easily accessible at home,
commercially available diets are also available through companies including Weight
Watchers145. Furthermore, other modes of energy deficit also include clinically supervised
meal replacement plans provided through weight management clinics (i.e., Optifast-900 used
in the 900kcal/day diet and behavioral program at the Ottawa Hospital Weight Management
Clinic) and other very low calorie diet approaches145.
Exercise, characterized by repetitive physical activity consisting of either resistance or aerobic
training, has been shown to be a treatment option for overweight and obesity148. The practice
guidelines published by the Obesity Society and American College of Cardiology/American
Heart Association Task Force prescribe increased aerobic training of 150min/week, while 200-
300min/week are suggested for weight maintenance and to prevent regain following weight
loss145. The ability of physical activity to assist in weight reduction has been illustrated in
multiple large population studies including both the Canada Fitness Survey and the American
“First National Health Nutrition and Examination Survey”148. However, previous research has
illustrated how exercise alone results in marginal improvement in weight loss148. Thus,
interventions consisting of both a diet and exercise regiment have been shown to improve
weight loss considerably149,150. Furthermore, while studies illustrate no difference in the
degree of weight loss between varying intensities of exercise training in the presence of a diet,
selected studies illustrate vigorous activity to be more efficient in weight reduction in
comparison to moderate or light intensity exercise training, in the absence of dietary
alterations148. However, apart from contributing towards weight loss, exercise has been shown
to participate in improving the overall health of an individual by the reduction of systolic blood
Page 37
19
pressure, serum triglyceride levels and fasting serum glucose, with increased improvement
with high intensity vs low intensity exercise148.
While both exercise and diet ameliorate the negative health effects of obesity, as well as aiding
in weight loss, behavioral modifications are required to minimize the potential weight gain
that occurs following a lifestyle intervention145. Generally, lifestyle interventions consist of a
program in which patients are taught to monitor food intake, physical activity and their body
weight to promote weight maintenance and prevent weight gain145.
1.5.2 Obesity and Pharmacotherapy
Pharmacotherapy, the use of drugs for the therapy of a disease, has been shown to provide
beneficial results for long-term weight management in adults with obesity and overweight
individuals with co-morbidities, such as type 2 diabetes and hypertension151. Currently, only
two of these drugs are available in Canada, Orlistat (Xenical®) and Liraglutide 3.0mg
(Saxenda®).
Orlistat, available since the late 1990s has been shown to reduce dietary fat absorption through
the gut with studies showing roughly a 2-3% reduction in weight loss following drug
administration151. However, side effects for this drug include severe gastrointestinal effects,
consequently resulting in only 10% Canadian individuals prolonging prescription one year
later152,153.
Liraglutide, an agonist that targets the glucagon-like-peptide-1 (GLP-1), was initially
approved for treating T2D, through its positive insulin stimulation and secretory glucagon
suppression151. However, due to the role of GLP-1 in energy homeostasis, via its ability to
suppress appetite in T2D patients, the drug was marketed as an anti-obesity drug as well154,155.
Page 38
20
Phase 3 trials illustrated an 8% weight loss in individuals with obesity with prediabetes at
baseline156. Furthermore, a phase 3 trial focused on studying the effects of the drug in weight
maintenance and weight loss in the presence of a low-caloric diet, illustrated an average weight
loss of 6.2% in individuals with obesity or overweight157. Common side effects of the drug
include nausea, vomiting and diarrhea151.
Other anti-obesity drugs that have been approved by the FDA are: Phentermine/topiramate
(PT) (Qsymia), lorcaserin (Belviq) and naltreoxone/bupropion (NB)151. However, both NB as
well as PT have been shown to require dose titration, while also contributing towards severe
health effects including neuropsychiatric and teratogenicity for PT151.
1.5.3 Obesity and Bariatric Surgery
Bariatric surgery, is an invasive surgical procedure conducted on the stomach and small
intestine, to restrict food capacity within the stomach and decrease food intake/absorption of
nutrients, while also causing alterations in hormonal levels158. As the most successful
treatment modality for combatting severe obesity (individuals with a BMI>40kg/m2 or
suffering from co-morbidities with a BMI>35 kg/m2 ), common bariatric surgery procedures
include adjustable gastric band, Roux-en-Y gastric bypass, biliopancreatic diversion with
duodenal switch and laparoscopic sleeve gastrectomy158,159. With Roux-en-Y gastric bypass
being the most frequently conducted bariatric surgery procedure (46.6%), a 2011 study
reported both the United States and Canada to perform the highest number of operations
worldwide (101 645 operations)159,160.
Roux-en-Y procedures are conducted by ligating a small portion of the sectioned upper
stomach to the bottom end of the divided small intestine158. The top portion of the divided
Page 39
21
small intestine is also ligated onto the bottom portion of the small intestine, to facilitate the
mixing of stomach acids and digestive enzymes from the bypassed stomach into the newly
constructed pouch158.
While the key outcome of bariatric surgery is considerable weight loss, operations have also
been shown to contribute towards the remission of T2D159. Randomized control trials studying
the effects of bariatric procedures in individuals suffering from severe obesity, provided
evidence of increased short-term weight loss and remission of T2D, regardless of the
procedure implemented in comparison to non-surgical treatments159,161–166. Furthermore,
improvements in serum triglyceride and high-density lipoproteins occur following bariatric
surgery, while obesity associated co-morbidities including cancer and death were also
decreased161,167,168. However, bariatric procedures are not without risks, with side effects
including, psychosocial, hormonal disturbances, nutritional deficiency including iron
deficiency anemia and pulmonary complications159,169. There is always the risk of reoperation
due to postoperative complications and/or insufficient weight loss159.
All rectus abdominis tissue and derived myocytes used within this Ph.D thesis were obtained
during bariatric surgery procedures on women who had previously participated in the Ottawa
Hospital Weight Management Clinic.
1.6 Skeletal Muscle, Fatty Acid Metabolism and Obesity
The following section will focus on skeletal muscle, as well as the interactions between the
tissue, fatty acid metabolism and obesity.
Page 40
22
1.6.1 Skeletal Muscle: Structure and Function
Skeletal muscle is one of the major organs of the human body, comprising roughly 40% of an
average lean adult’s body weight170. As one of the three major muscle types (other two being
smooth muscle and cardiac muscle), skeletal muscle’s main function is the conversion of
chemical energy into mechanical energy to aid physical movement170. However, regarding
whole-body metabolism, skeletal muscle is one of the key tissues that utilizes free fatty acids
as a source of energy while contributing towards basal energy metabolism170. Other direct
functions of skeletal muscle include storage site for various substrates including amino acids
and carbohydrates for both itself and other tissues, as well as body core temperature
maintenance via heat production 170,171. Skeletal muscle can also indirectly impact the
maintenance of blood glucose levels during starvation as well as regulate response to stress
factors and illness170.
Skeletal muscle is a form of striated muscle tissue that is composed of muscle fibers, myofibril
bundles surrounded by connective tissue called fasciae170. Skeletal muscle is attached to the
bone via collagen fibers known as tendons, which allow the assisted movement of bones via
skeletal muscle contraction170. Muscle fibers are characterized as being multinucleated, post-
mitotic and are formed through myogenesis, the process where myoblast cells fuse into
myotubes. The basic unit of the skeletal muscle responsible for contraction and the striated
appearance of the tissue, are the sarcomeres, composed of long fibrous and filamentous
proteins such as actin and myosin that help to make up the myofibrils within the muscle
fibers170. Satellite cells, found between the sarcolemma and basal lamina are known to
participate in muscle growth and repair as well as play a role in new muscle fiber generation
Page 41
23
when stimulated by myogenic factors170. Thus, in order to meet all the energy demands of the
tissue, muscle cells and consequently skeletal muscle, can be enriched with mitochondria170.
Muscle fibers contain a sarcoplasmic reticulum responsible for calcium storage and release
responsible for muscle contraction, and a highly interconnected network of mitochondria,
unique from the commonly described circular form of the organelle170. However, the following
cellular components are significantly regulated by factors including exercise training and
aging. Specifically, studies have illustrated how endurance and aerobic exercise can increase
mitochondrial biogenesis, augmenting both number and size of mitochondria, while aging
muscle results in a dysfunction of calcium release and inactivation of muscle due to
fragmented sarcoplasmic reticulum170,172,173.
Due to the high metabolic heterogeneity amongst different muscle fibers, to facilitate
participating in diverse metabolic and mechanical processes, fiber-type composition of
skeletal muscle is also variable170. Fiber type composition of muscle fibers can be determined
by the presence of myosin heavy chain (MHC) isoforms. Fiber-types are therefore categorized
into two main types: Type 1 consisting of slow twitch oxidative aerobic muscle fibers (MHC-
I isoform expression), and Type II consisting of fast twitch muscle fibers that are sub-
categorized into Type IIA referring to fast twitch oxidative glycolytic (MHC-IIa isoform
expression) and Type IIX referring to fast twitch glycolytic fibers (MHC-IIx isoform
expression) 170. Type I and IIA fibers have also been shown to have high levels of
mitochondria compared to other fiber types170.
The following Ph.D thesis focuses on studying human rectus abdominis and vastus lateralis
cells and tissue. Studies on Vastus lateralis muscle has shown that sex influences the area of
occupancy for specific fiber-types, where men had a larger area occupied by Type IIA fibers
Page 42
24
while women had a larger area of Type I muscle fibers174. While Rectus abdominis tissue from
non-obese subjects have been reported to present equal levels of both Type I and Type II
muscle fibers, fiber composition has been shown to be affected by adiposity (decrease in type
I fibers noted with obesity) and in vitro glucose transport rate within humans175,176.
1.6.2 Skeletal Muscle and Obesity
While a healthy lean individual’s skeletal muscle contributes towards 20-30% of total resting
oxygen uptake, over 90% of the whole-body oxygen uptake during maximal physical activity
is attributed to muscle oxygen consumption177. The effects of obesity on muscle strength has
been previously assessed in both adult and adolescents178–180. Studies have illustrated a
reduction in muscle strength when adjusted for body mass in adolescents, young adults and
elderly individuals with obesity178–180. This decrease in strength was coupled with defects in
the activation of agonist muscles in individuals, illustrating profound defects in skeletal
muscle action with weight gain181. Studies have also illustrated an impairment in skeletal
muscle regeneration within obesity-related models182.
Apart from the effects on muscle strength and function obesity can also result in increased
lipid deposition within skeletal muscle183,184. Lipotoxic species linked to ectopic fat
accumulation can interfere with insulin signalling, and contribute towards obesity induced
insulin resistance185,186. It has been reported that diet-induced weight loss can improve insulin
sensitivity, paralleled by a decrease in intramyocellular lipids (IMCL), while a high fat diet
increased IMCL and impaired sensitivity to insulin187,188. In contrary, opposite findings have
also been reported in athletes, entitled the “athlete’s paradox”, where highly insulin-sensitive
athletes have also been shown to have elevated intramuscular lipid content including increased
triglyceride levels189.
Page 43
25
1.6.3 Mitochondria and Obesity
Mitochondria, commonly known as the “powerhouses” of the cells, are the organelles that
contributes towards cellular and consequently whole-body energy expenditure, via the
intermediary pathways involved in the production of adenosine triphosphate (ATP). These
vital organelles, also play a major role in other metabolic and cell signalling pathways
including amino acid breakdown, apoptosis, ketogenesis and steroidogenesis190.
As mitochondria are highly dynamic, the morphology of these organelles is also quite variable
and dependent on cell type. While fibroblast mitochondria are characterized to be
predominantly filamentous, hepatocyte mitochondria are more fragmented and oval in
shape191–193. The structural components of the mitochondria consist of a double lipid bilayer
(an outer and inner mitochondrial membrane), the matrix (space that is encapsulated by the
inner membrane and holds both metabolic enzymes and mitochondrial DNA), intermembrane
space (region between the inner and outer membranes) and cristae (folds produced by the inner
membrane)194.
The outer and inner membranes of the mitochondria are key in regulating the entry of
molecules. Specifically, while the outer membrane is more porous and allows diffusion of
molecules as large as 5 kDa into the intermembrane space via an integral membrane protein
called porin, the highly selectively impermeable inner membrane only allows the transport of
proteins through the translocase of the inner membrane (TIM)194.
The mitochondrial inner membrane contains enzymes that are responsible for translocating
free fatty acids into the matrix, for fatty acid break down and energy transduction via β-
oxidation and the Krebs’ cycle/tricarboxylic acid (TCA) cycle194. These are processes that
Page 44
26
occur within the matrix, resulting in the final production of ATP through oxidative
phosphorylation on the inner membrane194. Section 1.6.4.2 will focus on describing the various
mitochondrial pathways that play a role in fatty acid break down and energy production, as
well as the effects of obesity on these pathways.
Mitochondria are commonly characterized as dynamic organelles that constantly undergo
fusion and fission, processes that contribute towards mitochondrial structure and function
maintenance195. While the inner membrane is highly responsible for the various mitochondrial
metabolic processes, it is also embedded with proteins responsible for mitochondrial dynamics
such as DRP1, Mfn1/2 and Opa1196. Fusion, the merging of mitochondrial structures, allow
the mixing of mitochondrial contents and DNA via cross-complementation, mitigating the
effects of environmental and genetic stressors that cause mitochondrial damage196. Thus, a
partially damaged mitochondrion can be rescued by fusing to one that is healthy and intact.
Mammalian fusion proteins responsible for fusing the outer membranes are the membrane-
anchored dynamin family members Mfn1 and 2, while inner membrane fusion is regulated by
the single dynamin mammalian family member called Opa1197,198. While fission, the division
or splitting of mitochondria is a process that allows to produce new mitochondria, it also
commonly functions as a facilitator of apoptosis and the removal of damaged
mitochondria196,199. Fission is mediated by the mammalian cytosolic protein dynamic family
member (DRP1)198.
Research studying the effects of obesity on mitochondrial dynamics have illustrated reduction
in Mfn2 expression and mitochondrial size in Zucker rats suffering from obesity and insulin
resistance200. The reduction in Mfn2 levels, specifically within skeletal muscle of obese
Zucker rats, was paralleled by a reduction in mitochondrial network.201 Human studies on
Page 45
27
patients with obesity also displayed reduced expression levels of Mfn2200. In contrast, the
levels of proteins responsible for fission were shown to be elevated within the skeletal muscle
of genetically and diet-induced obese mice202. An association has also been observed between
increased fission levels and mitochondrial dysfunction within liver and skeletal muscle in mice
diet-induced obesity203. Thus, levels of fission and fusion proteins, have been shown to be
dysregulated by obesity, resulting in mitochondrial dynamic and metabolic dysfunction.
1.6.4 Cellular Metabolism and Obesity
Fatty acid metabolism is characterized by the combination of catabolic and anabolic processes
that allow for the breaking down and storage of fatty acids, respectively. Fatty acids,
chemically defined as a carboxylic acid with a long unsaturated or saturated aliphatic chain,
are an important source of fuel for the human body. Processing fatty acids at the cellular level
requires the conversion of fatty acids into esterified fatty acyl-CoA molecules via enzymes
known as acyl-CoA synthetases (ACS)204. Following esterification, the fatty acyl-CoA
molecules can be shuttled with the assistance of other metabolic proteins into the endoplasmic
reticulum, where they can play a role in lipid biosynthesis, or to the mitochondria, for fatty
acid break down and energy production via β -oxidation, Krebs’ cycle and electron transport
chain (ETC)204. Energy can also be produced through glycolysis, the breaking down of
glucose, to produce the necessary metabolites for energy production through the TCA cycle
and ETC, via aerobic respiration204. The following section will focus on explaining the
different metabolic processes responsible for energy production, as well as how these
pathways and associated-proteins are modified with obesity.
Page 46
28
1.6.4.1 Acyl-CoA Synthetases and Obesity
Acyl-CoA Synthetases (ACS) are enzymes known to esterify intracellular free fatty acids into
fatty acyl-CoA molecules. This process consists of two key steps where an acyl-AMP
intermediate is generated from ATP, followed by AMP being replaced with CoA to produce
the activated fatty acyl-CoA form121. While the functional role of ACS enzymes is consistent,
their substrate preference based on length of fatty acid carbon chains varies. Specifically,
ACS can be separated into five sub-families based on their fatty acid chain length preference:
short chain (ACSS) prefer C2-C4; medium chain (ACSM) prefer C4-C12; long chain (ACSL),
which shall be the focus of this thesis prefer C12-C20; bubblegum (ACSBG) prefer C14-C24
and very long-chain also known as solute carrier family 27a (SLC27a) prefer C18-C26121. It
is important to note that while sub-families prefer a particular fatty acid chain length, this does
not prevent ACS enzymes from recognizing and reacting to other fatty acids that are not within
their preferred range. Specifically, ACSL6 has been shown to also metabolise very-long fatty
acids such as Docosahexaenoic acid (DHA)205. The following section will focus on the acyl-
CoA synthetase long chain proteins (ACSLs).
ACSL proteins consists of five different members that differ by their substrate specificity,
tissue and cellular localization: 1, 3, 4, 5 and 6 117,204–223,224,225. The cDNA of ACSL2 and
ACSL1 were determined to be the same sequence121. However, based on alternative splicing,
each ACSL can also generate different spliced transcript variants that have differential cellular
and tissue localization, thus contributing towards various metabolic processes. Specifically,
while ACSL 3, 4, 5 and 6 mRNAs have been shown to produce long and short protein isoforms
from upstream and downstream AUG start codons respectively, ACSL1 and ACSL6 also
produce protein isoforms with different Gate-domains121,226–232.The presence of two isoforms
Page 47
29
has been reported for ACSL3 in rodent, ACSL5 in humans and ACSL4/6 in human and
rodent121. Previous in silico analysis has also illustrated the possibility of varying subcellular
localization for the different isoforms of the same ACSL protein121.
ACSL proteins have been shown to have varying tissue distribution. Specifically, research
conducted on studying ACSL mRNA levels observed the highest expression of rodent ACSL1
in liver, heart and adipose tissue, ACSL3 in brain and testis, ACSL4 in adrenal glands and
liver, ACSL5 in brown adipose tissue, liver and duodenal mucosa and ACSL6 within brain,
testis and gastrocnemius muscle233. Human ACSL5, which is the key protein of interest for
this Ph.D. thesis has also been shown to be one of the ACSLs expressed in brain, kidney and
skeletal muscle234.
Subcellular localization studies on ACSL proteins have shown varying cellular distribution of
the enzymes, thus affecting their functional roles as well. ACSL1 and 5 have been shown to
be present in the nucleus, on the endoplasmic reticulum, mitochondria and as well as the
mitochondria-associated membrane (MAM), a region of the endoplasmic reticulum that links
to the mitochondria, contributing towards processes such as lipid transport121,207,210–214,235.
ACSL6 has been shown to be present on the mitochondrial membrane as well121,212–214.
ACSL3 and ACSL4 have been shown to be present within lipid droplets, while ACSL4 is also
present on the endoplasmic reticulum and MAM121,206,208,210.
Rodent studies conducted on studying the functional roles of the different ACSL proteins have
illustrated an upregulation of ACSL 1 and 4 mRNA following fasting and a reduction
following refeeding of rats, while ACSL3 and 5 appeared to be reduced following fasting and
increased after refeeding233. However, it is important to note that when the same studies
focused on ACSL1 and 4 protein expression levels, the opposite effects were noticed, thus
Page 48
30
illustrating that the differences between mRNA and protein expression may be a result of
altered translational or post translational regulation of the ACSLs233. Furthermore, similar
rodent studies conducted on isolated mitochondria from rats fasted for 48 hours illustrated an
increase in ACSL5 protein levels and a reduction in ACSL4 protein levels, validating the
possibility of translational and post-translational modifications of ACSL proteins210. The
remainder of this section will focus on the ACSL5 protein, the key protein of interest in this
Ph.D. thesis. Furthermore, previous research conducted on ACSL5 function and association
with obesity and other diseases, in both humans and rodents will be discussed as well.
1.6.4.1.1 ACSL5 and Obesity
Alternative splicing of the human ACSL5’s encoding exons results in three transcript variants,
which has been shown to generate two major protein isoforms121. Specifically, the upstream
in-frame AUG-encoding exon produces a 739 aa long protein, while the downstream AUG
produces a 683 aa short protein121. The production of an uncommon human isoform of 659 aa
(ACSL5Δ20) has also been reported and may contribute towards the regulation of TRAIL-
induced apoptosis236. Specifically, an increase in ACSL5/ACSL5Δ20 at the crypt-villus axis
has been shown to result is death ligand TRAIL sensitization236. However, while human
ACSL5 has multiple protein isoforms, rodent ACSL5 only produces a single protein of 683aa,
81% identical to the human short protein isoform121.
Studies focused on understanding the functional role of ACSL5 and its association with
obesity have generated controversial evidence. Specifically, rodent ACSL5 overexpression
studies conducted in McArdle-RH7777 liver cell line have illustrated the proteins subcellular
colocalization to be within mitochondria and endoplasmic reticulum237. Furthermore,
incubating these cells with 1-14C oleic acid resulted in a 30% greater rate of fatty acid uptake
Page 49
31
in comparison to control cells237. Studies conducted on knockout mice models of ACSL5 (-/-
) have illustrated not only a reduction in fat mass and adipose fat pad weights, but also an
increase in energy expenditure and delayed fat absorption238. However, studies focused on
studying mitochondrial ACSL5 protein expression have illustrated that it is increased
following a 48 hour fast in rats210. It is important to note that such discrepancies may be a
result of different experimental models (organelle studies vs cell culture and whole-body),
while compensation by other ACSLs (increase in ACSL4 mRNA observed by Bowman et al.
2016) in rodent ACSL5 KO models may contribute to the in vivo observations. Regardless,
while the functional role of rodent ACSL5 has been studied extensively, the separate
functional roles of the two major human ACSL5 protein isoforms remains to be elucidated.
Previous research conducted in our lab focused on studying the genetic effects of an ACSL5
SNP, rs2419621, and the ability to lose weight, illustrated an association between the rare T
allele with an increase in the rate of weight loss in women with obesity122. Rs2419621,
characterised by a cytosine (C) to thymine (T) transition in the promoter region of the ACSL5
gene, is located 12 nucleotides upstream of the second AUG transcription start site. Our lab
has also previously shown that the presence of the T allele results in the generation of an
additional cis-regulatory Ebox (CANNTG) site at the promoter region, increasing MyoD
recruitment to the promoter, and thus increasing the expression of the downstream gene in
vitro123. Furthermore, skeletal muscle biopsies taken from women with obesity and who
underwent a caloric restriction, illustrated a significant association between the presence of
the rs2419621 [T] allele and increased ACSL5 mRNA levels122. A section of the following
thesis will focus on further establishing the genetic implications of carrying the rs2419621 T
Page 50
32
allele on whole-body fat deposition, fatty acid oxidation and the in vitro and ex vivo effects of
the polymorphism on fatty acid metabolism.
While ACSL5 has been shown to contribute towards fatty acid metabolism and obesity, a
surplus of research has been conducted on the effects of ACSL5 expression on cancer
progression and vice versa. Studies conducted on human glioblastoma cell lines, have
illustrated an overproduction of ACSL5 mRNA in comparison to normal brain cells, while
adenoviral introduction of ACSL5 human cDNA into glioma cell lines, also resulted in an
increase in cell growth in the presence of palmitate234. Research conducted on human
colorectal cancer tissues illustrated contradictory results where studies have illustrated both a
decrease and increase in ACSL5 mRNA within cancerous tissue239,240. Furthermore, studies
conducted on the human small intestine to study adenocarcinomas, adenomas of the small
intestine and Crohn’s disease illustrated a reduction in ACSL5 mRNA within these conditions
in comparison to control samples241–243. Thus, while discrepancies in ACSL5 mRNA
expression and regulation do exist when observing different cancerous tissues, research does
imply the importance of ACSL5 regulation in both obesity and cancer. Furthermore, while
studies continue to observe the effects of human ACSL5 protein on metabolism, the separate
metabolic functional roles of the two common human isoforms remains to be elucidated.
1.6.4.2 Fatty Acid and Glucose Oxidation/Mitochondrial Bioenergetics
Following the esterification of free fatty acids, the fatty acyl CoA molecules are transported
into the mitochondria via carnitine palmitoyl transferase 1 and 2 (CPT1 and CPT2
respectively)204. Following entry into the mitochondrial matrix, fatty acyl-CoA molecules are
broken down through the β-oxidation pathway, a catabolic process that produces acetyl-CoA
metabolites for the downstream TCA cycle, as well as reducing agents NADH and FADH2 for
Page 51
33
the ETC204. β-oxidation, characterized by the oxidation of the beta carbon of the fatty acyl-
CoA molecule, consists of four key enzymes: acyl-CoA dehydrogenase, enoyl-CoA hydratase,
L-3-hydroxyacyl-CoA dehydrogenase and thiolase204.
Acetyl-CoA undergoes further breakdown through the TCA cycle to produce carbon dioxide
and additional reducing agents for the final step of energy production via the ETC204.
Specifically, isocitrate to α-ketoglutarate production produces carbon dioxide as well as
NADH204. NADH is also produced during conversions of α-ketoglutarate to succinyl-CoA and
malate to oxaloacetate, while FADH2 is produced during the conversion of succinate to
fumarate204.
Fatty acid oxidation results in the production of both acid soluble products (ASP) and carbon
dioxide, indicative of incomplete and complete fatty acid oxidation respectively244,245. ASP,
are intermediate metabolites produced during both β oxidation as well as TCA cycle, that are
not completely metabolized to produced carbon dioxide244,245.
While acetyl-CoA can be provided through fatty acid breakdown, glycolysis, the catabolic
process resulting in glucose breakdown, also produces acetyl-CoA via pyruvate metabolism.
Specifically, glycolysis, results in the production of pyruvate and two molecules of ATP, while
also producing reducing agents for the electron transport chain204. Pyruvate, the final product
of glycolysis can undergo either aerobic respiration via TCA cycle or anaerobic respiration,
when there isn’t sufficient oxygen for aerobic respiration to occur204.
The ETC, the site of oxidative phosphorylation which is found on the mitochondrial inner
membrane, consists of four key protein complexes (Complex I-IV) responsible for transferring
electrons from electron donors to electron acceptors204. While participating in these series of
Page 52
34
redox reactions (coupled reduction and oxidation reactions), oxygen is also consumed during
this process. Reducing agents formed through β oxidation, TCA cycle and glycolysis, drive
the following reactions204. The energy produced from the electron transfer, provides the
complexes adequate energy to pump protons across the inner membrane into the
intermembrane space, contributing towards the formation of an electrochemical proton
gradient204. This proton gradient drives the synthesis of ATP by shuttling back protons into
the matrix via the ATP synthase (Complex V)204. This chemical energy moiety ATP, is created
through combining adenosine diphosphate and a phosphate molecule to produce a high-energy
bond246. The complete oxidation of palmitate has been shown to produce a maximum of 106
ATP molecules204.
While protons can be shuttled into the matrix through the ATP synthase, uncoupling proteins
(UCP1-5), have been shown to contribute towards proton leak, defined as the travelling of
protons through the membrane into the matrix, independent of ATP synthase246. Energy in this
process, is released as heat. In human skeletal muscle, UCP3 has been shown to contribute
towards proton leak, while being predominantly expressed in this tissue247,248. Furthermore,
proton leak has been shown to contribute towards roughly 50% of basal respiration within
resting skeletal muscle tissue; the rate is much lower in contracting muscle249.
Reactive oxygen species (ROS), are formed during oxidative phosphorylation in the ETC,
where incomplete reduction of oxygen produces superoxide radicals, known to be the
precursor molecule to ROS. Specifically, ROS formation via complex I and III, is in part due
to the lack of protons present for the efficient reduction of oxygen to water molecules,
increasing the formation of superoxide radicals. Excess ROS has been shown to contribute
towards oxidative damage and can be regulated by uncoupling proteins via increased proton
Page 53
35
leak250,251. Recent research conducted in studying the concept of supercomplex formation have
illustrated its role in regulating ROS production252. A concept initially proposed in 1955, the
formation of groups of ETC complexes on the mitochondrial inner membrane, involving
complexes I, III and IV have been shown to play a role in increasing oxygen consumption,
electron flux and consequently mitochondrial respiration, by reducing the distance that
electrons are carried across complexes253–256.
1.6.5 Skeletal Muscle, Fatty Acid Metabolism and Obesity
Skeletal muscle is one of the primary tissues to utilize free fatty acids as a source of energy.
Studies have shown that subjects with obesity have decreased fatty acid oxidation resulting in
increased accumulation of intra-myocellular lipids within skeletal muscle257. Furthermore,
studies conducted on the effects of overfeeding rats with increased fat and sucrose within their
diet, illustrated a reduction in muscle mitochondrial oxidative phosphorylation activity258,259.
Additional observations regarding a decrease in ETC protein expression in skeletal muscle,
have been also associated with obesity260. Specifically, individuals with obesity presented
reduced levels of cytochrome C oxidase (COX), citrate synthase (CS) and CPT1 in comparison
to lean subjects260. Conversely, research findings on humans with obesity who underwent an
exercise training have illustrated an increase in CPT1 expression and activity, which could
result in the improved muscle mitochondrial fatty acid oxidation levels that has been
observed261,262.
However, while increase in fatty acid oxidation may increase fatty acid breakdown and reduce
lipid accumulation, excessive fatty acid oxidation without the upregulation of TCA cycle and
ETC, could also result in high rate of incomplete fatty acid oxidation and oxidative stress due
to mitochondrial overload, contributing towards insulin resistance263. Studies on mice and cell
Page 54
36
models illustrated how obesity-related insulin resistance during exposure to a high fat
diet/environment, resulted in an increased expression of genes related to fatty acid oxidation
as well as ASP, resulting in increased incomplete fatty acid oxidation and accumulation of
intermediary metabolites such as excessive acylcarnitines263.
While studies have shown a decrease in skeletal muscle mitochondrial number to be implicated
in insulin resistance, via IMCL accumulation due to reduced fatty acid oxidation, some rodent
high-fat studies have observed increased mitochondrial biogenesis via PPARδ, resulting in a
post-transcriptional increase of PGC-1α245,264–267,268. Interestingly, work conducted in our lab
have shown an impairment in rectus abdominis mitochondrial oxidative phosphorylation and
ETC supercomplex assembly within diabetic obese individuals269.
1.7 Research Objectives and Hypotheses
While treatment modalities for obesity include bariatric surgery, lifestyle modifications and
pharmacotherapy, a recently discovered treatment option is the concept of “personalized
medicine” in the context of obesity. Personalized treatment caters towards an individuals
genotype in order determine the appropriate treatment options available for an individual with
obesity270. This includes diet alteration and behavioral changes. However, while current
studies on personalized medicine focuses on genotype, there has been an increased necessity
to consider gene-environmental interactions because environment has been proven to play a
pivotal role in obesity. Thus, the overall goal of this Ph.D. thesis was to study the interactions
between environmental and genetic factors on the metabolic response in women with
overweight and obesity with a focus on skeletal muscle metabolism.
Page 55
37
This was achieved by the testing the following hypotheses:
General Hypothesis 1: The ACSL5 genotype plays a key role in response to diet and exercise
intervention in women with overweight and obesity by influencing fatty acid metabolism.
Objective # 1 (Genetic Association Study Approach): Test the association between ACSL5
rs2419621 genotype and response of women with obesity and overweight to lifestyle
interventions.
Objective #2: (Molecular Mechanistic Approach): Determine the cellular and molecular
mechanisms by which rs2419621 ACSL5 polymorphism exerts its effect on fatty acid
metabolism.
General Hypothesis 2: The MEHP toxicant plays a key role in the dysregulation of fatty acid
and glucose metabolism in vitro and in vivo.
Objective #3 (Environmental Association Study Approach): Test the association between
MEHP exposure and fatty acid utilization within women with obesity who participated in
observational studies.
Objective #4 (Molecular Mechanistic Approach): To determine the cellular and molecular
mechanisms by which MEHP exerts its effect in skeletal muscle.
Page 56
38
1.8 References
1. Merriam Webster. Disease | Definition of Disease by Merriam-Webster. 2017.
https://www.merriam-webster.com/dictionary/disease. Published 2017.
2. Rich P. CMA recognizes obesity as a disease. www.cma.ca/En/Pages/cmarecognizes-
obesity-as-a-disease.aspx2015. Published 2015. Accessed July 20, 2008.
3. American Medical Association House of Delegates. Recognition of obesity as a disease.
Resolution 420 (A-13). www.npr.org/documents/2013/%0Ajun/ama-resolution-
obesity.pdf. Published 2013. Accessed August 1, 2017.
4. James WP. WHO recognition of the global obesity epidemic. Int J Obes. 2008;32(suppl
7):S120-S126.
5. WHO. WHO | Obesity and overweight. World Heal Organ Media Cent Fact Sheet No
311. 2012:1-2.
http://www.who.int/mediacentre/factsheets/fs311/en/#.U2gDIH5zIZ4.mendeley.
6. Canadian Obesity Network. How is Obesity Measured?
http://www.obesitynetwork.ca/how-is-obesity-measured. Accessed August 1, 2017.
7. Hu F. Measurements of Adiposity and Body Composition. Obes Epidemiol.
2009;25(3):53-83. doi:10.1093/acprof.
8. Després JP. Intra-abdominal obesity: an untreated risk factor for Type 2 diabetes and
cardiovascular disease. J Endocrinol Investig. 2006;29(3 Suppl):77-82.
9. Collaborators TG 2015 O. Health Effects of Overweight and Obesity in 195 Countries
over 25 Years. N Engl J Med. 2017:NEJMoa1614362. doi:10.1056/NEJMoa1614362.
10. Statistics Canada. Body composition of adults, 2012 to 2013.
http://www.statcan.gc.ca/pub/82-625-x/2014001/article/14104-eng.htm. Published
2015. Accessed July 20, 2008.
11. Ogden CL, Carroll MD, Fryar CD F, KM. Prevalence of obesity among adults and
youth: United States, 2011–2014. NCHS data brief, no 219 Hyattsville, MD Natl Cent
Heal Stat. 2015.
12. Finkelstein EA, Trogdon JG, Cohen JW, Dietz W. Annual medical spending
attributable to obesity: Payer-and service-specific estimates. Health Aff. 2009;28(5).
doi:10.1377/hlthaff.28.5.w822.
13. Khaodhiar L, McCowen KC, Blackburn GL. Obesity and its comorbid conditions. Clin
Cornerstone. 1999;2(3):17-28. doi:10.1016/S1098-3597(99)90002-9.
14. Adams KF, Schatzkin A, Harris TB, et al. Overweight, Obesity, and Mortality in a
Large Prospective Cohort of Persons 50 to 71 Years Old. N Engl J Med.
2006;355(8):763-778. doi:10.1056/NEJMoa055643.
15. Global BMI Mortality Collaboration E Di, Bhupathiraju SN, Wormser D, et al. Body-
Page 57
39
mass index and all-cause mortality: individual-participant-data meta-analysis of 239
prospective studies in four continents. Lancet (London, England).
2016;388(10046):776-786. doi:10.1016/S0140-6736(16)30175-1.
16. Chan JM, Rimm EB, Colditz GA, Stampfer MJ, Willett WC. Obesity, fat distribution,
and weight gain as risk factors for clinical diabetes in men. Diabetes Care.
1994;17(9):961-969. doi:10.2337/diacare.17.9.961.
17. Colditz GA, Willett WC, Rotnitzky A, Manson JE. Weight gain as a risk factor for
clinical diabetes mellitus in women. Ann Intern Med. 1995;122(7):481-486.
doi:10.7326/0003-4819-122-7-199504010-00001.
18. Guh DP, Zhang W, Bansback N, Amarsi Z, Birmingham CL, Anis AH. The incidence
of co-morbidities related to obesity and overweight: A systematic review and meta-
analysis. BMC Public Health. 2009;9(1):88. doi:10.1186/1471-2458-9-88.
19. Klop B, Elte JWF, Cabezas MC. Dyslipidemia in Obesity: Mechanisms and Potential
Targets. Nutrients. 2013;5(4):1218-1240. doi:10.3390/nu5041218.
20. Manson JE, Colditz GA, Stampfer MJ, et al. A prospective study of obesity and risk of
coronary heart disease in women. N Engl J Med. 1990;322(13):882-889.
doi:10.1056/NEJM199003293221303.
21. Manson JE, Willett WC, Stampfer MJ, et al. Body weight and mortality among women.
N Engl J Med. 1995;333(11):677-685. doi:10.1056/NEJM199509143331101.
22. Willett WC, Manson JE, Stampfer MJ, et al. Weight, weight change, and coronary heart
disease in women. Risk within the “normal” weight range. JAMA. 1995;273(6):461-
465. doi:10.1001/jama.273.6.461.
23. Soulez B, Dewailly D RR. Polycystic ovary syndrome: a multidisciplinary challenge.
Endocrinologist. 1996;6:19-29.
24. Andersen T. Liver and gallbladder disease before and after very-low-calorie diets. In:
American Journal of Clinical Nutrition. Vol 56. ; 1992.
25. Felson DT. Weight and osteoarthritis. In: Journal of Rheumatology. Vol 22. ; 1995:7-
9. doi:10.16373/j.cnki.ahr.150049.
26. Partinen M. Epidemiology of obstructive sleep apnea syndrome. Curr Opin Pulm Med.
1995;1:482-487.
27. Garfinkel L. Overweight and cancer. Ann Intern Med. 1985;103(6 II):1034-1036.
doi:10.1097/00008469-199606000-00001.
28. Foster GD WT. The psychology of obesity, weight loss, and weight regain: research
and clinical findings. In: Obesity: Pathophysiology, Psychology and Treatment. New
York: NY Chapman & Hall; 1994:140-166.
29. Jeffery RW, Baxter J, McGuire M, Linde J. Are fast food restaurants an environmental
risk factor for obesity? Int J Behav Nutr Phys Act. 2006;3:2. doi:10.1186/1479-5868-3-
2.
Page 58
40
30. Jeffery RW, French SA. Epidemic obesity in the United States: Are fast foods and
television viewing contributing? Am J Public Health. 1998;88(2):277-280.
doi:10.2105/AJPH.88.2.277.
31. Pereira MA, Kartashov AI, Ebbeling CB, et al. Fast-food habits, weight gain, and
insulin resistance (the CARDIA study): 15-year prospective analysis. Lancet.
2005;365(9453):36-42. doi:10.1016/S0140-6736(04)17663-0.
32. Duffey KJ, Gordon-Larsen P, Jacobs DR, Williams OD, Popkin BM. Differential
associations of fast food and restaurant food consumption with 3-y change in body mass
index: the Coronary Artery Risk Development in Young Adults Study. Am J Clin Nutr.
2007;85(1):201-208. doi:85/1/201 [pii].
33. French S, Harnack L, Jeffery R. Fast food restaurant use among women in the Pound
of Prevention study: dietary, behavioral and demographic correlates. Int J Obes.
2000;24:1353-1359. doi:10.1038/sj.ijo.0801429.
34. Barker DJP. Mothers, babies and health in later life. Edimburg:church Livinstone.
1998:13-42.
35. Roseboom TJ, van der Meulen JHP, Ravelli ACJ, Osmond C, Barker DJP, Bleker OP.
Effects of prenatal expossure to the Ductch famine on adult disease in later life: an
overview. Mol Cell Endocrinol. 2001;185(5):93-98. doi:10.1016/S0303-
7207(01)00721-3.
36. Ravelli ACJ, Van Der Meulen JHP, Osmond C, Barker DJP, Bleker OP. Obesity at the
age of 50 y in men and women exposed to famine prenatally. Am J Clin Nutr.
1999;70(5):811-816. doi:10.1056/nejm197608122950701.
37. Beauchamp B, Ghosh S, Dysart MW, et al. Low birth weight is associated with
adiposity, impaired skeletal muscle energetics and weight loss resistance in mice. Int J
Obes (Lond). 2015;39(4):702-711. doi:10.1038/ijo.2014.120.
38. WHO. Double burden of malnutrition. WHO. www.who.int/nutrition/double-burden-
malnutrition/en/. Published 2016.
39. Guo F, Jen KLC. High-fat feeding during pregnancy and lactation affects offspring
metabolism in rats. Physiol Behav. 1995;57(4):681-686. doi:10.1016/0031-
9384(94)00342-4.
40. Wu Q, Mizushima Y, Komiya M, Matsuo T, Suzuki M. Body fat accumulation in the
male offspring of rats fed high-fat diet. J Clin Biochem Nutr. 1998;25(2):71-79.
41. Buckley AJ, Keserü B, Briody J, Thompson M, Ozanne SE, Thompson CH. Altered
body composition and metabolism in the male offspring of high fat-fed rats.
Metabolism. 2005;54(4):500-507. doi:10.1016/j.metabol.2004.11.003.
42. Khan IY. A high-fat diet during rat pregnancy or suckling induces cardiovascular
dysfunction in adult offspring. AJP Regul Integr Comp Physiol. 2004;288(1):R127-
R133. doi:10.1152/ajpregu.00354.2004.
43. Lewis CE, Smith DE, Wallace DD, Dale Williams O, Bild DE, Jacobs DR. Seven-year
Page 59
41
trends in body weight and associations with lifestyle and behavioral characteristics in
Black and White young adults: The CARDIA study. Am J Public Health.
1997;87(4):635-642. doi:10.2105/AJPH.87.4.635.
44. Tammelin T, Laitinen J, Näyhä S. Change in the level of physical activity from
adolescence into adulthood and obesity at the age of 31 years. Int J Obes Relat Metab
Disord. 2004;28(6):775-782. doi:10.1038/sj.ijo.0802622.
45. Kimm SY, Glynn NW, Obarzanek E, et al. Relation between the changes in physical
activity and body-mass index during adolescence: a multicentre longitudinal study.
Lancet. 2005;366(9482):301-307. doi:10.1016/S0140-6736(05)66837-7.
46. Dietz WH, Gortmaker SL. Do we fatten our children at the television set? Obesity and
television viewing in children and adolescents. Pediatrics. 1985;75(5):807-812.
47. Tucker LA, Friedman GM. Television viewing and obesity in adult males. Am J Public
Health. 1989;79(4):516-518. doi:10.2105/AJPH.79.4.516.
48. Dube N, Khan K, Loehr S, Chu Y VP. The use of entertainment and communication
technologies before sleep could affect sleep and weight status: a population-based study
among children. Int J Behav Nutr Phys Act. 2017;(14):97.
49. Chen X, Beydoun M, Wang Y. Is sleep duration associated with childhood obesity? A
systematic review and meta-analysis. Obesity (Silver Spring). 2008;16(2):265-274.
doi:10.1038/oby.2007.63.
50. Bartali B, Benvenuti E, Corsi AM, et al. Changes in anthropometric measures in men
and women across the life-span: findings from the InCHIANTI study. Soz
Praventivmed. 2002;47(5):336-348. doi:10.1007/PL00012644.
51. Rhazi K El, Nejjari C, Zidouh A, Bakkali R, Berraho M, Gateau PB. Prevalence of
obesity and associated sociodemographic and lifestyle factors in Morocco. Public
Health Nutr. 2010;14(1):160-167. doi:10.1017/S1368980010001825.
52. Sweeting HN. Gendered dimensions of obesity in childhood and adolescence. Nutr J.
2008;7:1. doi:10.1186/1475-2891-7-1.
53. Deurenberg P, Deurenberg-Yap M, Guricci S. Asians are different from Caucasians and
from each other in their body mass index/body fat per cent relationship. Obes Rev.
2002;3(3):141-146. doi:10.1046/j.1467-789X.2002.00065.x.
54. Misra A, Khurana L. The metabolic syndrome in South Asians: epidemiology,
determinants, and prevention. Metab Syndr Relat Disord. 2009;7(6):497-514.
doi:10.1089/met.2009.0024.
55. Misra A, Vikram NK. Insulin resistance syndrome (metabolic syndrome) and obesity
in Asian Indians: Evidence and implications. Nutrition. 2004;20(5):482-491.
doi:10.1016/j.nut.2004.01.020.
56. Flegal KM, Carroll MD, Kit BK, Ogden CL. Prevalence of obesity and trends in the
distribution of body mass index among US adults, 1999-2010. JAMA. 2012;307(5):491-
497. doi:10.1001/jama.2012.39.
Page 60
42
57. BROWN PJ, KONNER M. An Anthropological Perspective on Obesity. Ann N Y Acad
Sci. 1987;499(1):29-46. doi:10.1111/j.1749-6632.1987.tb36195.x.
58. Norgan NG. The beneficial effects of body fat and adipose tissue in humans. Int J Obes.
1997;21:738-746. doi:10.1038/sj.ijo.0800473.
59. Messer E. Small but healthy? Some cultural considerations . Hum Organiz. 1989;48:39
– 52.
60. Miller MN, Pumariega a J. Culture and eating disorders: a historical and cross-cultural
review. Psychiatry. 2001;64(2):93-110. doi:10.1521/psyc.64.2.93.18621.
61. Ricciardelli LA, McCabe MP. Children’s body image concerns and eating disturbance:
A review of the literature. Clin Psychol Rev. 2001;21(3):325-344. doi:10.1016/S0272-
7358(99)00051-3.
62. Faber M, Kruger HS. Dietary intake, perceptions regarding body weight, and attitudes
toward weight control of normal weight, overweight, and obese black females in a rural
village in South Africa. Ethn Dis. 2005;15(2):238-245.
63. Lobstein T, Baur L a, Uauy R. Obesity in children and young people: A crisis in public
health. Obes Rev. 2004;5 Suppl 1:4-85. doi:10.1111/j.1467-789X.2004.00133.x.
64. Wang YF. Cross-national comparison of childhood obesity: the epidemic and the
relationship between obesity and socioeconomic status. Int J Epidemiol.
2001;30(5):1129-1136. doi:10.1093/ije/30.5.1129.
65. Sobal J. Commentary: globalization and the epidemiology of obesity. Int J Epidemiol.
30(5):1136-1137.
66. Wang Y, Hollis-Hansen K, Ren X, Qiu Y, Qu W. Do environmental pollutants increase
obesity risk in humans? Obes Rev. 2016;17(12):1179-1197. doi:10.1111/obr.12463.
67. Grün F, Blumberg B. Environmental obesogens: Organotins and endocrine disruption
via nuclear receptor signaling. Endocrinology. 2006;147(6). doi:10.1210/en.2005-
1129.
68. Song Y, Hauser R, Hu FB, Franke AA, Liu S, Sun Q. Urinary concentrations of
bisphenol A and phthalate metabolites and weight change: a prospective investigation
in US women. Int J Obes. 2014;38(12):1532-1537. doi:10.1038/ijo.2014.63.
69. Wells EM, Jackson LW, Koontz MB. Association between bisphenol A and waist-to-
height ratio among children: National Health and Nutrition Examination Survey, 2003-
2010. Ann Epidemiol. 2014;24(2):165-167. doi:10.1016/j.annepidem.2013.06.002.
70. Carwile JL, Michels KB. Urinary bisphenol A and obesity: NHANES 2003-2006.
Environ Res. 2011;111(6):825-830. doi:10.1016/j.envres.2011.05.014.
71. Eng DS, Lee JM, Gebremariam A, Meeker JD, Peterson K, Padmanabhan V. Bisphenol
A and chronic disease risk factors in US children. Pediatrics. 2013;132(3):e637-45.
doi:10.1542/peds.2013-0106.
72. Centers for Disease Control and Prevention. Pthalates Fact Sheet.; 2009.
Page 61
43
73. Wilkes CE, Daniels CA, Summers JW, Krauskopf LG, Godwin A. PVC Handbook 5
Plasticizers. In: PVC Handbook. ; 2005:170.193. http://www.hanser.de/3-446-22714-
8%5Cnhttp://www.hanser.de/deckblatt/deckblatt1.asp?isbn=3-446-22714-
8&style=Vorwort%5Cnhttp://www.hanser.de/3-446-22714-
8%0Ahttp://www.hanser.de/deckblatt/deckblatt1.asp?isbn=3-446-22714-
8&style=Vorwort.
74. Lind PM, Roos V, Rönn M, et al. Serum concentrations of phthalate metabolites are
related to abdominal fat distribution two years later in elderly women. Environ Heal.
2012;11(1):21. doi:10.1186/1476-069X-11-21.
75. Teitelbaum SL, Mervish N, L. Moshier E, et al. Associations between phthalate
metabolite urinary concentrations and body size measures in New York City children.
Environ Res. 2012;112:186-193. doi:10.1016/j.envres.2011.12.006.
76. Environment Canada Health Canada. Canadian Environmental Protection Act- Bis-(2-
ethylhexyl) phthalate. https://www.canada.ca/en/health-
canada/services/environmental-workplace-health/reports-publications/environmental-
contaminants/canadian-environmental-protection-act-priority-substances-list-report-2-
ethylhexyl-pthalate.html#a5. Published 1994. Accessed July 10, 2017.
77. Koch, H. M., Preuss, R. and Angerer J. Di(2-ethylhexyl)phthalate (DEHP): human
metabolism and internal exposure – an update and latest results. Int J Androl.
2006;29:155–165.
78. Yan Xu, Thomas J. Cook GTK. Effects of Di-(2-Ethylhexyl)-Phthalate (DEHP) and Its
Metabolites on Fatty Acid Homeostasis Regulating Proteins in Rat Placental HRP-1
Trophoblast Cells. Toxicol Sci. 2005;84(2):287–300.
79. Kavlock, R., Boekelheide, K., Chapin, R., Cunningham, M., Faustman, E., Foster, P.,
Golub, M., Henderson, R., Hinberg, I., Little, R. et al. NTP Center for the Evaluation
of Risks to Human Reproduction: Phthalates expert panel report on the reproductive
and developmental toxicity of di(2-ethylhexyl) phthalate. Reprod Toxicol.
2002;16:529–653.
80. Yaghjyan L, Sites S, Ruan Y, Chang S-H. Associations of urinary phthalates with body
mass index, waist circumference and serum lipids among females: National Health and
Nutrition Examination Survey 1999-2004. Int J Obes (Lond). 2015;39(6):994-1000.
doi:10.1038/ijo.2015.8.
81. Buser MC, Murray HE, Scinicariello F. Age and sex differences in childhood and
adulthood obesity association with phthalates: Analyses of NHANES 2007-2010. Int J
Hyg Environ Health. 2014;217(6):687-694. doi:10.1016/j.ijheh.2014.02.005.
82. Stahlhut RW, van Wijngaarden E, Dye TD, Cook S, Swan SH. Concentrations of
urinary phthalate metabolites are associated with increased waist circumference and
insulin resistance in adult U.S. males. Environ Health Perspect. 2007;115(6):876-882.
doi:10.1289/ehp.9882.
83. Deierlein AL, Wolff MS, Pajak A, et al. Longitudinal Associations of Phthalate
Exposures During Childhood and Body Size Measurements in Young Girls.
Page 62
44
Epidemiology. 2016;27(4):492-499. doi:10.1097/EDE.0000000000000489.
84. Smerieri A, Testa C, Lazzeroni P, et al. Di-(2-ethylhexyl) phthalate metabolites in urine
show age-related changes and associations with adiposity and parameters of insulin
sensitivity in childhood. PLoS One. 2015;10(2). doi:10.1371/journal.pone.0117831.
85. Feige JN, Gelman L, Rossi D, et al. The endocrine disruptor monoethyl-hexyl-phthalate
is a selective peroxisome proliferator-activated receptor γ modulator that promotes
adipogenesis. J Biol Chem. 2007;282(26):19152-19166. doi:10.1074/jbc.M702724200.
86. Neish AS. Microbes in Gastrointestinal Health and Disease. Gastroenterology.
2009;136(1):65-80. doi:10.1053/j.gastro.2008.10.080.
87. Bäckhed F, Ding H, Wang T, et al. The gut microbiota as an environmental factor that
regulates fat storage. Proc Natl Acad Sci U S A. 2004;101(44):15718-15723.
doi:10.1073/pnas.0407076101.
88. Musso G, Gambino R, Cassader M. Obesity, diabetes, and gut microbiota: The hygiene
hypothesis expanded? Diabetes Care. 2010;33(10):2277-2284. doi:10.2337/dc10-
0556.
89. Turnbaugh PJ, Ley RE, Mahowald MA, Magrini V, Mardis ER, Gordon JI. An obesity-
associated gut microbiome with increased capacity for energy harvest. Nature.
2006;444(7122):1027-1131. doi:10.1038/nature05414.
90. Ley R, Turnbaugh P, Klein S, Gordon J. Microbial ecology: human gut microbes
associated with obesity. Nature. 2006;444(7122):1022-1023.
doi:10.1038/nature4441021a.
91. Schwiertz A, Taras D, Schäfer K, et al. Microbiota and SCFA in Lean and Overweight
Healthy Subjects. Obesity. 2010;18(1):190-195. doi:10.1038/oby.2009.167.
92. Collado MC, Isolauri E, Laitinen K, Salminen S. Distinct composition of gut microbiota
during pregnancy in overweight and normal-weight women. Am J Clin Nutr.
2008;88(4):894-899. doi:88/4/894 [pii].
93. Duncan SH, Lobley GE, Holtrop G, et al. Human colonic microbiota associated with
diet, obesity and weight loss. Int J Obes. 2008;32(11):1720-1724.
doi:10.1038/ijo.2008.155.
94. Luoto R, Kalliomäki M, Laitinen K, Isolauri E. The impact of perinatal probiotic
intervention on the development of overweight and obesity: follow-up study from birth
to 10 years. Int J Obes. 2010;34(10):1531-1537. doi:10.1038/ijo.2010.50.
95. Rob Knight. History of American Gut. http://americangut.org/about/. Accessed
December 5, 2017.
96. National Health Lung and Blood Institute. Explore Overweight and Obesity: Causes.
US Dep Heal Hum Serv. 2017. https://www.nhlbi.nih.gov/health/health-
topics/topics/obe/causes.
97. Sanyal D, Raychaudhuri M. Hypothyroidism and obesity: An intriguing link. Indian J
Page 63
45
Endocrinol Metab. 2016;20(4):554. doi:10.4103/2230-8210.183454.
98. Weaver J. Classical endocrine diseases causing obesity. Front Horm Res. 2007;36:212-
228. doi:10.1159/000115367.
99. Sam S. Obesity and Polycystic Ovarian Syndrome. Obes Manag. 2007;3(2):69-73.
doi:10.1089/obe.2007.0019.Obesity.
100. Iughetti L, Bruzzi P. Obesity and craniopharyngioma. Ital J Pediatr. 2011;37(1):38.
doi:10.1186/1824-7288-37-38.
101. Danforth E, Horton ES, O'Connell M, et al. Dietary-induced alterations in
thyroid hormone metabolism during overnutrition. J Clin Invest. 1979;64(5):1336-
1347. doi:10.1172/JCI109590.
102. Butler MG. Prader-Willi Syndrome: Obesity due to Genomic Imprinting. Curr
Genomics. 2011;12:204-215. doi:10.2174/138920211795677877.
103. Suspitsin EN, Imyanitov EN. Bardet-Biedl Syndrome. Mol Syndromol. 2016;7(2):62-
71. doi:10.1159/000445491.
104. Marshall JD, Maffei P, Collin GB, Naggert JK. Alström syndrome: genetics and clinical
overview. Curr Genomics. 2011;12(3):225-235. doi:10.2174/138920211795677912.
105. Budisteanu M, Barca D, Chirieac SM, Magureanu S. Cohen syndrome - a rare genetic
cause of hypotonia in children. Mædica. 2010;5(1):56-61.
http://www.ncbi.nlm.nih.gov/pubmed/21977120%5Cnhttp://www.pubmedcentral.nih.
gov/articlerender.fcgi?artid=PMC3150073.
106. Yang W, Kelly T, He J. Genetic epidemiology of obesity. Epidemiol Rev.
2007;29(1):49-61. doi:10.1093/epirev/mxm004.
107. Platte P, Papanicolaou GJ, Johnston J, et al. A study of linkage and association of body
mass index in the Old Order Amish. Am J Med Genet C Semin Med Genet.
2003;121C(1):71-80. doi:10.1002/ajmg.c.20005.
108. Adeyemo A, Luke A, Cooper R, et al. A genome-wide scan for body mass index among
Nigerian families. Obes Res. 2003;11(2):266-273. doi:10.1038/oby.2003.40.
109. McQueen MB, Bertram L, Rimm EB, Blacker D, Santangelo SL. A QTL genome scan
of the metabolic syndrome and its component traits. BMC Genet. 2003;4 Suppl 1:S96.
doi:10.1186/1471-2156-4-S1-S96.
110. Allison DB, Kaprio J, Korkeila M, Koskenvuo M, Neale MC, Hayakawa K. The
heritability of body mass index among an international sample of monozygotic twins
reared apart. Int J Obes Relat Metab Disord. 1996;20(6):501-506.
111. Pietiläinen KH, Kaprio J, Rissanen a, et al. Distribution and heritability of BMI in
Finnish adolescents aged 16y and 17y: a study of 4884 twins and 2509 singletons. Int J
Obes Relat Metab Disord. 1999;23(2):107-115. doi:10.1038/sj.ijo.0800767.
112. Wu DM, Hong Y, Sun CA, Sung PK, Rao DC, Chu NF. Familial resemblance of
adiposity-related parameters: Results from a health check-up population in Taiwan. Eur
Page 64
46
J Epidemiol. 2003;18(3):221-226. doi:10.1023/A:1023337917377.
113. Schousboe K, Visscher PM, Erbas B, et al. Twin study of genetic and environmental
influences on adult body size, shape, and composition. Int J Obes. 2003;28(1):39-48.
doi:10.1038/sj.ijo.0802524.
114. Rice T, Daw EW, Gagnon J, et al. Familial resemblance for body composition
measures: the HERITAGE Family Study. Obes Res. 1997;5(6):557-562.
http://www.ncbi.nlm.nih.gov/entrez/query.fcgi?cmd=Retrieve&db=PubMed&dopt=Ci
tation&list_uids=9449140.
115. Luke A, Guo X, Adeyemo AA, et al. Heritability of obesity-related traits among
Nigerians, Jamaicans and US black people. Int J Obes. 2001;25(7):1034-1041.
doi:10.1038/sj.ijo.0801650.
116. Rankinen T, Zuberi A, Chagnon YC, et al. The Human Obesity Gene Map: The 2005
Update. Obesity. 2006;14(4):529-644. doi:10.1038/oby.2006.71.
117. Glossary: SNP. Scitable nature education.
https://www.nature.com/scitable/definition/single-nucleotide-polymorphism-snp-295.
Published 2014.
118. Genetics home reference. What are genome-wide association studies? U.S National
Library of Medicine. https://ghr.nlm.nih.gov/primer/genomicresearch/gwastudies.
Accessed December 5, 2017.
119. Gallicchio L, Chang HH, Christo DK, et al. Single nucleotide polymorphisms in
obesity-related genes and all-cause and cause-specific mortality: a prospective cohort
study. BMC Med Genet. 2009;10:103. doi:10.1186/1471-2350-10-103.
120. Spiegelman BM, Flier JS. Adipogenesis and obesity: Rounding out the big picture. Cell.
1996;87(3):377-389. doi:10.1016/S0092-8674(00)81359-8.
121. Soupene E, Kuypers FA. Mammalian Long-Chain Acyl-CoA Synthetases. Exp Biol
Med. 2008;233(5):507-521. doi:10.3181/0710-MR-287.
122. Adamo KB, Dent R, Langefeld CD, et al. Peroxisome proliferator-activated receptor
gamma 2 and acyl-CoA synthetase 5 polymorphisms influence diet response. Obesity
(Silver Spring). 2007;15(5):1068-1075. doi:10.1038/oby.2007.630.
123. Teng ACT, Adamo K, Tesson F, Stewart AFR. Functional characterization of a
promoter polymorphism that drives ACSL5 gene expression in skeletal muscle and
associates with diet-induced weight loss. FASEB J. 2009;23(6):1705-1709.
doi:10.1096/fj.08-120998.
124. Bird A. Perceptions of epigenetics. Nature. 2007;447(7143):396-398.
doi:10.1038/nature05913.
125. Reik W, Walter J. Imprinting mechanisms in mammals. Curr Opin Genet Dev.
1998;8(2):154-164. doi:10.1016/S0959-437X(98)80136-6.
126. Herrera BM, Keildson S, Lindgren CM. Genetics and epigenetics of obesity. Maturitas.
Page 65
47
2011;69(1):41-49. doi:10.1016/j.maturitas.2011.02.018.
127. Janesick AS, Shioda T, Blumberg B. Transgenerational inheritance of prenatal
obesogen exposure. Mol Cell Endocrinol. 2014;398(1-2):31-35.
doi:10.1016/j.mce.2014.09.002.
128. Sebire N, Jolly M, Harris J, et al. Maternal Obesity and Pregnancy Outcome: A study
of 287,213 pregnancies in London. Int J Obes. 2001;25:1175-1182.
doi:10.1038/sj.ijo.0801670.
129. Dominguez-Salas P, Moore SE, Baker MS, et al. Maternal nutrition at conception
modulates DNA methylation of human metastable epialleles. Nat Commun. 2014;5.
doi:10.1038/ncomms4746.
130. Morales E, Groom A, Lawlor DA, Relton CL. DNA methylation signatures in cord
blood associated with maternal gestational weight gain: results from the ALSPAC
cohort. BMC Res Notes. 2014;7(1):278. doi:10.1186/1756-0500-7-278.
131. Liu X, Chen Q, Tsai HJ, et al. Maternal preconception body mass index and offspring
cord blood DNA methylation: Exploration of early life origins of disease. Environ Mol
Mutagen. 2014;55(3):223-230. doi:10.1002/em.21827.
132. Smith J, Cianflone K, Biron S, et al. Effects of maternal surgical weight loss in mothers
on intergenerational transmission of obesity. J Clin Endocrinol Metab.
2009;94(11):4275-4283. doi:10.1210/jc.2009-0709.
133. Guenard F, Deshaies Y, Cianflone K, Kral JG, Marceau P, Vohl M-C. Differential
methylation in glucoregulatory genes of offspring born before vs. after maternal
gastrointestinal bypass surgery. Proc Natl Acad Sci. 2013;110(28):11439-11444.
doi:10.1073/pnas.1216959110.
134. Gallou-Kabani C, Junien C. Nutritional epigenomics of metabolic syndrome new
perspective against the epidemic. Diabetes. 2005;54(7):1899-1906.
doi:10.2337/diabetes.54.7.1899.
135. Ozanne SE, Constância M. Mechanisms of Disease: The developmental origins of
disease and the role of the epigenotype. Nat Clin Pract Endocrinol Metab.
2007;3(7):539-546. doi:10.1038/ncpendmet0531.
136. van Dijk SJ, Tellam RL, Morrison JL, Muhlhausler BS, Molloy PL. Recent
developments on the role of epigenetics in obesity and metabolic disease. Clin
Epigenetics. 2015;7(1):66. doi:10.1186/s13148-015-0101-5.
137. Widiker S, Karst S, Wagener a, Brockmann G a. High-fat diet leads to a decreased
methylation of the Mc4r gene in the obese BFMI and the lean B6 mouse lines. J Appl
Genet. 2010;51(2):193-197. doi:10.1007/BF03195727.
138. Jacobsen SC, Brøns C, Bork-Jensen J, et al. Effects of short-term high-fat overfeeding
on genome-wide DNA methylation in the skeletal muscle of healthy young men.
Diabetologia. 2012;55(12). doi:10.1007/s00125-012-2717-8.
139. Tremblay BL, Guénard F, Rudkowska I, Lemieux S, Couture P, Vohl M-C. Epigenetic
Page 66
48
changes in blood leukocytes following an omega-3 fatty acid supplementation. Clin
Epigenetics. 2017;9:43. doi:10.1186/s13148-017-0345-3.
140. Bouchard L, Rabasa-Lhoret R, Faraj M, et al. Differential epigenomic and
transcriptomic responses in subcutaneous adipose tissue between low and high
responders to caloric restriction. Am J Clin Nutr. 2010;91(2):309-320.
doi:10.3945/ajcn.2009.28085.
141. Rowlands DS, Page RA, Sukala WR, et al. Multi-omic integrated networks connect
DNA methylation and miRNA with skeletal muscle plasticity to chronic exercise in
Type 2 diabetic obesity. Physiol Genomics. 2014;46(20):747-765.
doi:10.1152/physiolgenomics.00024.2014.
142. Bernal AJ, Jirtle RL, Grandjean P, et al. Epigenomic disruption: The effects of early
developmental exposures. Birth Defects Res Part A Clin Mol Teratol. 2010;88(10):938-
944. doi:10.1002/bdra.20685.
143. Kamstra JH, Sales LB, Aleström P, Legler J. Differential DNA methylation at
conserved non-genic elements and evidence for transgenerational inheritance following
developmental exposure to mono(2-ethylhexyl) phthalate and 5-azacytidine in
zebrafish. Epigenetics Chromatin. 2017;10(1):20. doi:10.1186/s13072-017-0126-4.
144. National Heart Lung and Blood Institute, National Institutes of Health (NIH) National
Heart, Lung, and Blood Institute N. Clinical Guidelines on the Identification,
Evaluation, and Treatment of Overweight and Obesity in Adults. The Evidence Report,
NIH Publication No. 98-4083. Vol 158.; 1998. doi:10.1001/jama.2012.39.
145. Executive Summary: Guidelines (2013) for the Management of Overweight and
Obesity in Adults. Obes Soc Am Coll Cardiol Hear Assoc Task Force Pract Guidel.
2014;22(2).
146. Schröder H. Protective mechanisms of the Mediterranean diet in obesity and type 2
diabetes. J Nutr Biochem. 2007;18(3):149-160. doi:10.1016/j.jnutbio.2006.05.006.
147. Schröder H, Marrugat J, Vila J, Covas MI, Elosua R. Adherence to the traditional
mediterranean diet is inversely associated with body mass index and obesity in a spanish
population. J Nutr. 2004;134(12):3355-3361. doi:134/12/3355 [pii].
148. Shaw K, Gennat H, O’Rourke P, Del Mar C. Exercise for overweight or obesity.
Cochrane Database Syst Rev. 2006;(4). doi:10.1002/14651858.CD003817.pub3.
149. Miller WC, Koceja DM, Hamilton EJ. A meta-analysis of the past 25 years of weight
loss research using diet, exercise or diet plus exercise intervention. Int J Obes.
1997;21(10):941-947. doi:10.1038/sj.ijo.0800499.
150. Douketis JD, Macie C, Thabane L, Williamson DF. Systematic review of long-term
weight loss studies in obese adults: clinical significance and applicability to clinical
practice. Int J Obes (Lond). 2005;29(10):1153-1167. doi:10.1038/sj.ijo.0802982.
151. Gadde KM, Pritham Raj Y. Pharmacotherapy of Obesity: Clinical Trials to Clinical
Practice. Curr Diab Rep. 2017;17(5). doi:10.1007/s11892-017-0859-2.
Page 67
49
152. Khera R, Murad MH, Chandar AK, et al. Association of Pharmacological Treatments
for Obesity With Weight Loss and Adverse Events A Systematic Review and Meta-
analysis. JAMA. 2016;315(22):2424-2434. doi:10.1001/jama.2016.7602.
153. Padwal R, Kezouh a, Levine M, Etminan M. Long-term persistence with orlistat and
sibutramine in a population-based cohort. Int J Obes (Lond). 2007;31(10):1567-1570.
doi:10.1038/sj.ijo.0803631.
154. Sisley S, Gutierrez-Aguilar R, Scott M, D’Alessio DA, Sandoval DA, Seeley RJ.
Neuronal GLP1R mediates liraglutide’s anorectic but not glucose-lowering effect. J
Clin Invest. 2014;124(6):2456-2463. doi:10.1172/JCI72434.
155. Flint a, Raben a, Ersbøll a K, Holst JJ, Astrup a. The effect of physiological levels of
glucagon-like peptide-1 on appetite, gastric emptying, energy and substrate metabolism
in obesity. Int J Obes Relat Metab Disord. 2001;25(6):781-792.
doi:10.1038/sj.ijo.0801627.
156. Pi-Sunyer X, Astrup A, Fujioka K, et al. A Randomized, Controlled Trial of 3.0 mg of
Liraglutide in Weight Management. N Engl J Med. 2015;373(1):11-22.
doi:10.1056/NEJMoa1411892.
157. Wadden TA, Hollander P, Klein S, et al. Weight maintenance and additional weight
loss with liraglutide after low-calorie-diet-induced weight loss: The SCALE
Maintenance randomized study. Int J Obes. 2013;37(11):1443-1451.
doi:10.1038/ijo.2013.120.
158. Bariatric Surgery Procedures. American Society for Metabolic and Bariatric Surgery.
https://asmbs.org/patients/bariatric-surgery-procedures.
159. Arterburn DE, Courcoulas AP. Bariatric surgery for obesity and metabolic conditions
in adults. BMJ. 2014;349:g3961. doi:10.1136/bmj.g3961.
160. Buchwald H, Oien DM. Metabolic/bariatric surgery worldwide 2011. Obes Surg.
2013;23(4):427-436. doi:10.1007/s11695-012-0864-0.
161. Gloy VL, Briel M, Bhatt DL, et al. Bariatric surgery versus non-surgical treatment for
obesity: a systematic review and meta-analysis of randomised controlled trials. Bmj.
2013;347(October):f5934. doi:10.1136/bmj.f5934.
162. Ikramuddin S, Korner J, Lee W-J, et al. Roux-en-Y gastric bypass vs intensive medical
management for the control of type 2 diabetes, hypertension, and hyperlipidemia: the
Diabetes Surgery Study randomized clinical trial. JAMA. 2013;309(21):2240-2249.
doi:10.1001/jama.2013.5835.
163. Mingrone G, Panunzi S, De Gaetano A, et al. Bariatric Surgery versus Conventional
Medical Therapy for Type 2 Diabetes. N Engl J Med. 2012;366(17):1577-1585.
doi:10.1056/NEJMoa1200111.
164. Schauer PR, Kashyap SR, Wolski K, et al. Bariatric surgery versus intensive medical
therapy in obese patients with diabetes. N Engl J Med. 2012;366(17):1567-1576.
doi:10.1056/NEJMoa1200225.
Page 68
50
165. Dixon JB, O’Brien PE, Playfair J, et al. Adjustable gastric banding and conventional
therapy for type 2 diabetes: a randomized controlled trial. JAMA. 2008;299(3):316-323.
doi:10.1001/jama.299.3.316.
166. O’Brien PE, Dixon JB, Laurie C, et al. Treatment of mild to moderate obesity with
laparoscopic adjustable gastric banding or an intensive medical program: A randomized
trial. Ann Intern Med. 2006;144(9):625-633.
doi:10.1097/01.AOG.0000227085.66888.6e.
167. Sjöström L, Gummesson A, Sjöström CD, et al. Effects of bariatric surgery on cancer
incidence in obese patients in Sweden (Swedish Obese Subjects Study): a prospective,
controlled intervention trial. Lancet Oncol. 2009;10(7):653-662. doi:10.1016/S1470-
2045(09)70159-7.
168. Sjöström L, Narbro K, Sjöström CD, et al. Effects of Bariatric Surgery on Mortality in
Swedish Obese Subjects. N Engl J Med. 2007;357(8):741-752.
doi:10.1056/NEJMoa066254.
169. Jammah A. Endocrine and metabolic complications after bariatric surgery. Saudi J
Gastroenterol. 2015;21(5):269. doi:10.4103/1319-3767.164183.
170. Frontera WR, Ochala J. Skeletal Muscle: A Brief Review of Structure and Function.
Calcif Tissue Int. 2015;96(3):183-195. doi:10.1007/s00223-014-9915-y.
171. Wolfe RR. The underappreciated role of muscle in health and disease. Am J Clin Nutr.
2006;84(3):475-482. doi:84/3/475 [pii].
172. Weisleder N, Brotto M, Komazaki S, et al. Muscle aging is associated with
compromised Ca2+ spark signaling and segregated intracellular Ca2+ release. J Cell
Biol. 2006;174(5):639-645. doi:10.1083/jcb.200604166.
173. Yan Z, Lira VA, Greene NP. Exercise training-induced regulation of mitochondrial
quality. Exerc Sport Sci Rev. 2012;40(3):159-164.
doi:10.1097/JES.0b013e3182575599.
174. Staron RS, Hagerman FC, Hikida RS, et al. Fiber Type Composition of the Vastus
Lateralis Muscle of Young Men and Women. J Histochem Cytochem. 2000;48(5):623–
629. doi:10.1177/002215540004800506.
175. Haggmark T, Thorstensson A. Fibre types in human abdominal muscles. Acta Physiol
Scand. 1979;107(4):319-325.
http://www.ncbi.nlm.nih.gov/entrez/query.fcgi?cmd=Retrieve&db=PubMed&dopt=Ci
tation&list_uids=161688.
176. Hickey MS, Carey JO, Azevedo JL, et al. Skeletal muscle fiber composition is related
to adiposity and in vitro glucose transport rate in humans. Am J Physiol. 1995;268(3 Pt
1):E453-E457.
177. Zurlo F, Larson K, Bogardus C, Ravussin E. Skeletal muscle metabolism is a major
determinant of resting energy expenditure. J Clin Invest. 1990;86(5):1423-1427.
doi:10.1172/JCI114857.
Page 69
51
178. Blimkie CJR, Sale DG, Bar-Or O. Voluntary strength, evoked twitch contractile
properties and motor unit activation of knee extensors in obese and non-obese
adolescent males. Eur J Appl Physiol Occup Physiol. 1990;61(3-4):313-318.
doi:10.1007/BF00357619.
179. Hulens M, Vansant G, Lysens R, Claessens a L, Muls E, Brumagne S. Study of
differences in peripheral muscle strength of lean versus obese women: an allometric
approach. Int J Obes Relat Metab Disord. 2001;25(5):676-681.
doi:10.1038/sj.ijo.0801560.
180. Maffiuletti NA, Jubeau M, Munzinger U, et al. Differences in quadriceps muscle
strength and fatigue between lean and obese subjects. Eur J Appl Physiol.
2007;101(1):51-59. doi:10.1007/s00421-007-0471-2.
181. Tomlinson DJ, Erskine RM, Morse CI, Winwood K, Onambélé-Pearson GL. Combined
effects of body composition and ageing on joint torque, muscle activation and co-
contraction in sedentary women. Age (Dordr). 2014;36(3):9652. doi:10.1007/s11357-
014-9652-1.
182. Akhmedov D, Berdeaux R. The effects of obesity on skeletal muscle regeneration.
Front Physiol. 2013;4 DEC. doi:10.3389/fphys.2013.00371.
183. Goodpaster BH, Theriault R, Watkins SC, et al. Intramuscular lipid content is increased
in obesity and decreased by weight loss. Metabolism. 2000;49(4):467-472.
doi:10.1016/S0026-0495(00)80010-4.
184. Goodpaster BH, Wolf D. Skeletal muscle lipid accumulation in obesity, insulin
resistance, and type 2 diabetes. Pediatr Diabetes. 2004;5(4):219-226.
doi:10.1111/j.1399-543X.2004.00071.x.
185. Coen PM, Goodpaster BH. Role of intramyocelluar lipids in human health. Trends
Endocrinol Metab. 2012;23(8):391-398. doi:10.1016/j.tem.2012.05.009.
186. Bosma M, Kersten S, Hesselink MKC, Schrauwen P. Re-evaluating lipotoxic triggers
in skeletal muscle: Relating intramyocellular lipid metabolism to insulin sensitivity.
Prog Lipid Res. 2012;51(1):36-49. doi:10.1016/j.plipres.2011.11.003.
187. Bachmann OP, Dahl DB, Brechtel K, et al. Effects of intravenous and dietary lipid
challenge on intramyocellular lipid content and the relation with insulin sensitivity in
humans. Diabetes. 2001;50(11):2579-2584. doi:10.2337/diabetes.50.11.2579.
188. Toledo FGS, Menshikova E V., Azuma K, et al. Mitochondrial capacity in skeletal
muscle is not stimulated by weight loss despite increases in insulin action and decreases
in intramyocellular lipid content. Diabetes. 2008;57(4):987-994. doi:10.2337/db07-
1429.
189. Goodpaster BH, He J, Watkins S, Kelley DE. Skeletal muscle lipid content and insulin
resistance: Evidence for a paradox in endurance-trained athletes. J Clin Endocrinol
Metab. 2001;86(12):5755-5761. doi:10.1210/jc.86.12.5755.
190. Patti M-E, Corvera S. The role of mitochondria in the pathogenesis of type 2 diabetes.
Endocr Rev. 2010;31(3):364-395. doi:10.1210/er.2009-0027.
Page 70
52
191. Amchenkova AA, Bakeeva LE, Chentsov YS, Skulachev VP, Zorov DB. Coupling
membranes as energy-transmitting cables. I. Filamentous mitochrondia in fibroblasts
and mitochondrial clusters in cardiomyocytes. J Cell Biol. 1988;107(2):481-495.
doi:10.1083/jcb.107.2.481.
192. Ubl JJ, Chatton JY, Chen S, Stucki JW. A critical evaluation of in situ measurement of
mitochondrial electrical potentials in single hepatocytes. Biochim Biophys Acta -
Bioenerg. 1996;1276(2):124-132. doi:10.1016/0005-2728(96)00067-9.
193. Collins TJ, Berridge MJ, Lipp P, Bootman MD. Mitochondria are morphologically and
functionally heterogeneous within cells. EMBO J. 2002;21(7):1616-1627.
doi:10.1093/emboj/21.7.1616.
194. Alberts B, Johnson A, Lewis J, Raff M, Roberts K, Walter P. Molecular Biology of the
Cell, 4th Edition.; 2002. doi:10.3389/fimmu.2015.00171.
195. Picard M, Taivassalo T, Gouspillou G, Hepple RT. Mitochondria: isolation, structure
and function. J Physiol. 2011;589(Pt 18):4413-4421.
doi:10.1113/jphysiol.2011.212712.
196. Youle RJ, van der Bliek AM. Mitochondrial fission, fusion, and stress. Science.
2012;337(6098):1062-1065. doi:10.1126/science.1219855.
197. Shaw JM, Nunnari J. Mitochondrial dynamics and division in budding yeast. Trends
Cell Biol. 2002;12(4):178-184. doi:10.1016/S0962-8924(01)02246-2.
198. van der Bliek AM, Shen Q, Kawajiri S. Mechanisms of mitochondrial fission and
fusion. Cold Spring Harb Perspect Biol. 2013;5(6). doi:10.1101/cshperspect.a011072.
199. Lee YJ, Jeong S-Y, Mariusz K, Smith CL, Youle RJ. Roles of the Mammalian
Mitochondrial Fission and Fusion Mediator Fis1, Drp1, and Opa1 and Apoptosis. Mol
Biol Cell. 2004;15(1):5001-5011. doi:10.1091/mbc.E04.
200. Bach D, Pich S, Soriano FX, et al. Mitofusin-2 determines mitochondrial network
architecture and mitochondrial metabolism: A novel regulatory mechanism altered in
obesity. J Biol Chem. 2003;278(19):17190-17197. doi:10.1074/jbc.M212754200.
201. Liesa M, Palacin M, Zorzano A. Mitochondrial Dynamics in Mammalian Health and
Disease. Physiol Rev. 2009;89(3):799-845. doi:10.1152/physrev.00030.2008.
202. Jheng H-F, Tsai P-J, Guo S-M, et al. Mitochondrial Fission Contributes to
Mitochondrial Dysfunction and Insulin Resistance in Skeletal Muscle. Mol Cell Biol.
2012;32(2):309-319. doi:10.1128/MCB.05603-11.
203. Putti R, Sica R, Migliaccio V, Lionetti L. Diet impact on Mitochondrial Bioenergetics
and Dynamics. Front Physiol. 2015;6(MAR). doi:10.3389/fphys.2015.00109.
204. Berg JM, Tymoczko JL, Stryer L. Biochemistry. W H Free. 2002;New York.:320-323.
papers2://publication/uuid/7EB6183C-F1A3-4903-A72F-B1A659CECF68.
205. Marszalek JR, Kitidis C, DiRusso CC, Lodish HF. Long-chain acyl-CoA synthetase 6
preferentially promotes DHA metabolism. J Biol Chem. 2005;280(11):10817-10826.
Page 71
53
doi:10.1074/jbc.M411750200.
206. Lewin TM, Van Horn CG, Krisans SK, Coleman RA. Rat liver acyl-CoA synthetase 4
is a peripheral-membrane protein located in two distinct subcellular organelles,
peroxisomes, and mitochondrial-associated membrane. Arch Biochem Biophys.
2002;404(2):263-270. doi:10.1016/S0003-9861(02)00247-3.
207. Gargiulo CE, Stuhlsatz-Krouper SM, Schaffer JE. Localization of adipocyte long-chain
fatty acyl-CoA synthetase at the plasma membrane. J Lipid Res. 1999;40(5):881-892.
http://www.ncbi.nlm.nih.gov/pubmed/10224157.
208. Brasaemle DL, Dolios G, Shapiro L, Wang R. Proteomic analysis of proteins associated
with lipid droplets of basal and lipolytically stimulated 3T3-L1 adipocytes. J Biol
Chem. 2004;279(45):46835-46842. doi:10.1074/jbc.M409340200.
209. Sleeman MW, Donegan NP, Heller-Harrison R, Lane WS, Czech MP. Association of
Acyl-Coa synthetase-1 with GLUT4-containing vesicles. J Biol Chem.
1998;273(6):3132-3135. doi:10.1074/jbc.273.6.3132.
210. Lewin TM, Kim JH, Granger DA, Vance JE, Coleman RA. Acyl-CoA Synthetase
Isoforms 1, 4, and 5 are Present in Different Subcellular Membranes in Rat Liver and
Can Be Inhibited Independently. J Biol Chem. 2001;276(27):24674-24679.
doi:10.1074/jbc.M102036200.
211. Zhang S, Fu J, Zhou Z. Changes in the brain mitochondrial proteome of male Sprague-
Dawley rats treated with manganese chloride. Toxicol Appl Pharmacol.
2005;202(1):13-17. doi:10.1016/j.taap.2004.06.001.
212. Foster LJ, de Hoog CL, Zhang Y, et al. A Mammalian Organelle Map by Protein
Correlation Profiling. Cell. 2006;125(1):187-199. doi:10.1016/j.cell.2006.03.022.
213. Kislinger T, Cox B, Kannan A, et al. Global Survey of Organ and Organelle Protein
Expression in Mouse: Combined Proteomic and Transcriptomic Profiling. Cell.
2006;125(1):173-186. doi:10.1016/j.cell.2006.01.044.
214. Mootha VK, Bunkenborg J, Olsen J V, et al. Integrated analysis of protein composition,
tissue diversity, and gene regulation in mouse mitochondria. Cell. 2003;115(5):629-
640. doi:S0092867403009267 [pii].
215. Pasini EM, Kirkegaard M, Mortensen P, Lutz HU, Thomas AW, Mann M. In-depth
analysis of the membrane and cytosolic proteome of red blood cells. Blood.
2006;108(3):791-801. doi:10.1182/blood-2005-11-007799.
216. Bae TJ, Kim MS, Kim JW, et al. Lipid raft proteome reveals ATP synthase complex in
the cell surface. Proteomics. 2004;4(11):3536-3548. doi:10.1002/pmic.200400952.
217. Suzuki H, Kawarabayasi Y, Kondo J, et al. Structure and regulation of rat long-chain
acyl-CoA synthetase. J Biol Chem. 1990;265(15):8681-8685.
http://www.ncbi.nlm.nih.gov/pubmed/2341402.
218. Yamakawa A, Nishizawa M, Fujiwara KT, et al. Molecular cloning and sequencing of
cDNA encoding the phosphatidylinositol kinase from rat brain. J Biol Chem.
Page 72
54
1991;266(26):17580-17583.
219. Fujino T, Kang MJ, Suzuki H, Iijima H, Yamamoto T. Molecular characterization and
expression of rat acyl-CoA synthetase 3. J Biol Chem. 1996;271(28):16748-16752.
doi:10.1074/jbc.271.28.16748.
220. Iijima H, Fujino T, Minekura H, Suzuki H, Kang MJ, Yamamoto T. Biochemical
studies of two rat acyl-CoA synthetases, ACS1 and ACS2. Eur J Biochem.
1996;242(2):186-190. http://onlinelibrary.wiley.com/store/10.1111/j.1432-
1033.1996.0186r.x/asset/j.1432-
1033.1996.0186r.x.pdf?v=1&t=hyfsy6o6&s=00c0c0036c96226589373b03ec6a366d6
5f734d5.
221. Kang MJ, Fujino T, Sasano H, et al. A novel arachidonate-preferring acyl-CoA
synthetase is present in steroidogenic cells of the rat adrenal, ovary, and testis. Proc
Natl Acad Sci U S A. 1997;94(7):2880-2884. doi:10.1073/pnas.94.7.2880.
222. Oikawa E, Iijima H, Suzuki T, et al. A novel Acyl-CoA synthetase, ACS5, expressed
in intestinal epithelial cells and proliferating preadipocytes. J Biochem.
1998;124(3):679-685. doi:10.1093/oxfordjournals.jbchem.a022165.
223. Wang YL, Guo W, Zang Y, et al. Acyl coenzyme A synthetase regulation: Putative role
in long-chain acyl coenzyme A partitioning. Obes Res. 2004;12(11):1781-1788.
doi:10.1038/oby.2004.221.
224. Foster LJ, de Hoog CL, Mann M. Unbiased quantitative proteomics of lipid rafts reveals
high specificity for signaling factors. Proc Natl Acad Sci. 2003;100(10):5813-5818.
doi:10.1073/pnas.0631608100.
225. Gaucher SP, Taylor SW, Fahy E, et al. Expanded coverage of the human heart
mitochondrial proteome using multidimensional liquid chromatography coupled with
tandem mass spectrometry. J Proteome Res. 2004;3(3):495-505.
http://www.ncbi.nlm.nih.gov/entrez/query.fcgi?cmd=Retrieve&db=PubMed&dopt=Ci
tation&list_uids=15253431.
226. Soupene E, Kuypers FA. Multiple erythroid isoforms of human long-chain acyl-CoA
synthetases are produced by switch of the fatty acid gate domains. BMC Mol Biol.
2006;7. doi:10.1186/1471-2199-7-21.
227. Fujino T, Man-Jong K, Minekura H, Suzuki H, Yamamoto TT. Alternative translation
initiation generates Acyl-CoA synthetase 3 isoforms with heterogeneous amino termini.
J Biochem. 1997;122(1):212-216. doi:10.1093/oxfordjournals.jbchem.a021731.
228. Mashek DG, Bornfeldt KE, Coleman R a, et al. Revised nomenclature for the
mammalian long-chain acyl-CoA synthetase gene family. J Lipid Res. 2004;45:1958-
1961. doi:10.1194/jlr.E400002-JLR200.
229. Van Horn CG, Caviglia JM, Li LO, Wang S, Granger DA, Coleman RA.
Characterization of recombinant long-chain rat acyl-CoA synthetase isoforms 3 and 6:
identification of a novel variant of isoform 6. Biochemistry. 2005;44:1635–1642.
230. Hisanaga Y, Ago H, Nakagawa N, et al. Structural Basis of the Substrate specific Two-
Page 73
55
step Catalysis of Long Chain Fatty Acyl-CoA Synthetase Dimer. J Biol Chem.
2004;279(30):31717-31726. doi:10.1074/jbc.M400100200.
231. Piccini M, Vitelli F, Bruttini M, et al. FACL4, a new gene encoding long-chain acyl-
CoA synthetase 4, is deleted in a family with Alport syndrome, elliptocytosis, and
mental retardation. Genomics. 1998;47(3):350-358. doi:10.1006/geno.1997.5104.
232. Lee EJ, Kim HC, Cho YY, Byun SJ, Lim JM, Ryoo ZY. Alternative promotion of the
mouse acyl-CoA synthetase 6 (mAcsl6) gene mediates the expression of multiple
transcripts with 5′-end heterogeneity: Genetic organization of mAcsl6 variants.
Biochem Biophys Res Commun. 2005;327(1):84-93. doi:10.1016/j.bbrc.2004.11.141.
233. Mashek DG, Li LO, Coleman RA. Rat long-chain acyl-CoA synthetase mRNA, protein,
and activity vary in tissue distribution and in response to diet. J Lipid Res.
2006;47(9):2004-2010. doi:10.1194/jlr.M600150-JLR200.
234. Yamashita Y, Kumabe T, Cho YY, et al. Fatty acid induced glioma cell growth is
mediated by the acyl-CoA synthetase 5 gene located on chromosome 10q25.1-q25.2, a
region frequently deleted in malignant gliomas. Oncogene. 2000;19(51):5919-5925.
doi:10.1038/sj.onc.1203981.
235. Vance JE. MAM (mitochondria-associated membranes) in mammalian cells: Lipids and
beyond. Biochim Biophys Acta - Mol Cell Biol Lipids. 2014;1841(4):595-609.
doi:10.1016/j.bbalip.2013.11.014.
236. Gassler N, Roth W, Funke B, et al. Regulation of Enterocyte Apoptosis by Acyl-CoA
Synthetase 5 Splicing. Gastroenterology. 2007;133(2):587-598.
doi:10.1053/j.gastro.2007.06.005.
237. Mashek DG, McKenzie MA, Van Horn CG, Coleman RA. Rat long chain acyl-CoA
synthetase 5 increases fatty acid uptake and partitioning to cellular triacylglycerol in
McArdle-RH7777 cells. J Biol Chem. 2006;281(2):945-950.
doi:10.1074/jbc.M507646200.
238. Bowman TA, O’Keeffe KR, D’Aquila T, et al. Acyl CoA synthetase 5 (ACSL5)
ablation in mice increases energy expenditure and insulin sensitivity and delays fat
absorption. Mol Metab. 2016;5(3):210-220. doi:10.1016/j.molmet.2016.01.001.
239. Pitule P, Vycital O, Bruha J, et al. Differential expression and prognostic role of
selected genes in colorectal cancer patients. Anticancer Res. 2013;33(11):4855-4866.
240. Yeh CS, Wang JY, Cheng TL, Juan CH, Wu CH, Lin SR. Fatty acid metabolism
pathway play an important role in carcinogenesis of human colorectal cancers by
Microarray-Bioinformatics analysis. Cancer Lett. 2006;233(2):297-308.
doi:10.1016/j.canlet.2005.03.050.
241. Gassler N, Kopitz J, Tehrani A, et al. Expression of acyl-CoA synthetase 5 reflects the
state of villus architecture in human small intestine. J Pathol. 2004;202(2):188-196.
doi:10.1002/path.1504.
242. Gassler N, Schneider A, Kopitz J, et al. Impaired Expression of Acyl-CoA-Synthetase
5 in Epithelial Tumors of the Small Intestine. Hum Pathol. 2003;34(10):1048-1052.
Page 74
56
doi:10.1053/S0046-8177(03)00431-3.
243. Gassler N, Herr I, Schneider A, et al. Impaired expression of acyl-CoA synthetase 5 in
sporadic colorectal adenocarcinomas. J Pathol. 2005;207(3):295-300.
doi:10.1002/path.1831.
244. Huynh FK, Green MF, Koves TR, Hirschey MD. Measurement of fatty acid oxidation
rates in animal tissues and cell lines. Methods Enzymol. 2014;542:391-405.
doi:10.1016/B978-0-12-416618-9.00020-0.
245. Koves TR, Li P, An J, et al. Peroxisome proliferator-activated receptor-γ co-activator
1α-mediated metabolic remodeling of skeletal myocytes mimics exercise training and
reverses lipid-induced mitochondrial inefficiency. J Biol Chem. 2005;280(39):33588-
33598. doi:10.1074/jbc.M507621200.
246. Nicholls DG, Ferguson SJ. Bioenergetics.; 2003. doi:10.1016/B978-012518121-
1/50011-7.
247. Costford SR, Chaudhry SN, Salkhordeh M, Harper M-E. Effects of the presence,
absence, and overexpression of uncoupling protein-3 on adiposity and fuel metabolism
in congenic mice. Am J Physiol Endocrinol Metab. 2006;290:E1304-E1312.
doi:10.1152/ajpendo.00401.2005.
248. Bezaire V, Seifert EL, Harper M-E. Uncoupling protein-3: clues in an ongoing
mitochondrial mystery. FASEB J. 2007;21(2):312-324. doi:10.1096/fj.06-6966rev.
249. Rolfe DF, Brown GC. Cellular energy utilization and molecular origin of standard
metabolic rate in mammals. Physiol Rev. 1997;77(3):731-758.
http://www.ncbi.nlm.nih.gov/pubmed/9234964.
250. Mailloux RJ, Harper M-E. Uncoupling proteins and the control of mitochondrial
reactive oxygen species production. Free Radic Biol Med. 2011;51(6):1106-1115.
doi:10.1016/j.freeradbiomed.2011.06.022.
251. Murphy MP. How mitochondria produce reactive oxygen species. Biochem J.
2009;417(1):1-13. doi:10.1042/BJ20081386.
252. Maranzana E, Barbero G, Falasca AI, Lenaz G, Genova ML. Mitochondrial Respiratory
Supercomplex Association Limits Production of Reactive Oxygen Species from
Complex I. Antioxid Redox Signal. 2013;19(13):1469-1480.
doi:10.1089/ars.2012.4845.
253. B. C, G.R W. A method for the localization of sites for oxidative phosphorylation.
Nature. 1955;176:250-254.
254. Acín-Pérez R, Fernández-Silva P, Peleato ML, Pérez-Martos A, Enriquez JA.
Respiratory Active Mitochondrial Supercomplexes. Mol Cell. 2008;32(4):529-539.
doi:10.1016/j.molcel.2008.10.021.
255. Schagger H. Supercomplexes in the respiratory chains of yeast and mammalian
mitochondria. EMBO J. 2000;19(8):1777-1783. doi:10.1093/emboj/19.8.1777.
Page 75
57
256. Lapuente-Brun E, Moreno-Loshuertos R, Acin-Perez R, et al. Supercomplex Assembly
Determines Electron Flux in the Mitochondrial Electron Transport Chain. Science (80-
). 2013;340(6140):1567-1570. doi:10.1126/science.1230381.
257. Kelley DE, Goodpaster B, Wing RR, Simoneau JA. Skeletal muscle fatty acid
metabolism in association with insulin resistance, obesity, and weight loss. Am J
Physiol. 1999;277(6 Pt 1):E1130-41.
258. Chanseaume E, Malpuech-Brugere C, Patrac V, et al. Diets High in Sugar, Fat, and
Energy Induce Muscle Type-Specific Adaptations in Mitochondrial Functions in Rats.
J Nutr. 2006;136(8):2194-2200. http://jn.nutrition.org/cgi/content/abstract/136/8/2194.
259. Chanséaume E, Morio B. Potential mechanisms of muscle mitochondrial dysfunction
in aging and obesity and cellular consequences. Int J Mol Sci. 2009;10(1):306-324.
doi:10.3390/ijms10010306.
260. Simoneau JA, Veerkamp JH, Turcotte LP, Kelley DE. Markers of capacity to utilize
fatty acids in human skeletal muscle: relation to insulin resistance and obesity and
effects of weight loss. FASEB J. 1999;13(14):2051-2060.
http://eutils.ncbi.nlm.nih.gov/entrez/eutils/elink.fcgi?dbfrom=pubmed&id=10544188
&retmode=ref&cmd=prlinks%5Cnpapers2://publication/uuid/1873C8BA-B87D-
4319-8DFB-929A18769B9B.
261. Bruce CR, Thrush a B, Mertz V a, et al. Endurance training in obese humans improves
glucose tolerance and mitochondrial fatty acid oxidation and alters muscle lipid content.
Am J Physiol Endocrinol Metab. 2006;291(1):E99-E107.
doi:10.1152/ajpendo.00587.2005.
262. Tunstall RJ, Mehan K a, Wadley GD, et al. Exercise training increases lipid metabolism
gene expression in human skeletal muscle. Am J Physiol Endocrinol Metab.
2002;283(1):E66-E72. doi:10.1152/ajpendo.00475.2001.
263. Koves TR, Ussher JR, Noland RC, et al. Mitochondrial Overload and Incomplete Fatty
Acid Oxidation Contribute to Skeletal Muscle Insulin Resistance. Cell Metab.
2008;7(1):45-56. doi:10.1016/j.cmet.2007.10.013.
264. Morino K, Petersen KF, Shulman GI. Molecular mechanisms of insulin resistance in
humans and their potential links with mitochondrial dysfunction. Diabetes.
2006;55(SUPPL. 2). doi:10.2337/db06-S002.
265. Lowell BB, Shulman GI. Mitochondrial dysfunction and type 2 diabetes. Science.
2005;307(5708):384-387. doi:10.1126/science.1104343.
266. Sparks LM, Xie H, Koza RA, et al. A high-fat diet coordinately downregulates genes
required for mitochondrial oxidative phosphorylation in skeletal muscle. Diabetes.
2005;54(7):1926-1933. doi:10.2337/diabetes.54.7.1926.
267. Crunkhorn S, Dearie F, Mantzoros C, et al. PGC-1 expression is reduced in obesity:
Potential pathogenic role of saturated fatty acids and p38 map kinase activation. J Biol
Chem. 2007:M611214200. doi:10.1074/jbc.M611214200.
268. Hancock CR, Han D-H, Chen M, et al. High-fat diets cause insulin resistance despite
Page 76
58
an increase in muscle mitochondria. Proc Natl Acad Sci. 2008;105(22):7815-7820.
doi:10.1073/pnas.0802057105.
269. Antoun G, McMurray F, Thrush AB, et al. Impaired mitochondrial oxidative
phosphorylation and supercomplex assembly in rectus abdominis muscle of diabetic
obese individuals. Diabetologia. 2015;58(12):2861-2866. doi:10.1007/s00125-015-
3772-8.
270. Caulfield T. Obesity Genes, Personalized Medicine, and Public Health Policy. Curr
Obes Rep. 2015;4(3):319-323. doi:10.1007/s13679-015-0163-x.
Page 77
59
CHAPTER TWO: THE ASSOCIATION BETWEEN ACSL5 RS2419621 GENOTYPE
AND RESPONSE OF WOMEN WITH OBESITY AND OVERWEIGHT TO
LIFESTYLE INTERVENTIONS.
ACYL-COA SYNTHETASE LONG-CHAIN 5 GENOTYPE IS ASSOCIATED WITH
BODY COMPOSITION CHANGES IN RESPONSE TO LIFESTYLE
INTERVENTIONS IN POSTMENOPAUSAL WOMEN WITH OVERWEIGHT AND
OBESITY: A GENETIC ASSOCIATION STUDY ON COHORTS MONTRÉAL-
OTTAWA NEW EMERGING TEAM, AND COMPLICATIONS ASSOCIATED
WITH OBESITY
Abishankari Rajkumar,1,3 Gilles Lamothe,2 Pierrette Bolongo,3 Mary-Ellen Harper,1 Kristi
Adamo,4,5,6 Éric Doucet,6 Remi Rabasa-Lhoret,7,8 Denis Prud’homme,6,9 and Frédérique
Tesson3,10
1-Department of Biochemistry, Microbiology and Immunology, University of Ottawa,
Ottawa, ON Canada
2-Department of Mathematics and Statistics, University of Ottawa, Ottawa, ON Canada
3-Interdisciplinary School of Health Sciences, University of Ottawa, Ottawa, ON Canada
4-CHEO Research Institute, Ottawa, ON Canada
5-Department of Pediatrics, University of Ottawa, Ottawa, ON Canada
6-School of Human Kinetics, University of Ottawa, Ottawa, ON Canada
7-Départment de Nutrition, Université de Montréal, Montreal, QC Canada
8-Institut de Recherches Cliniques de Montréal, Montréal, QC Canada
9-Institut de recherche de l’Hôpital Montfort, Hôpital Montfort, Ottawa, ON Canada
10-Faculty of Health Sciences, 451 Smyth, Ottawa, ON K1H 8M5 Canada
Page 78
60
2.1 STATEMENT OF MANUSCRIPT STATUS AND CONTRIBUTIONS
2.1.1 STATEMENT OF MANUSCRIPT STATUS
The manuscript “Acyl-CoA synthetase long-chain 5 genotype is associated with body
composition changes in response to lifestyle interventions in postmenopausal women with
overweight and obesity: a genetic association study on cohorts Montréal-Ottawa New
Emerging Team, and Complications Associated with Obesity” has been published in the
journal of BMC Medical Genetics.
2.1.2 CONTRIBUTION STATEMENT
AR participated in genotyping DNA samples from patients who participated in the studies,
performed the statistical analyses, interpreting the data, participated in the design of the study,
drafted the manuscript. GL participated in the statistical analysis by revising the statistical
methodology critically. He also revised the entire manuscript. PB participated in the
genotyping studies and revised the article critically. MH participated in interpreting the data
and revised the article critically. KA participated in interpreting the data and revising the
article critically. ED participated in recruitment of patients and established the database. He
also helped in revising the article critically. RRL participated in recruitment of patients and
established the database. He also helped in revising the article critically. DP participated in
recruitment of patients and established the database. He also helped in study design and
revising the article critically. FT performed majority of the study design, interpreted the data
and revised the article critically. All authors read and approved the final manuscript.
2.1.3 COMPETING INTEREST STATEMENT
The authors declare that they have no competing interests.
Page 79
61
2.2 ABSTRACT
Background: Genetic studies on Acyl-CoA Synthetase Long-Chain 5 (ACSL5) demonstrate
an association between rs2419621 genotype and rate of weight loss in women with obesity in
response to caloric restriction. Our objectives were to (1) confirm results in two different
populations of women with overweight and obesity (2) study rs2419621’s influence on body
composition parameters of women with overweight and obesity following lifestyle
interventions. Methods: rs2419621 genotype was determined in women with overweight and
obesity who participated in the Montréal-Ottawa New Emerging Team (MONET n = 137) and
Complications Associated with Obesity (CAO n = 37) studies. Genotyping was done using
TaqMan MGB probe-based assay. Multiple linear regression analyses were used to test for
associations. Results: When studying women with overweight and obesity, rs2419621 [T]
allele carriers had a significantly greater decrease in visceral fat, absolute and percent fat mass
and a greater increase in percent lean mass in response to lifestyle intervention in comparison
to non-carriers. Studying only individuals with obesity showed similar results with rs2419621
[T] allele carriers also displaying a significantly greater decrease in body mass index following
the lifestyle intervention in comparison to non-carriers. Conclusion: Women with overweight
and obesity carrying the ACSL5 rs2419621 [T] allele are more responsive to lifestyle
interventions in comparison to non-carriers. Conducting such genetic association studies can
aid in individualized treatments/interventions catered towards an individual’s genotype.
2.3 INTRODUCTION
Obesity, recently defined as a disease by the American Medical Association, and overweight
are major risk factors for a variety of chronic diseases including cardiovascular diseases, type
2 diabetes and cancer [1]. Genetic and epigenetic mechanisms, mediated by lifestyle and
Page 80
62
environmental exposures have been implicated in the development of obesity and these
chronic diseases [2, 3].
As a critical component of metabolic pathways, fatty acyl-CoA molecules are known to be
implicated in energy production by β-oxidation, energy storage through lipid biosynthesis and
as lipid components of the cell. The acyl-CoA synthetases long-chain (ACSL) stimulates
intracellular free long-chain fatty acids by converting them to fatty acyl-CoA molecules.
Members of the ACSL family, ACSL 1, 3, 4, 5 and 6 are characterized by varying subcellular
localization, fatty acid substrate and tissue specificity [4]. ACSL5 is present in various species
including humans and rodents, while also being distributed in a wide range of tissues including
skeletal muscle, liver, and brain [5]. ACSL5 has been detected in rat liver cytosol, endoplasmic
reticulum and mitochondrial outer membrane [6]. Increased ACSL5 protein levels have been
observed during food deprivation in rats [6]. Furthermore, ACSL5 plays a role in facilitating
fatty acid channelling between anabolic lipid synthesis and catabolic β-oxidation pathway [6,
7]. Previous research conducted in our laboratory demonstrated that among 8 polymorphisms
along the ACSL5 gene, only the common single nucleotide polymorphism (SNP) rs2419621,
found in the promoter region, displayed a significant association with rate of weight loss
response in women with obesity participating in a weight management program (which
included an initial 6-week period of 900 kcal meal replacement) [8]. Characterised by a
cytosine to thymine transition, rs2419621 is located 12 nucleotides upstream of the second
transcription start site of ACSL5. The presence of the [T] allele produces a new cis-regulating
E-box site (DNA binding sites for E-proteins and myogenic regulatory factors such as MyoD)
at the promoter region of ACSL5 in addition to the two wildtype E-box elements [9]. The
presence of this extra E-box, has been shown to increase the amount of MyoD recruited to the
Page 81
63
ACSL5 promoter in vitro and to increase the expression of the downstream gene [9].
Furthermore, a 2.2-fold increase of ACSL5 transcript level was observed in skeletal muscle
biopsies from individuals that are homozygous for the rs2419621 [T] allele when compared
to homozygous wildtype individuals [8].
The objective of the present study was (1) to validate the influence of rs2419621 ACSL5
polymorphism on an independent population of women with obesity (2) To study the influence
of rs2419621 on weight loss and body composition changes in response to lifestyle
interventions on women with overweight and obesity. This article reports an increased
response in women with overweight and obesity carrying the ACSL5 rs2419621 [T] allele to
lifestyle interventions in comparison to non-carriers.
2.4 METHODS
Subjects
Women categorized as being overweight or obese (n = 174) who participated in two
hypocaloric lifestyle intervention studies Montréal Ottawa New Emerging Team study
(MONET study) and Complication Associated with Obesity study (CAO study) were
examined.
Ethics, consent and permissions
All participants provided informed consent to engage in the lifestyle intervention as well as to
the genetics components of these studies. Both cohort studies were approved by Université de
Montréal ethics committee with agreement to the Declaration of Helsinki.
Page 82
64
MONET and CAO intervention studies
The MONET study (n = 137) and the CAO study (n = 37) recruited women between 2003 and
2007. The MONET study included postmenopausal women with overweight or obesity, while
the CAO study population was composed of 35 women with obesity and two women with
overweight. Both the MONET and the CAO cohorts and lifestyle intervention have been
previously described and share major similarities [10]. Briefly, women were eligible to
participate if they met the required criteria including: (1) Body mass index (BMI) ≥27 kg/m2,
(2) menstruation ceased >1 year and plasma follicle-stimulating hormone levels ≥30 U l−1, (3)
non-diabetic, (4) non-smokers, (5) no hormone replacement therapy, and (6) <2 h/week of
structured exercise. The aim of MONET and CAO studies lifestyle intervention was a 10 %
body weight reduction over 6 months. Caloric restriction targets for both studies were
determined by subtracting 500 to 800 kcal from participants’ daily energy needs. The daily
energy needs were calculated by multiplying resting metabolic rate of each participant
(determined by indirect calorimetry [11]) to a physical activity factor of 1.4 as women were
not exercising regularly at the onset of the trial. Dietary prescriptions ranged from 1100 to
1800 kcal/day. The diet macronutrient composition was 55, 30, and 15 % of energy intake
from carbohydrates, fat, and protein, respectively [11]. A third of the MONET participants
were enrolled in a resistance-training program whereas the CAO participants were not enrolled
in resistance training. Subjects from both MONET and CAO studies were combined for
statistical analyses after verifying that there were no significant differences between
participants’ weight loss and body composition changes in response to the different lifestyle
interventions.
Page 83
65
Studied variables
Analyses of these variables have been previously described [10]. Briefly, body weight
measurement was conducted using a calibrated balance (Balance Industrielle Montréal,
Québec, Canada) while other body composition variables, including fat mass and lean mass,
were measured by Dual-energy X-ray absorptiometry (DXA) scans using the LUNAR Prodigy
system (software version 6.10.019; General Electric Lunar Corporation, Madison, WI, USA).
Height was measured using a wall stadiometer (Perspective Enterprises, Portage, MI, USA)
while BMI was calculated as body weight (kg)/height(m)2. Visceral fat and thigh muscle
attenuation were measured by computed tomography scan (General Electric Medical Systems,
Milwaukee, WI, USA). Adjusting variables were measured using the COBAS INTEGRA 400
analyzer (Roche Diagnostic, Montréal Canada) for high-density lipoprotein cholesterol (HDL-
C), triglycerides and glucose. The Friedwald formula was utilised to calculate cholesterol
(LDL-C) concentration. C-reactive protein (CRP), haptoglobin, transferrin and orosomucoid
levels were measured by immunonephelometry on an IMMAGE analyzer (Beckman Coulter,
Villepinte, France).
Isolation of DNA and rs2419621 genotyping using TaqMan MGB probe-based assay
chemistry
Isolation of genomic DNA from the blood samples of individuals who participated in both
MONET and CAO studies, was performed using a Qiagen Flexigene DNA kit. The ACSL5
rs2419621 SNP (CC, CT, TT) was genotyped using the TaqMan MGB probe-based assay
chemistry (Life Technologies- Applied Biosystems). The PCR cycle (Biorad’s CFX-96 Real
Time PCR) was as follows: enzyme activation at 95 °C for 10 min., denaturation at 92 °C for
15 s., 60 °C for 1 min-annealing/extension followed by 39 more repeats from the denaturation
Page 84
66
step. A positive control was used in order to ensure reliability of results. Biorad’s CFX96 real-
time system was used for allelic discrimination while analysis of the data from end point
fluorescence measurements were used to determine genotypes. Random samples were
sequenced (Applied Biosystem) in order to confirm the genotype.
Statistical analysis
Departure from Hardy-Weinberg proportions was tested on combined MONET and CAO
participants using a Pearson’s chi-squared test.
Multiple linear regression analyses were conducted on subjects whose blood samples and
biological parameter measurements (for dependent and adjusting variables) were available.
Multiple linear regression analyses were conducted on: 1) All MONET and CAO participants
and, 2) MONET and CAO women with obesity only (BMI ≥30).
Percentage changes in variables following intervention were calculated by subtracting post-
intervention from baseline values divided by baseline values multiplied by 100. For this study
we only had access to the pre and post-intervention values. Variables studied included BMI,
fat mass, lean mass, visceral fat and thigh muscle attenuation. Both the absolute values and
percentage values were studied for fat mass and lean mass [percent fat mass = (fat mass / total
body mass) x 100, with total body mass = fat mass + lean mass; percent lean mass = (lean
mass / total body mass) x 100].
Regression analyses on the data sets for BMI, fat mass, lean mass, visceral fat and thigh muscle
attenuation were conducted. Best subset regression analysis was conducted to determine which
covariables should be included and adjusted for in the multiple linear regression analysis.
Specifically we considered the following independent variables 1) based on their causative
Page 85
67
effect on weight loss: age, baseline weight, height, changes in transferrin, glucose, CRP,
orosomucoid and haptoglobin 2) based on their correlation with weight loss: HDL-C, LDL-C,
triglyceride [8]. The inclusion of a variable that is correlated with the response can reduce the
error variance and increase the power of the regression analysis. The selection criteria to
determine the best subset of independent variables was based on the adjusted R-squared and
Mallows Cp. Specifically, we conducted a best subset regression analysis on data from
populations consisting of women with overweight or obesity (Table 1) and women with
obesity (Table 2). However prior to conducting any detailed statistical analyses, any extreme
outliers found within the data sets of dependent and independent variables (if present) were
excluded. Extreme outliers were determined based on observed values with a large
standardized residual and large leverage. Specifically, one value from haptoglobin, transferrin
and CRP was excluded, while two values were excluded for orosomucoid.
In order to determine whether MONET & CAO populations could be pooled together for
statistical analysis, unpaired t-tests were conducted to test for study effect. Both pre-
intervention and post-intervention parameter values were compared between lifestyle
intervention studies. Multiple linear regression analysis was also conducted in order to observe
study effect through the use of multiple dummy variables on data for women with overweight
or obesity combined. Studies were conducted comparing CC carriers from the MONET study
to CC carriers from the CAO study. Specifically independent variables included three dummy
variables representing the subgroups (CAO-CC carriers, CAO-CT/TT carriers and MONET
CT/TT carriers) with the exception of CC carriers from the MONET study and the covariables
that were determined to be appropriate for adjustment. Covariables were determined through
best subset regression models for each dependent variable (Table 1). Similar analyses were
Page 86
68
conducted comparing CT/TT carriers from the MONET study and CT/TT carriers from the
CAO study. Analysis was also conducted on women with obesity alone using the appropriate
covariables. Covariables were determined by best subset regression (Table 2).
A multiple linear regression analysis was used to evaluate the association between ACSL5
rs2419621 genotype and changes in anthropometric and metabolic characteristics following
the lifestyle intervention. A dominant genetic model (CT/TT vs. CC) was utilized due to the
lack of individuals homozygous for the [T] allele. The multiple linear regression models
included the genotypes as an independent variable. The multiple linear regression models were
conducted on data sets of dependent variables. Covariables that were included were only
specific to the best subset regression conducted for each dependent variable (Tables 1 and 2).
P-values <0.05 were considered statistically significant. Data analysis was performed with
Minitab software 17.
2.5 RESULTS
Comparison of pre- and post-intervention anthropometric variables' values in each studied
cohort and test for intervention effects
Pre- and post-intervention anthropometric variables from the MONET and CAO cohorts were
compared using unpaired t-tests (Table 3). No significant differences in age, height, percent
fat and lean mass were found between the two cohorts pre-intervention. Furthermore, no
significant differences were observed for pre- and post-intervention absolute values for lean
mass, visceral fat, and thigh muscle attenuation. However, significant differences were
observed between pre- and post-intervention values for BMI and absolute value of fat mass
Page 87
69
between the two cohorts, as well as post-intervention values for percent fat mass and percent
lean mass.
When analysing study effects through the use of multiple linear regression analysis using a
general linear model, no significant difference was observed between the changes in variables
following lifestyle intervention, between CC carriers in MONET and CAO studies. The same
results were observed between CT/TT carriers in MONET and CAO studies, illustrating no
study effect between the two cohorts of interest (Tables 4 and 5).
Association analysis between ACSL5 rs2419621 genotype and changes in anthropometric
variables following the lifestyle intervention
The ACSL5 rs2419621 genotype frequencies were in Hardy-Weinberg equilibrium (HWE).
Data sets were analyzed using multiple linear regression analysis adjusted for confounding
variables specific to each dependent variable, to determine the association between rs2419621
genotype and changes in anthropometric variables following the lifestyle intervention (Table
6). [T] allele carriers showed a statistically significant greater decrease in their visceral fat as
well as their absolute and percent fat mass values and a statistically significant greater increase
in their percent lean mass in comparison to non-carriers following the interventions.
Comparison of pre- and post-intervention anthropometric variables' values in women with
obesity from each cohort studied and test for lifestyle intervention effect
The pre- and post-intervention anthropometric variables' values from the MONET and CAO
cohorts consisting of only women with obesity were compared using unpaired t-tests (Table
7). No significant differences were observed between the different cohorts’ pre- and post-
intervention values for any of the biological dependent variables studied.
Page 88
70
A multiple linear regression analysis using a general linear model was also utilised to test
whether body composition parameter changes were influenced by lifestyle interventions. No
significant difference was observed between the changes in outcome variables (specifically
change in BMI, absolute and percent fat mass, absolute and percent lean mass, visceral fat and
muscle attenuation) following the lifestyle intervention, between CC carriers with obesity in
MONET and CC carriers with obesity in CAO cohorts. Similar results were observed when
studying CT/TT carriers between the two cohorts illustrating no significant difference between
both study lifestyle interventions (data not shown).
Association analysis between ACSL5 rs2419621 genotype and changes in anthropometric
variables following the lifestyle intervention in MONET and CAO women with obesity
Dependent variable data sets were analyzed using multiple linear regression analysis adjusted
for co-variates, to determine the association between rs2419621 genotype and changes in
anthropometric variables following the lifestyle intervention in women with obesity (Table 8).
A statistically significant greater decrease in BMI, absolute and percent of fat mass values, as
well as visceral fat was noticed following the lifestyle intervention in women with obesity
carrying the [T] allele vs. non-carriers. A statistically significant greater increase in percent
lean mass values was observed in [T] allele carriers vs. non-carriers women with obesity
following the lifestyle intervention.
2.6 DISCUSSION
In 2014, according to the World Health Organization (WHO), obesity was shown to be present
in about 13 % of the world’s adult population, while 39 % of adults 18+ were overweight,
with 40 % of women being overweight [12]. The objective of this study was to evaluate the
Page 89
71
influence of ACSL5 rs2419621 genotype on the changes in body composition parameters in
response to lifestyle intervention in women with overweight or obesity. In order to do so, the
body composition changes in women participating in two lifestyle weight-reducing
interventions, the MONET (diet and/or resistance training) and CAO (diet) studies were
analyzed according to their genotype.
Prior to conducting analysis to determine the influence of rs2419621 genotype, lifestyle
intervention-related changes in body composition parameter differences were compared
between the two cohorts in order to determine whether they could be combined for statistical
analyses. The MONET and CAO study population and designs shared a lot of similarities [10].
Specifically, both studies used the same hypocaloric diet interventions. Both studies also
included non-diabetic postmenopausal women, with the MONET study including women with
overweight or obesity, while CAO focused on women with obesity. A portion (one third) of
the MONET study participants were assigned to resistance training, in addition to the diet
intervention. Furthermore, criteria for exclusion were similar between studies. Significant
differences were observed between pre and post intervention BMI and absolute fat mass values
between the two cohorts, as well as for percentage of fat mass and percentage of lean mass in
post intervention. These observations were expected as CAO cohort was nearly exclusively
composed of women with obesity. No significant differences in age, height, pre percentage of
fat/lean mass, pre and post values for visceral fat, absolute lean mass and thigh muscle
attenuation were identified. The significant differences seen in pre and post intervention values
between the cohorts for various outcome variables studied when women with overweight or
obesity were pooled together, were abolished once the population was narrowed down to
women with obesity only. This indicates that rather than observing a study effect, significant
Page 90
72
differences observed in the pre and post-intervention values between MONET and CAO
cohorts consisting of both women with overweight or obesity, was a result of difference in
BMI between the two cohorts, with a much larger proportion of women being overweight in
the MONET cohort.
Association analyses confirmed that women with overweight or obesity carrying the [T] allele
were more responsive to the MONET and CAO lifestyle interventions in comparison to non-
carriers. More specifically, carriers of the [T] allele had a greater decrease in fat mass, while
also displaying a greater increase in lean mass in comparison to non-carriers. [T] allele carriers
also displayed a greater decrease in their visceral fat in comparison to non-carriers.
Furthermore, when considering just women with obesity, in addition to observing similar
results as the study with individuals with overweight and obesity, [T] allele carriers also
illustrated a greater decrease in their BMI in comparison to CC individuals.
The results of the present study demonstrate a greater decrease in visceral fat in carriers of the
ACSL5 rs2419621 [T] allele, in comparison to non-carriers when subjected to lifestyle
intervention aimed at weight reduction. Excess accumulation of visceral fat, characterised as
fat packed between inner organs, is associated with an increased risk of metabolic syndrome
[13]. Various proposed mechanisms, such as the “portal theory” have been suggested to
explain the relationship between visceral adiposity and common cardiometabolic diseases.
Specifically, the “portal theory” states a rise in lipolytic activity within visceral adipocytes,
contributing to an increased delivery of metabolic by-products such as free fatty acids into the
liver, eventually resulting in insulin resistance [14, 15]. Furthermore, elevated serum leptin
levels are correlated with subcutaneous fat but not visceral fat deposition [16]. This decrease
Page 91
73
in serum leptin levels observed with omental fat tissue deposition contributes to a decreased
regulation of appetite and impacts energy balance regulation [16].
Individuals with the rs2419621 [T] allele appeared to have a greater decrease in fat mass and
a greater increase in their lean mass following the intervention, in comparison to non-carriers.
While fat mass encompasses the overall fat composition of an individual, lean mass represents
non-fat containing tissue mass including bone connective tissue, skin, organs and the muscle
mass of an individual. Thus carriers of the [T] allele have a greater loss in fat and increase in
lean body mass, in comparison to non-carriers.
Our results obtained from studying the effects of the rs2419621 polymorphism on subjects
who participated in the MONET and CAO lifestyle intervention studies, validate our previous
results from the 900-cal/day meal replacement study [8]. While our previous work focused on
studying the effects of rs2419621 [T] allele carriers on rate of weight change, the present paper
has shown the effects of the polymorphism on changes in body composition indices.
Furthermore, the results from our current study illustrate that the rs2419621 polymorphism
has a strong effect on subjects’ response to diet/ exercise intervention, resulting in moderate
weight and fat loss, as statistically significant findings were observed even with interventions
that did not have a strict meal replacement plan implemented.
At this point, the molecular mechanism by which the rs2419621 [T] allele exerts its effect is
still unknown. However, the [T] allele has been shown to be associated with increased ACSL5
expression in rectus femoris muscle [8]. Furthermore, we showed, in vitro, that the [T] allele
generates a cis-regulatory E-box element recognized by MyoD, a myogenic regulatory factor
[9]. The [T] allele promotes MyoD-dependent activation of the ACSL5 promoter, suggesting
a direct link between level of expression of ACSL5 and rs2419621 genotype [9]. Since ACSL5
Page 92
74
is known to be mitochondrially localized, [T] allele carriers might present higher fat oxidation
levels due to increased level of ACSL5.
2.7 CONCLUSION
Based on the observed statistical analyses, carriers of the ACSL5 rs2419621 [T] allele have
been shown to be more responsive to the MONET and CAO lifestyle interventions in
comparison to non-carriers. The strong association observed between rs2419621 [T] allele and
response to diet/exercise intervention, has led to the hypothesis of individuals with the [T]
allele having increased fat oxidation in comparison to individuals with the wild type. Our study
confirms and provides additional insights on the influence of the rs2419621 polymorphism in
response to lifestyle interventions as it is an expansion of the previous work from Adamo et
al. 2007 [8]. However, it should be noted that population stratification was not controlled for
in our study. As our current study focused on the effect of rs2419621 on postmenopausal
women, future directions include replicating these findings in a large male population or male
and female population. Furthermore future work with in vitro/ in vivo models studying the
regulation of fatty acid β-oxidation by the rs2419621 [T] polymorphism are needed. Such
genetic association studies can aid in designing individualized treatments/interventions for
weight loss catered towards an individual’s genotype specifically by modifying both diet and
exercise.
2.8 REFERENCES
1. What Are the Health Risks of Overweight and Obesity? National Heart, Lung and Blood
Institute Web site. http://www.nhlbi.nih.gov/health/health-topics/topics/obe/risks (2012).
Accessed 14 Apr 2015
2. Drong AW, Lindgren CM, McCarthy MI. The genetic and epigenetic basis of type 2
diabetes and obesity. Clin Pharmacol Ther. 2012;92:707–715. doi: 10.1038/clpt.2012.149.
Page 93
75
3. Bjornsson HT, Fallin MD, Feinberg AP. An intergrated epigenetic and genetic approach to
common human disease. Trends Genet. 2004;20:350–358. doi: 10.1016/j.tig.2004.06.009.
4. Soupene E, Kuypers FA. Mammalian long-chain acyl-CoA synthetases. Exp Biol Med.
2008;233:507–521. doi: 10.3181/0710-MR-287.
5. Yamashita Y, Kumabe T, Cho YY, Watanabe M, Kawagishi J, Yoshimoto T, et al. Fatty
acid induced glioma cell growth is mediated by the acyl-coA synthetase 5 gene located on
chromosome 10q25.1-q25.2, a region frequently deleted in malignant gliomas. Oncogene.
2000;19:5919–5925. doi: 10.1038/sj.onc.1203981.
6. Lewin TM, Kim JH, Granger DA, Vance JE, Coleman RA. Acyl-CoA synthetase isoforms
1, 4, and 5 are present in different subcellular membranes in rat liver and can be inhibited
independently. J Biol Chem. 2001;276:24674–24679. doi: 10.1074/jbc.M102036200.
7. Mashek DG, Li LO, Coleman RA. Rat long-chain acyl-CoA synthetase mRNA, protein,
and activity vary in tissue distribution and in response to diet. J Lipid Res. 2006;47:2004–
2010. doi: 10.1194/jlr.M600150-JLR200.
8. Adamo KB, Dent R, Langefeld CD, Cox M, Williams K, Carrick KM, et al. Peroxisome
proliferator-activated receptor gamma 2 and acyl-CoA synthetase 5 polymorphisms influence
diet response. Obesity (Silver Spring) 2007;15:1068–1075. doi: 10.1038/oby.2007.630.
9. Teng AC, Adamo K, Tesson F, Stewart AF. Functional characterization of a promoter
polymorphism that drives ACSL5 gene expression in skeletal muscle and associates with diet-
induced weight loss. FASEB J. 2009;23:1705–1709. doi: 10.1096/fj.08-120998.
10. Lavoie ME, Rabasa-Lhoret R, Doucet E, Mignault D, Messier L, Bastard JP, et al.
Association between physical activity energy expenditure and inflammatory markers in
sedentary overweight and obese women. Int J Obes. 2010;34:1387–1395. doi:
10.1038/ijo.2010.55.
11. Brochu M, Malita MF, Messier V, Doucet E, Strychar I, Lavoie J, et al. Resistance training
does not contribute to improving the metabolic profile after a 6-month weight loss program in
overweight and obese postmenopausal women. J Clin Endocrinol Metab. 2009;94:3226–3233.
doi: 10.1210/jc.2008-2706.
12. World Health Organization: Obesity and Overweight.
http://www.who.int/mediacentre/factsheets/fs311/en/ (2015). Accessed on 1 Aug 2015
13. Bray GA. Medical consequences of obesity. J Clin Endocrinol Metab. 2004;89:2583–
2589. doi: 10.1210/jc.2004-0535.
14. Morvarid K, Karyn JC, Suchitra A, Stella PK, Gregg WVC, Melvin KD, et al. Molecular
evidence supporting the portal theory: a causative link between visceral adiposity and hepatic
insulin resistance. Am J Physiol Endocrinol Metab. 2005;288:E454–E461. doi:
10.1152/ajpendo.00203.2004.
15. Item F, Konrad D. Visceral fat and metabolic inflammation: the portal theory revisited.
Obes Rev. 2012;2:30–39. doi: 10.1111/j.1467-789X.2012.01035.x.
Page 94
76
16. Van Harmelen V, Reynisdottir S, Eriksson P, Thörne A, Hoffstedt J, Lönnqvist F, et al.
Leptin secretion from subcutaneous and visceral adipose tissue in women. Diabetes.
1998;47:913–917. doi: 10.2337/diabetes.47.6.913.
Page 95
77
2.9 TABLES
Table 1: Best subset regression analysis conducted on MONET and CAO women with
overweight or obesity
Models of dependent
variable studied
R-Sq
(%)
R-Sq (%)
(adj)
Covariables associated with mentioned R value
Change in BMI 13.1 8.5 Height, change in glucose, change in CRP, change in
transferrin and change in triglyceride
Change in Lean Mass 17.8 12.7 Height, initial weight, change in HDL cholesterol,
change in LDL cholesterol, change in triglyceride,
change in glucose
Change in Fat Mass 21.3 16.4 Initial weight, change in glucose, change in CRP,
change in transferrin, change in LDL cholesterol,
change in triglyceride
Change in % Fat mass 28.7 23.6 Initial weight, change in HDL cholesterol, change in
glucose, change in CRP, change in transferrin, change
in LDL cholesterol, change in triglyceride
Change in % Lean mass 25.0 20.3 Initial weight, change in HDL cholesterol, change in
orosomucoid, change in CRP, change in triglyceride,
change in transferrin
Change in Visceral fat 15.9 11.4 Age, height, change in CRP, change in LDL
cholesterol, change in triglyceride
Change in Muscle
attenuation
14.0 11.0 Height, change in HDL, change in orosomucoid
* Results used to determine covariables for the multiple linear regression analysis. Data sets that were used for
dependent variables were data from the MONET and CAO studies
Page 96
78
Table 2: Best subset regression analysis conducted on MONET and CAO women with
obesity
Dependent variable
studied
R-Sq
(%)
R-Sq (%)
(adj)
Covariables associated with mentioned R value
Change in BMI 13.2 8.8 Change in transferrin, change in triglyceride and change in
orosomucoid
Change in Lean
Mass
13.8 8.2 Initial weight, change in HDL cholesterol, change in
triglyceride, change in transferrin and change in CRP
Change in Fat Mass 21.6 15.4 Height, initial weight, change in CRP, change in transferrin,
change in triglyceride
Change in % Fat
mass
25.4 19.5 Height, initial weight, change in CRP, change in transferrin,
change in triglyceride
Change in % Lean
mass
25.7 18.7 Height, initial weight, change in HDL cholesterol, change in
CRP, Change in transferrin, change in triglyceride
Change in Visceral
fat
21.0 15.9 Age, initial weight, change in CRP and change in triglyceride
Change in Muscle
attenuation
17.6 12.3 Change in HDL cholesterol, change in transferrin, change in
orosomucoid and change in haptoglobin
* Results used to determine covariables for the multiple linear regression analysis. Data sets that were used for
dependent variables were data from the MONET and CAO studies
Page 97
79
Table 3: Pre- and post-intervention anthropometric variable values from MONET and CAO
women with overweight or obesity
Biological factor observed
MONET study CAO study P-value
Mean Std. Dev. Size (n) Mean Std. Dev Size (n)
Age (yrs) 57.9 4.87 106 56.5 4.11 29 0.155
Height (m) 1.61 0.06 106 1.63 0.08 29 0.068
Pre-Intervention
BMI (kg/m2) 32.4 4.74 106 34.3 3.56 29 0.041
Lean Mass (kg) 42.8 6.66 106 45.6 7.44 29 0.054
Fat Mass (kg) 38.5 9.57 106 43.6 9.21 29 0.011
Lean Mass (%) 51.5 4.59 106 49.8 3.62 29 0.072
Fat Mass (%) 45.6 4.70 106 47.2 3.73 29 0.084
Visceral Fat (cm2) 185 54.7 105 200 56.5 29 0.197
Thigh Muscle Attenuation (HU) 48.8 3.34 106 48.2 3.04 29 0.326
Post-Intervention
BMI (kg/m2) 30.3 4.76 105 32.3 3.69 29 0.042
Lean Mass (kg) 41.9 5.70 104 43.6 6.56 29 0.168
Fat Mass (kg) 33.9 10.1 104 40.1 9.51 29 0.004
Lean Mass (%) 54.2 5.36 104 50.9 4.56 29 0.003
Fat Mass (%) 42.6 5.52 104 45.9 4.76 29 0.004
Visceral Fat (cm2) 162 57.7 102 177 51.3 29 0.215
Thigh Muscle Attenuation (HU) 48.6 3.56 105 48.1 3.27 29 0.542
* Results are from unpaired t-tests. Test was conducted on data from all subjects whose blood samples were
available for study
Page 98
80
Table 4: Regression analysis comparing CC carriers of MONET to CAO in women with
overweight or obesity
Multiple regression
model
Dependent variable
Number of
subjects (n)
Parameter estimate
Standard error
Variable p-
value
R2 R2
(adjusted) Model p-
value
1 ∆ BMI 123 0.15 1.55 0.923 0.130 0.069 0.038
2 ∆ Lean Mass
124 −2.46 1.51 0.105 0.212 0.150 0.001
3 ∆ Fat Mass
121 4.73 3.04 0.123 0.233 0.170 <0.001
4 ∆ % Lean Mass
126 −2.98 1.72 0.085 0.268 0.212 <0.001
5 ∆ % Fat Mass
121 3.98 2.04 0.053 0.315 0.252 <0.001
6 ∆ Visceral Fat
124 2.40 5.41 0.658 0.155 0.096 0.011
7 ∆ Muscle attenuation
128 0.10 1.02 0.921 0.134 0.091 0.007
* Multiple linear regression analysis was conducted. Independent variables included three dummy variables
(CAO CC Carriers, CAO CT/TT carriers and MONET CT/TT carriers) with the exception of MONET CC
carriers while adjusting for covariables determined by best subset multiple linear regression, independent for
each model (Table 1). The following results illustrate parameter estimates, standard error, p-values
corresponding to CAO CC carriers independent variable
Page 99
81
Table 5: Regression analysis comparing CT/TT carriers of MONET to CAO in women with
overweight or obesity
Multiple regression
model
Dependent variable
Number of
subjects (n)
Parameter estimate
Standard error
Variable p-value
R2 R2(adjusted) Model p-value
1 ∆ BMI 123 0.36 1.50 0.812 0.130 0.069 0.038
2 ∆ Lean Mass 124 −0.35 1.39 0.802 0.212 0.150 0.001
3 ∆ Fat Mass 121 2.15 2.92 0.462 0.233 0.170 <0.001
4 ∆ % Lean Mass
126 −1.10 1.68 0.513 0.268 0.212 <0.001
5 ∆ % Fat Mass
121 1.73 1.89 0.361 0.315 0.252 <0.001
6 ∆ Visceral Fat
124 1.28 4.97 0.798 0.155 0.096 0.011
7 ∆ Muscle attenuation
128 0.58 0.95 0.543 0.134 0.091 0.007
* Multiple linear regression analysis was conducted. Independent variables included three dummy variables to
identify the polymorphism group (CC CAO, CC MONET and CT/TT CAO) with the exception of CT/TT
MONET while adjusting for covariables determined by best subset multiple linear regression, independent for
each model (Table 1). Following results illustrate parameter estimates, standard error, p-values corresponding
to CT/TT CAO independent variable
Page 100
82
Table 6: Regression analysis studying lifestyle intervention effect in CT/TT vs CC women
with overweight or obesity
Multiple regression
model
Dependent variable
Number of
subjects (n)
Parameter estimate
Standard error
Variable p-value
r2model r2adjusted model
Model p-value
1 ∆ BMI 123 −1.36 0.87 0.121 0.130 0.085 0.012
2 ∆ Lean Mass 124 0.93 0.81 0.254 0.193 0.145 0.001
3 ∆ Fat Mass 121 −3.82 1.66 0.023 0.213 0.164 <0.001
4 ∆ % Lean Mass
126 2.33 0.94 0.014 0.248 0.203 <0.001
5 ∆ % Fat Mass
121 −2.99 1.08 0.007 0.287 0.236 <0.001
6 ∆ Visceral fat
124 −5.74 2.87 0.048 0.153 0.110 0.003
7 ∆ Muscle attenuation
128 0.97 0.56 0.085 0.131 0.103 0.002
* Multiple linear regression analysis was conducted. Parameter estimate of independent variable = Xt was
studied. Physiological factors (dependent variables) were studied while adjusting for confounding factors
independent for each model (Table 1). Analysis was conducted on MONET and CAO studies combined
Page 101
83
Table 7: Pre- and post-intervention anthropometric variable values from MONET and CAO
studies in women with obesity
Biological factor observed
MONET study CAO study P-value
Mean Std. Dev. Size (n) Mean Std. Dev Size (n)
Age (yrs) 58.1 4.91 62 56.7 4.18 27 0.230
Height (m) 1.61 0.06 62 1.63 0.08 27 0.189
Pre-Intervention
BMI (kg/m2) 35.3 4.04 62 34.7 3.37 27 0.489
Lean Mass (kg) 45.5 6.82 62 46.1 7.38 27 0.693
Fat Mass (kg) 43.9 8.64 62 44.2 9.10 27 0.898
Lean Mass (%) 49.6 4.43 62 49.7 3.71 27 0.888
Fat Mass (%) 47.6 4.48 62 47.3 3.82 27 0.753
Visceral Fat (cm2) 207 51.9 61 206 52.8 27 0.927
Muscle Attenuation (HU) 48.5 3.70 62 48.6 2.20 27 0.833
Post-Intervention
BMI (kg/m2) 33.0 4.42 61 32.8 3.24 27 0.813
Lean Mass (kg) 44.1 5.69 60 44.1 6.58 27 0.998
Fat Mass (kg) 39.1 9.90 60 41.1 8.78 27 0.361
Lean Mass (%) 51.9 5.28 60 50.4 3.99 27 0.184
Fat Mass (%) 45.1 5.41 60 46.5 4.19 27 0.254
Visceral Fat (cm2) 182 58.5 60 182 47.4 27 0.981
Muscle Attenuation (HU) 48.2 4.09 61 48.6 1.89 27 0.661
* Results are from unpaired t-tests. Test was conducted on data from all subjects whose blood samples were
available for study
Page 102
84
Table 8: Regression analysis studying lifestyle intervention effect in CT/TT vs CC women
with obesity
Multiple regression
model
Dependent variable
Number of
subjects (n)
Parameter estimate
Standard error
Variable p-value
r2model r2adjusted model
Model p-value
1 ∆ BMI 87 −2.14 1.05 0.045 0.129 0.087 0.022
2 ∆ Lean Mass 85 0.49 1.07 0.645 0.151 0.086 0.041
3 ∆ Fat Mass 85 −5.13 1.97 0.011 0.212 0.151 0.004
4 ∆ % Lean Mass
85 3.12 1.19 0.010 0.257 0.189 0.001
5 ∆ % Fat Mass
85 −3.30 1.30 0.013 0.252 0.194 0.001
6 ∆ Visceral fat
85 −9.53 3.47 0.007 0.214 0.164 0.002
7 ∆ Muscle attenuation
87 1.20 0.72 0.098 0.177 0.126 0.007
* Multiple linear regression analysis was conducted. Parameter estimate of independent variable = Xt was
studied. Physiological factors (dependent variables) were studied while adjusting for confounding factors
independent for each model (Table 2). Analysis was conducted on MONET and CAO studies combined
Page 103
85
CHAPTER THREE: DETERMINING THE CELLULAR AND MOLECULAR
MECHANISMS BY WHICH RS2419621 ACSL5 POLYMORPHISM EXERTS ITS
EFFECT.
ACSL5 GENOTYPE INFLUENCE ON FATTY ACID METABOLISM:
A CELLULAR, TISSUE, AND WHOLE-BODY STUDY
Abishankari Rajkumar1,2, Awa Liaghati1, Jessica Chan2, Gilles Lamothe3, Robert Dent4, Éric
Doucet5, Remi Rabasa-Lhoret6,7, Denis Prud’homme5,8, *Mary-Ellen Harper1 and
*Frédérique Tesson2
*co-senior authors for publication.
1-Department of Biochemistry, Microbiology and Immunology, University of Ottawa,
Ottawa, ON, K1H 8M5, Canada
2-Interdisciplinary School of Health Sciences, University of Ottawa, Ottawa, ON, K1N 6N5,
Canada
3-Department of Mathematics and Statistics, University of Ottawa, Ottawa, ON, K1N 6N5,
Canada
4-The Ottawa Hospital, Ottawa, ON, K1H 8L6, Canada
5-School of Human Kinetics, University of Ottawa, Ottawa, ON, K1S 5L5, Canada
6-Départment de Nutrition, Université de Montréal, Montreal, QC, H3T 1A8, Canada
7-Institut de Recherches Cliniques de Montréal, Montréal, QC, H2W 1R7, Canada
8-Institut de recherche de l’Hôpital Montfort, Hôpital Montfort, Ottawa, ON, K1K 0T1,
Canada
Page 104
86
3.1 STATEMENT OF MANUSCRIPT STATUS AND CONTRIBUTIONS
3.1.1 STATEMENT OF MANUSCRIPT STATUS
The manuscript “ACSL5 Genotype Influence on Fatty Acid Metabolism: A Cellular, Tissue
and Whole-body Study” has been accepted for publication by the journal of Metabolism:
Clinical and Experimental.
3.1.2 CONTRIBUTION STATEMENT
AR conducted majority of the experimental procedures (apart from O2K ex vivo experiments),
genotyping and statistical analyses, interpreted the data and wrote the manuscript. AL
conducted the ex vivo experiments using the O2K system. JC constructed the vectors used in
the in vitro C2C12 studies. GL revised the statistical analyses and methodology critically. RD
participated in recruitment of patients for the Ottawa Hospital Weight Management Clinic and
established the database. ED participated in recruitment of patients for Montréal Ottawa New
Emerging Team and established the database. RRL participated in recruitment of patients for
Montréal Ottawa New Emerging Team and established the database. DP participated in
recruitment of patients for Montréal Ottawa New Emerging Team and established the
database. MH performed the study design, interpreted the data and revised the article critically.
FT performed the study design, interpreted the data and revised the article critically. All
authors read and approved the final manuscript.
3.1.3 COMPETING INTEREST STATEMENT
The authors declare that they have no competing interests.
Page 105
87
3.2 ABSTRACT
Background: Acyl-CoA Synthetase Long Chain 5 (ACSL5) gene’s rs2419621 T/C
polymorphism was associated with ACSL5 mRNA expression and response to lifestyle
interventions. However, the mechanistic understanding of the increased response in T allele
carriers is lacking. Study objectives were to investigate the effect of rs2419621 genotype and
ACSL5 human protein isoforms on fatty acid oxidation and respiration. Methods: Human
ACSL5 overexpression in C2C12 mouse myoblasts was conducted to measure 14C palmitic
acid oxidation and protein isoform localization in vitro. 14C palmitic acid oxidation studies
and western blot analysis of ACSL5 proteins were carried out in rectus abdominis primary
myotubes from 5 rs2419621 T allele carriers and 4 non-carriers. In addition, mitochondrial
high-resolution respirometry was conducted on vastus lateralis muscle biopsies from 4
rs2419621 T allele carriers and 4 non-carriers. Multiple linear regression analysis was
conducted to test the association between rs2419621 genotype and respiratory quotient related
pre- and post-lifestyle intervention measurements in postmenopausal women with overweight
or obesity. Results: In comparison to rs2419621 non-carriers, T allele carriers displayed higher
levels of i) 683aa ACSL5 isoform, localized mainly in the mitochondria, playing a greater role
in fatty acid oxidation in comparison to the 739aa protein isoform. ii) in vitro CO2 production
in rectus abdominis primary myotubes iii) in vivo fatty acid oxidation and lower carbohydrate
oxidation post-intervention iv) ex vivo complex I and II tissue respiration in vastus lateralis
muscle. Conclusions: These results support the conclusion that rs2419621 T allele carriers, are
more responsive to lifestyle interventions partly due to an increase in the short ACSL5 protein
isoform, increasing cellular, tissue and whole-body fatty acid utilization. With the increasing
effort to develop personalized medicine to combat obesity, our findings provide additional
Page 106
88
insight into genotypes that can significantly affect whole body metabolism and response to
lifestyle interventions.
Keywords: Obesity, Fatty Acid Metabolism, ACSL5 Genotype
Highlights
- ACSL5 genotype and fatty acid oxidation/mitochondrial bioenergetics were studied.
- rs2419621 [T] carriers had increased ACSL5 683aa protein levels vs non-carriers.
- rs2419621 [T] carriers had increased fatty acid oxidation vs non-carriers.
- rs2419621 [T] carriers have increased muscle tissue respiration.
- rs2419621 [T] carriers have reduced carbohydrate oxidation vs non-carriers.
3.3 BACKGROUND
According to a recent 2015 study published by the New England Journal of Medicine,
prevalence of obesity has doubled since 1980 with over 600 million individuals worldwide
suffering from obesity [1]. While treatments options include lifestyle interventions,
medication and more invasive procedures such as bariatric surgery, treatment response differs
between individuals[2,3]. Thus, there is a growing trend towards identifying predictors of
weight loss response for personalized lifestyle interventions. Specifically, of interest is
identifying high sensitive weight loss genotypes and understanding their impact on cellular
and molecular mechanisms.
Skeletal muscle, one of the key tissues that utilizes free fatty acids as a source of energy has
been shown to constitute roughly 40% of body mass in a healthy individual [4]. One key player
of fatty acid metabolism in skeletal muscle are Acyl-CoA Synthetase Long-Chain (ACSL)
Page 107
89
proteins, involved in the esterification of free fatty acids into fatty-acyl CoA molecules [5].
These ACSL proteins differ in their subcellular localization, substrate and tissue specificity
[5]. ACSL5, one of the members of this protein family, has been widely studied for its role in
fatty acid metabolism and has been shown to be present in various tissues, including brown
adipose tissue, skeletal muscle, liver and brain [6,7].
The rat and mouse Acsl5 genes have been shown to produce a protein of 683 amino acids
(Supplementary Figure 1). Mashek et al. demonstrated that rat ACSL5 overexpression in
McArdle-RH7777 cells resulted in the presence of ACSL5 in both the mitochondria and
endoplasmic reticulum, with a 30% higher rate of fatty acid uptake when incubated with 1-14C
oleic acid [8]. Moreover, research conducted on Acsl5 (-/-) mice, illustrated an increase in
whole-body energy expenditure and delayed fat absorption [9]. Lewin et al. documented an
increase in liver mitochondrial ACSL5 activity following a 48-hour fast in rats [10]. While
studies continue to dissect the function of rodent ACSL5, little is known about the subcellular
localization and function of ACSL5 human protein isoforms.
While rodents produce one ACSL5 of 683aa, the human ACSL5 gene (ACSL5) produces three
transcript variants encoding two major protein isoforms of ACSL5 [5]. The production of a
long protein isoform of 739aa requires an upstream AUG, while the 683aa short protein
isoform relies on an AUG downstream of the sequence [5]. Previous work conducted in our
lab illustrated that the ACSL5 rs2419621 genotype (C to T transition) was associated with
increased rate of weight and fat loss in women with overweight or obesity who underwent a
hypocaloric diet [11,12]. Located 12 nucleotides upstream of the second AUG site of ACSL5,
this polymorphism was shown to create an additional cis-regulatory E-box (CANNTG) in the
promoter region, increasing MyoD recruitment, as well as the expression of the downstream
Page 108
90
reporter gene in vitro [13]. Furthermore, the presence of the rs2419621 T allele was associated
with an elevated level of ACSL5 mRNA in human skeletal muscle biopsies [11]. Thus, we
hypothesize that individuals carrying the rs2419621 T allele are more responsive to lifestyle
interventions due to an increase in the ACSL5 protein expression. In the current study we
aimed to 1) study how ACSL5 protein levels influence fatty acid metabolism in vitro 2)
confirm that the presence of the rs2419621 polymorphism is associated with increased ACSL5
protein levels and fatty acid metabolism in vitro, and 3) determine the effect of the ACSL5
polymorphism on overall metabolic respiration rate ex vivo and in vivo.
3.4 MATERIALS AND METHODS
Individuals participating in the study
Individuals participating in our studies were enrolled in two weight management interventions.
Characteristics, including the rs2419621 genotype of individuals enrolled in the Ottawa
Hospital Weight Management Program, who gave their informed written consent (Human
Research Ethics Board of the Ottawa Hospital) are presented in Table 1[2,14]. Biopsies were
obtained from non-diabetic individuals (ages 30-66) during Roux-en-Y gastric bypass surgery
for rectus abdominis and by Bergstrom needle biopsy for vastus lateralis tissue. These tissues
were used for cellular fatty acid oxidation and tissue mitochondrial respiration as described
below. Individuals with overweight or obesity participating in the Montréal Ottawa New
Emerging Team (MONET) lifestyle intervention, provided informed written consent
(Université de Montréal ethics committee). They were enrolled in a caloric restriction
intervention while a third of the subjects also underwent resistance exercise training
[12,15,16]. In this population, we tested for association between rs2419621 genotype and
respiratory quotient related parameters.
Page 109
91
Isolation of rectus abdominis human primary myocytes and vastus lateralis tissue
Primary myocytes from rectus abdominis and tissue from vastus lateralis muscle biopsies
were isolated and processed as described previously[14,17].
Cell Cultures
C2C12 mouse muscle myoblasts (ATCC® CRL-1772™) were cultured in standard
Dulbecco’s modification Eagle’s medium (DMEM; See Supplementary Materials for culture
medium nutrient supplementation).
Human rectus abdominis primary myocytes were cultured using F10 nutrient mixture (Ham’s)
medium (Gibco) with nutrient supplementation. Cells were differentiated into myotubes by
incubation in low glucose DMEM with nutrient supplementation (See Supplementary
Materials) for 7 days.
HepG2 liver carcinoma cell line was cultured in standard Eagle's minimum essential media
with nutrient supplementation (See Supplementary Materials).
All cell types were grown at 37°C in a humidified 5% CO2 atmosphere.
Construction of Vectors
cDNA of Homo sapiens acyl-CoA synthetase long-chain family member 5 (ACSL5),
(NM_016234.3) was purchased within pOTB7 vectors (OpenBiosystems, GE Dharmacon).
For transient overexpression of ACSL5 cDNA vectors in cells, cDNA of the human long
(739aa) and short (683aa) protein isoform were amplified by PCR (See Supplementary
Materials). PCR was conducted using manufacturer’s protocol for PfuUltra High-Fidelity
DNA Polymerase (Agilent). PCR products were purified using the QIAquick Gel Extraction
Page 110
92
kit (Qiagen). pEYFP-N1 (Clontech Laboratories) and pCAGIG (Addgene) were restriction
digested with XhoI-BamHI and XhoI-NotI respectively, while ligation was conducted using
T4 DNA ligase company protocol (New England Biolabs). The YFP was expressed at the C-
termini of both ACSL5 isoforms while ACSL5 cDNA cloned into pCAGIG vectors were placed
before the internal ribosome entry site (IRES), thus producing ACSL5 protein and GFP
separately. The IRES-GFP was from pMX-IRES-GFP, while the other parts of the vector were
from pCAGGS with modified multiple cloning sites (pCAGEN) [18,19]. The pCAGIG vector
was constructed by Takahiko Matsuda [20]. The sequence of all plasmid constructs was
checked by sequencing using the ABI Prism 310 Genetic Analyzer (Applied Biosystems).
Transfection of C2C12 myoblast with ACSL5 cDNA
Following growth of C2C12 mouse myoblasts to 80% visual confluency, cells were
transfected with pCAGIG and pEYFP-N1 vectors containing ACSL5 cDNA of long and short
protein isoforms using Metafectene® Pro (Biontex). pCAGIG was also transfected alone as
control. As functionality studies on ACSL5 were solely conducted to observe localization and
function of proteins, myoblasts were used due to increased transfection efficiency vs
myotubes. Transfection studies were conducted in triplicates using company protocol for 24-
well and 10mm plates.
Immunostaining
C2C12 cells were stained for endoplasmic reticulum using calreticulin antibody and
mitochondria using Tom20 antibody. An anti-ACSL5 antibody was used to study endogenous
mouse ACSL5 in C2C12 cells as well as to study untagged human ACSL5 when
overexpressed in C2C12 cells (See Supplementary Material for antibodies used with catalogue
numbers). Human cells from rectus abdominis were stained for endogenous ACSL5 using an
Page 111
93
anti-ACSL5 antibody and mitochondria with Tom20 antibody. Briefly, cells were incubated
in 4% paraformaldehyde fixative for 20 minutes, then permeabilized with 500µl of 0.1% PBS-
Tween 20 solution for 30 minutes. Cells were incubated in 300µl primary antibody/well for 1
hour at room temperature and incubated with 300µl secondary antibody/well at room
temperature for 1 hour in the dark.
Cell imaging was conducted with Zeiss LSM 510/AxioImager.M1 confocal microscope using
ZEN2009 software (See Supplementary Material on microscope settings/image acquisition).
Z-stack images were acquired. Subcellular colocalization of human ACSL5 isoforms with
organelles of interest were measured using Mander’s coefficient (using Image J software). The
average gray value and area of Tom20 staining was assessed in human muscle cell images to
determine if there was a change in the number of mitochondria between rs2419621 T allele
carriers vs non-carriers (using Image J software). Statistical analyses were conducted using
unpaired t-tests to determine whether significant differences in subcellular localization existed
between the two human ACSL5 protein isoforms (n=3 independent experiments performed in
triplicates). Unpaired t-tests were also conducted to study the proportion of mouse ACSL5
localization in mitochondria vs endoplasmic reticulum (n=3 independent experiments
performed in triplicates), as well as the proportion of human ACSL5 localization in
mitochondria and the mitochondria quantity between rs2419621 carriers (n=5) vs non-carriers
(n=4). P<0.05 was considered significant.
14C palmitic acid oxidation studies
14C palmitic acid oxidation studies were conducted in 12-well plates on 64-68 hours post
pCAGIG-ACSL5 transfected C2C12 myoblasts or on human rectus abdominis primary
myocytes. 24-48 hours post transfection, cell were sorted for GFP positive cells using the
Page 112
94
Beckman Coulter MoFlo XDP/Beckman Coulter MoFlo Astrios. Palmitic acid oxidation
assessment was conducted as described in Aguer et al. [21]. ASP (acid-soluble products) from
growth medium and cells was extracted and analyzed [22–24]. The remainder of solution in
the glass vials containing benzethonium hydroxide was used to measure carbon dioxide.
Scintillation counting was conducted using the PERKIN ELMER Tri-Carb 2910 TR LSC. The
protein concentration of samples was determined with the Protein Assay kit (Bio-Rad) using
BSA as standard. Total fatty acid oxidation was calculated from the amount of radiolabelled
14C incorporated in both carbon dioxide and acid soluble products. Human ACSL5 driven
palmitic acid oxidation was assessed by 1) human ACSL5 driven CO2 production = Total CO2
measured - endogenous CO2 and 2) human ACSL5 driven ASP production = Total ASP
measured - endogenous ASP. Endogenous CO2 or ASP were the results obtained from palmitic
acid oxidation in cells transfected with an empty vector for control. One-way ANOVA and
unpaired Student t-tests were utilized for statistical analysis between groups. Studies
conducted on pCAGIG-ACSL5 transfected C2C12 myoblasts were conducted in triplicates
with n=4 independent experiments. Studies conducted on human rectus abdominis cells
consisted of 5 rs2419621 T allele carriers and 4 non-carriers. Experiments were performed in
triplicates. P<0.05 was considered significant.
Western blot analyses
Western blot analyses were conducted on C2C12 myoblasts transfected by ACSL5 expression
vectors, on HepG2 liver carcinoma cells as well as on human skeletal muscle cells
differentiated for 7 days into myotubes. Whole cell protein was extracted using the Active
Motif nuclear kit- “Preparation of Whole Cell Extract from Cells” protocol. Pierce™ BCA
Protein Assay Kit (Thermo Fisher Scientific) was used to determine whole cell protein
Page 113
95
concentrations. 12% SDS-PAGE casted gels were run. PageRuler™ Prestained Protein Ladder
(266166; Thermofisher Scientific) was used. Following transfer, nitrocellulose membranes
0.2µm (Biorad) were incubated overnight with ACSL5 primary antibody at 4ºC and the
following day with the secondary antibody at room temperature for 1 ½ hours. GAPDH was
used as the loading control. (See Supplementary Materials for antibodies). Protein band
detection was conducted with the VersaDoc MP 4000 system (Biorad) and analysed with the
Quantity One 4.6.9 Software (Chemi Hi Sensitivity 0.5x Gain Application). Prior to using
GAPDH as a loading control, an unpaired two-tail Student t-test analysis was conducted
between GAPDH volume intensities between carriers vs non-carriers to ensure no difference
was observed. An unpaired two-tail Student t-test analysis was conducted to compare ACSL5
volume intensity values adjusted for GAPDH volume intensity values between rs2419621 T
allele carriers (n=5) vs non-carriers (n=4). Student t-test and one-way Anova analyses were
also conducted to test for difference in ACSL5 expression level between C2C12 myoblasts
transfected with pCAGIG-ACSL5 long or short isoform and pCAGIG (n=3). P<0.05 was
considered significant.
High Resolution Respirometry of Biopsied Muscle
In situ mitochondrial function of permeabilized muscle fibers from vastus lateralis tissue was
assessed by using high-resolution respirometry in an Oxygraph-2k (OROBOROS Instruments,
Innsbruck, Austria), as previously described [17]. Specific electron transport chain complex-
supported respiration was assessed in respiratory chambers maintained at 37ºC (See
Supplementary Materials). Unpaired two-tailed Student t-test analysis was utilized to compare
results between rs2419621 T allele carriers (n=4) vs non-carriers (n=4). P<0.05 was considered
significant.
Page 114
96
Respiratory Quotient Related Association Studies
137 post-menopausal women with overweight or obesity were enrolled in the MONET
(Montréal Ottawa New Emerging Team) lifestyle intervention study [12,15,16]. Pre- and post-
lifestyle intervention measurements were done. Resting energy expenditure was determined
by indirect calorimetry following a 12 hour overnight fast. 24 hours prior to testing, subjects
refrained from physical activity. Both carbon dioxide and oxygen concentrations were
measured with a ventilated hood technique using a SensorMedics Delta Track II (Datex-
Ohmeda, Helsinki, Finland) [16]. The duration of measurement was 40 minutes, including a
10 minute period for acclimatization.
Genotyping of DNA from participants of the Montréal Ottawa New Emerging Team was
conducted using TaqMan MGB probe-based assay as previously described [12]. A Pearson’s
chi-squared test showed that the ACSL5 rs2419621 genotypes did not depart from the Hardy-
Weinberg proportions in the studied MONET population. Percentage changes in metabolic
parameters following the intervention were calculated by: (post intervention values – pre-
intervention values)/ pre-intervention values x 100. Regression analyses were conducted on
the following metabolic parameters as dependent variables: Respiratory quotient (Rq), volume
of oxygen inhaled per minute (VO2) at rest, maximal carbon dioxide expired per minute
(VCO2) at rest, fatty acid oxidation and carbohydrate oxidation. Prior to conducting multiple
linear regression analyses, best subset regression analyses were performed to determine the
appropriate covariates for adjustment in the multiple linear regression models (See
Supplementary Materials for covariates considered; Supplemental Data Table S2). Multiple
linear regression analyses were conducted to test the association of ACSL5 rs2419621
genotype with changes in metabolic parameters post-intervention. A dominant genetic model
Page 115
97
was utilized for regression analyses (CT/TT vs CC). Genotypes were included as an
independent variable in the regression models. Statistical significance was determined with a
p-value < 0.05 and all data analysis was performed with Minitab software 17. The R project
software was used to calculate statistical power for resting carbohydrate oxidation and resting
fatty acid oxidation levels as both the regression models were statistically significant.
3.5 RESULTS
Functional studies on the effect of human ACSL5 long and short protein isoform
overexpression on fatty acid metabolism in vitro
To assess the function of human ACSL5 long and short isoforms on fatty acid oxidation, the
break-down of 14C-labelled palmitic acid into CO2 and acid soluble products was measured
(Figure 1a). We observed that C2C12 cells overexpressing the human ACSL5 short protein
isoform contributed towards a significantly greater increase in CO2 levels (0.133 nmol/hr/mg
± SEM 0.040) and ASP in culture medium (0.232 nmol/hr/mg ± SEM 0.071) in comparison
to C2C12 cells overexpressing the human ACSL5 long isoform (CO2= 0.031 nmol/hr/mg ±
SEM 0.015; ASPmedium= 0.037 nmol/hr/mg ± SEM 0.025). No significant difference in ASP
isolated from cells was observed between C2C12 cells overexpressing the short or long
isoform of human ACSL5. It is important to note that no significant difference was observed
between the amounts of ACSL5 isoform overexpressed within the different samples (Figure
1b). Furthermore, no significant difference was observed between the levels of endogenous
mouse ACSL5 when cells were transfected with either the human ACSL5 long or human
ACSL5 short isoforms (Figure 1b).
Page 116
98
Subcellular localization of transiently overexpressed human ACSL5 long and short isoforms
in C2C12 cells
Prior to studying the subcellular localization of overexpressed human ACSL5 within C2C12,
we determined the subcellular localization of the endogenous mouse ACSL5. Analyses of
confocal microscopy images showed that the mouse ACSL5 was localized in the endoplasmic
reticulum to a greater extent than in the mitochondria (Supplementary Figure 2b: Mander’s
Coefficient for mouse ACSL5 in endoplasmic reticulum = 0.809 SEM = 0.003 n= 47;
Mander’s Coefficient for mouse ACSL5 in mitochondria = 0.297 SEM = 0.020 n = 45;
p<0.001). To characterize the subcellular primary location of human ACSL5 isoforms, YFP-
tagged human protein isoforms were transiently expressed in C2C12 myoblasts. Mitochondria
and endoplasmic reticulum were stained for TOM20 (Translocase of Outer Membrane 20), a
mitochondrial import receptor subunit, and calreticulin, a molecular calcium-binding
chaperone, respectively (Figure 2a). The short human ACSL5-YFP protein was localized in
the mitochondria to a greater extent than the long human ACSL5-YFP protein isoform (Figure
2b: Mander’s Coefficient for human ACSL5 short isoform in mitochondria = 0.583 SEM =
0.042 n = 33; Mander’s Coefficient for human ACSL5 long isoform in mitochondria = 0.422
SEM = 0.028 n = 31). Additionally, the human ACSL5-YFP long isoform was localized to a
greater extent in the endoplasmic reticulum in comparison to the short human ACSL5-YFP
isoform (Figure 2b: Mander’s Coefficient for human ACSL5 short isoform in endoplasmic
reticulum = 0.737 SEM = 0.009 n = 31; Mander’s Coefficient for human ACSL5 long isoform
in endoplasmic reticulum = 0.837 SEM = 0.007 n = 33). Immunofluorescence validation
studies observing subcellular localization of PCAGIG vectors containing human untagged
ACSL5 isoforms with organelles of interest, illustrated similar results (data not shown).
Page 117
99
ACSL5 protein expression levels and subcellular localization in human myotube cultures from
rs2419621 T allele carriers and non-carriers
In human, ACSL5 rs2419621 T allele carriers have been shown to display an increase in
ACSL5 mRNA levels in rectus femoris. However, whether the protein expression of ACSL5
isoforms also increases due to the presence of the T allele has not been confirmed. The
following set of studies focused on studying ACSL5 in human myotubes from women between
the ages of 36 and 61, specifically 5 T allele carriers (1 TT and 4 CT) and 4 non-carriers (Table
1). No significant age differences were observed between T allele carriers vs non-carriers (data
not shown). Western blot analyses illustrated a 1.85 fold increase in ACSL5 short isoform
levels in T allele carriers in comparison to non-carriers (ACSL5 Volume Intensity T allele
carriers = 6.69 ± 0.72 SEM (n = 5) vs non-carriers = 3.62 ± 0.47 (n = 4); Figure 3a). While the
short ACSL5 isoform of 683aa was detected in all samples of human muscle cells, the other
common human ACSL5 isoform of 739aa was barely present. However, both the long ACSL5
isoform of 739aa, the short 683 aa isoform, and an even shorter uncommon protein isoform of
659aa was present in HepG2 human liver carcinoma cells (Figure 3a and Supplemental Data
Figure S3). Therefore, the abundant ACSL5 isoform in skeletal muscle is the ACSL5 short
isoform of 683aa. Approximately 60% of ACSL5 colocalized with the mitochondria in human
patient muscle cells, a proportion very similar to the proportion of human ACSL5 short
isoform colocalization with mitochondria when overexpressed in C2C12 myoblasts
(Supplemental Data Figure S4 vs Figure 2b). Both carriers and non-carriers of the rs2419621
polymorphism displayed a similar subcellular localization of ACSL5 (Supplemental Data
Figure S4). It is important to note that following measurement of Tom20 staining for area and
Page 118
100
intensity to determine mitochondrial number no difference was observed between genotypes
(data not shown).
Fatty acid oxidation and oxygen consumption in biopsied muscle tissue and myotubes from
rs2419621 T allele carriers and non-carriers
Subsequently, we wanted to determine whether individuals who were rs2419621 T allele
carriers also had an increase in fatty acid oxidation levels in vitro and oxygen flux ex vivo
(Figure 3b and c). The same patient tissue samples on which western blot analyses were
conducted were studied for the following experiment (Table 1). In vitro 14C palmitic acid
oxidation experiments on primary myotubes showed a significant 1.46-fold increase in
complete fatty acid oxidation in rs2419621 T allele carriers (0.900 ± 0.028 SEM) in
comparison to non-carriers (0.615 ± 0.109 SEM) (Figure 3b). High resolution respirometry
was conducted in vastus lateralis muscle fibers obtained from four rs2419621 T allele carriers
(1 TT and 3 CT females) and four non-carriers (3 CC females and 1 CC male) between the
ages of 30 and 66 (Table 1). No age difference was observed between T allele carriers vs non-
carriers. A greater increase in complex I and II supported respiration in rs2419621 T allele
carriers was observed vs non-carriers (Figure 3c). Specifically, respiration /muscle mass
values showed a 1.846-fold increase in rs2419621 T allele carriers (60.59 ± 6.11 SEM) in
comparison to non-carriers (32.82 ± 4.12 SEM) (Figure 3c).
Association analysis between ACSL5 rs2419621 genotype and respiratory quotient related
measurements post MONET lifestyle intervention in women with overweight or obesity
Based on our in vitro and ex vivo results, we studied whether rs2419621 T allele carriers had
greater improvements in their respiratory quotient related measurements in vivo in comparison
Page 119
101
to non-carriers following a lifestyle intervention. Specifically, we assessed pre- and post-
MONET lifestyle-intervention-study, the respiratory quotient, resting carbon dioxide output
(VCO2), resting oxygen uptake (VO2), resting carbohydrate oxidation and resting fatty
oxidation in 105 postmenopausal women with overweight or obesity (Table S1). The average
age of the population studied was about 58 years with an average post-intervention BMI of
30.32kg/m2 (further descriptive statistics on studied population can be found in Table S1).
Women with overweight or obesity carrying the T allele, presented a parameter estimate of -
56.5 ± SE 24.7 for change in resting carbohydrate oxidation levels (statistical power of model=
80.2%) and a parameter estimate of 185.6 ± SE 66.6 for change in resting fatty acid oxidation
levels (statistical power of model= 60.0%) post intervention vs non-carriers. This illustrates
their greater reliance on fatty acid oxidation vs carbohydrate oxidation in comparison to non-
carriers post-intervention (Table 2).
3.6 DISCUSSION
Previous studies have illustrated enhanced fatty acid beta oxidation when ACSL5 was
transcriptionally activated in HEPG2 cells [25]. However, to date, functional roles of the two
commonly documented human ACSL5 protein isoforms have not been studied. Skeletal
muscle, is one of the key tissues that utilizes free fatty acids as a source of energy [4]. This
tissue is of interest for studying ACSL5, as the protein contributes towards the uptake of free
fatty acids. Thus, the objective of our study was to study the functional role of human ACSL5
isoforms, regarding fatty acid metabolism in skeletal muscle and determine the cellular and
molecular basis of responsiveness of rs2419621 T allele carriers to lifestyle interventions.
Page 120
102
Functionality studies on human ACSL5 isoforms in C2C12 myoblasts, illustrated that ACSL5
short isoform overexpression led to greater increases in complete and incomplete fatty acid
oxidation production levels, in comparison to ACSL5 long protein overexpression. This was
paralleled by a greater localization of the short protein isoform in mitochondria in comparison
to the long protein isoform. Our current findings support previous in silico studies of human
ACSL5 protein, which demonstrated a targeting mitochondrial signal on the short protein,
buried by the first encoding exon in the long protein isoform [5]. Thus, increased human
ACSL5 short protein localization within the mitochondria allows for the increased conversion
of free fatty acids into fatty acyl-CoA molecules, which would then be shuttled into the
organelle via carnitine palmitoyl transferases (CPT) for oxidation [26]. Previous work on
rodent ACSL5 appear to show its increased role in lipid biosynthesis [8,9]. Our studies in
C2C12 cells, illustrate a three-fold increase in rodent ACSL5 localization in the endoplasmic
reticulum in comparison to the mitochondria, potentially illustrating its preponderant role in
skeletal muscle lipid biosynthesis. Thus to date, while previous work has shown ACSL5 to be
present in the endoplasmic reticulum and the mitochondria in rat liver and in human epithelial
colorectal adenocarcinoma cells, our current findings shed light on the localization and
function of human and rodent ACSL5 within skeletal muscle [8,10,27]. Our studies on human
ACSL5 isoforms were conducted on myoblasts instead of myotubes in order to increase
transient transfection efficiency with the goal of understanding the function and localization
of the human isoforms. Future directions include confirming the functional role of the human
ACSL5 long isoform as well as studying whether compensatory mechanisms exist with other
fatty acid metabolism related proteins, when overexpressing human ACSL5 isoforms.
Page 121
103
Furthermore, confirming the role of the human ACSL5 isoforms in other tissues is important
to determine whether the observations from the present study are skeletal muscle-specific.
Previous work in our laboratory has illustrated the potential of the rs2419621 polymorphism
to increase recruitment of MyoD transcription factors to the promoter region of ACSL5,
resulting in an increased production of the downstream protein [13]. Based on our in vitro
findings in C2C12 myoblasts, we hypothesized that rs2419621T allele carriers were more
responsive to lifestyle interventions, due to an increase in their fatty acid oxidation levels
caused by an increase in ACSL5 short isoform expression. Human myotubes illustrated an
increase in the 683aa ACSL5 short isoform production, as well as in their complete fatty acid
oxidation levels in rs2419621 T allele carriers vs non-carriers. This increase in cellular fatty
acid oxidation was also reflected at the whole-body level, where T allele carriers had a greater
dependence on fatty acid oxidation and reduced reliance on carbohydrate oxidation in vivo
compared to non-carriers, following the MONET lifestyle intervention. Therefore, the
increase in short human ACSL5 isoform could explain the increase in fatty acid oxidation
levels observed both in vitro and in vivo. It is interesting to note that while the 683aa protein
isoform of ACSL5 was abundant in human myotubes, the expression of the long isoform of
739aa was very low. Furthermore, our results displayed roughly 60% of ACSL5 localized
within the mitochondria in human myotubes, which is very similar to the percent
mitochondrial localization of transfected human ACSL5 short isoform in C2C12 myoblasts.
Thus, regardless of the differentiated state of muscle cells, it appears that the function and
localization of human ACSL5 isoforms remains constant. Lastly, no difference in the quantity
of mitochondria was noted between genotypes, illustrating that the observed increase in
ACSL5 levels wasn’t due to an increase in mitochondrial number in T allele carriers.
Page 122
104
In HepG2 cells, the 739aa protein isoform as well as an uncommon 659aa was found (Figure
S3). Previous studies on this uncommon ACSL5 isoform of 659aa (ACSL5Δ20), illustrated
its role in the regulation of TRAIL-induced apoptosis [27]. Thus, its function might contribute
to its abundance in HepG2, as hepatocellular carcinoma cells have been shown to potentially
become resistant to TRAIL-induced apoptosis [28,29]. Overall our findings demonstrate an
association between rs2419621 genotype, high levels of fatty acid oxidation and the human
683aa short ACSL5 expression in skeletal muscle.
Remarkably, a greater increase in ex vivo mitochondrial respiration in myofibers was observed
with T allele carriers in comparison to non-carriers. The surprising difference could be
attributed to the increase in ACSL5 short isoform expression within the muscle cells of
rs2419621 T allele carriers, increasing the production of endogenous fatty acyl-CoA
molecules. This consequently increases fatty acid oxidation and acetyl-CoA to support Krebs
cycle activity, which provides reducing equivalents to drive mitochondrial respiration. Hence,
this could be an indirect mechanism by which carriers of the rs2419621 polymorphism are
more responsive to lifestyle interventions in comparison to non-carriers.
The key strength of this study is insight into mechanisms underlying the effects of the
rs2419621 genotype on the response to lifestyle interventions in overweight or obese
individuals. We investigated the molecular mechanistic effects of the rs2419621
polymorphism on fatty acid oxidation and lifestyle intervention in T allele carriers, by utilising
a combination of in vitro, ex vivo and in vivo methods using biochemical approaches and
human population statistical analyses. However, weaknesses that must be acknowledged
include an incomplete characterization of the enzymatic activities and potential pH-
Page 123
105
dependencies of the short and long isoforms. Thus, future work will need to define their
respective pH-dependent activities, their sensitivity to inhibitors such as triacsin, as well as
the effects of both human isoforms on lipid biosynthesis. Finally, due to the small number of
rs2419621 TT carriers, we were unable to specifically determine whether individuals who are
homozygous for the T allele would present a greater response to lifestyle interventions and
have a greater increase in fatty acid oxidation in comparison to CT individuals.
3.7 CONCLUSION
Our interdisciplinary approach supports the overall conclusion that ACSL5 rs2419621 [T]
carriers lose more fat mass and have increased rate of weight loss during lifestyle
interventions. T allele carriers displayed a greater amount of 683aa ACSL5 protein isoform
which was found to be localized to a greater extent with the mitochondria, thus contributing
to an overall increase in an individual’s fatty acid oxidation and cellular energy expenditure
levels. To our knowledge, this is the first time the long and short human ACSL5 isoforms
have been considered to have distinct functional roles in cell. Such research provides
translational potential, as linking cellular and molecular work to genetic association studies
not only provides a means of understanding an individual’s ability to respond to lifestyle
interventions, but also aids in defining individualized intervention treatments for weight loss
catered towards individual genotype.
Page 124
106
3.8 REFERENCES
1. Collaborators TG 2015 O. Health Effects of Overweight and Obesity in 195 Countries
over 25 Years. N Engl J Med. 2017:NEJMoa1614362. doi:10.1056/NEJMoa1614362.
2. Gerrits MF, Ghosh S, Kavaslar N, et al. Distinct skeletal muscle fiber characteristics
and gene expression in diet-sensitive versus diet-resistant obesity. J Lipid Res.
2010;51:2394-2404. doi:10.1194/jlr.P005298.
3. Thrush a B, Dent R, McPherson R, Harper M-E. Implications of mitochondrial
uncoupling in skeletal muscle in the development and treatment of obesity. FEBS J.
2013;280(20):5015-5029. doi:10.1111/febs.12399.
4. Frontera WR, Ochala J. Skeletal Muscle: A Brief Review of Structure and Function.
Calcif Tissue Int. 2015;96(3):183-195. doi:10.1007/s00223-014-9915-y.
5. Soupene E, Kuypers FA. Mammalian Long-Chain Acyl-CoA Synthetases. Exp Biol
Med. 2008;233(5):507-521. doi:10.3181/0710-MR-287.
6. Mashek DG, Li LO, Coleman RA. Rat long-chain acyl-CoA synthetase mRNA, protein,
and activity vary in tissue distribution and in response to diet. J Lipid Res.
2006;47(9):2004-2010. doi:10.1194/jlr.M600150-JLR200.
7. Yamashita Y, Kumabe T, Cho YY, et al. Fatty acid induced glioma cell growth is
mediated by the acyl-CoA synthetase 5 gene located on chromosome 10q25.1-q25.2, a
region frequently deleted in malignant gliomas. Oncogene. 2000;19(51):5919-5925.
doi:10.1038/sj.onc.1203981.
8. Mashek DG, McKenzie MA, Van Horn CG, Coleman RA. Rat long chain acyl-CoA
synthetase 5 increases fatty acid uptake and partitioning to cellular triacylglycerol in
McArdle-RH7777 cells. J Biol Chem. 2006;281(2):945-950.
doi:10.1074/jbc.M507646200.
9. Bowman TA, O’Keeffe KR, D’Aquila T, et al. Acyl CoA synthetase 5 (ACSL5)
ablation in mice increases energy expenditure and insulin sensitivity and delays fat
absorption. Mol Metab. 2016;5(3):210-220. doi:10.1016/j.molmet.2016.01.001.
10. Lewin TM, Kim JH, Granger DA, Vance JE, Coleman RA. Acyl-CoA Synthetase
Isoforms 1, 4, and 5 are Present in Different Subcellular Membranes in Rat Liver and
Can Be Inhibited Independently. J Biol Chem. 2001;276(27):24674-24679.
doi:10.1074/jbc.M102036200.
11. Adamo KB, Dent R, Langefeld CD, et al. Peroxisome proliferator-activated receptor
gamma 2 and acyl-CoA synthetase 5 polymorphisms influence diet response. Obesity
(Silver Spring). 2007;15(5):1068-1075. doi:10.1038/oby.2007.630.
12. Rajkumar, A., Lamothe, G., Bolongo, P., Harper, M.-E., Adamo, K. Acyl-CoA
synthetase long-chain 5 genotype is associated with body composition changes in
response to lifestyle interventions in postmenopausal women with overweight and
obesity: a genetic association study on cohorts Montréal-Ottawa New Emerging Team,
and. BMC Med Genet. 2016;17(56).
Page 125
107
13. Teng ACT, Adamo K, Tesson F, Stewart AFR. Functional characterization of a
promoter polymorphism that drives ACSL5 gene expression in skeletal muscle and
associates with diet-induced weight loss. FASEB J. 2009;23(6):1705-1709.
doi:10.1096/fj.08-120998.
14. Costford SR, Crawford SA, Dent R, McPherson R, Harper ME. Increased susceptibility
to oxidative damage in post-diabetic human myotubes. Diabetologia.
2009;52(11):2405-2415. doi:10.1007/s00125-009-1480-y.
15. Strychar I, Lavoie MÉ, Messier L, et al. Anthropometric, Metabolic, Psychosocial, and
Dietary Characteristics of Overweight/Obese Postmenopausal Women with a History
of Weight Cycling: A MONET (Montreal Ottawa New Emerging Team) Study. J Am
Diet Assoc. 2009;109(4):718-724. doi:10.1016/j.jada.2008.12.026.
16. Lavoie M-E, Rabasa-Lhoret R, Doucet E, et al. Association between physical activity
energy expenditure and inflammatory markers in sedentary overweight and obese
women. Int J Obes. 2010;34(9):1387-1395. doi:10.1038/ijo.2010.55.
17. Antoun G, McBride S, Vanstone JR, et al. Detailed Biochemical and Bioenergetic
Characterization of FBXL4-Related Encephalomyopathic Mitochondrial DNA
Depletion. JIMD Rep. 2015:1-9. doi:10.1007/8904_2015_491.
18. Nosaka T, Kawashima T, Misawa K, Ikuta K, Mui ALF, Kitamura T. STAT5 as a
molecular regulator of proliferation, differentiation and apoptosis in hematopoietic
cells. EMBO J. 1999;18(17):4754-4765. doi:10.1093/emboj/18.17.4754.
19. Hitoshi N, Ken-ichi Y, Jun-ichi M. Efficient selection for high-expression transfectants
with a novel eukaryotic vector. Gene. 1991;108(2):193-199. doi:10.1016/0378-
1119(91)90434-D.
20. Matsuda T, Cepko CL. Electroporation and RNA interference in the rodent retina in
vivo and in vitro. Proc Natl Acad Sci. 2004;101(1):16-22.
doi:10.1073/pnas.2235688100.
21. Aguer C, Fiehn O, Seifert EL, et al. Muscle uncoupling protein 3 overexpression
mimics endurance training and reduces circulating biomarkers of incomplete β-
oxidation. FASEB J. 2013;27(10):4213-4225. doi:10.1096/fj.13-234302.
22. Glatz JF, Jacobs AE, Veerkamp JH. Fatty acid oxidation in human and rat heart.
Comparison of cell-free and cellular systems. Biochim Biophys Acta. 1984;794(3):454-
465.
http://www.ncbi.nlm.nih.gov/entrez/query.fcgi?cmd=Retrieve&db=PubMed&dopt=Ci
tation&list_uids=6430348.
23. Veerkamp JH, Van Moerkerk HT, Glatz JF, Van Hinsbergh VW. Incomplete palmitate
oxidation in cell-free systems of rat and human muscles. Biochim Biophys Acta.
1983;753:399-410.
24. Kitzmann M, Lantier L, Hébrard S, Mercier J, Foretz M, Aguer C. Abnormal
metabolism flexibility in response to high palmitate concentrations in myotubes derived
from obese type 2 diabetic patients. Biochim Biophys Acta - Mol Basis Dis.
Page 126
108
2011;1812(4):423-430. doi:10.1016/j.bbadis.2010.12.007.
25. Zhou Y, Abidi P, Kim A, et al. Transcriptional activation of hepatic ACSL3 and ACSL5
by oncostatin M reduces hypertriglyceridemia through enhanced β-oxidation.
Arterioscler Thromb Vasc Biol. 2007;27(10):2198-2205.
doi:10.1161/ATVBAHA.107.148429.
26. Lee K, Kerner J, Hoppel CL. Mitochondrial carnitine palmitoyltransferase 1a (CPT1a)
is part of an outer membrane fatty acid transfer complex. J Biol Chem.
2011;286(29):25655-25662. doi:10.1074/jbc.M111.228692.
27. Gassler N, Roth W, Funke B, et al. Regulation of Enterocyte Apoptosis by Acyl-CoA
Synthetase 5 Splicing. Gastroenterology. 2007;133(2):587-598.
doi:10.1053/j.gastro.2007.06.005.
28. Lim SC, Jeon HJ, Kee KH, Lee MJ, Hong R, Han SI. Involvement of DR4/JNK
pathway-mediated autophagy in acquired TRAIL resistance in HepG2 cells. Int J
Oncol. 2016;49(5):1983-1990. doi:10.3892/ijo.2016.3699.
29. Zhang L, Fang B. Mechanisms of resistance to TRAIL-induced apoptosis in cancer.
Cancer Gene Ther. 2005;12(3):228-237. doi:10.1038/sj.cgt.7700792.
Page 127
109
0
0.02
0.04
0.06
0.08
0.1
0.12
0.14
0.16
0.18
0.2C
arb
on
dio
xid
e a
dd
itio
nal
pro
du
ctio
n r
ate
(n
mo
l/h
r/m
g)
0
0.05
0.1
0.15
0.2
0.25
0.3
0.35
ASP
me
diu
m a
dd
itio
nal
pro
du
ctio
n r
ate
(n
mo
l/h
r/m
g)
0
0.02
0.04
0.06
0.08
0.1
0.12
0.14
0.16
ASP
ce
lls a
dd
itio
nal
pro
du
ctio
n r
ate
(n
mo
l/h
r/m
g)
0
0.1
0.2
0.3
0.4
0.5
0.6
0.7
0.8
Tota
l fat
oxi
dat
ion
ad
dit
ion
al p
rod
uct
ion
rat
e
(nm
ol/
hr/
mg)
* * *
3.9 FIGURES
a)
b)
Figure 1: a) 14C Palmitic Acid Oxidation into Complete and Incomplete Fatty Acid
Oxidation. Fatty acid oxidation experiments were conducted on transfected cells sorted with
BeckmanCoulter MoFlo XDP/Beckman Coulter MoFlo Astrios. C2C12 myoblasts were
transfected with pCAGIG vectors containing the short (n=4) or long (n=4) ACSL5 isoform
cDNA, or pCAGIG empty vectors (n=4) to assess the endogenous 14C palmitate oxidation.
Human ACSL5 driven fatty acid oxidation was calculated as: fatty acid oxidation products in
presence of exogenous human ACSL5 – fatty acid oxidation products in presence of pCAGIG
empty vectors alone. b) Representative western blot image showing protein expression levels
of overexpressed human ACSL5 isoforms in C2C12 cells and endogenous ACSL5 mouse
Exogenous ACSL5 human
Endogenous ACSL5 mouse
Gapdh
0
2
4
6
8
ACSL5 short isoform ACSL5 long isoform
Vo
lum
e In
ten
sity
of
AC
SL5
hu
man
o
vere
xpre
ssio
n a
dju
ste
d
to G
apd
h
0
1
2
3
ACSL5 shortisoform
ACSL5 longisoform
Empty vectorpcAGIG
Vo
lum
e In
ten
sity
of
AC
SL5
en
do
gen
ou
s m
ou
se a
dju
ste
d t
o
Gap
dh
Page 128
110
protein in C2C12 cells. The images are representative of 3 independent experiments. Western
blot analysis of 3 independent experiments illustrated no difference in protein expression
levels of both overexpressed ACSL5 human proteins and endogenous ACSL5 mouse proteins
between samples.
Page 129
111
a)
b)
Figure 2: ACSL5 long and short human isoform-YFP tagged colocalization in
mitochondria and endoplasmic reticulum in C2C12 myoblasts. a) Immunofluorescence
images are shown separate and merged. Images are also shown using a Color Map plugin from
Image J where highly correlated pixels from both channels are shown in red while no
correlation is shown in blue. Scale bar = 10µM. Images were taken using Zeiss LSM
510/AxioImager.M1 Confocal Microscope with 60 x oil lens. These images are representative
Lon
g is
ofo
rm-Y
FP
Sho
rt is
ofo
rm-Y
FP ACSL5 Isoform Mitochondria Merged Color Map
Lon
g is
ofo
rm-Y
FP
Sho
rt is
ofo
rm-Y
FP
ACSL5 Isoform Endoplasmic Reticulum Merged Color Map
nMPD: -1 0 1
0
0.1
0.2
0.3
0.4
0.5
0.6
0.7
ACSL5 shortisoform
ACSL5 longisoform
Man
der
'sC
oef
fici
ent
for
colo
caliz
atio
no
f A
CSL
5 h
um
an w
ith
mit
och
on
dri
a
*
0
0.1
0.2
0.3
0.4
0.5
0.6
0.7
0.8
0.9
ACSL5 shortisoform
ACSL5 longisoform
Man
der
'sC
oef
fici
ent
for
colo
caliz
atio
no
f h
um
an A
CSL
5 w
ith
en
do
pla
smic
ret
icu
lum
*
*
Page 130
112
of 3 independent experiments. b) Comparison of Mander’s Coefficient of colocalization with
organelles of interest for ACSL5 human short and long isoforms. Results show significant
difference between the localisation of both isoforms (unpaired t-test <0.05) (n=3).
Page 131
113
ACSL5 739aa ACSL5 683aa
Gapdh
*
0
2
4
6
8
CT/TT CC
Vo
lum
e In
ten
sity
of
AC
SL5
sh
ort
is
ofo
rm a
dju
sted
fo
r V
olu
me
Inte
nsi
ty o
f G
apd
h
0
20
40
60
80
100
120
140
160
180
200
O2
Flu
x/m
usc
le m
ass
(pm
ol/
sec.
x m
g)
CT/TT
CC
0
1
2
3
4
5
CO2 ASPmedium
ASP cell Total
Pro
du
ctio
n r
ate
(n
mo
l/h
r/m
g)
CT/TT
CC
a)
b)
c)
Figure 3: ACSL5 rs2419621 genotype effect on protein levels, fatty acid oxidation and
oxygen consumption on human muscle samples. a) Western blot on whole-cell lysates from
primary myotubes of rectus abdominis illustrating ACSL5 683aa short isoform in patients who
are rs2419621 [T] allele carriers (n=5) and non-carriers (n=4). b) 14C palmitate fatty acid
oxidation results showing the effect of genotype on production rate of carbon dioxide and acid
* * * * * *
*
Page 132
114
soluble products (ASP) by primary myotubes from rectus abdominis tissue samples. Samples
were obtained from the same T allele carriers (n=5) vs non-carriers (n=4) as Fig 3a. c) High
resolution respirometry illustrating the effect of genotype on oxygen flux in vastus lateralis
tissue samples obtained from rs2419621 [T] allele carriers (n=4) and non-carriers (n=4). Mal=
malate; Pyr= pyruvate; Cyt C= cytochrome C; FCCP= carbonyl cyanide p-
trifluoromethoxyphenyl hydrazine; TMPD= 2mM N,N,N’,N’-Tetramethyl-p-
phenylenediamine dihydrochloride.
Page 133
115
3.10 TABLES
Table 1: Ottawa Hospital Weight Management Clinic patient information whose tissue and cells were
used for analyses.
Patients whose rectus abdominis samples were used for in vitro analyses
HMS #
rs2419621
genotype Age Gender
Pre-Bariatric
Weight (kg)
Height (cm)
HMS 123 CC 42 F 123.5 168
HMS 130 TT 48 F 114.2 165
HMS 133 CC 58 F 130.1 160
HMS 144 CT 39 F 122.3 150
HMS 158 CT 61 F 143.5 168
HMS 159 CT 36 F 125.7 163
HMS 160 CT 39 F 129.5 163
HMS 163 CC 52 F 108 160
HMS 178 CC 53 F 143.7 165
Patients whose vastus lateralis samples were used for ex vivo analysis
HMS #
rs2419621
genotype Age Gender
Weight(kg)
Height (cm)
HMS 190 CC 60 F 132.1 160
HMS 170 CC 40 F 135.5 171
HMS 203 CC 60 F 149.1 155
HMS 192 CC 58 M 148.8 177
HMS 189 CT 55 F 94 155
HMS 199 CT 30 F 135.7 157
HMS 207 CT 40 F 124.2 163
HMS 218 TT 66 F 126.4 163
Page 134
116
Table 2: Regression analysis studying the effect of rs2419621 on respiratory quotient related
parameters in CT/TT vs CC women with overweight or obesity.
Dependent
Variable
Number
of
Subjects
(n)
Parameter
Estimate
Standard
Error
Variable
p-value
r2
model
r2adjusted
model
Model
p-value
∆Respiratory
Quotient
102 -2.84 1.80 0.117 0.083 0.045 0.077
∆ Resting VCO2 68 -2.73 2.03 0.185 0.348 0.272 <0.001
∆ Resting VO2 68 -1.67 2.00 0.407 0.255 0.168 0.01
∆Resting
Carbohydrate
Oxidation
70 -56.5 24.7 0.026 0.270 0.187 0.005
∆ Resting Fatty
acid Oxidation
69 185.6 66.6 0.007 0.244 0.143 0.025
a Multiple linear regression analysis was conducted. Parameter estimate of independent variable=Xt was studied. Biological
factors (dependent variables) were studied while adjusting for confounding factors independent for each model
(Supplementary Table 2).
Page 135
117
CHAPTER FOUR: STUDYING THE ENVIRONMENTAL TOXICANT MEHP AND
ITS EFFECTS ON FATTY ACID METABOLISM IN VITRO AND IN VIVO- AN
ENVIRONMENTAL ASSOCIATION STUDY AND CELLULAR/MOLECULAR
MECHANISTIC APPROACH
IN VITRO AND IN VIVO EVIDENCE OF BIOENERGETIC METABOLISM
ALTERATION BY MONO-(2-ETHYLHEXYL) PHTHALATE
RUNNING TITLE: MEHP INDUCED BIOENERGETICS ALTERATION
Abishankari Rajkumar1, Suzanne Simba2, Katyanna Menard2, Denis Prud’homme,3,4, Mary-
Ellen Harper1, Frédérique Tesson2
1 Department of Biochemistry, Microbiology and Immunology, University of Ottawa, Ottawa,
ON, K1H 8M5, Canada
2 Interdisciplinary School of Health Sciences, University of Ottawa, Ottawa, ON, K1N 6N5,
Canada
3 Institut de recherche de l’Hôpital Montfort, Hôpital Montfort, Ottawa, ON, K1K 0T1,
Canada
4 School of Human Kinetics, University of Ottawa, Ottawa, ON, K1S 5L5, Canada
Page 136
118
4.1 STATEMENT OF MANUSCRIPT STATUS AND CONTRIBUTIONS
4.1.1 STATEMENT OF MANUSCRIPT STATUS
The manuscript “In vitro and in vivo evidence of bioenergetic metabolism alteration by mono-
(2-ethylhexyl) phthalate” is in preparation for submission to Toxicological Sciences.
4.1.2 CONTRIBUTION STATEMENT
AR participated in the study design and majority of the experiments including the statistical
analyses conducted within this paper. AR also wrote the manuscript. SS conducted the work
studying cytotoxicity effects of MEHP on C2C12 myoblasts. KM conducted the MEHP
exposure studies on C2C12 myoblasts for protein expression analyses using western blots. DP
participated in interpreting the data and revised the article critically. MH participated in
interpreting the data and revised the article critically. FT participated in the study design,
interpreted the data and revised the article critically. All authors read and approved the final
manuscript.
4.1.3 COMPETING INTEREST STATEMENT
The authors declare that they have no competing interests.
Page 137
119
4.2 ABSTRACT
Introduction: To better understand the potential alteration of muscle bioenergetic metabolism
by the obesogenic toxicant mono-(2ethylhexyl) phthalate (MEHP) the objectives of this
research were to determine: 1) the association between urinary MEHP levels and the efficacy
of fatty acid utilization in women with obesity who participated in National Health and
Nutrition Examination Survey (NHANES) studies. 2) the in vitro effects of MEHP on fatty
acid, glucose, and mitochondrial energetics utilization in C2C12 mouse muscle cells.
Methods: The association between urinary MEHP from NHANES participants with plasma
fatty acid levels was studied via secondary data statistical analyses. 14C palmitic acid
oxidation, Seahorse fatty acid oxidation/glycolysis stress tests and western blot analyses were
conducted on C2C12 myotubes exposed to increasing MEHP concentrations.
Results: Increased urinary MEHP in women with obesity was associated with increased
plasma arachidonic and gamma-linolenic acid levels. Furthermore, C2C12 myotubes exposed
to increasing MEHP concentrations, displayed decreased fatty acid oxidation and
mitochondrial bioenergetics, and displayed increased basal glycolytic levels. Hexokinase II
protein levels were also upregulated with increasing MEHP exposure in C2C12 myotubes.
However, ACSL5 protein expression levels remained constant in MEHP treated myotubes.
Conclusion: MEHP exposure suggests an alteration of fatty acid utilization at the whole-body
level in women with obesity and fatty acid and glucose utilization in muscle cells. This
suggested that women with obesity may be susceptible to the effects of MEHP by increasing
their risks for fatty acid and glucose metabolic alteration.
Keywords: MEHP, toxicity, mitochondrial bioenergetics, metabolism
Page 138
120
4.3 INTRODUCTION
Obesogens are defined as chemical compounds that contribute towards impaired lipid
metabolism, dysregulation of adipogenesis, and consequently, may contribute to the
development of obesity (Grün & Blumberg, 2006). One of these obesogens, di(2-ethylhexyl)
phthalate (DEHP), is one of the primary phthalate plasticizers used in North America, and is
commonly found in food packaging and medical devices (Environment Canada Health
Canada, 1994; US Food and Drug Administration, 2001). DEHP is non-covalently bound into
matrices and therefore can leach into the human body and be metabolised via lipases into
mono-(2ethyl hexyl) phthalate (MEHP), the major form which is absorbed (Koch et al.
2006).While the average tolerable intake for DEHP is 5.8-19 µg/kg/day, individuals exposed
to a medical environment can exceed the average daily intake with an increase of ten-fold by
the end of cardiopulmonary bypass in adults (Barry et al. 1989; Environment Canada Health
Canada, 1994; Kavlock et al. 2002).
Previous human population studies in women and men, have reported a positive association
between urinary phthalate metabolites including MEHP and mono(2-ethyl-5-hydroxyhexyl)
phthalate (MEHHP) with obesity, while also demonstrating a positive correlation between
DEHP exposure (measured via urinary metabolites) and BMI, waist circumference and
adiposity within children (Buser et al. 2014; Deierlein et al., 2016; Smerieri et al., 2015;
Stahlhut et al. 2007). Studies have also illustrated higher urinary MEHP to MEHHP ratio
within women with greater BMI, suggesting a slower rate of oxidative metabolism of the
toxicant (Yaghjyan et al., 2015). A decrease in MEHHP, a product of MEHP oxidation, may
be a result of a decrease in activity of selected P450 enzymes, which might affect phthalate
Page 139
121
metabolism (Yaghjyan et al., 2015). This may result in the alteration of fatty acid utilization
(Yaghjyan et al., 2015) pointing out the importance of studying the effects of MEHP in
subjects with obesity.
Studies have shown that elevated intra-myocellular accumulation of lipids in skeletal muscle
of subjects with obesity, is a consequence of reduced fatty acid oxidation which contributes
towards insulin resistance (Kelley et al. 1999). Rodent and human studies have both illustrated
how chronic high fat feeding can lead to elevated incomplete β oxidation, and impairment in
mitochondrial oxidative phosphorylation and biogenesis (Koves et al., 2008; Muoio &
Newgard, 2008; Schrauwen, 2007; Sparks et al., 2005). Furthermore, rats exposed to increased
dietary fat and sucrose, showed a decrease in muscle type-specific mitochondrial production
of ATP (Chanseaume et al., 2006; Chanséaume & Morio, 2009). However, more recent
evidence has suggested a link between insulin resistance and muscle mitochondrial
dysfunction (Aguer & Harper, 2012; DeFronzo & Tripathy, 2009; Mogensen et al., 2007;
Petersen et al. 2004; Phielix et al., 2008). Thus, the following studies imply the alteration of
muscle mitochondrial bioenergetics during the development of chronic diseases such as
obesity, highlighting the importance of studying this tissue.
While little is known about the effects of MEHP on human skeletal muscle, studies have
shown a decrease in muscle strength in the elderly with increasing urinary MEHP, which was
hypothesized to be a result of MEHP-induced oxidative stress and inflammation (Kim et al.
2016). Furthermore, Corbasson et al. 2016 illustrated an association between increased urinary
MEHP and decreased lean mass in adults, where lean mass excluded bone mineral content,
thus primarily representing muscle mass (Corbasson et al. 2016). Studies in rats exposed to
DEHP have illustrated a reduction in glucose oxidation and glucose/lactate transport within
Page 140
122
muscle and impairment in insulin receptor and GLUT4 gene expression levels in L6 muscle
cells (Martinelli et al. 2006; P Rajesh & Balasubramanian, 2014; Parsanathan Rajesh &
Balasubramanian, 2014). While adipocytes have been studied extensively and results have
demonstrated altered adipocyte lipid metabolism and mitochondrial respiration, little is known
about the cellular and molecular effects of MEHP on skeletal muscle fatty acid and glucose
metabolism as well as mitochondrial energetics.
Thus, we aimed to determine 1) the association between MEHP and plasma fatty acid levels
in women with obesity who participated in the National Health and Nutrition Examination
Survey (NHANES) 2003-2004 study. 2) the in vitro effects of MEHP on fatty acid and glucose
utilization and on mitochondrial energetics in C2C12 mouse myotubes.
4.4 Material and Methods
NHANES 2003-2004 Study Data Analysis
The NHANES study has been previously described (CDC National Center for Health
Statistics., 2017). Briefly, NHANES is an American based survey designed to study the health
and nutritional status of both adults and children in United States. NHANES provides
extensive data on demographic, dietary and biological laboratory/body measurements.
Because the continuous NHANES survey for 2003-2004 was the most recent survey that
provided data on plasma fatty acid levels, we selected this population for our secondary
statistical analyses. Human population statistical analyses focused on studying women with
obesity (BMI ≥ 30kg/m2).
Studied variables have been previously described (CDC National Center of Health Statistics.,
n.d.-a). BMI was measured using standard calculations (weight in kg/ height in m2). Urinary
MEHP was measured using high performance liquid chromatograph-electrospray ionization-
Page 141
123
tandem mass spectrometry (HPLC-ESI-MS/MS) using isotopically-labeled phthalate
metabolites as internal standards . Plasma fatty acid levels were measured as previously
described, from 100µl of plasma obtained from individuals who had fasted for ≥ 8 hours.
NHANES 2003-2004 Study Statistical Analyses
Backward stepwise regression analyses were conducted to study the association between
urinary MEHP and plasma fatty acid levels. Covariates that were included within the
regression models, were continuous variables (age and BMI), and categorical variable
(ethnicity: Non-Hispanic White, non-Hispanic Black, Mexican American and other Hispanic).
Ethnicity was coded by dummy variables while using non-Hispanic White as the reference
level. Urinary MEHP was also included to study whether it was a significant factor for plasma
fatty acid levels. Prior to conducting the statistical analyses, one extreme outlier, based on
standard deviation (SD) = 3, was found for urinary MEHP levels and removed from data
analysis. Independent variables considered in the regression analyses were also weighted by
using sample weight values provided by NHANES. Cohen’s f2 value was calculated, to
measure the effect size for each of the independent variables. Descriptive statistics was also
conducted to determine the mean, SD and total participants (n), for all dependent variables
studied. All statistical analyses were conducted using Minitab software 17, while a p
value<0.05 was considered statistically significant.
Cell Culture
The C2C12 mouse myoblast cell line (ATCC® CRL-1772™) was grown in standard
Dulbecco’s modification Eagle’s medium (DMEM; Gibco) containing 10% Bovine Serum
(BS; Gibco), 1% L-glutamine (Life Technologies) and 1% penicillin/streptomycin (Life
Page 142
124
Technologies). C2C12 cells were differentiated into myotubes for 7 days in DMEM
supplemented with 2% BS.
MEHP Exposure
MEHP (Accu Standard- please see company’s precautionary and hazard statements for proper
use of chemical) acute exposure design consisted of either C2C12 myoblasts or myotubes
exposed to 10, 50, 100 and 300 µM of MEHP (in 0.1% DMSO) for 24 hours. Concentrations
of MEHP used were physiologically relevant and previously published by Chiang et al. 2016.
MEHP solutions were added into culture medium. Cells exposed to 0.1% DMSO and untreated
cells served as controls.
MEHP Cytotoxicity Test
C2C12 myotubes were exposed to MEHP (10,100 and 300 µM of MEHP) for 24 hours with
n=3 independent experiments. 1:500 dilution of Propidium Iodide (Sigma; 1mg/ml) and
1:1000 dilution of Hoechst® 33342 (ThermoFisher; 5mg/ml) were added and mixed into
culture medium. Following 10 min incubation at 37°C, cells were imaged using the Zeiss Axio
Observer D1 Inverted Dic Fluorescence Microscope (20x, 0.80 NA, Air, Plan-Apo (DIC II)
Objective; Blue (Ex:390/22 Em:460/50) and Red (Ex:560/40 Em:630/75)).
14C-Palmitic acid Oxidation Experiment
Following 24 hour exposure of C2C12 myotubes in a 12-well plate to 10, 100 and 300
µM of MEHP, total palmitic oxidation was assessed using 14C-palmitic acid as described
previously (Aguer et al., 2013). Briefly, ASP (acid-soluble products) from both culture
medium and cells were extracted (Glatz, Jacobs, & Veerkamp, 1984; Kitzmann et al., 2011;
Veerkamp, Van Moerkerk, Glatz, & Van Hinsbergh, 1983). The remainder of the medium in
Page 143
125
the glass vials containing benzethonium hydroxide was used for determining CO2 production.
Prior to scintillation counting in a PERKIN ELMER Tri-Carb 2910 TR liquid scintillation
counter, all experimental vials were incubated overnight in the dark at room temperature.
Three experiments were conducted (n=3). Total fatty acid oxidation = CO2 produced + ASP
measured from cells and culture medium. All values were adjusted to protein concentration
which was determined using the Biorad Protein Assay Dye Reagent.
Mitochondrial Respiration Measurement from Seahorse Mitochondrial Stress Test, Glycolysis
Stress Test and Fatty Acid Oxidation Test
Following exposure of C2C12 myotubes to 10, 50, 100 and 300 µM concentrations of
MEHP for 24 hours in a 96-well Seahorse plate, mitochondrial stress test, glycolysis stress test
and fatty acid oxidation tests were conducted following the Agilent company protocol. The
50µM concentration was only used for mitochondrial stress test and glycolysis stress test. As
we were only interested in measuring total fatty acid oxidation, etomoxir addition was omitted
from the protocol. Prior to initiating the Seahorse XF assay, 30 µl of palmitate-BSA (stock
concentration: 1 mM) or BSA (stock concentration: 0.17 mM) as control were added into the
appropriate wells. Final concentrations for drugs utilized in the fatty acid oxidation and
mitochondrial stress test were: oligomycin (3µM); Carbonyl cyanide 4-(trifluoromethoxy)
phenylhydrazone (FCCP; 2µM), antimycin (4µM), rotenone (5.6µM). Final concentrations for
drugs utilized in the glycolysis stress test were oligomycin (3 µM) and FCCP (2 µM), glucose
(100mM) and 2-deoxy-D-glucose (2-DG; 1M). All experimental results were normalized to
results from control untreated cells. Three independent experiments were conducted for
mitochondrial stress test, 5 for glycolysis stress test and 3 for fatty acid oxidation test.
Page 144
126
Western Blot Analysis
Active Motif nuclear kit- “Preparation of Whole Cell Extract from Cells” protocol was
utilised for the extraction of whole cell proteins from C2C12 cells exposed to MEHP (10, 50,
100, 150, 300 µM) for 24 hours, with n=3 independent experiments. Protein concentrations
were measured using the Pierce™ BCA Protein Assay Kit (Thermo Scientific).
A standard western blot protocol was implemented using 12% SDS-PAGE gels. All primary
and secondary antibodies were prepared in 5% BSA-PBST. Membrane was incubated with
the following primary antibodies: ACSL5 goat polyclonal IgG 1:200 (SantaCruz; sc47999),
GAPDH rabbit polyclonal IgG 1:15000 (Abcam; ab22555), B-actin mouse monoclonal IgG
1:1000 (SantaCruz; sc47778), hexokinase I mouse monoclonal IgG 1:1500 (Abcam;
ab105213), hexokinase II rabbit monoclonal IgG 1:1000 (Cell Signalling C64G5); Tom20
rabbit polyclonal IgG 1:1000 (SantaCruz; sc-11415). Secondary antibodies used were rabbit
anti-goat IgG-HRP 1:5000 (SantaCruz; sc2768), goat anti-rabbit IgG-HRP 1:5000 (SantaCruz;
sc2004), and goat anti-mouse IgG-HRP 1:5000 (SantaCruz; sc2031). Amersham ECL prime
western blotting detection reagent and VersaDoc MP 4000 system (Biorad) with the Quantity
One 4.6.9 Software (Chemi Hi Sensitivity 0.5x Gain Application) were used to detect and
analyzed protein bands. As there was an increased variation in protein band intensity between
the different western blot membranes for the C2C12 myoblasts exposed to MEHP, the
following western blot quantitative analyses were normalized to results from untreated control
cells, to minimize error.
C2C12 In Vitro Studies Statistical Analyses
One-Way Anova statistical analyses was conducted using Minitab 16 software.
Page 145
127
4.5 RESULTS
MEHP and plasma omega-6 fatty acid levels in women with obesity participating in the
NHANES 2003-2004 Study
Participant’s characteristics are presented in Table 1. While the majority of the plasma omega-
6 fatty acid levels didn’t display a significant association with increasing urinary MEHP, a
positive association was observed between urinary MEHP levels and gamma-linolenic acid
(0.436 ± SE: 0.182; p=0.019) as well as arachidonic acid (7.62 ± SE: 1.73; p=0.000) in women
with obesity (Table 2). Furthermore, r2 adjusted model value explained 35% of the individual
variation observed in arachidonic acid levels. Interestingly, it is MEHP which has the largest
effect size (f2=0.212) in the linear model explaining variance in plasma arachidonic acid levels.
However, while r2 adjusted model value explained 24% of the individual variation observed
in gamma-linolenic acid levels with a major influence of ethnicity, MEHP still influenced the
model with an effect size of f2=0.056.
Previous work on the role of arachidonic acid metabolites have illustrated their roles in skeletal
muscle tissue physiology including myogenesis (Prisk & Huard, 2003; Sun, Ba, Cui, Xue, &
Zeng, 2009). Furthermore, as arachidonic acid is a key component of membrane and cytosolic
phospholipids of mammalian cells, we decided to study the effects of MEHP in C2C12 mouse
muscle cells (Tallima & El Ridi, 2017).
Evaluation of MEHP cytotoxicity on C2C12 cells
Prior to studying the effects of increasing concentrations of MEHP on C2C12 myotubes, its
cytotoxicity was studied. There was no significant difference in the number of apoptotic and
necrotic cells with increasing concentrations of MEHP exposure on C2C12 myotubes,
Page 146
128
measured by condensed nuclei and PI positive cells (Figure 1). Furthermore, cell death always
remained below 5% of the cell population.
The effects of MEHP on exogenous fatty acid oxidation and mitochondrial respiration in
C2C12 myotubes
To characterize the metabolic effects of MEHP, 14C-palmitic acid oxidation as well as
palmitate-induced respiration were studied in C2C12 myotubes. There was an overall decrease
in total fatty acid oxidation following the exposure of myotubes to increasing concentrations
of MEHP (Figure 2a). Specifically, a decrease was observed between the control 0.1% DMSO
(1.183 nmol/hr/mg ± 0.035) and MEHP exposed cells of 10 µM (1.033 nmol/hr/mg ± 0.048),
100 µM MEHP (1.076 nmol/hr/mg ± 0.012) and the highest concentration 300 µM MEHP
(1.034 nmol/hr/mg ± 0.022). This reduction in fatty acid oxidation level, was accompanied by
a reduction in both maximal respiration as well as spare capacity when studying the muscle
cell effects of MEHP on oxygen consumption rate (OCR) (Figure 2b and c). Specifically, a
decrease in maximal respiration was observed between 10 µM (1.75 pmol/min/µg ± 0.382)
and higher concentrations of 100 µM (0.62 pmol/min/µg ± 0.263) and 300 µM MEHP (0.60
pmol/min/µg ± 0.466). A decrease was also observed in spare capacity, between 0.1% DMSO
(1.87 pmol/min/µg ± 0.121), 10 µM (1.85 pmol/min/µg ± 0.177) and the higher concentrations
of MEHP, 100 µM (1.10 pmol/min/µg ± 0.279) and 300 µM (0.65 pmol/min/µg ± 0.281). No
differences in basal respiration was observed between C2C12 myotube exposure to different
MEHP concentrations. Furthermore, metabolic effects were only observed during fatty acid-
driven oxidation, as mitochondrial stress test illustrated no differences with exposure to
increasing concentrations of MEHP (Supplementary Figure 1).
Page 147
129
The effects of MEHP on cellular glycolysis levels
Based on altered fatty acid metabolism in C2C12 myotubes exposed to MEHP, the effects of
the toxicant on glucose utilization, specifically, extracellular acidification rate (ECAR) was
studied. ECAR measured by mitochondrial stress test, illustrated a trend towards an increase
in basal glycolysis levels following increased exposure to MEHP, reaching significance
between 50 (0.89 ± 0.12) and 300 µM (1.25 ± 0.0674) MEHP (Supplementary Figure 1).
Furthermore, ECAR measured by the glycolysis stress test in C2C12 myotubes, also illustrated
a significant increase in basal glycolysis levels between 0.1% DMSO control (1.10 ± 0.097)
and 300 µM MEHP (1.40 ± 0.135) (Figure 3).
The effects of MEHP on metabolism related proteins
After examining the effects of MEHP exposure on muscle fatty acid and glucose
utilization/metabolism, we studied the toxicant’s effect on metabolism-related protein
expression. Hexokinase II, a rate-controlling step in glycolysis and ACSL5, a key protein in
fatty acyl-CoA activation from free fatty acids were studied. A significant increase in
hexokinase II was observed with increasing concentrations of MEHP exposure on C2C12
myotubes (Figure 4). Specifically, a significant increase in hexokinase II was observed
between DMSO control (Volume Intensity: 2.18 ± 0.091) or 10 µM MEHP (Volume Intensity:
2.28 ± 0.116) and 100 µM MEHP (Volume Intensity: 3.17 ± 0.452). This increase however
was not significant in myotubes exposed to 300 µM MEHP. Increasing the exposure of C2C12
myotubes to MEHP appeared to have no effect on ACSL5. Furthermore, there was a decrease
in ACSL5 levels with increasing MEHP in myoblasts (Supplementary Figure 2), specifically
between 10 µM (Volume Intensity: 1.00 ± 0.131) and higher concentrations 100 µM (Volume
Intensity: 0.464 ± 0.237) and 300 µM MEHP (Volume Intensity: 0.467 ± 0.201) when adjusted
Page 148
130
for 0.1% DMSO control. These results reveal alteration in ACSL5 levels in myoblasts exposed
to MEHP toxicant.
4.6 DISCUSSION
MEHP, is the monoester hydrolyzed form of the plasticizer DEHP. While much is known
about the metabolic effects of MEHP on the general population, how this toxicant influences
the metabolism of an individual with obesity remains to be elucidated. Studies have shown
that individuals with obesity have elevated intra-myocellular accumulation of lipids in skeletal
muscle, in part due to a reduction in fatty acid oxidation thus contributing towards insulin
resistance (Kelley et al. 1999). As previous research by Corbasson et al. 2016, has illustrated
an inverse association between increased urinary MEHP and lean mass (which excluded bone
mineral content, thus primarily muscle mass), our research was focused on studying the effects
of MEHP on muscle cell metabolism. Our results implicate an alteration in glucose and fatty
acid utilization by MEHP in muscle cells as well as suggest changes in specific fatty acid
utilization at the whole-body level in individuals with obesity.
Our secondary data statistical analyses focused on assessing the association between urinary
MEHP and plasma fatty acid levels, given that previous studies illustrated that increased
DEHP exposure is reflected in urinary levels of the monoester derivative (Green et al., 2005).
As we were interested in analysing the effects of MEHP on fatty acid transport and
mitochondrial oxidation alteration, we used plasma fatty acid levels as a proxy for
mitochondrial bioenergetic function (Lagerstedt et al., 2001). Specifically, previous
prospective studies have shown increased omega-6 fatty acids from erythrocyte and increased
omega-6: omega-3 ratio in cord plasma phospholipids to be associated with obesity and weight
gain (Donahue et al., 2011; Wang et al., 2016). Our results showed a positive association
Page 149
131
between plasma levels of gamma-linolenic acid and arachidonic acid with urinary MEHP
levels. Furthermore, we observed that MEHP has a large effect on plasma arachidonic acid
levels. Arachidonic acid, is known to produce the metabolites prostaglandins and leukotrienes,
involved in myogenesis, as well as muscular inflammation and repair (Korotkova & Lundberg,
2014). Interestingly, increased dietary omega-6 fatty acid levels including arachidonic acid,
have also been associated with insulin resistance, leptin resistance and decreased
mitochondrial biogenesis (Cheng et al., 2015; Massiera et al., 2010; Phillips et al., 2010;
Pisani, Amri, & Ailhaud, 2015; Simopoulos, 2013; Simopoulos, Bourne, & Faergeman, 2013).
A recent study by Markworth et al. illustrated how resistant trained men who received
increased supplementation of dietary arachidonic acid had increased plasma arachidonic acid
and gamma linolenic acid levels (Markworth et al., 2018). Furthermore, an increase in
arachidonic acid in muscle was also observed, paralleled by increased mRNA levels of MyoD
and myogenin (Markworth et al., 2018). However, as our secondary statistical analyses
included esterified fatty acids that are found in the phospholipids, triglycerides and cholesterol
esters, increased levels of arachidonic acid and gamma-linolenic acid that we observed with
increased urinary MEHP, may also relate to increase in fatty acids channeled towards lipid
biosynthesis. Regardless, our findings suggest an alteration of both fatty acid metabolism and
utilization of fatty acids at the whole-body level with increased urinary MEHP levels. Due to
a potential disruption in their enzymatic activity of MEHP oxidizing cytochrome P450
enzymes, individuals with obesity may be more susceptible to fatty acid metabolic alteration
caused by MEHP, as compared to healthy individuals (Yaghjyan et al., 2015). Consequently,
this could make them more prone to metabolic dysfunction. However, this will need to be
confirmed by future studies.
Page 150
132
Based on the known effect of arachidonic acid on skeletal muscle growth and function, as well
as our secondary analyses illustrating urinary MEHP’s positive association with plasma levels
of arachidonic acid, we studied the effects of MEHP on muscle cells. Previous work conducted
by Feige et al. 2007 illustrated a dose-dependent activation of a PPARγ receptor element
(PPRE)-firefly luciferase reporter, in the presence of adipogenic transcription factor PPARγ
when C2C12 cells were exposed to MEHP, suggesting the toxicant’s potential PPARγ agonist
effects (Feige et al., 2007). Interestingly, from our results, C2C12 myotube’s exposure to
increased concentrations of MEHP, resulted in a decrease in total fatty acid oxidation levels.
Furthermore, this decrease was paralleled with a disruption in mitochondrial respiration,
particularly a decrease in maximal respiration and spare capacity measured by oxygen
consumption rate. Thus, exposure of C2C12 myotubes to increasing concentrations of MEHP
alters fatty acid oxidation and oxidative phosphorylation pathway. Previous research have
demonstrated an upregulation of 3T3-L1 adipocyte respiration with increased exposure to
MEHP, while exposure of isolated rat liver mitochondria to MEHP showed an inhibition in
palmitic acid oxidation as well a reduction in overall mitochondrial respiration (Chiang et al.,
2016; Winberg & Badr, 1995). This illustrates MEHP’s tissue-specific effect on mitochondrial
respiration and fatty acid metabolism.
In regard to glucose metabolism, a significant increase in basal glycolysis was observed
between control cells and cells exposed to 300µM MEHP. This increase in basal glycolysis,
primarily representing the production of lactate, illustrates an alteration in glucose utilization
which supports previous work in other tissues and species. Particularly, impairment in glucose
oxidation has been observed in Chang liver cells and insulin-stimulated L6 rat myotubes with
Page 151
133
exposure to increasing concentrations of DEHP and MEHP (Rengarajan et al. 2007;
Viswanathan et al. 2017).
Previous findings illustrated a significant increase in leg muscle glucose oxidation within
patients with T2D versus non-diabetics (Kelley & Mandarino, 1990). This dysfunction in basal
muscle metabolism was believed to contribute to systemic basal metabolic abnormalities in
individuals with T2D (Kelley & Mandarino, 1990). Thus, linking MEHP’s in vitro fatty acid
metabolic changes to the toxicant’s effects on in vivo fatty acid utilization can be justified.
Hexokinase II, the key enzyme responsible for the conversion of glucose to glucose-6-
phosphate and the abundant form in skeletal muscle, was found to be upregulated with
exposure of C2C12 myotubes to increasing levels of MEHP. This increase in hexokinase II
may contribute to the increased glycolysis observed with exposure of C2C12 myotubes to
MEHP. While ACSL5 protein levels remained constant in C2C12 myotubes exposed to
MEHP, a significant decrease in ACSL5 protein expression levels was observed within
myoblasts. ACSL5 contributes towards the conversion of long-chain free fatty acids to fatty-
acyl CoA. The decreased in expression of this key protein within myoblasts, may contribute
to altered fatty acid metabolism in proliferative cells. However, this needs to be confirmed by
further studies.
The present study focuses on the effects of MEHP at both the cellular and whole-body level,
in women with obesity. To our knowledge, this is the first study to observe the effects of
MEHP on plasma omega-6 fatty acid (gamma-linolenic acid and arachidonic acid) levels in
women with obesity. Future work includes studying the metabolic effects of MEHP in men
with obesity.
Page 152
134
In conclusion, our current results expands our knowledge on the effects of MEHP on cellular
and whole-body metabolism. Increased MEHP exposure contributes towards metabolic
dysfunction at both the muscle cell and whole-body level, supporting previous studies on the
influence of basal muscle metabolism on systemic metabolic abnormalities in individuals with
insulin resistance and glucose metabolism dysregulation. Hence, women with obesity may be
more susceptible to the metabolic effects of MEHP.
4.7 REFERENCES
Aguer, C., Fiehn, O., Seifert, E. L., Bézaire, V., Meissen, J. K., Daniels, A., … Harper, M. E.
(2013). Muscle uncoupling protein 3 overexpression mimics endurance training and
reduces circulating biomarkers of incomplete β-oxidation. FASEB Journal, 27(10),
4213–4225. https://doi.org/10.1096/fj.13-234302
Aguer, C., & Harper, M.-E. (2012). Skeletal muscle mitochondrial energetics in obesity and
type 2 diabetes mellitus: Endocrine aspects. Best Practice & Research Clinical
Endocrinology & Metabolism, 26(6), 805–819.
https://doi.org/10.1016/j.beem.2012.06.001
Barry, Y. A., Labow, R. S., Keon, W. J., Tocchi, M., & Rock, G. (1989). Perioperative
exposure to plasticizers in patients undergoing cardiopulmonary bypass. The Journal of
Thoracic and Cardiovascular Surgery, 97(6), 900–5. Retrieved from
http://www.ncbi.nlm.nih.gov/pubmed/2657224
Boushel, R., Gnaiger, E., Schjerling, P., Skovbro, M., Kraunsøe, R., & Dela, F. (2007).
Patients with type 2 diabetes have normal mitochondrial function in skeletal muscle.
Diabetologia, 50(4), 790–796. https://doi.org/10.1007/s00125-007-0594-3
Buser, M. C., Murray, H. E., & Scinicariello, F. (2014). Age and sex differences in childhood
and adulthood obesity association with phthalates: Analyses of NHANES 2007-2010.
International Journal of Hygiene and Environmental Health, 217(6), 687–694.
https://doi.org/10.1016/j.ijheh.2014.02.005
CDC National Center for Health Statistics. (2017). National Health and Nutrition Examination
Survey. Retrieved August 1, 2017, from
http://www.cdc.gov/nchs/nhanes/nhanes_questionnaires.htm.
CDC National Center of Health Statistics. (n.d.-a). NHANES 2003-2004 Lab Methods.
Retrieved August 1, 2017, from
https://wwwn.cdc.gov/nchs/nhanes/continuousnhanes/labmethods.aspx?BeginYear=200
3
Chanseaume, E., Malpuech-Brugere, C., Patrac, V., Bielicki, G., Rousset, P., Couturier, K.,
Page 153
135
… Morio, B. (2006). Diets High in Sugar, Fat, and Energy Induce Muscle Type-Specific
Adaptations in Mitochondrial Functions in Rats. Journal of Nutrition, 136(8), 2194–
2200. Retrieved from http://jn.nutrition.org/cgi/content/abstract/136/8/2194
Chanséaume, E., & Morio, B. (2009). Potential mechanisms of muscle mitochondrial
dysfunction in aging and obesity and cellular consequences. International Journal of
Molecular Sciences. https://doi.org/10.3390/ijms10010306
Cheng, L., Yu, Y., Zhang, Q., Szabo, A., Wang, H., & Huang, X. F. (2015). Arachidonic acid
impairs hypothalamic leptin signaling and hepatic energy homeostasis in mice.
Molecular and Cellular Endocrinology, 412, 12–18.
https://doi.org/10.1016/j.mce.2015.04.025
Chiang, H. chih, Kuo, Y. T., Shen, C. C., Lin, Y. H., Wang, S. L., & Tsou, T. C. (2016).
Mono(2-ethylhexyl)phthalate accumulation disturbs energy metabolism of fat cells.
Archives of Toxicology, 90(3), 589–601. https://doi.org/10.1007/s00204-014-1446-9
Corbasson, I., Hankinson, S. E., Stanek, E. J., & Reeves, K. W. (2016). Urinary bisphenol-A,
phthalate metabolites and body composition in US adults, NHANES 1999–2006.
International Journal of Environmental Health Research, 26(5–6), 606–617.
https://doi.org/10.1080/09603123.2016.1233524
DeFronzo, R. A., & Tripathy, D. (2009). Skeletal muscle insulin resistance is the primary
defect in type 2 diabetes. Diabetes Care. https://doi.org/10.2337/dc09-S302
Deierlein, A. L., Wolff, M. S., Pajak, A., Pinney, S. M., Windham, G. C., Galvez, M. P., …
Teitelbaum, S. L. (2016). Longitudinal Associations of Phthalate Exposures During
Childhood and Body Size Measurements in Young Girls. Epidemiology, 27(4), 492–499.
https://doi.org/10.1097/EDE.0000000000000489
Donahue, S. M. A., Rifas-Shiman, S. L., Gold, D. R., Jouni, Z. E., Gillman, M. W., & Oken,
E. (2011). Prenatal fatty acid status and child adiposity at age 3 y: results from a US
pregnancy cohort. The American Journal of Clinical Nutrition, 93(4), 780–8.
https://doi.org/10.3945/ajcn.110.005801
Environment Canada Health Canada. (1994). Canadian Environmental Protection Act- Bis-
(2-ethylhexyl) phthalate. Retrieved July 10, 2017, from
https://www.canada.ca/en/health-canada/services/environmental-workplace-
health/reports-publications/environmental-contaminants/canadian-environmental-
protection-act-priority-substances-list-report-2-ethylhexyl-pthalate.html#a5
Feige, J. N., Gelman, L., Rossi, D., Zoete, V., Métivier, R., Tudor, C., … Desvergne, B.
(2007). The endocrine disruptor monoethyl-hexyl-phthalate is a selective peroxisome
proliferator-activated receptor γ modulator that promotes adipogenesis. Journal of
Biological Chemistry, 282(26), 19152–19166. https://doi.org/10.1074/jbc.M702724200
Glatz, J. F., Jacobs, A. E., & Veerkamp, J. H. (1984). Fatty acid oxidation in human and rat
heart. Comparison of cell-free and cellular systems. Biochim Biophys Acta, 794(3), 454–
465. Retrieved from
http://www.ncbi.nlm.nih.gov/entrez/query.fcgi?cmd=Retrieve&db=PubMed&dopt=Cit
ation&list_uids=6430348
Page 154
136
Green, R., Hauser, R., Calafat, A. M., Weuve, J., Schettler, T., Ringer, S., … Hu, H. (2005).
Use of di(2-ethylhexyl) phthalate-containing medical products and urinary levels of
mono(2-ethylhexyl) phthalate in neonatal intensive care unit infants. Environmental
Health Perspectives, 113(9), 1222–1225. https://doi.org/10.1289/ehp.7932
Grün, F., & Blumberg, B. (2006). Environmental obesogens: Organotins and endocrine
disruption via nuclear receptor signaling. Endocrinology.
https://doi.org/10.1210/en.2005-1129
Kavlock, R., Boekelheide, K., Chapin, R., Cunningham, M., Faustman, E., Foster, P., Golub,
M., Henderson, R., Hinberg, I., Little, R., et al. (2002). NTP Center for the Evaluation
of Risks to Human Reproduction: Phthalates expert panel report on the reproductive and
developmental toxicity of di(2-ethylhexyl) phthalate. Reprod. Toxicol., 16, 529–653.
Kelley, D. E., Goodpaster, B., Wing, R. R., & Simoneau, J. A. (1999). Skeletal muscle fatty
acid metabolism in association with insulin resistance, obesity, and weight loss. Am J
Physiol, 277(6 Pt 1), E1130-41.
Kelley, D. E., & Mandarino, L. J. (1990). Hyperglycemia normalizes insulin-stimulated
skeletal muscle glucose oxidation and storage in noninsulin-dependent diabetes mellitus.
Journal of Clinical Investigation, 86(6), 1999–2007. https://doi.org/10.1172/JCI114935
Kim KN, Lee MR, Choi YH, Hwang H, Oh SY, Park C, H. Y. (2016). Association between
phthalate exposure and lower handgrip strength in an elderly population: a repeated-
measures study. Environmental Health, 15(1), 93.
Kitzmann, M., Lantier, L., Hébrard, S., Mercier, J., Foretz, M., & Aguer, C. (2011). Abnormal
metabolism flexibility in response to high palmitate concentrations in myotubes derived
from obese type 2 diabetic patients. Biochimica et Biophysica Acta - Molecular Basis of
Disease, 1812(4), 423–430. https://doi.org/10.1016/j.bbadis.2010.12.007
Koch, H. M., Preuss, R. and Angerer, J. (2006). Di(2-ethylhexyl)phthalate (DEHP): human
metabolism and internal exposure – an update and latest results. International Journal of
Andrology, 29, 155–165.
Korotkova, M., & Lundberg, I. E. (2014). The skeletal muscle arachidonic acid cascade in
health and inflammatory disease. Nature Reviews Rheumatology.
https://doi.org/10.1038/nrrheum.2014.2
Koves, T. R., Ussher, J. R., Noland, R. C., Slentz, D., Mosedale, M., Ilkayeva, O., … Muoio,
D. M. (2008). Mitochondrial Overload and Incomplete Fatty Acid Oxidation Contribute
to Skeletal Muscle Insulin Resistance. Cell Metabolism, 7(1), 45–56.
https://doi.org/10.1016/j.cmet.2007.10.013
Lagerstedt, S. A., Hinrichs, D. R., Batt, S. M., Magera, M. J., Rinaldo, P., & McConnell, J. P.
(2001). Quantitative Determination of Plasma C8–C26 Total Fatty Acids for the
Biochemical Diagnosis of Nutritional and Metabolic Disorders. Molecular Genetics and
Metabolism, 73(1), 38–45. https://doi.org/10.1006/mgme.2001.3170
Larsen, S., Ara, I., Rabøl, R., Andersen, J. L., Boushel, R., Dela, F., & Helge, J. W. (2009).
Are substrate use during exercise and mitochondrial respiratory capacity decreased in
Page 155
137
arm and leg muscle in type 2 diabetes? Diabetologia, 52(7), 1400–1408.
https://doi.org/10.1007/s00125-009-1353-4
Markworth, J. F., Mitchell, C. J., D’Souza, R. F., Aasen, K. M. M., Durainayagam, B. R.,
Mitchell, S. M., … Cameron-Smith, D. (2018). Arachidonic acid supplementation
modulates blood and skeletal muscle lipid profile with no effect on basal inflammation
in resistance exercise trained men. Prostaglandins Leukotrienes and Essential Fatty
Acids, 128, 74–86. https://doi.org/10.1016/j.plefa.2017.12.003
Martinelli, M. I., Mocchiutti, N. O., & Bernal, C. A. (2006). Dietary di(2-ethylhexyl)phthalate-
impaired glucose metabolism in experimental animals. Human & Experimental
Toxicology, 25(9), 531–538. https://doi.org/Doi 10.1191/0960327106het651oa
Massiera, F., Barbry, P., Guesnet, P., Joly, A., Luquet, S., Moreilhon-Brest, C., … Ailhaud,
G. (2010). A Western-like fat diet is sufficient to induce a gradual enhancement in fat
mass over generations. Journal of Lipid Research, 51(8), 2352–2361.
https://doi.org/10.1194/jlr.M006866
Mogensen, M., Sahlin, K., Fernstrom, M., Glintborg, D., Vind, B. F., Beck-Nielsen, H., &
Hojlund, K. (2007). Mitochondrial respiration is decreased in skeletal muscle of patients
with type 2 diabetes. Diabetes, 56(6), 1592–1599. https://doi.org/10.2337/db06-0981
Muoio, D. M., & Newgard, C. B. (2008). Mechanisms of disease: molecular and metabolic
mechanisms of insulin resistance and beta-cell failure in type 2 diabetes. Nature Reviews.
Molecular Cell Biology, 9(3), 193–205. https://doi.org/10.1038/nrm2327
Petersen, K. F., Dufour, S., Befroy, D., Garcia, R., & Shulman, G. I. (2004). Impaired
mitochondrial activity in the insulin-resistant offspring of patients with type 2 diabetes.
The New England Journal of Medicine, 350(7), 664–671.
https://doi.org/10.1056/NEJMoa031314
Phielix, E., Schrauwen-Hinderling, V. B., Mensink, M., Lenaers, E., Meex, R., Hoeks, J., …
Schrauwen, P. (2008). Lower intrinsic ADP-stimulated mitochondrial respiration
underlies in vivo mitochondrial dysfunction in muscle of male type 2 diabetic patients.
Diabetes, 57(11), 2943–2949. https://doi.org/10.2337/db08-0391
Phillips, C. M., Goumidi, L., Bertrais, S., Field, M. R., Ordovas, J. M., Cupples, L. A., …
Roche, H. M. (2010). Leptin receptor polymorphisms interact with polyunsaturated fatty
acids to augment risk of insulin resistance and metabolic syndrome in adults. The Journal
of Nutrition, 140(2), 238–244. https://doi.org/10.3945/jn.109.115329.with
Pisani, D. F., Amri, E.-Z., & Ailhaud, G. (2015). Disequilibrium of polyunsaturated fatty acids
status and its dual effect in modulating adipose tissue development and functions. OCL -
Oilseeds and Fats, Crops and Lipids, 22(4), 1–7. https://doi.org/10.1051/ocl/2015003
Prisk, V., & Huard, J. (2003). Muscle injuries and repair: The role of prostaglandins and
inflammation. Histology and Histopathology.
https://doi.org/papers3://publication/uuid/1BF165A4-B76C-420F-BFB3-
0AE6874BCBB2
Rabøl, R., Larsen, S., Højberg, P. M. V, Almdal, T., Boushel, R., Haugaard, S. B., … Dela, F.
Page 156
138
(2010). Regional anatomic differences in skeletal muscle mitochondrial respiration in
type 2 diabetes and obesity. The Journal of Clinical Endocrinology and Metabolism, 95,
857–863. https://doi.org/10.1210/jc.2009-1844
Rajesh, P., & Balasubramanian, K. (2014). Di(2-ethylhexyl)phthalate exposure impairs insulin
receptor and glucose transporter 4 gene expression in L6 myotubes. Human and
Experimental Toxicology, 33(7), 685–700. https://doi.org/10.1177/0960327113506238
Rajesh, P., & Balasubramanian, K. (2014). Phthalate exposure in utero causes epigenetic
changes and impairs insulin signalling. Journal of Endocrinology, 223(1), 47–66.
https://doi.org/10.1530/JOE-14-0111
Rengarajan, S., Parthasarathy, C., Anitha, M., & Balasubramanian, K. (2007). Diethylhexyl
phthalate impairs insulin binding and glucose oxidation in Chang liver cells. Toxicology
in Vitro, 21(1), 99–102. https://doi.org/10.1016/j.tiv.2006.07.005
Schrauwen, P. (2007). High-fat diet, muscular lipotoxicity and insulin resistance. Proceedings
of the Nutrition Society, 66(1), 33–41. https://doi.org/10.1017/S0029665107005277
Simopoulos, A. P. (2013). Dietary omega-3 fatty acid deficiency and high fructose intake in
the development of metabolic syndrome brain, metabolic abnormalities, and non-
alcoholic fatty liver disease. Nutrients. https://doi.org/10.3390/nu5082901
Simopoulos, A. P., Bourne, P. G., & Faergeman, O. (2013). Bellagio report on healthy
agriculture, healthy nutrition, healthy people. Nutrients, 5(2), 411–423.
https://doi.org/10.3390/nu5020411
Smerieri, A., Testa, C., Lazzeroni, P., Nuti, F., Grossi, E., Cesari, S., … Street, M. E. (2015).
Di-(2-ethylhexyl) phthalate metabolites in urine show age-related changes and
associations with adiposity and parameters of insulin sensitivity in childhood. PLoS ONE,
10(2). https://doi.org/10.1371/journal.pone.0117831
Sparks, L. M., Xie, H., Koza, R. A., Mynatt, R., Hulver, M. W., Bray, G. A., & Smith, S. R.
(2005). A high-fat diet coordinately downregulates genes required for mitochondrial
oxidative phosphorylation in skeletal muscle. Diabetes, 54(7), 1926–1933.
https://doi.org/10.2337/diabetes.54.7.1926
Stahlhut, R. W., van Wijngaarden, E., Dye, T. D., Cook, S., & Swan, S. H. (2007).
Concentrations of urinary phthalate metabolites are associated with increased waist
circumference and insulin resistance in adult U.S. males. Environmental Health
Perspectives, 115(6), 876–882. https://doi.org/10.1289/ehp.9882
Sun, R., Ba, X., Cui, L., Xue, Y., & Zeng, X. (2009). Leukotriene B4 regulates proliferation
and differentiation of cultured rat myoblasts via the BLT1 pathway. Molecules and Cells,
27(4), 403–408. https://doi.org/10.1007/s10059-009-0053-8
Tallima, H., & El Ridi, R. (2017). Arachidonic acid: Physiological roles and potential health
benefits - A review. Journal of Advanced Research.
https://doi.org/10.1016/j.jare.2017.11.004
US Food and Drug Administration. (2001). Safety assessment of Di-(2-ethylhexyl) phthalate
(DEHP) released from PVC medical devices. Center for Devices and Radiological
Page 157
139
Health, 119.
Veerkamp, J. H., Van Moerkerk, H. T., Glatz, J. F., & Van Hinsbergh, V. W. (1983).
Incomplete palmitate oxidation in cell-free systems of rat and human muscles.
Biochimica et Biophysica Acta, 753, 399–410.
Viswanathan, M. P., Mullainadhan, V., Chinnaiyan, M., & Karundevi, B. (2017). Effects of
DEHP and its metabolite MEHP on insulin signalling and proteins involved in GLUT4
translocation in cultured L6 myotubes. Toxicology, 386, 60–71.
https://doi.org/10.1016/j.tox.2017.05.005
Wang, L., Manson, J. E., Rautiainen, S., Gaziano, · J Michael, Buring, J. E., Tsai, M. Y., &
Sesso, H. D. (2016). A prospective study of erythrocyte polyunsaturated fatty acid,
weight gain, and risk of becoming overweight or obese in middle‑aged and older women.
European Journal of Nutrition, 55, 687–697. https://doi.org/10.1007/s00394-015-0889-
y
Winberg, L. D., & Badr, M. Z. (1995). Mechanism of phthalate-induced inhibition of hepatic
mitochondrial beta-oxidation. Toxicology Letters, 76(1), 63–9. Retrieved from
http://www.ncbi.nlm.nih.gov/pubmed/7701518
Yaghjyan, L., Sites, S., Ruan, Y., & Chang, S.-H. (2015). Associations of urinary phthalates
with body mass index, waist circumference and serum lipids among females: National
Health and Nutrition Examination Survey 1999-2004. International Journal of Obesity
(2005), 39(6), 994–1000. https://doi.org/10.1038/ijo.2015.8
Page 158
140
4.8 FIGURES
Figure 1: MEHP cytotoxicity in C2C12 myotubes - C2C12 seven-day differentiated
myotubes were exposed to varying concentrations of MEHP (10, 100 and 300 µM) for 24
hours followed by staining for Hoechst 33342 and Propidium Iodide (PI), both DNA staining
dyes. Cells that have undergone apoptosis would result in nuclei condensation which can be
detected via Hoechst 33342 while apoptotic and necrotic cells will be detected by PI which is
unable to cross the membrane of live cells. No significant difference in cytotoxicity was
detected between varying concentrations of MEHP exposure to C2C12 myotubes as seen on
bar graph with cell death being less than 5% for all conditions. Images were taken at 20x with
Zeiss AxioObserver.D1 Microscope (n=3; 6 images/condition taken with 20x objective).
DMSO 0.1%
Control 10µM MEHP 100 µM MEHP 300µM MEHP
Hoechst
Pro
pid
ium
Iodid
e
Merg
e
0
1
2
3
4
5
6
7
8
9
10
Pe
rce
nta
ge o
f C
ell
de
ath
Condensed nuclei
Pi+ nuclei
Page 159
141
-1.00
-0.50
0.00
0.50
1.00
1.50
2.00
2.50
Basal Proton Leak MaximalRespiration
SpareRespiratory
Capacity
Non MitoRespiration
ATPProduction
CouplingEfficiency (%)
SpareRespiratoryCapacity (%)
BSA
-Pal
mit
ate
OC
R (
pm
ol/
min
/µg)
-B
SA
OC
R (
pm
ol/
min
/µg)
0.1% DMSO
10µM MEHP
100µM MEHP
300µM MEHP
* *
*
0.00
2.00
4.00
6.00
8.00
0 2 4 6 8 10 12
OC
R (
pm
ol/
mm
in/µ
g)
Measurement Time Point
0.1% DMSO BSA0.1% DMSO BSA-Palmitate10µM MEHP BSA10µM MEHP BSA-Palmitate100µM MEHP BSA100µM MEHP BSA-Palmitate300µM MEHP BSA300µM MEHP BSA-Palmitate
0
0.2
0.4
0.6
0.8
1
1.2
1.4
FAO total
Pro
du
ctio
n r
ate
(nm
ol/
hr/
mg)
0.1% DMSO
10µM MEHP
100µM MEHP
300µM MEHP
*
a)
b)
c)
Page 160
142
Figure 2: Effects of MEHP on C2C12 myotube’s fatty acid oxidation and mitochondrial
respiration- C2C12 seven-day differentiated myotubes were exposed to varying
concentrations of MEHP (10, 100 and 300 µM) for 24 hours. a) assessment of total fatty acid
oxidation by measuring palmitate driven exogenous fatty acid oxidation after incubation with
radiolabelled 14C-palmitate. n=3 b and c) Seahorse assessment of fatty acid oxidation by
measuring mitochondrial oxygen consumption rate in presence of palmitate (n=3). * represents
p < 0.05.
Page 161
143
Figure 3: Assessment of the effects of MEHP on cellular glycolysis levels in the presence
of exogenous glucose- C2C12 seven-day differentiated myotubes seeded onto an XF96-well
plate were exposed to varying concentrations of MEHP (10, 50, 100 and 300 µM) for 24 hours.
Extracellular acidification rate (ECAR) indicative of glycolysis when provided with glucose
was assessed using the Seahorse XF Cell Glycolysis Stress Test (n=5). * represents p < 0.05.
0.00
0.50
1.00
1.50
2.00
2.50
Glycolysis Glycolytic capacity Glycolytic reserve % Non-glycolyticacidification
Rat
io o
f sa
mp
le/c
on
tro
l fo
r EC
AR 0µM
10µM
50µM
100µM
300µM
*
Page 162
144
Figure 4: The effects of MEHP on metabolism related proteins- Western blot analyses on
whole-cell lysates from C2C12 seven-day differentiated myotubes exposed to varying
concentrations of MEHP (10 , 50, 100 and 300 µM) for 24 hours (n=3). * represents p < 0.05.
Hexokinase II
Hexokinase I Gapdh
ACSL5
B-actin
0
1
2
3
4
5
6
7
8
Hexokinase
II
Hexokinase I Gapdh ACSL5
Volu
me
Inte
nsi
ty o
f p
rote
in a
dju
sted
agai
nst
Bet
a A
ctin
0.1% DMSO
10µM MEHP
50µM MEHP
100µM MEHP
300µM MEHP
0 10 50 100 300 MEHP (µM)
*
Page 163
145
4.9 Tables
Table 1: Characteristics of women with obesity enrolled in NHANES 2003-2004
Table 2: Backward regression analysis studying the modulators of plasma omega-6 fatty acid
(Arachidonic Acid (AA) and Gamma-Linolenic Acid (GLA)) levels within adult women with
obesity who participated in NHANES 2003-2004 study.
Dependent
Variable
Independent
Variable
/Term
Unstandardized
Coefficient
Standard
Error
Cohen’s
f2
Variable
p-value
r2
adjusted
model
Model
p-value
AA 0.3465 0.000
Constant 649.7 64.5 - 0.000
Age 3.57 1.22 0.064 0.004
MEHP 7.62 1.73 0.212 0.000
Ethnicity 0.109 0.003
Non-Hispanic
Black
81.4 46.1 0.082
Mexican
American
-102.3 66.4 0.127
Other Hispanic -364 132 0.007
GLA 0.235 0.000
Constant 35.84 6.81 - 0.000
Age 0.386 0.129 0.079 0.004
MEHP 0.436 0.182 0.056 0.019
Ethnicity 0.528 0.049
Non-Hispanic
Black
-8.42 4.87 0.088
Mexican
American
-14.60 7.01 0.041
Other Hispanic -25.1 13.9 0.076
Variable Number (n) Mean Standard Deviation
(SD)
AGE(yr) 89 46.66 18.64
BMI (kg/m2) 87 35.943 5.166
MEHP (ng/ml) 88 7.85 13.72
Gamma-Linolenic Acid ( µmol/l) 88 50.91 21.77
Arachidonic Acid (µmol/l) 88 880.4 221.0
Page 164
146
5 GENERAL DISCUSSION
Once defined as a “high-income country problem”, the advancement of overweight and
obesity into a global epidemic has been a critical concern, with approximately 600 million
adults and 108 million children documented with obesity world-wide1,2. While treatments
established to combat obesity include exercise and dietary interventions, medication and
bariatric surgery, inter-individual variation in treatment response exists3–5. Furthermore,
overweight and obesity are multi-factorial conditions and thus could develop through the
interplay of many complex factors including genetic, epigenetic, behavioral and
environmental factors. Hence, there is a growing pressure to further our knowledge of factors
that affect adiposity and weight gain, while also identifying weight loss predictors to aid in the
treatment of obesity via personalized lifestyle interventions.
Globally, while the frequency of obesity was determined to be about 12% in adults and 5% in
children, it was shown that across all ages, women had a higher prevalence of obesity in
comparison to men2. Thus, the overarching objective of this Ph.D. thesis was to provide further
insight into the effects of genetics, behavioral and environmental factors in the development
of overweight and obesity, with a key focus on women. Specifically, my research focused on
understanding the effects of an individual’s genotype on weight loss during behavioral
modifications via a diet and exercise intervention, as well as the effects of the environmental
toxicant, mono-(2ethylhexyl) phthalate, on weight gain. Furthermore, the current research
offers an interdisciplinary approach, by studying the cellular and molecular mechanisms, as
well as utilising human population statistics to determine how these factors influence weight
gain and obesity.
Page 165
147
Known to be one of the key tissues to utilize free fatty acids as a source of energy, skeletal
muscle constitutes around 40% of body mass within a healthy adult6,7. Specifically, in healthy
lean individuals while 20-30% of total resting oxygen uptake is attributed to the skeletal
muscle, during maximal physical activity, over 90% of the whole-body oxygen uptake is
attributed to muscle7–9. Furthermore, studies on the effects of obesity in skeletal muscle, have
illustrated an elevated intra-myocellular accumulation of lipids within the tissue of individuals
with obesity10–12. This was deemed to be a consequence of reduced fatty acid oxidation which
contributes towards insulin resistance10. The primary tissue of interest for this Ph.D. thesis was
the skeletal muscle. Chapters 2 and 3 focus on studying the metabolic effects of genetic factors
on individuals with overweight and obesity during lifestyle interventions, and Chapter 4
focuses on the metabolic effects of environmental factors on individuals with obesity.
Due to the increased demand for successful personalized lifestyle interventions in women with
obesity, the necessity in identifying genotypes that are highly sensitive to weight loss, and
understanding their impact at a cellular and molecular mechanistic level, is of vital
importance13. Thus, Chapters 2 and 3 of the following thesis focus on a key polymorphism of
the human ACSL5 gene, rs2419621. Characterised by a cytosine to thymine transition in the
promoter region of the gene, rs2419621 has been previously shown by our lab to be associated
with increased rate of weight loss in menopausal women with obesity, who had participated
in the Ottawa Hospital Weight Management Clinic14. Furthermore, studies conducted to
determine the functionality of the polymorphism, illustrated the presence of an additional
EBOX site on top of the two commonly found sites, recruiting more myoD transcription
factors, thus increasing the regulation of the downstream ACSL5 gene15. However, while the
rs2419621 genotype has been shown to play a role in increased mRNA expression and
Page 166
148
response to lifestyle interventions of women with overweight and obesity, how this particular
polymorphism exerts its effect at a cellular and molecular level is unknown. Furthermore,
changes in anthropometric measurements observed in carriers of the rs2419621 polymorphism
with obesity, had not been determined prior to our research. Thus, the research described in
Chapter 2 took a genetic association study approach, by testing the association between the
ACSL5 rs2419621 genotype and response to lifestyle interventions in women with overweight
and obesity, by studying pre- and post-intervention changes in anthropometric measurements.
The research in Chapter 3 utilized a molecular mechanistic approach to determine the cellular
and molecular mechanisms by which the rs2419621 ACSL5 polymorphism exerts its effect.
Findings presented in Chapter 2 demonstrate that the rs2419621 polymorphism plays a key
role in response to diet and exercise intervention16. Specifically, carriers of the rare T allele
following lifestyle interventions MONET and CAO, had a greater reduction in their visceral
fat and fat mass levels, while having a greater increase in their percent lean mass, in
comparison to non-carriers16. These observations were noted in postmenopausal women with
overweight or obesity. In addition, a greater decrease in BMI following the lifestyle
interventions was noted in T allele carriers vs non-carriers when studying postmenopausal
women with obesity solely16.The increased weight loss in T allele carriers vs non-carriers can
be explained by the greater reduction in adiposity associated with the presence of the
rs2419621 polymorphism following a lifestyle intervention. Furthermore, the reduction in fat-
related anthropometric measurements post-intervention within women with overweight,
illustrates the potent metabolic effect of the ACSL5 polymorphism at the whole-body level.
This observed significant reduction in adiposity in the [T] allele carriers, is further supported
by our findings described in Chapter 3 in which we report the association of rs2419621
Page 167
149
genotype with respiratory quotient related measurements. Specifically, T allele carriers with
obesity who participated in the MONET intervention, presented a greater increase in their fatty
acid oxidation levels and a corresponding decrease in their carbohydrate oxidation levels in
vivo following the intervention, in comparison to non-carriers. However, while in vivo results
explaining the effects of the rs2419621 genotype on overweight and obesity display an
increased efficiency of fatty acid oxidation, thus contributing towards improvements in
anthropometric measurements, how this occurs at a cellular and molecular level required
further elucidation. Additionally, it is important to note that the MONET intervention
consisted of 1/3 of the population undergoing an exercise intervention. Hence, more drastic
fatty acid oxidation changes may have been noticed if the entire population had participated
in resistance training.
Chapter 3 findings provide detailed insight into the molecular mechanisms by which the
rs2419621 polymorphism exerts its effect. Specifically, it was observed that carriers of the
rare T allele had increased levels of the human 683aa ACSL5 protein isoform in comparison
to non-carriers. Our in vitro findings on C2C12 mouse muscle cells overexpressing human
ACSL5 have illustrated that the commonly found short isoform of 683aa is localized in the
mitochondria to a greater extent in comparison to the long human ACSL5 protein isoform of
739aa, also resulting in a greater fatty acid oxidation levels. This increase in protein expression
was paralleled with an increase in both in vitro human muscle cell carbon dioxide production,
as well as ex vivo human muscle tissue mitochondrial respiration. Furthermore, confocal
imaging of cells from T allele carriers vs non-carriers illustrated no differences in
mitochondrial quantity between groups. Thus, Chapters 2 and 3 clearly illustrate that the
increased response to lifestyle interventions observed within T allele carriers, their increase
Page 168
150
rate of weight loss and improved anthropometric measurements, is in part due to an increase
in the human 683aa ACSL5 protein isoform, contributing towards an increased in vitro, ex
vivo and in vivo fatty acid oxidation and energy expenditure. Thus, our findings contribute
towards an improved understanding of the cellular and molecular functional characteristics of
the ACSL5 rs2419621 genotype.
Previous reports have illustrated the importance of acknowledging sex differences in lifestyle
treatment of obesity17. Specifically, while sex differences in energy metabolism have been
observed, the etiology is unclear, with potential contributors ranging from sex steroids to leptin
hormone regulation17. Although the effects of ACSL5 rs2419621 genotype have been
thoroughly studied within post-menopausal women, the polymorphism’s effect on the cellular
and molecular mechanisms in men is yet unknown. Moreover, while Adamo et al. illustrated
increased weight loss in women, these studies need confirmation within individuals of varying
sociodemographic status (i.e., different age groups, race, income). Furthermore, the following
projects are focused on individuals who underwent diet interventions and exercise training.
Whether similar metabolic effects in vivo will be observed in individuals with overweight and
obesity, following a longitudinal observational study, needs to be verified. Statistical analyses
conducted on studying the polymorphism’s effect on healthy individuals as well as athletes
exposed to continuous rigorous exercise are also of interest for future studies.
The rs2419621 polymorphism increases the recruitment of myoD and was shown to only be
affective in the presence of the transcription factor15. Specifically, when studying CV-1
African green monkey kidney cells where myoD is not expressed, the polymorphism only
affected downstream promoter activity in the presence of the myoD transcription factor15.
Thus, while the effects of rs2419621 are directed towards skeletal muscle metabolism, indirect
Page 169
151
effects of the polymorphism may exist noted by reduced visceral fat in carriers of the T allele.
However, further exploration of the polymorphism’s indirect effects is required.
My research focused on establishing the function of the human ACSL5 protein isoforms,
specifically regarding fatty acid oxidation and mitochondrial respiration within skeletal
muscle. While our findings illustrate that the short protein isoform of 683aa appeared to be the
most abundant protein isoform in skeletal muscle samples, this may not be the case in other
tissue samples. This was clearly illustrated in HepG2 liver carcinoma cells, which expressed
both the two common ACSL5 protein isoforms of 683 and 739aa, as well as the uncommon
659aa protein isoform, which may play a role in sensitization to TRAIL-based apoptosis18.
Thus, further studies are required to elucidate the functional role of the long protein isoform
of 739aa as well as the short protein isoforms 683 and 659aa within different tissues.
Regardless, this research illustrates for the first time the possibility that ACSL5 protein
isoforms have separate functional roles in metabolism. As diseases such as cancer have been
shown to affect the expression of the ACSL5 protein, further studies are required into the roles
of the human protein isoforms in such diseases19–23. Generally, ACSL proteins differ in their
substrate preference, tissue specificity and subcellular localization. However, studies have
shown the presence of compensatory mechanisms following the suppressed expression of one
of the ACSL proteins24–26. Therefore, addressing how the rs2419621 polymorphism influences
the interplay between other ACSL proteins, namely ACSL 1, 3, 4 and 6, is of interest in the
future.
Finally, while behavioural factors can be monitored, and genetic factors such as fatty acid
metabolism related polymorphisms are important, it is still important to consider other external
factors that aren’t easily regulated such as environmental toxicants. Obesogens are toxicants
Page 170
152
that are found in the environment that play a role in increased adiposity27. Interestingly, a feed-
back loop is generated, in which studies have shown individuals with greater BMI to have
decreased clearance of certain toxicants from their system, potentially making them more
susceptible to the metabolic dysregulation caused by the obesogen28,29. Specifically, mono-
(2ethylhexyl) phthalate (MEHP), the monoester derivate of di(2-ethylhexyl) phthalate
(DEHP), has been postulated to affect individuals with obesity to a greater extent vs healthy
individuals28. Due to their potential disruption in MEHP oxidizing cytochrome P450
enzymatic activity, individuals with obesity are more susceptible to MEHP’s metabolic effects
vs healthy individuals28,29. Consequently, this could make them more prone to diseases such
as diabetes and obesity, when exposed to DEHP, one of the primary phthalate plasticizers used
in North America30. Consequently, due to the increased prevalence of obesity within women,
Chapter 4 focuses on the effects of mono-(2ethylhexyl) phthalate, and its effects on cellular
metabolism and fatty acid utilization within women with obesity.
Previous research has documented increased plasma fatty acid levels to have been associated
with disruption in fatty acid transport and mitochondrial oxidation disruption31. Our
observations from women with obesity who participated in the NHANES study, illustrated an
association between increased levels of plasma gamma-linolenic acid and arachidonic acids
with increased urinary MEHP. Increased omega-6 fatty acid levels, including arachidonic acid,
have also been associated with decreased mitochondrial biogenesis and activity, insulin
resistance and leptin resistance32–35. Interestingly, our findings also demonstrate that the
treatment of C2C12 mouse muscle cells with MEHP caused a reduction in fatty acid oxidation
and mitochondrial bioenergetics. Furthermore, exposing C2C12 cells to MEHP resulted in an
increase in basal glycolytic levels, and glycolysis-related protein, hexokinase II.
Page 171
153
It is important to note that previous research supports the ideas that the toxicant has tissue-
specific effects on mitochondrial respiration. Specifically, research conducted on 3T3-L1
adipocytes has illustrated an increase in mitochondrial respiration following exposure to
MEHP, while isolated mitochondria obtained from rat liver illustrated an inhibition in palmitic
acid oxidation following exposure to MEHP36,37. However previous work on MEHP/DEHP’s
effect on glucose metabolism have illustrated similar observations as our in vitro work, where
an impairment in glucose utilization was observed, within human Chang liver cells exposed
to DEHP, and 3T3-L1 cells following exposure to increasing concentrations of MEHP36,38.
Previous research on the effects of muscle glucose oxidation in type 2 diabetic patients have
illustrated a significant increase in basal leg muscle glucose oxidation vs in non-diabetic
individuals39. This observation in individuals with diabetes, was believed to contribute
towards an overall systemic basal metabolic abnormality39. As a large percentage of the human
body is skeletal muscle, known to be the primary site of insulin resistance during type 2
diabetes progression, relating our cellular work to the observations noted at the whole-body
level can be justified. Thus, future studies include studying the association between urinary
MEHP and fasting glucose/insulin levels in individuals with obesity.
Our in vitro and human population studies, illustrate how exposure to MEHP, results in
cellular fatty acid and glucose metabolic disruption, as well as altered plasma fatty acid levels.
Thus, individuals with obesity may be highly susceptible to the metabolic defects associated
with MEHP, increasing their chances of metabolic dysfunction.
A key focus of Chapters 2 and 3 was the ACSL5 protein, known to play a role in esterifying
free fatty acids into fatty acyl-CoA molecules, channeling them towards fatty acid oxidation
and lipid biosynthesis. Based on our population statistics on women with obesity, we noted a
Page 172
154
parallel increase in urinary MEHP and plasma fatty acid levels, specifically arachidonic acid
and gamma linolenic acid. Previous work on the role of arachidonic acid metabolites on
skeletal muscle have illustrated their function in skeletal muscle tissue physiology including
myogenesis40,41. The increase in fatty acid levels, has been shown to be indicative of impaired
fatty acid transport and mitochondrial oxidation31. Furthermore, a reduction in fatty acid
oxidation and mitochondrial bioenergetics was noted at the muscle cellular level, following
increased exposure to MEHP. Thus, we postulated that ACSL5, a key protein known to
regulate fatty acid esterification and transport could be dysregulated following exposure of
muscle cells to MEHP. Interestingly, no changes in ACSL5 expression were noted in C2C12
myotubes. However, there is the possibility that other ACSL proteins are dysregulated by such
toxicant exposure and therefore further research is required to understand MEHP’s regulation
of fatty acid metabolism related proteins in skeletal muscle. Interestingly, a significant
reduction in ACSL5 protein expression was noted in C2C12 myoblasts exposed to MEHP,
implying a certain level of ACSL5 protein dysregulation within proliferative muscle cells.
However, further studies in C2C12 myoblasts are needed to confirm the effects of MEHP on
muscle cell proliferation. Future studies which are ongoing in our lab, include exposing C2C12
myoblasts to the MEHP toxicant, in the presence or absence of ACSL5 via siRNA techniques,
and studying its impact on overall mitochondrial bioenergetics.
Lastly, as environmental toxicants can affect the epigenome of an individual, how MEHP
affects the epigenetic regulation of various fatty acid metabolism related genes is of key
interest. Specifically, MEHP has been shown to play a role in DNA methylation potentially
regulating the expression of FA metabolism-related genes42. Thus, future directions include
understanding the epigenetic effects of MEHP within skeletal muscle C2C12 cells, and
Page 173
155
whether it regulates the expression of such genes through DNA and histone hyper/hypo
methylation, acetylation etc.
The concept of personalized medicine, including personalized genomics, states that the genetic
background of an individual can lead to individualised treatments according to a person’s
genotype43. Treatments would include prescribing specific dietary and behavioural changes to
treat diseases such as obesity43. While the concept itself appears promising, to date genetic
loci initially thought to be of high value for determining susceptibility to obesity, were in fact
shown to have small effects on weight gain and only explained a fraction of the total
variance44. An example is the FTO variation, which was shown to associate with only a modest
weight gain45. Thus, while identifying key polymorphisms that affect metabolism such as
ACSL5’s rs2419621, is of value to the progression of personalized medicine treatments,
research has shown the insufficient incorporation of environmental factors in disease etiology.
A recent report published by Carlsten et al. emphasized the importance of studying genetic
and environmental factors in understanding epigenetics and medical treatment of disease46.
The report stressed on the underestimation of complex chronic diseases by studying an
individual’s genetics solely, while disregarding environmental and social determinants of
health46. While current research acknowledges the importance of including such factors into
personalized medicine, this would result in a complete shift in current public health policies
to emphasize the importance of both the physical and social environment of an individual46.
It has been noted that studying solely one genotype and toxicant of interest regarding skeletal
muscle metabolism, is a limitation of the thesis, and such observations may differ when
studying different tissues of interest, as well as within different populations of varying
ethnicity, age and gender. However, my Ph.D. research stresses on the importance of
Page 174
156
understanding an individual’s personal genome in combatting obesity, while acknowledging
that the disease is clearly multi-factorial, and effective personalized medicine treatment must
also consider the importance of environmental factors such as toxicants, in the development
and progression of this disease. Furthermore, my doctoral research is consistent with the
importance of interdisciplinary research approaches, in which biochemical analyses of cellular
and molecular metabolism are complemented by human population statistics to study the
effects of genetics and environmental factors at the whole-body level. This was done with the
overall goal of an improved comprehensive understanding of the effects of ACSL5 rs2419621
polymorphism and the environmental toxicant MEHP on human metabolism.
Page 175
157
5.1 REFERENCES
1. WHO. WHO | Obesity and overweight. World Heal Organ Media Cent Fact Sheet No
311. 2012:1-2.
http://www.who.int/mediacentre/factsheets/fs311/en/#.U2gDIH5zIZ4.mendeley.
2. Collaborators TG 2015 O. Health Effects of Overweight and Obesity in 195 Countries
over 25 Years. N Engl J Med. 2017:NEJMoa1614362. doi:10.1056/NEJMoa1614362.
3. National Heart Lung and Blood Institute, National Institutes of Health (NIH) National
Heart, Lung, and Blood Institute N. Clinical Guidelines on the Identification,
Evaluation, and Treatment of Overweight and Obesity in Adults. The Evidence
Report, NIH Publication No. 98-4083. Vol 158.; 1998. doi:10.1001/jama.2012.39.
4. Gerrits MF, Ghosh S, Kavaslar N, et al. Distinct skeletal muscle fiber characteristics
and gene expression in diet-sensitive versus diet-resistant obesity. J Lipid Res.
2010;51:2394-2404. doi:10.1194/jlr.P005298.
5. Thrush a B, Dent R, McPherson R, Harper M-E. Implications of mitochondrial
uncoupling in skeletal muscle in the development and treatment of obesity. FEBS J.
2013;280(20):5015-5029. doi:10.1111/febs.12399.
6. Frontera WR, Ochala J. Skeletal Muscle: A Brief Review of Structure and Function.
Calcif Tissue Int. 2015;96(3):183-195. doi:10.1007/s00223-014-9915-y.
7. Owen, O.E., Reichard, G.A., Boden, Jr.G., Patel, M.S., Trapp VE. Interrelationships
among key tissues in the utilization of metabolic substrate. Adv Mod Nutr.
1978;2:517-550.
8. Wade, O.L., Bishop J. Cardiac Output and Regional Blood Flow. Oxford, UK:
Blackwell Scientific Publications; 1962.
9. Zurlo F, Larson K, Bogardus C, Ravussin E. Skeletal muscle metabolism is a major
determinant of resting energy expenditure. J Clin Invest. 1990;86(5):1423-1427.
doi:10.1172/JCI114857.
10. Kelley DE, Goodpaster B, Wing RR, Simoneau JA. Skeletal muscle fatty acid
metabolism in association with insulin resistance, obesity, and weight loss. Am J
Physiol. 1999;277(6 Pt 1):E1130-41.
11. Weiss R, Dufour S, Groszmann A, et al. Low adiponectin levels in adolescent obesity:
A marker of increased intramyocellular lipid accumulation. J Clin Endocrinol Metab.
2003;88(5):2014-2018. doi:10.1210/jc.2002-021711.
12. Thamer C, Machann J, Bachmann O, et al. Intramyocellular lipids: Anthropometric
determinants and relationships with maximal aerobic capacity and insulin sensitivity.
J Clin Endocrinol Metab. 2003;88(4):1785-1791. doi:10.1210/jc.2002-021674.
13. Yang N, Ginsburg GS, Simmons L a. Personalized medicine in women’s obesity
prevention and treatment: implications for research, policy and practice. Obes Rev.
2013;14(2):145-161. doi:10.1111/j.1467-789X.2012.01048.x.
Page 176
158
14. Adamo KB, Dent R, Langefeld CD, et al. Peroxisome proliferator-activated receptor
gamma 2 and acyl-CoA synthetase 5 polymorphisms influence diet response. Obesity
(Silver Spring). 2007;15(5):1068-1075. doi:10.1038/oby.2007.630.
15. Teng ACT, Adamo K, Tesson F, Stewart AFR. Functional characterization of a
promoter polymorphism that drives ACSL5 gene expression in skeletal muscle and
associates with diet-induced weight loss. FASEB J. 2009;23(6):1705-1709.
doi:10.1096/fj.08-120998.
16. Rajkumar, A., Lamothe, G., Bolongo, P., Harper, M.-E., Adamo, K. Acyl-CoA
synthetase long-chain 5 genotype is associated with body composition changes in
response to lifestyle interventions in postmenopausal women with overweight and
obesity: a genetic association study on cohorts Montréal-Ottawa New Emerging
Team, and. BMC Med Genet. 2016;17(56).
17. Wu BN, O’Sullivan AJ. Sex differences in energy metabolism need to be considered
with lifestyle modifications in humans. J Nutr Metab. 2011;2011.
doi:10.1155/2011/391809.
18. Gassler N, Roth W, Funke B, et al. Regulation of Enterocyte Apoptosis by Acyl-CoA
Synthetase 5 Splicing. Gastroenterology. 2007;133(2):587-598.
doi:10.1053/j.gastro.2007.06.005.
19. Yamashita Y, Kumabe T, Cho YY, et al. Fatty acid induced glioma cell growth is
mediated by the acyl-CoA synthetase 5 gene located on chromosome 10q25.1-q25.2,
a region frequently deleted in malignant gliomas. Oncogene. 2000;19(51):5919-5925.
doi:10.1038/sj.onc.1203981.
20. Yeh CS, Wang JY, Cheng TL, Juan CH, Wu CH, Lin SR. Fatty acid metabolism
pathway play an important role in carcinogenesis of human colorectal cancers by
Microarray-Bioinformatics analysis. Cancer Lett. 2006;233(2):297-308.
doi:10.1016/j.canlet.2005.03.050.
21. Gassler N, Herr I, Schneider A, et al. Impaired expression of acyl-CoA synthetase 5 in
sporadic colorectal adenocarcinomas. J Pathol. 2005;207(3):295-300.
doi:10.1002/path.1831.
22. Gassler N, Schneider A, Kopitz J, et al. Impaired Expression of Acyl-CoA-Synthetase
5 in Epithelial Tumors of the Small Intestine. Hum Pathol. 2003;34(10):1048-1052.
doi:10.1053/S0046-8177(03)00431-3.
23. Gassler N, Kopitz J, Tehrani A, et al. Expression of acyl-CoA synthetase 5 reflects the
state of villus architecture in human small intestine. J Pathol. 2004;202(2):188-196.
doi:10.1002/path.1504.
24. Soupene E, Kuypers FA. Mammalian Long-Chain Acyl-CoA Synthetases. Exp Biol
Med. 2008;233(5):507-521. doi:10.3181/0710-MR-287.
25. Ellis RJ. The role of long-chain acyl-coenzyme A synthetase 1 (ACSL-1) in lipid
metabolism in human skeletal muscle primary myotubes. 2011.
26. Lopes-Marques M, Cunha I, Reis-Henriques MA, Santos MM, Castro LFC. Diversity
Page 177
159
and history of the long-chain acyl-CoA synthetase (Acsl) gene family in vertebrates.
BMC Evol Biol. 2013;13:271. doi:10.1186/1471-2148-13-271.
27. Grün F, Blumberg B. Environmental obesogens: Organotins and endocrine disruption
via nuclear receptor signaling. Endocrinology. 2006;147(6). doi:10.1210/en.2005-
1129.
28. Yaghjyan L, Sites S, Ruan Y, Chang S-H. Associations of urinary phthalates with
body mass index, waist circumference and serum lipids among females: National
Health and Nutrition Examination Survey 1999-2004. Int J Obes (Lond).
2015;39(6):994-1000. doi:10.1038/ijo.2015.8.
29. Kotlyar M, Carson SW. Effects of obesity on the cytochrome P450 enzyme system.
Int J Clin Pharmacol Ther. 1999;37(1):8-19.
30. Environment Canada Health Canada. Canadian Environmental Protection Act- Bis-(2-
ethylhexyl) phthalate. https://www.canada.ca/en/health-
canada/services/environmental-workplace-health/reports-publications/environmental-
contaminants/canadian-environmental-protection-act-priority-substances-list-report-2-
ethylhexyl-pthalate.html#a5. Published 1994. Accessed July 10, 2017.
31. Lagerstedt SA, Hinrichs DR, Batt SM, Magera MJ, Rinaldo P, McConnell JP.
Quantitative Determination of Plasma C8–C26 Total Fatty Acids for the Biochemical
Diagnosis of Nutritional and Metabolic Disorders. Mol Genet Metab. 2001;73(1):38-
45. doi:10.1006/mgme.2001.3170.
32. Massiera F, Barbry P, Guesnet P, et al. A Western-like fat diet is sufficient to induce a
gradual enhancement in fat mass over generations. J Lipid Res. 2010;51(8):2352-
2361. doi:10.1194/jlr.M006866.
33. Pisani DF, Amri E-Z, Ailhaud G. Disequilibrium of polyunsaturated fatty acids status
and its dual effect in modulating adipose tissue development and functions. OCL -
Oilseeds fats, Crop Lipids. 2015;22(4):1-7. doi:10.1051/ocl/2015003.
34. Phillips CM, Goumidi L, Bertrais S, et al. Leptin receptor polymorphisms interact
with polyunsaturated fatty acids to augment risk of insulin resistance and metabolic
syndrome in adults. J Nutr. 2010;140(2):238-244. doi:10.3945/jn.109.115329.with.
35. Cheng L, Yu Y, Zhang Q, Szabo A, Wang H, Huang XF. Arachidonic acid impairs
hypothalamic leptin signaling and hepatic energy homeostasis in mice. Mol Cell
Endocrinol. 2015;412:12-18. doi:10.1016/j.mce.2015.04.025.
36. Chiang H chih, Kuo YT, Shen CC, Lin YH, Wang SL, Tsou TC. Mono(2-
ethylhexyl)phthalate accumulation disturbs energy metabolism of fat cells. Arch
Toxicol. 2016;90(3):589-601. doi:10.1007/s00204-014-1446-9.
37. Winberg LD, Badr MZ. Mechanism of phthalate-induced inhibition of hepatic
mitochondrial beta-oxidation. Toxicol Lett. 1995;76(1):63-69.
http://www.ncbi.nlm.nih.gov/pubmed/7701518.
38. Rengarajan S, Parthasarathy C, Anitha M, Balasubramanian K. Diethylhexyl phthalate
impairs insulin binding and glucose oxidation in Chang liver cells. Toxicol Vitr.
Page 178
160
2007;21(1):99-102. doi:10.1016/j.tiv.2006.07.005.
39. Kelley DE, Mandarino LJ. Hyperglycemia normalizes insulin-stimulated skeletal
muscle glucose oxidation and storage in noninsulin-dependent diabetes mellitus. J
Clin Invest. 1990;86(6):1999-2007. doi:10.1172/JCI114935.
40. Prisk V, Huard J. Muscle injuries and repair: The role of prostaglandins and
inflammation. Histol Histopathol. 2003;18(4):1243-1256.
doi:papers3://publication/uuid/1BF165A4-B76C-420F-BFB3-0AE6874BCBB2.
41. Sun R, Ba X, Cui L, Xue Y, Zeng X. Leukotriene B4 regulates proliferation and
differentiation of cultured rat myoblasts via the BLT1 pathway. Mol Cells.
2009;27(4):403-408. doi:10.1007/s10059-009-0053-8.
42. Nguyen B. Gene Expression Changes from Exposure to Phthalates in Testicular Cells.
ProQuest Diss Theses. 2012.
http://search.proquest.com/docview/1357101298?accountid=11012%5Cnhttp://linkso
urce.ebsco.com/linking.aspx?sid=ProQuest+Dissertations+%26+Theses+A%26I&fmt
=dissertation&genre=dissertations+%26+theses&issn=&volume=&issue=&date=201
2-01-01&spage=&title=Gene+Ex.
43. Caulfield T. Obesity Genes, Personalized Medicine, and Public Health Policy. Curr
Obes Rep. 2015;4(3):319-323. doi:10.1007/s13679-015-0163-x.
44. Loos RJF. Genetic determinants of common obesity and their value in prediction.
Best Pract Res Clin Endocrinol Metab. 2012;26(2):211-226.
doi:10.1016/j.beem.2011.11.003.
45. Speliotes EK, Willer CJ, Berndt SI, et al. Association analyses of 249,796 individuals
reveal eighteen new loci associated with body mass index. Nat Genet.
2011;42(11):937-948. doi:10.1038/ng.686.Association.
46. Carlsten C, Brauer M, Brinkman F, et al. Genes, the environment and personalized
medicine: We need to harness both environmental and genetic data to maximize
personal and population health. EMBO Rep. 2014;15(7):736-739.
doi:10.15252/embr.201438480.
Page 179
161
6 APPENDIX
6.1 SUPPLEMENTARY FIGURES/TABLES FOR CHAPTER THREE
MDALKPPCLWRNHERGKKDRDSCGRKNSEPGSPHSLEALRDAAPSQGLNFLLLFTKMLFI ACSL5 isoform a [Human] accession: NP_057318.2
--------------------------------------------------------MLFI ACSL5 isoform b [Human] accession: NP_976314.1
--------------------------------------------------------MLFI ACSL5 [Mouse] accession: NP_082252.1
--------------------------------------------------------MLFI ACSL5 [Rat] accession: NP_446059.1
FNFLFSPLPTPALICILTFGAAIFLWLITRPQPVLPLLDLNNQSVGIEGGARKGVSQKNN
FNFLFSPLPTPALICILTFGAAIFLWLITRPQPVLPLLDLNNQSVGIEGGARKGVSQKNN
FNFLFSPLPTPALICLLTFGTAIFLWLINRPQPVLPLIDLDNQSVGIEGGARRGAFQKNN
FNFLFSPLPTPALICLLTFGTAIFLWLINRPQPVLPLIDLDNQSVGIEGGARRGAFQKNN
DLTSCCFSDAKTMYEVFQRGLAVSDNGPCLGYRKPNQPYRWLSYKQVSDRAEYLGSCLLH
DLTSCCFSDAKTMYEVFQRGLAVSDNGPCLGYRKPNQPYRWLSYKQVSDRAEYLGSCLLH
DLILYYFSDAKTLYENFQRGLAVSDNGPCLGYRKPNQPYKWISYKQVSDRAEYLGSCLLH
DLILYYFSDAKTLYEVFQRGLAVSDNGPCLGYRKPNQPYKWISYKQVSDRAEYLGSCLLH
KGYKSSPDQFVGIFAQNRPEWIISELACYTYSMVAVPLYDTLGPEAIVHIVNKADIAMVI
KGYKSSPDQFVGIFAQNRPEWIISELACYTYSMVAVPLYDTLGPEAIVHIVNKADIAMVI
KGYKSSQDQFVGIFAQNRPEWVISELACYTYSMVAVPLYDTLGTEAIIFVINRADIPVVI
KGYKPSQDQFIGIFAQNRPEWVISELACYTYSMVAVPLYDTLGAEAIIYVINRADISVVI
CDTPQKALVLIGNVEKGFTPSLKVIILMDPFDDDLKQRGEKSGIEILSLYDAENLGKEHF
CDTPQKALVLIGNVEKGFTPSLKVIILMDPFDDDLKQRGEKSGIEILSLYDAENLGKEHF
CDTPQKATMLVENVEKGLTPGLKTIILMDPFDDDLMKRGEKCGVEMLSLHDAENIGKENF
CDTPQKATMLIENVEKDLTPGLKTVILMDPFDDDLMKRGEKCGIEMLSLHDAENLGKENF
RKPVPPSPEDLSVICFTSGTTGDPKGAMITHQNIVSNAAAFLKCVEHAYEPTPDDVAISY
RKPVPPSPEDLSVICFTSGTTGDPKGAMITHQNIVSNAAAFLKCVEHAYEPTPDDVAISY
KKPVPPKPEDLSVICFTSGTTGDPKGAMLTHENVVSNMAAFLKFLEPIFQPTSDDVTISY
KKPMPPNPEDLSVICFTSGTTGDPKGAMLTHQNIVSNMAAFLKFLEPIFQPTPEDVTISY
LPLAHMFERIVQAVVYSCGARVGFFQGDIRLLADDMKTLKPTLFPAVPRLLNRIYDKVQN
LPLAHMFERIVQAVVYSCGARVGFFQGDIRLLADDMKTLKPTLFPAVPRLLNRIYDKVQN
LPLAHMFERLVQGILFSCGGKIGFFQGDIRLLPDDMKALKPTVFPTVPRLLNRVYDKVQN
LPLAHMFERLVQGVIFSCGGKIGFFQGDIRLLPDDMKALKPTVFPTVPRLLNRVYDKVQN
EAKTPLKKFLLKLAVSSKFKELQKGIIRHDSFWDKLIFAKIQDSLGGRVRVIVTGAAPMS
EAKTPLKKFLLKLAVSSKFKELQKGIIRHDSFWDKLIFAKIQDSLGGRVRVIVTGAAPMS
EAKTPLKKFLLNLAIISKFNEVKNGIIRRDSLWDKLVFSKIQGSLGGKVRLMITGAAPIS
EAKTPLKKFLLNLAIISKFNEVRNGIIRRNSLWDKLVFSKIQSSLGGKVRLMITGAAPIS
TSVMTFFRAAMGCQVYEAYGQTECTGGCTFTLPGDWTSGHVGVPLACNYVKLEDVADMNY
TSVMTFFRAAMGCQVYEAYGQTECTGGCTFTLPGDWTSGHVGVPLACNYVKLEDVADMNY
TPVLTFFRAAMGCWVFEAYGQTECTGGCSITSPGDWTAGHVGTPVACNFVKLEDVADMNY
TPVLTFFRAAMGCWVFEAYGQTECTAGCSITSPGDWTAGHVGTPVSCNFVKLEDVADMNY
FTVNNEGEVCIKGTNVFKGYLKDPEKTQEALDSDGWLHTGDIGRWLPNGTLKIIDRKKNI
FTVNNEGEVCIKGTNVFKGYLKDPEKTQEALDSDGWLHTGDIGRWLPNGTLKIIDRKKNI
FSVNNEGEICIKGNNVFKGYLKDPEKTQEVLDKDGWLHTGDIGRWLPNGTLKIVDRKKNI
FSVNNEGEICIKGNNVFKGYLKDPEKTQEVLDKDGWLHTGDIGRWLPNGTLKIIDRKKNI
FKLAQGEYIAPEKIENIYNRSQPVLQIFVHGESLRSSLVGVVVPDTDVLPSFAAKLGVKG
FKLAQGEYIAPEKIENIYNRSQPVLQIFVHGESLRSSLVGVVVPDTDVLPSFAAKLGVKG
FKLAQGEYIAPEKIENVYSRSRPVLQVFVHGESLRSFLIGVVVPDPDSLPSFAAKIGVKG
FKLAQGEYIAPEKIENVYSRSRPILQVFVHGESLRSFLIGVVVPDPESLPSFAAKIGVKG
SFEELCQNQVVREAILEDLQKIGKESGLKTFEQVKAIFLHPEPFSIENGLLTPTLKAKRG
SFEELCQNQVVREAILEDLQKIGKESGLKTFEQVKAIFLHPEPFSIENGLLTPTLKAKRG
SFEELCKNQCVKEAILEDLQKIGKEGGLKSFEQVKSIFVHPEPFTIENGLLTPTLKAKRV
SFEELCQNQCVKKAILEDLQKVGKEGGLKSFEQVKSIFVHPEPFSIENGLLTPTLKAKRV
ELSKYFRTQIDSLYEHIQD
ELSKYFRTQIDSLYEHIQD
Page 180
162
ELAKFFQTQIKSLYESIEE
ELAKFFQTQIKSLYESIEE
Figure S1: Protein alignment of Human ACSL5 long (739aa) and short (683aa) protein isoforms with mouse ACSL5 (683aa) and rat ACSL5 (683aa)- Both mouse and rat ACSL5 are 81% identical to the Human short protein isoform of ACSL5.
Page 181
163
0
0.1
0.2
0.3
0.4
0.5
0.6
0.7
0.8
0.9
Colocalization of mouseACSL5 with Calreticulin
Colocalization of mouseACSL5 with Tom20
Man
de
r's
Co
eff
icie
nt
a)
b)
Figure S2: Mouse ACSL5 colocalization in Endoplasmic Reticulum and Mitochondria- a) Immunofluorescence images
stained for mouse ACSL5, Calreticulin (for endoplasmic reticulum staining) and Tom20 (mitochondria staining) in C2C12 cells.
Images are shown separate and merged, as well as Color Map plugin from Image J where highly correlated pixels from both
channels are shown in red while no correlation is shown in blue. Images were taken using the Zeiss LSM 510/AxioImager.M1
Confocal Microscope 60x oil lens. Images are representative of 3 independent experiments. Scale bar= 20µm. b) Colocalization
of mouse ACSL5 with organelles of interest was studied using Mander’s Coefficient. Mander’s Coefficient for ACSL5 in
endoplasmic reticulum= 0.809 (SEM=0.003 n=3 analysing a total of 47 cells); Mander’s Coefficient for ACSL5 in mitochondria=
0.297 (SEM=0.020 n=3 analysing a total of 45 cells). Unpaired t-test was used to compare between ACSL5 colocalization with
endoplasmic reticulum and mitochondria *p< 0.001.
Mit
och
on
dri
a
End
op
lasm
ic
Ret
icu
lum
Organelle mouse ACSL5 Merged Color Map
nMPD: -1 0 1
*
Page 182
164
A B C D E F
Figure S3: ACSL5 protein isoform expression within human muscle sample (HMS) and HepG2 cells – Western blots using anti-ACSL5 goat polyclonal antibody (Santacruz) - Lane A: Whole cell lysate of rectus abdominis cells derived-myotubes from HMS 133 rs2419621 CC carrier depicting ACSL5 76 kDa short isoform of 683aa; B: F-Ladder (100, 70, and 55kDa); C: 5ug, D: 10ug, and E: 20ug of whole cell lysate of HepG2 liver carcinoma cells depicting ACSL5 76kDa short isoform of 683aa, ACSL5 82kDa long isoform of 739aa, and 73kDa ACSL5Δ20 isoform of 659aa.
ACSL5 82kDa
ACSL5 76kDa
ACSL5 73kDa
ACSL5 76kDa
Page 183
165
Figure S4: Immunofluorescence images stained for human ACSL5 and Tom20 in human Rectus Abdominis satellite cells derived-myotubes Images are shown separate and merged as well as Color Map plugin from Image J where highly correlated pixels from both channels are shown in red while no correlation is shown in blue. Images were taken using the Zeiss LSM 510/AxioImager.M1 Confocal Microscope 20x lens using Z-stack. Scale bar = 20μm. Colocalization of human ACSL5 with mitochondria was analyzed using Mander’s Coefficient and determined to be statistically non-significant between the different genotypes. Image are representative of n = 5 rs2419621 [T] allele carriers and n=4 rs2419621 non-carriers.
Rs2
4196
21 N
on
-car
rier
(H
MS
163
) R
s24
196
21 T
alle
le c
arri
er (
HM
S 1
60)
ACSL5 Mitochondria Merged ColorMap
nMPD: -1 0 1
0
0.1
0.2
0.3
0.4
0.5
0.6
0.7
Man
der
's C
oef
fici
ent
for
colo
caliz
atio
n o
f A
CSL
5
wit
h m
ito
cho
nd
ria
Page 184
166
Table S1: Descriptive statistics on Montréal Ottawa New Emerging Team participants with obesity
or overweight pre/post-intervention.
Variable Size (n) Mean Standard
Deviation
Age (years) 106 57.93 4.87
Pre-intervention
BMI (kg/m2) 106 32.36 4.74
Respiratory Quotient 106 0.87 0.066
Resting VCO2 (ml/min.) 106 165.25 26.70
Resting VO2 (ml/min.) 106 190.37 28.78
Resting Carbohydrate Oxidation (g) 106 156.40 75.75
Resting Fatty acid oxidation (g) 106 41.67 32.48
Post-intervention
BMI (kg/m2) 105 30.32 4.76
Respiratory Quotient 105 0.89 0.058
Resting VCO2 (ml/min.) 105 160.02 23.95
Resting VO2 (ml/min.) 105 180.61 28.32
Resting Carbohydrate Oxidation (g) 105 166.34 62.51
Resting Fatty acid oxidation (g) 105 30.63 30.25
Page 185
167
Table S2: Best subset regression analysis results to determine covariables for the multiple linear
regression analysis. Data sets that were used for dependent variables were data from the Montreal New
Emerging Team (MONET) population combining individuals with overweight or obesity.
Models of Dependent Variable
studied
R-Sq
(%)
R-Sq (%)
(adj)
Covariables associated with mentioned
R value
Change in Respiratory Quotient 22.9 17.8 Age, change in CRP, change in
haptoglobin
Change in Resting VCO2 39.9 32.7 Age, initial weight, average sugar
consumption, average carbohydrate
consumption, change in insulin, change in
leptin
Change in Resting VO2 27.4 18.6 Height, initial weight, average sugar
consumption, average carbohydrate
consumption, change in insulin, change in
leptin
Change in Resting Carbohydrate
Oxidation
27.0 18.0 Age, height, initial weight, average
energy consumption, change in
orosomucoid, change in haptoglobin
Change in Resting Fatty acid
Oxidation
30.2 20.2 Average energy consumption, average
protein consumption, average
carbohydrate consumption, average fat
consumption, change in leptin, change in
orosomucoid, change in haptoglobin
Page 186
168
6.2 SUPPLEMENTAL FIGURES FOR CHAPTER FOUR
a)
b)
Supplementary Figure 1 : The effects of MEHP on cellular endogenous mitochondrial respiration and glycolysis a)
C2C12 seven-day differentiated myotubes seeded onto an XF96-well plate were exposed to varying concentrations of MEHP
(10, 50, 100 and 300 µM) for 24 hours. The following values were measures by using the Seahorse XF Cell Mitochondrial Stress
Test a) oxygen consumption rate (OCR) indicative of endogenous cellular mitochondrial respiration and b) extracellular
acidification rate (ECAR) indicative of endogenous glycolysis (n=3).
0
0.5
1
1.5
2
2.5
BasalRespiration
MaximalRespiration
H+ Proton Leak ATP Production Spare ResCapacity %
CouplingEfficiency
OC
R a
dju
sted
fo
r co
ntr
ol c
ells
0.1% DMSO
10µM MEHP
50µM MEHP
100µM MEHP
300µM MEHP
0
0.2
0.4
0.6
0.8
1
1.2
1.4
Basal Oligomycin FCCP AA/Rot
ECA
R c
orr
ecte
d f
or
con
tro
l cel
ls
*
Page 187
169
Supplementary Figure 2: The effects of MEHP on ACSL5 levels in C2C12 myoblasts- Western blot analyses on whole-cell
lysates from C2C12 myoblasts exposed to varying concentrations of MEHP (10, 50, 100, 150 and 300 µM) for 24 hours (n=3).
0 10 50 100 150 300 MEHP (µM)
0
0.2
0.4
0.6
0.8
1
1.2
0 10 50 100 150 300
Vo
lum
e (
Int)
AC
SL5
ad
just
ed
fo
r B
eta
act
in
and
co
ntr
ol s
amp
le (
0µ
M M
EHP
)
MEHP concentrations (μM)
ACSL5
Beta Actin
*
Page 188
170
6.3 SUPPLEMENTAL METHODOLOGY FOR CHAPTER THREE
Supplementary Material - Methodology
Cell Cultures
C2C12 growth medium using standard Dulbecco’s modification Eagle’s medium (DMEM)
was supplemented with 10% fetal bovine serum (FBS- Gibco), 1% L-glutamine (Life
Technologies) and 1% penicillin/streptomycin (Life Technologies).
Human rectus abdominis cells were grown in F10 nutrient mixture (Ham’s) medium
supplemented with 12% bovine growth serum (BGS), 10 ng/mL epidermal growth factor, 1µM
dexamethasone, 25 pmol/L insulin 0.1 µg/mL, 6.3mL (1X) antibiotic-antimycotic and 5µg/
mL gentamycin sulfate. Cells were differentiated for 7 days in low glucose DMEM
supplemented with 2 % horse serum, 5 mL (1X) antibiotic-antimycotic and 5µg/ mL
gentamycin sulfate.
HepG2 liver carcinoma cell line was cultured in standard Eagle's minimum essential media
containing 1g/L D-glucose and 2mM L-glutamine (Gibco), supplemented with 10% FBS
(Gibco).
Construction of Vectors
cDNA of the human long and short protein isoform of 739aa and 683aa respectively, were
amplified by PCR with the following forward primers and reverse primers:
ACSL5 long isoform of 739aa: CCTTCTCTCGAGATGGACGCTCTGAAGCCACCCTGT
containing XhoI restriction digest site
Page 189
171
ACSL5 short isoform of 683aa: CTGCTGCTGTTCCTCGAGATGCTTTTTATCTTTAA
CTTTTTGTTTTCCCCA containing XhoI restriction digest site
peYFP-N1 reverse primer:
CAGGTACTTAAGTACCGGATCCTTATCCTGGATGTGCTCA TACAGGCT containing
BamHI restriction digest site
pCAGIG reverse primer:
GTACTTAAGTGCGGCCGCCTAATCCTGGATGTGCTCATACAG containing NotI
restriction digest site
Immunostaining
For C2C12 cells overexpressing human ACSL5-YFP vectors and stained for Mitochondria
(Tom20) and Endoplasmic Reticulum (Calreticulin):
Tom20 (FL-145) rabbit polyclonal IgG 1:1000 (Santa Cruz; Sc-11415) in 1% BSA-PBST
Calreticulin rabbit polyclonal IgG 1:1000 (Abcam; ab2907) in 1% BSA-PBST
Alexafluor 647 goat anti-rabbit IgG (H+L) 1:1500 (Life Technologies; A21244) in 1% BSA-
PBST
For double immunostaining to also detect endogenous ACSL5 from C2C12 or untagged
human ACSL5:
ACSL5 (E-12) mouse monoclonal IgG 1:50 dilution (Santa Cruz; sc398310) in 1% BSA-
PBST
Alexafluor 546 IgG (H+L) goat anti-mouse 1:1500 (Life Technologies; A11030) in 1% BSA-
PBST
Page 190
172
For human muscle cells stained for endogenous ACSL5 and mitochondria with Tom20:
Tom20 (F-10) mouse monoclonal IgG at 1:1000 (Santa Cruz Sc17764) in 1% BSA-PBST
Chicken anti-mouse IgG (H+L) Alexafluor 647 at 1:1000 (ThermoFisher A-21463) in 1%
BSA-PBST
ACSL5 rabbit polyclonal IgG antibody was used at 2.5ug/ml concentration (ThermoFisher;
PA5-52392) in 1% BSA-PBST
Donkey anti-rabbit IgG (H+L) Cy3 at 1:250 (Jackson Immuno; 711-165-152) in 1% BSA-
PBST
Microscope settings
Images were acquired with a 63x Plan-Apochromat 1.4 oil objective for C2C12 staining, and
20x objective for human muscle cells, while using the following confocal lasers: Argon
(514nm), HeNe (543nm) and HeNe (633nm) and the following filter sets: Chroma Filter Set
49003 (YFP) and Zeiss Filter Set 45 (mCherry, Cy3.5).
Western blot
ACSL5 goat polyclonal IgG 1:200 (SantaCruz; sc47999) in 1% BSA-PBST
Rabbit anti-goat IgG-HRP 1:5000 (SantaCruz; sc2768) in 1% BSA-PBST
GAPDH rabbit polyclonal IgG 1:15000(Abcam; ab22555) in 1% BSA-PBST
Goat anti-rabbit IgG-HRP 1:5000(SantaCruz; sc2004) in 1% BSA-PBST
Page 191
173
High Resolution Respirometry of Biopsied Muscle
The following injections were consecutively added into the O2K system chambers containing
biopsied muscle: malate (2mM) , pyruvate (5mM) , glutamate (10mM), ADP (5mM; for
complex I-supported respiration), succinate (10mM; for complex I and II supported
respiration) and 0.25µM of carbonyl cyanide p-trifluoromethoxyphenyl hydrazine (FCCP)
titrated to drive maximal respiration. Complex 4 driven respiration was also studied with the
addition of 2mM N,N,N’,N’-Tetramethyl-p-phenylenediamine dihydrochloride (TMPD) and
2mM ascorbate.
Respiratory Quotient Related Measurements
For best subset regression analysis variables were considered based on causative effect on
weight loss: age, initial weight, height and changes in transferrin, glucose, CRP, orosomucoid,
haptoglobin, insulin, leptin and participation in resistance training. Average energy, protein,
carbohydrate, sugar and fat consumed in the three days recorded by the nutrition journal (all
recorded as g/day) were also tested as potential covariates. Covariates selected for adjustment
were based on the adjusted R-squared and Mallows Cp specific for each model studied.