Page 1
Impact of Foreign Direct Investment on
Economic Growth of Pakistan-
- An ARDL-ECM Approach
Av: WAQAS JAVAID Handledare: Anh Mai Thi Van
Södertörns högskola | Department of Economics
Magisteruppsats 30 hp
Economics | Spring 2016
Page 2
1
Acknowledgement
I would like to express my deepest gratitude to my supervisor Anh Mai Thi Van especially
for her quick reply, guidance and support which enabled me to develop a better
understanding of the topic.
WAQAS JAVAID
Page 3
2
SUMMARY
This study investigates an impact of Foreign Direct Investment (FDI) on Gross Domestic
Production (GDP) of Pakistan over the period 1966-2014. I apply Autoregressive Distributed
Lag- Error Correction Model (ARDL-ECM) technique to find long run effects and short run
effects simultaneously. The FDI has a significant positive impact on the GDP growth of Pakistan
both in long-term and in short-term. Moreover, the ECM coefficient suggests a convergence to
the equilibrium path. Other factors such as the inflation and the population also show significant
effects on the GDP in the long run. Finally, the gross capital formation and the trade have no
significant role to explain the variation in the economic growth of Pakistan.
KEY WORDS: GDP, FDI, growth, Pakistan, ARDL
Page 4
3
Table of Contents
SUMMARY .................................................................................................................................... 2
1. INTRODUCTION ................................................................................................................... 5
2. REVIEW OF LITERATURE .................................................................................................. 8
2.1. Positive impacts................................................................................................................ 8
2.2. Negative impacts .............................................................................................................. 9
3. FOREIGN DIRECT INVESTMENT IN PAKISTAN .......................................................... 11
4. THEORETICAL FRAMEWORK ......................................................................................... 15
4.1. Dependency theory ......................................................................................................... 15
4.2. Endogenous growth ........................................................................................................ 16
4.3. Innovation-based growth by Grossman and Helpman ................................................... 16
4.4. Technology spillovers .................................................................................................... 18
5. Data ........................................................................................................................................ 21
6. METHODOLOGY FRAMWORK ........................................................................................ 24
6.1. MODELS ....................................................................................................................... 26
7. RESULTS AND DISCUSION .............................................................................................. 28
7.1. Unit Root and Stationary Test ........................................................................................ 28
7.2. Optimal lags ................................................................................................................... 29
7.3. Short run analysis ........................................................................................................... 30
7.4. Long run analysis ........................................................................................................... 33
7.4.1. Bounds test .............................................................................................................. 33
7.4.2. Long run effects ...................................................................................................... 34
7.5. Sensitivity Analysis and Stability Test........................................................................... 36
8. CONCLUSION AND DISCUSSION ................................................................................... 38
REFERENCES. ............................................................................................................................ 40
APPENDIX. .................................................................................................................................. 47
Page 5
4
B. Table .
Table 1: Hurdles faced by Pakistan economy…………………………………………………..47
Table 2: Sector wise FDI Inflows in Pakistan …………………………………………………48
Table 3: Countrywise FDI Inflows in Pakistan …………………………………………………14
Table 4:Data Statatics…………………………………………………………………………...22
Table 5: Unit Root and stationary Test………………………………………………………….28
Table 6: Optimal lags ….………………………………………………….…………………….29
Table 7:Error Correction model…………………………………………………………………32
Table 8: Bound test……………………………………………………………………………...33
Table 9:Long Run Elasticities…………………………………………………………………...35
Figure 1: Show the graphically moment of the all Variables over time…………………………23
Figure 2: Plot of Cumulative sum of Recursive Residuals (CUSUM)…………………………..36
Figure 3: Plot of Cumulative sum of Recursive Residuals (CUSUMq)…………………………36
Page 6
5
1. INTRODUCTION
There are many factors which play important roles in capital formation and economic growth.
These factors might be different across countries with respect to the geographical, geological,
technological progresses, politics, and institutional structures. The aim of this study is to
investigate the relationship between the foreign direct investment (FDI) and the economic
growth of Pakistan over the period 1966-2014.
FDI plays a key role in the development of developing countries. One reason is that FDI helps in
transferring advance technologies know-how and increases employment levels to the host
countries. Economists believe that FDI through new technologies and high standard managements
puts pressures on domestic firms while making the markets competitive. Furthermore, FDI brings
significant and positive externalities to the developing economies such as labor managements,
training opportunities and thus increases the standard of the production function. By technology
transfer, it boosts the economies of the developing countries to stand there on feet‟s by technology
spill over. (Bauer, 1991; Easterly, 2006)
According to the world investment report (2008), FDI boosts the economy by creating
employment opportunities, transfers skills and technologies, increases in productivity, and
continuous long term development in the developing countries. It also serves as a major source
of the external capital inflow for the host countries. It attracts innovation technology transfers,
promotes international trades and management skills and sustains economics development in the
host countries.
Görg and Greenway (2004) concluded that FDI may be more beneficiary for the host countries.
The questions here are why FDI is important for a host country and why investors and other
firms are willing to invest in other countries. The answer to the first question is, underdeveloped
countries have almost a low literacy rate and a high rate of labor with less capital intensive
production. The countries having such characteristics cannot achieve its economic goal alone.
One motive is also to increase the competition in the local market; the countries look for the FDI
to retain their economies on an equilibrium path. With the help of transfer of knowledge and
technology spillover, the FDI also trains the local labor to overcome the future challenges related
Page 7
6
to the production and the economic growth. The answer to the second question is that foreigner
firms and investors are interested to invest in other countries due to the availability of cheap raw
materials and cheap labor costs to maximize their profit. Low transport costs and low excise
duties on imports and exports also courage the investors to invest in developing countries. A few
product competitors and market structure also attract the inflow of the FDI (Hussain and kimuli,
2012)
Pakistan came on the world map in 1947 after a separation from India. Since its independence,
Pakistan has been facing political and economic instabilities. Pakistan was not provided with
reserved as according to a pre proportion agreement from India. At that time there was no proper
systematized institution, such as Central Bank. In 1948 after the death of Muhammad Ali Jinnah
(founder of Pakistan), Pakistan started facing political and economic problems. At the same time,
a war against India affected the Pakistan economy badly (Cohen, 2013).
The Pakistan‟s history consists of two phases. The first phase was from 1947 to 1971. This phase
belonged to two wars and in a result; Pakistan lost half of its resources in the form of Bangladesh
(the East Pakistan). The second phase belonged to the year 1972 to onwards. In this phase,
Pakistan faced again two wars, terrorism issues and highly political instabilities. The American-
Afghan war and series of the political instabilities also put negatively pressures on the Pakistan‟s
economy. International trade restrictions in response of test of nuclear bombs also contributed to
the Pakistan‟s economy seriously. So in all-time period‟s inflow of FDI went up and down in
each year. Table A1 (see Appendix) briefly highlights the hurdles‟ faced by the Pakistan‟s
economy.
This study aims to analyze empirically the impact of FDI on the economic growth in Pakistan
from 1966 to 2014. Does Foreign Direct Investment show the significant impacts on economic
growth of Pakistan both in the long-run and in the short-run?
Previous studies investigated the impact of FDI on the economic growth of Pakistan from
different approaches. The results are still ambiguous therefore this study is an attempt to find
FDI‟s impact on the economic growth along with the trade, the inflation, the gross capital
Page 8
7
formation and the population. I expect a positive and significant impact of FDI on the growth
rate of Pakistan.
I apply Autoregressive Distributed Lag- Error Correction Model (ARDL-ECM) technique. A
main advantage of the ARDL-ECM approach is to find both short run and long run effects.
Additionally, this technique is appropriate for a small sample size (Pesaran, 1999). The results
suggest that FDI has a significant and positive impact on GDP of Pakistan both in long-term and
in short-term. The inflation has a negative impact while the population shows a positive impact
in the long run. There are no indicators of the effects of the trade and the gross capital
information on the GDP growth of Pakistan.
The rest of the paper is structured as follows. I review relevant literatures in the next Section.
Foreign Direct investment in Pakistan is in section 3. Theoretical framework is in Section 4.
Data Source and Methodology follow in Section 5 and Section 6. My empirical results and some
discussions are written in Section 7. The final section is the conclusion.
Page 9
8
2. REVIEW OF LITERATURE
2.1. Positive impacts
Balasubrammanyam and Sapsford (1996) and De Mello (1999) concluded that FDI is a
combination of capital stock, knowledge and technology, which may smoothly increase the
existing stock of economy through management practice, skill development, training and
organizational arrangement. Both studies found that FDI has a positive impact on the economic
growth of developing countries.
Blomstrom M.lipsey, R, S Zejan, M. (1996) found that FDI has a significant and positive impact
on the economy of receiving countries by using a panel estimation technique. FDI allows the
developing countries to make exchange with other countries, so its overall impact is positive on
the economy.
Unciad (1999) found the both positive and negative impacts of FDI on the economy growth and
it depends on variables used in estimation equations. The variables may include the political
instability, the term of trade, GDP per capita, the ratio of domestic investment, the level of
education and the black market.
In 1998, Borensztern E, Gregio J, S lee, J. concluded that the impacts of FDI may vary according
to the level of human capital of receiving countries. This research was based on the density of
human capital which determines the absorbing capacity of foreign technology. A high level of
human capital induced the level of FDI inflow in receiving countries. This hypothesis was
developed on the base of his empirical finding.
Amna et.al (2010) analyzed the impacts of FDI and the inflation on the economic growth of
Pakistan by using time series data from 1981 to 2010. A multi regression technique was used to
estimate the model. According to the results, FDI has a positive and significant impact on
economy whereas the inflation has a negative contribution in the Pakistan‟s economy.
Mamoun Benmamoun and Kevin Lehnert (2013) examined the impacts of FDI, worker
remittances and Offical development assistance (ODA) on the economic growth of developing
Page 10
9
countries by using panel data from 1990-2006. By applying system generalized method
approaches, a positive and significant impact of FDI, the remittances and the Offical
development assistance (ODA) on the economic growth of the developing countries are reported.
They also found that the contribution of the worker remittances to the economic growth is
greater than FDI, and ODA.
Nigel Driffield and Chris Jones (2013) investigated the contributions of FDI an ODA to the
economic growth in the developing countries. They used a system methodology to check the
inherent endogeneities. They also examined the importance of institutions, not only the growth
and the interaction between institutions and other sources of the growth. They founded that the
overall foreign capital has a positive and significant impact on the growth, when the institutions
are taken into account. Manelle Lahdhiri and Mohamed Amine (2012) found that FDI and ODA
have positive and significant impacts on the economics growth of the developing countries by
using panel data estimation
2.2. Negative impacts
According to Durham (2004), FDI has an insignificant and negative impact on the economic
growth of the developing countries. He concluded that the flow of FDI depends on the
technology absorption capacity of the recipient countries.
Ali Sharafat (2014) found that FDI and the inflation have long run negative impacts on the
economic growth of Pakistan. In the short-run analysis confirmed a unidirectional causality
running from FDI, the services debt and the inflation and the literacy rate to growth. He used the
Johansen co-integration technique and the Granger causality for his estimations and the data was
taken from 1972-2013.
The study of Bende –Nebende, A., Ford, J., Santoso B., S Sen, S (2003) was an example of
hypothesis mentioned above. They found that the long run impacts of FDI inflow is significant
and positive in case of less developing countries such as Thailand and Philippines. However, the
impacts are negative in the countries with better economy such as Taiwan and Japan.
Page 11
10
Görg and Greenwood, (2003) confirmed that FDI has a negative effect on GDP. However FDI
does not contribute to any parts in accelerating the economic growth in the receiving countries.
Görg and Greenwood (2003) also suggested that a negative impact of FDI is due to the spillover
issues. Foreign firms also do not create positive externalities on the GDP growth. Hermes and
Lensink (2003) related negative effects to financial conditions of the receiving countries. By
using panel data for 67 developing countries collected from Asia, Africa, and Latin America,
they concluded that the FDI effect is negative for the strong financial countries.
Carkovic and Levine (2002) confirmed that FDI has a negative impact on the growth of the
receiving countries by using cross-country data from 1960 to 1995 and applying a generalized
method technique for estimations. Their results were not consistent with the theory, that FDI has
a positive impact on the economies of the receiving countries.
So the impact of FDI is still controversial. Several studies have been conducted to find the
impact of FDI on the economy. Some studies observed positive impacts and others got negative
impacts depending on estimation variables, such as politics, economics and technological
conditions of receiving countries.
Page 12
11
3. FOREIGN DIRECT INVESTMENT IN PAKISTAN
Since 1947, Pakistan has had a FDI history. Siemens was the first German company in the
telecom industry in Pakistan. The second company was the British firm ICI in chemical and
pharmaceutical manufacturing sectors. Later the Lever brothers (currently Unilever), the
Imperial tobacco company, the Shell and the Burma oil contributed to establishing their business
in early years of Pakistan.
In the 50s and 60s, a significant growth in Pakistan‟s economy was observed. At the same time,
the country followed a policy of restricting the trade and the investment, due to which the inflow
of FDI to Pakistan was discouraged. According to Sahoo (2006), the aim of initial policy for FDI
was that the majority of stakes remained with the domestic firms. Mughal (2008) described that
the saving rate in Pakistan dropped below 15 percent and the investment rate showed almost
seventeen percent. Due to this fact, there existed a gap between the savings and the investments
which led the country relied on the foreign capital to fill this gap. Additionally, in the decades of
1950s, 1960s and 1970s, Pakistan pursued a policy of self-reliance by boasting import
substitution goods in the country and relied only on the foreign assistance to fill the investment
and savings gap.
According to Khan and Khilji (1997), in the 1960s, the government of Pakistan adopted more
liberalized policies for industrial investments by opening twenty four key industries for private
investors. The decade of 60s was entirely dominated by the private sectors, but FDI was not
participating in the sectors of banking, finance and other service sectors, so these sectors
remained reserved only for the domestic investors (Zakaria, 2008). In the 1970s, the government
switched over from the liberalized policies of 1960s to the policy of nationalization under the
slogan of promoting socialism due to which the FDI inflow into Pakistan was greatly
discouraged (Khan and Khilji, 1997, Zakaria, 2008). After conceptualizing the unsatisfactory
performance of nationalized units and other institutions the government modified its policy for
the domestic private and the foreign private investment. The foreign investment act of 1976 was
approved in order to promote foreign investment, the foreign investors were guaranteed by this
act to transfer their capital and profits any time.
Page 13
12
In 1980, the government introduced the public- private sector partnerships by auctioning of a
percentage of public shares in some institutions. Simultaneously, the government also made its
policy more liberal to evoke foreign investment. The control over exchange rate was eliminated
which resulted in launching the establishment of export processing zone (EPZ). The Export
Processing Zone included the tax holiday for a period of five years as well as duty free imports
and exports were permitted (Zakaria, 2008).
Anwar (2002) mentioned that in the 1990s the government of Pakistan further undertook some
regulatory measures to attract FDI. The restrictions on the mobility of capital were lifted up
gradually. The investors from abroad were allowed to keep hundred percent equity of the
business without a prior approval. The transfer of shares to nonresidents, the transfer of dividend
earnings, and the disinvestment were allowed without the prior approval of the central Bank.
(Khan, 2008). Pakistani government in 1997 also allowed to foreign companies to invest in the
agricultural and service traditionally, which were banned for foreign companies to invest after
the independence of Pakistan (Sahoo, 2006). The other encouragements such as declining in
taxes were being granted and dividends, royalties, transferring of profits and even full invested
capital were also allowed.
From 2000‟s, the main incentive of the government investment policy was privatization and
deregulation of the economy to charm FDI (Zakaria, 2008). Khan (2007) also described that the
government has opened up all sectors for foreign direct investment (including the service sector)
which was banned before for foreigner investors. The government of Pakistan also provided the
guarantee that the foreigner investors owned organizations completely, neither be municipalized
and nor be taken under control by other means. The government finished the requirements of
obtaining no objection certificate from the local authority, now anybody can start a project at any
places within the state.
The steps stated above taken by the government of Pakistan at the last three decades were
intended to enhance FDI in each sector of the state. But the effect of FDI inflow remained held
up due to some other factors such as the corruption, the political disturbance, the weak
diplomatic relations at abroad and inefficiency in the legal system, and etc.
Page 14
13
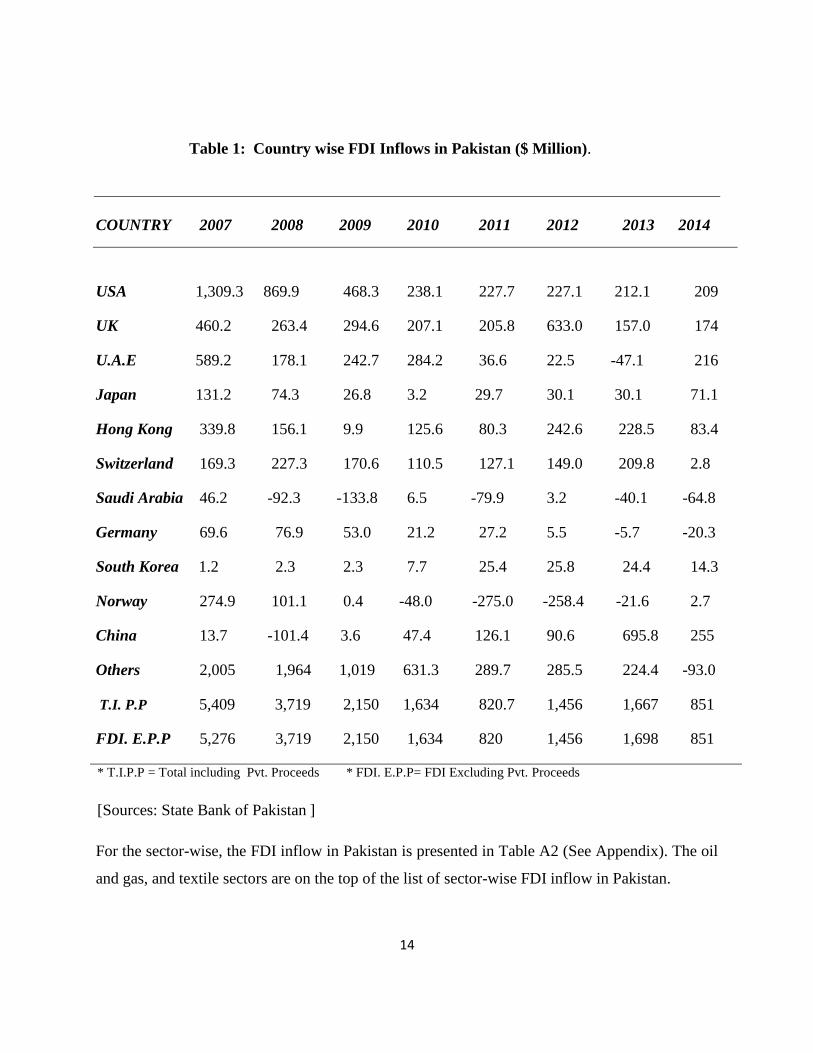
Table 1 explains the inflow of Foreign Direct investment in Pakistan from different countries for
fiscal years 2007 to 2014. The FDI data in Table 1 defines the USA, the United Kingdom and
the UAE were at the top of the list during this time. In the fiscal years 2008 to onwards, a
consistently decrease in FDI inflow was recorded due to financial crisis in the Europe and in the
USA, terrorism and security conditions within Pakistan, and political instabilities.
Page 15
14
Table 1: Country wise FDI Inflows in Pakistan ($ Million).
COUNTRY 2007 2008 2009 2010 2011 2012 2013 2014
USA 1,309.3 869.9 468.3 238.1 227.7 227.1 212.1 209
UK 460.2 263.4 294.6 207.1 205.8 633.0 157.0 174
U.A.E 589.2 178.1 242.7 284.2 36.6 22.5 -47.1 216
Japan 131.2 74.3 26.8 3.2 29.7 30.1 30.1 71.1
Hong Kong 339.8 156.1 9.9 125.6 80.3 242.6 228.5 83.4
Switzerland 169.3 227.3 170.6 110.5 127.1 149.0 209.8 2.8
Saudi Arabia 46.2 -92.3 -133.8 6.5 -79.9 3.2 -40.1 -64.8
Germany 69.6 76.9 53.0 21.2 27.2 5.5 -5.7 -20.3
South Korea 1.2 2.3 2.3 7.7 25.4 25.8 24.4 14.3
Norway 274.9 101.1 0.4 -48.0 -275.0 -258.4 -21.6 2.7
China 13.7 -101.4 3.6 47.4 126.1 90.6 695.8 255
Others 2,005 1,964 1,019 631.3 289.7 285.5 224.4 -93.0
T.I. P.P 5,409 3,719 2,150 1,634 820.7 1,456 1,667 851
FDI. E.P.P 5,276 3,719 2,150 1,634 820 1,456 1,698 851
* T.I.P.P = Total including Pvt. Proceeds * FDI. E.P.P= FDI Excluding Pvt. Proceeds
[Sources: State Bank of Pakistan ]
For the sector-wise, the FDI inflow in Pakistan is presented in Table A2 (See Appendix). The oil
and gas, and textile sectors are on the top of the list of sector-wise FDI inflow in Pakistan.
Page 16
15
4. THEORETICAL FRAMEWORK
In order to explain the impacts of FDI on host country economic development, the theoretical
perspectives can be splitted into two groups: the modernization (endogenous growth theory and
Innovation-based growth) and dependency theories.
4.1. Dependency theory
Dependency theory is based on the Marxist thought. Dependency scholars argue that developing
economies face negative impact from foreign investment due to profit repatriation, declining
reinvestment and income inequality. Therefore, foreign direct investment inflows to the
“periphery” distract local firms, stifle technological innovation and “crowd out” domestic firms
(Dixon and Boswell, 1996). Dixon and Boswell (1996) also concluded that FDI shows a positive
impact on growth in the start, yet in the long run the reliance on foreign investment shows a
negative effect on growth. The institutions and infrastructure support further FDI and negative
spillovers such as income inequality unemployment and over-urbanization.
Similarly, Moran (1978) suggests that foreign investors destroy host country political processes
by adopting the local elites and/or by utilizing their influence in their home countries. It is argued
that the benefits of FDI are poorly distributed between (Multinational Corporations) MNC and
the host country. MNC starts an economic surplus that could have been utilized for financing
international development. The economists primarily promoted the dependency theory of FDI
and its impact on economic development in developing countries throughout the 1970‟s and
1980‟s.
Furthermore, in line with the dependency theory, Kentor (1998) supported the fact in his study,
that the countries with relatively high foreign capital dependence (measured as accumulated
foreign stock) show slower economic growth than less dependent countries. These results are
also supported by the findings of Dixon and Boswell (1996). Kentor (2003) uses a different
measure to foreign investment concentration which is calculated as the percentage of total FDI
stocks considered for by the top financing country and still includes a long-term negative effect.
Page 17
16
According to Kentor, foreign investment concentration shows a significant, long term negative
effect on growth; its impact is intense over the starting five years and drops overtime.
4.2. Endogenous growth
Romer (1986) presented the endogenous growth theory and he is considered as one of the main
contributor to this theory. Endogenous growth reveals how FDI plays an essential role to
economic growth through labor training and skill acquisition not only through capital
accumulation and technology transfer. According to this theory, technology transfer, expansion
of the level of knowledge ascends through training and skills of labor. In the same way, through
the introduction of alternative management practices and organizational arrangements, domestic
firms can emulate from FDI. Thus, FDI may lead to output growth by increasing total factor
productivity due to an observed distribution of technology and increased efficiency through
better marketing, managerial structure, and superior technology (Blomstrom et al., 1996;
Borenztin et al., 1995; de Mello 1997, 1999). Additionally, endogenous growth literature has
shown country conditions that are relevant for FDI to have positive effects on growth such as the
interdependencies between domestic and foreign investment, appropriate level of human capital,
open trade regimes, and well developed financial markets.
4.3. Innovation-based growth by Grossman and Helpman
This growth model is defined by the drive force of economic development is innovation or
development of already existing products. The model is based on the theory that the growth of
capital is increased by innovation. I.e. the innovations play a very important role, because it
prompts the market so that it provokes more competition enhancing the economic development
(Mankiw & Taylor, 2008).
Page 18
17
Gene M.Grossman and Elhanan Helpman (1994) converted this model to a theory which
describes how innovation creates long-term growth in a host country. Their model mentions that
innovators tend to find more efficient production methods by upgrading already existing
products and services together with designing new ones. Additionally, the condition for this
market presents a state of damaged competition that allows innovators to take advantages over
their competitors which consequently motivates investors to advance in (research and
development) R&D. Thereupon; firms will fix prices on products and services in order to cover
production and R&D expenditure. So the outcome of future possible capital results in continuous
innovation and research (Grossman – Helpman, 1994).
According to Grossman-Helpman (1994), the impact of the institutions in the countries regarding
protection of property rights is being highlighted which indicates that the inventor get exclusive
rights and protection on their inventions. Therefore, a good protection of property rights is
important to encourage investing in R&D since it makes it possible to achieve market share and
make profit until a competing firm improves its innovation. Furthermore, due to progress in
production and technology, labor skills in the economy also get improved implying that the
human capital also increases over time (Grossman-Helpman, 1994).
Graham and Krugman (1991) support an assumption that FDI further is more productive than
domestic investment in developing countries. This assumption is grounded on the belief that
domestic firms have better know-how and approach to domestic markets as compared to foreign
firms. Thus if a foreign firm decides to participate in the market, it must repay for the advantages
utilized by domestic firms. Similarly, a foreign firm that decides to invest in another country
gains advantages from lower costs and higher productive efficiency than its domestic
competitors. Whereas, in case of developing countries, a combination of advanced management
skills and more modern technology would result in higher efficiency of FDI (Graham and
Krugman 1991).
Page 19
18
4.4. Technology spillovers
The Models of FDI and positive spillovers were presented in details in 1970s. Hymer seminal
study (1976) hypothesized international differences across firms at scientific and technological
levels which were caused due to technology transfer and spillovers. According to Hymer, FDI
was considered as an international extension of industrial organization theory while assuming
FDI to symbolize the transfer of a “package” in which capital, management, and new
technology are all united. Koizumi and Kopecky (1977) founded a model which explains the
transfer of technology from a parent firm to its subsidiary. When considering this case, Scientific
and technological transfer determine the productivity in a host country. Why some countries
grow faster than others can be better understood by the nature of technology spillovers.
Technological knowledge can be used by producers other than the inventors to boost their
productivity due to its non-rivalry nature.
Spillover Channels
Technology spillovers from foreign to domestic firms can be performed through a variety of
channels.
Skill
Firstly, knowledge transfer can take place through labor mobility (Fosfuri, Motta, and Ronde,
2001; Glass and Saggi, 2002). Trained Workers of MNCs with knowledge and technical skills
can move to domestic firms. Foreign firms will try to counter knowledge outflows by offering
higher incomes to hold workers and also to attract skilled workers from domestic firms (Sinani
and Meyer, 2004).
Demonstration effect
Secondly, domestic firms may become more proficient emulating the production, management,
and marketing technology of foreign firms. The relationships between foreign and domestic
firms can lead to the utilization of better technologies and modern business practices such as
just-in-time (JIT) inventory practices and quality assurance (QA) programs. Domestic firms are
Page 20
19
reluctant to adopt expensive technology and they will be more likely to do so when they see
foreign firms utilizing technology successfully. It is considered as the “demonstration effect”
(Wang and Blomström, 1992).
Competitive effect
Due to entry of foreign partners, a greater competition in the host country market is observed
(Caves, 1974; Wang and Blomström, 1992). Competition makes domestic firms forcefully use
resources more efficiently and adopt advanced productive technologies, which leads to
productivity gains. However, competition can also create negative spillovers. As a result of
greater competition at home, can restrict market power of domestic firms can be limited and their
market shares can be declined. If decreased market shares cause decreased capacity utilization in
existing companies, or the use of smaller production facilities, domestic firms will be enforced to
work on a less efficient scale while diffusing the advantages of technological innovations to
consumers in other countries.
Linkages
A final spillover channel includes backward and forward linkages between foreign associates and
domestic firms. Spillovers can be horizontal or vertical in nature. Horizontal spillovers increase
productivity of domestic firms that have the same position in the supply chain as competing
foreign firms. Vertical spillovers may exist between domestic suppliers of intermediate inputs
and their multinational clients (backward linkages), or between foreign input suppliers and
domestic customers of intermediate inputs (forward linkages). These linkages effects have been
determined by Lall (1978) and Clare (1996). Borensztein et al. (1998) argued that FDI raises the
range and quality of intermediate goods, which in turn enhances productivity.
Finally, modernization theory scholars, on one hand, argue that FDI increases income level and
provides employment opportunities to the host country thereby enhancing overall economic
growth. On the other hand, dependency theory scholars argue that MNCs may suppress
Page 21
20
economic development by extracting local entrepreneurs, by deteriorating the distribution of
income, by decreasing consumer welfare and introducing inadequate consumption pattern in the
host countries. Alternatively, constructive effects of FDI is not a given fact, it perhaps depends
significantly on host country enabling environment, political and macroeconomics stability,
institutional capacity, infrastructure and educational system.
Page 22
21
5. Data
This study investigates the impacts of the FDI on the GDP growth of Pakistan by using time
series data over the period 1966-2014. The data used in this study are taken from the World
Bank‟s World Development Indicators. My dependent variable is the real GDP per capita
(current US dollar) of Pakistan. Independent variables are the FDI, the population, the gross
capital formation (GCF), the inflation and the trade. .All series are in natural logs form due to
removing sharpness in the time series data (Karagol, 2006). This log transformation is the best
option for unbiased empirical evidence (Sezgin, 2004). I used Microfit software 4.1 for my
estimation. The explanations of the independent variable are follows.
Foreign Direct Investment (FDI) is an investment “made by a company or entity based in one
country, into a company or entity based in another country. The FDI differ substantially from
indirect investments such as portfolio flows, wherein overseas institutions invest in equities
listed on a nation's stock exchange”. It is taken as percentage of GDP.
Population (POP) is described as population over age 15 to 64 which is taken as a labor input
due to missing data. Total labor force is made up of economically active group of people aged 15
and older according to the International Labor Organization, which defines this group of people
as supplier of labor for the production of goods and services during a specific time period. Both
the employed and the unemployed belong to this group. It is taken in billions.
Inflation (INF) is define as consistently rise in the level of price of goods and services along
decreasing the purchasing power of Currency. State bank limit the inflation to avoid deflection
for an economic growth. It is taken as annul percentage.
Gross Capital Formation (GCF) comprises of outlays on additions to the fixed assets of the
economy and net changes in the level of inventories. Fixed assets can be defined as land
improvements (fences, ditches, drains, etc.) equipment, machinery and plant purchases;
construction of roads and railways. It also includes construction of hospitals, schools, offices,
private residencies as well as commercial and industrial buildings. It is taken as percentage of
GDP.
Page 23
22
Trade (TRADE) includes the sum of all exports and imports in an economy. It is taken as
percentage of GDP.
Table 2. Descriptive Statistics.
Variables MEAN MEDIAN MAX MIN Std. Dev. Kurtosis Skewness
lnGDP 5.9868 5.9848 7.1828 4.6081 0.6733 2.3086 0.0043
lnFDI 0.8701 0.6844 3.6683 0.0094 0.7406 8.6343 2.3775
lnINF 2.0284 2.0498 3.2832 0.1107 0.5936 4.0829 -0.4741
lnPOP 18.462 18.507 19.036 17.796 0.3805 1.7515 -0.2015
lnTRADE 3.4704 3.5038 3.6612 2 .9923 0.1441 5.0580 -1.4508
lnGCF 2.8525 2.8846 3.0358 2.5595 0.1120 2.8674 -0.8056
* Total 49 observation is used.
The statistic description is reported in Table 2. I have total 49 observations. As can be seen, the
mean value of lnFDI is relatively small in comparison with the mean of lnGDP. For some years,
there were very little foreign direct investment and for some years, high figures for FDI are
observed. So that is a reason of high standard deviation value of lnFDI.
Figure 1, shows plots all the variables over time. The lnFDI and lnGDP show fluctuated trends
along time. In 1971, the LnFDI shows a sudden decrease. The reason behind was a war against
India which resulted in separation of Bangladesh from Pakistans.
Page 24
23
Figure 1. The graphical moment of the all Variables over time.
4.5
5.0
5.5
6.0
6.5
7.0
7.5
70 75 80 85 90 95 00 05 10
LNGDP
0
1
2
3
4
70 75 80 85 90 95 00 05 10
LNFDI
0
5
10
15
20
25
30
70 75 80 85 90 95 00 05 10
LNINF
17.6
18.0
18.4
18.8
19.2
70 75 80 85 90 95 00 05 10
LNPOP
2.5
2.6
2.7
2.8
2.9
3.0
3.1
70 75 80 85 90 95 00 05 10
LNGCF
2.8
3.0
3.2
3.4
3.6
3.8
70 75 80 85 90 95 00 05 10
LNTRADE
Page 25
24
6. METHODOLOGY FRAMWORK
The OLS (ordinary least squares) method results how much each independent variable affects the
dependent variable, holding other independent variables constant. Whereas Yt is a dependent
variable and Xt is an independent variable and Ut is an error term in the following sample model,
(1)
Equation (1) is supposed as a long run model. In order to confirm the existence of a long run
relationship, a bound testing technique is applied in the model. So the equation (1) is used as a
conditional ARDL (Auto regressive Distributed Lag) model.
= ∑ ∑
(2)
Where as are white noise errors and are drift component.
This estimation technique was introduced by Shin and Smith (1995, 1999), and Perasan et al
(2001). It is used to confirm the long run relationship between the variable based on t-test or F-
tests standards. Most important advantage in this technique is that they excluded pre unit root
testing. The variable may be stationary I(0), Integrated of order I(1), or mutually co- integrated.
This is a major advantage of bound testing technique, because the main variables should be
stationary and other variables should not (Mohsen Bahmani-Oskooee & Rajarshi Mitra, 2008b).
Eventually, the bound test technique has the ability to find the short run and long run results from
the same model.
In equation (2), short run results are derived from the estimation of and and long run effect
is inferred by the estimate of which is normalized on . A linear combination of the lagged
level of all variables in equation (2) is called as error correction term ECM.
First step in order to estimates an ARDL model is to apply either t-test (for null hypothesis :
) or F-test (for significance of the lag level). Bahmani-Oskooee & Ardalani (2006)
explained that the F-test will be more sensitive to the order of lags. So a selection of lag length
is important procedure in the first step. Pesaran et al., (2001), introduced a fixed number of lags
on each first differenced variable and selected optimal lag on each variable by using Akaike‟s
Page 26
25
Information Criterion Value (AIC). In order to estimate an ARDL model we initially estimated
for all lags with maximum of 3 lags by the OLS technique.
After selecting optimal lags, t –test or F-test is carried out to confirm the presence of co-
integration. Those two statistical methods are applied to the bounds test with new critical values,
which are suggested by Pesaran et al. (2011). Due to independent variables being I(d) (where 0 ≤
d ≤1), two asymptotic critical value bounds provide a test for co-integration (see more De Vita &
Abbott, 2002). While assuming all regressors to be stationary or I(0), a lower critical value is
emerged. Whereas an upper value emerged by assuming all variables to be integrated of order
one or I(1). A long run relationship will be resulted, when test statistics lie above the respective
upper critical values. In case, the test statistics fall below the lower critical values, the null
hypothesis of no co-integration will not be rejected. At last, if the statistics fall within their
respective bounds, inference would be indeterminate.
In the next step, the long run and short run model can be derived after the confirmation of co-
integration existence among those variables in equation (2). Estimation of conditional long run
coefficients in equation (1) can be attained by following formulas (Pesaran, 1999).
In order to form an error correction known as ECMt-1, estimation of is used. When all
variables are adapted toward their long run equilibrium, the gap between the dependent and the
independent variables measured by the coefficient associated to ECMt-1 must decline. In other
words, a negative and significant coefficient accessed for ECMt-1 will not only be a signal of
adjustment toward equilibrium but also an alternative way of supporting co-integration among
variables. The adjustment parameter in absolute value is located between zero and one. The
Page 27
26
larger the error correction coefficient is, the faster is the economy‟s return to its equilibrium after
a shock (Huchet-Bourdon, M. and J. Korinek, 2011).
Finally, the cumulative sum of recursive residuals (CUSUM) and the cumulative sum of squares
of recursive residuals (CUSUMsq) tests are applied for checking the stability of the model.
Examining the prediction error of the model is another way of ascertaining the reliability of the
ARDL model. If the error or the difference between the real observation and the forecast is
infinitesimal, then the model can be regarded as best fitting. The Lagrange multiplier (LM) test is
also applied to check for non-autocorrelation of residual.
6.1. MODELS
The underlying theory of my research proposal is motivated by a standard growth model where
the FDI and the trade are introduced as determinants of investment (see Burnside and Dollar,
2000; Catrinescu et al, 2009). Mathematically, the growth long run model is formulated as log-
linear form in equation (3):
(3)
In equation 3, LnGDP is a log of real GDP per capita,
LnFDI is a log of foreign direct investment,
LnPOP is a log of Population,
LnTRADE is a log of trade,
LnINF is a log of inflation and
LnGCF is log of Gross capital formation.
Whereas the FDI and the trade support growth via external sources. The data of the entire
variable is taken in logarithm form; which is good for the elasticity estimating. In the above
Page 28
27
equation, positive estimation of , mean an increase inflow of FDI will considered to boost the
Pakistan economy expected. I also expect positive signs for other remaining coefficients except
for
The estimations of the coefficient to determine the long run impacts of all the independent
variables on the dependent variable. To find the short run impact, long run model expressed in
ECM Model form as in the below equation.
∑ ∑
∑
∑ ∑
∑
(4)
In equation (4), The estimations of - represent the short impacts of the independent
variables on the GDP growth of Pakistan and the estimations of divided by
determine the long run impacts. The long run coefficients for the equation (3) are calculated
by,
=
;
;
;
;
;
For investigating the existence of long run relationship in the model, bounds testing approach is
applied. Further, a negative and significant value of error-correction term also indicates an
existence of a long run relationship in the model.
Page 29
28
7. RESULTS AND DISCUSION
7.1. Unit Root and Stationary Test
Table 3: Unit Root Results
Variables At Level P value At 1st difference P value Order of Integration
lnGDP 0.9252 0.0000 I(1)
lnFDI 0.0330 I(0)
lnINF 0.0196 I(0)
lnPOP 0.0040 I(0)
lnTRADE 0.1316 0.0000 I(1)
lnGCF 0.2493 0.0000 I(1)
* With Constant and Trend.
The main advantage of ARDL is to skip the classification of variable into I(0) or I(1), because
unit root pre-testing is not necessary. According to Sezgin and Yildirim, (2002) and Ouattara
(2004), the computed F-statistics provided by SPSS (2001) become invalid in the presence of
I(2) variables, due to bounds test, which is based on the assumption of the variables I(0) or I(1)
or mutually being co-integrated. Therefore, the application of unit root test in the ARDL
procedure might still be essential in order to assure that none of the variable is integrated at
order 2 i.e. I(2) or above. For this reason, the Augmented Dickey Fuller (ADF) unit-root test has
been used to search for the order of integration of concerned participants in the study.
Page 30
29
Table 3 shows the result of unit root test. It shows that the, the lnFDI, the lnINF, and the lnPOP
series are stationary at level I(0). But, lnGDP, the lnTRADE and lnGCF series have unit roots
but at the first difference, these series become stationary, I(1).
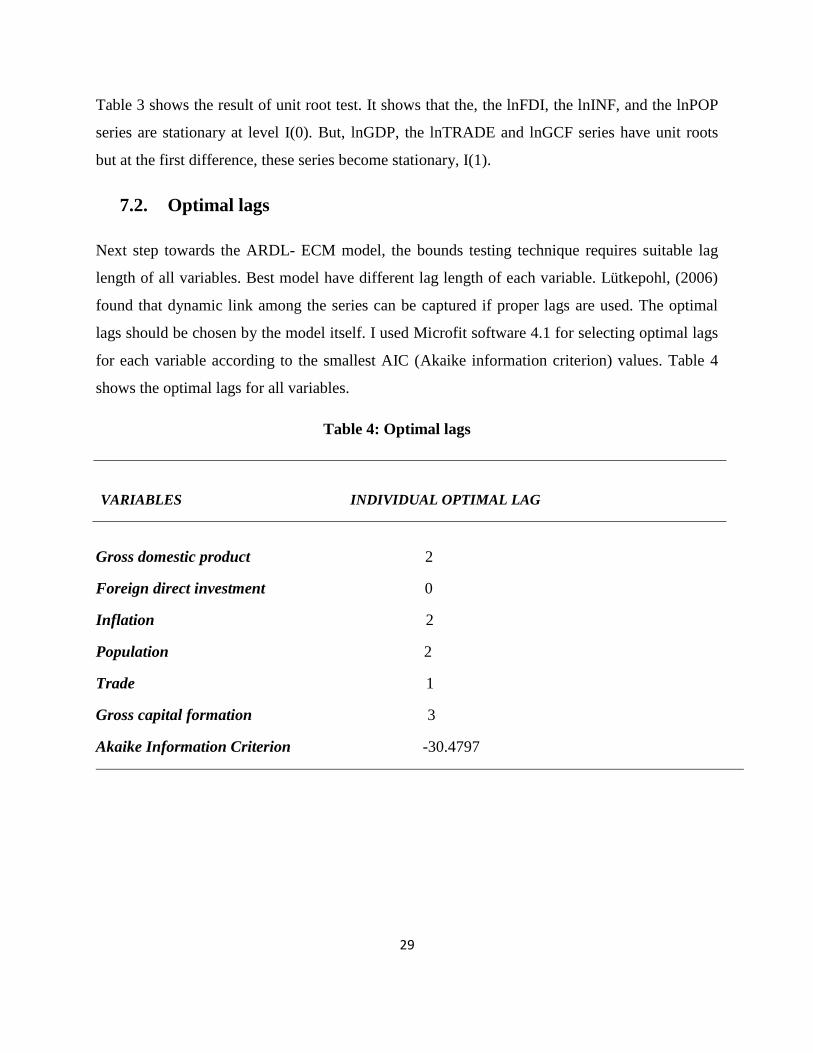
7.2. Optimal lags
Next step towards the ARDL- ECM model, the bounds testing technique requires suitable lag
length of all variables. Best model have different lag length of each variable. Lütkepohl, (2006)
found that dynamic link among the series can be captured if proper lags are used. The optimal
lags should be chosen by the model itself. I used Microfit software 4.1 for selecting optimal lags
for each variable according to the smallest AIC (Akaike information criterion) values. Table 4
shows the optimal lags for all variables.
Table 4: Optimal lags
VARIABLES INDIVIDUAL OPTIMAL LAG
Gross domestic product 2
Foreign direct investment 0
Inflation 2
Population 2
Trade 1
Gross capital formation 3
Akaike Information Criterion -30.4797
Page 31
30
7.3. Short run analysis
Results of short run estimation of the ARDL model are presented in Table 5. The adjusted F
statistics and R2 turn out satisfactory to my short run estimations. The sign and the magnitude of
the coefficient of the ECM determine a short-term adjustment process.
In Table 5, the coefficient of the ECM turns out being statistically significant (-1.7369),
suggesting a converging to the equilibrium path, the error-correction process converges
equilibrium path less than in a year. The significance and the correct sign of the error correction
coefficient also confirm the presence of a long-run equilibrium association between the
economic growth and the independent variables included in the model.
The FDI has significant and positive impact on the GDP growth of Pakistan. The magnitude of
the coefficient is 0.249. This result is consistent with both endogenous theory and Innovation-
based growth model. So the Pakistan economy is boost by FDI spillover as I discussed
previously. Blomstrom M.lipsey, R, S Zejan, M. (1996) also found that the FDI has a significant
and positive impact on the economy of the receiving countries and the FDI allows the developing
countries to make exchange with other countries, so its impact is positive on the economy.
The population has a significant effect on the growth. The first lag of the population shows a
negative effect while other two population variables show positive effects. A positive impact was
found in the previous study of Fikirte Tsegaye Mamo (2012).
The coefficient of the inflation at the year t and the year t-1 are insignificant in the short run
analysis. The second lag is significant but positive. Stockman (1981) also found a positive
impact of the inflation on the economic growth.
I find no significant impact of the trade on the economic growth, which is surprising because
mostly trade delivers significantly positive impacts on growth (Najia Saqib1, Maryam Masnoon
and Nabeel Rafique, 2013). However, Fatima Nishat (2010) found a negative relation of trade
with economic growth of Pakistan.
The gross capital formation at the same year shows a positive and significant coefficient. Florin-
Marius (2008) also found the positive impact of gross capital format on economic growth.
Page 32
31
In conclusion, the results validate the hypotheses that the FDI is positively associated with the
economy growth in Pakistan in the short run. The other factors, such as the foreign direct
investment, the gross capital formation, the inflation and the population have ambiguous effects
at different lags. Finally, there is no impact of the trade on the GDP.
Page 33
32
Table 5: Error Correction Model
Regressors Coefficient Standard Error T-Ratio Prob
dLnGDP1 -.25049 .15539 -1.6120 .118
dLnGDP2 -.48644 .15371 -3.1647 .003
dLnINF -.10653 .21728 -.49030 .627
dLnINF1 .12710 .21834 .58213 .565
dLnINF2 .71057 .15395 4.6157 .000
dLnFDI .24983 .16402 1.5232 .037
dLnGCF 3.6726 1.6661 2.2043 .035
dLnGCF1 -1.6032 1.4534 -1.1030 .279
dLnGCF2 -1.0504 1.5653 -.67105 .508
dLnGCF3 -2.1058 1.1331 -1.8584 .073
dLnPOP 572.898 174.8709 3.2761 .002
dLnPOP1 -950.525 351.9332 -2.7009 .011
dLnPOP2 379.2014 180.6712 2.0988 .045
dLnTrade -.36482 1.1180 -.32632 .746
dLnTrade1 1.6142 1.1059 1.4596 .155
ecm(-1) -1.7369 .25107 -6.9182 .000
R-Squared .73666 S.D. of Dependent Variable .65785
DW-statistic 2.1182 Equation Log-likelihood -14.4797
Page 34
33
7.4. Long run analysis
7.4.1. Bounds test
The existence of a long-run relationship is crucial for valid estimation and inference about the
model parameters. If a long-run equilibrium relationship exists, the ARDL technique can be used
to estimate the long run coefficients. Since the computed statistics fall outside the critical
bounds, the null hypothesis of non-existence of a long-run relationship between the variables can
be rejected at the 5% level of significance. The calculated F-statistic value is sensitive to the
selected lag technique. The total regressions generated by ARDL is [(p+1) k] = (6+1)2 = 49 for
each calculated equation; where K indicates the lag length and P indicates the number of
variables. The value of F-statistic is calculated from equation (5) by applying OLS technique in
Table 6. The value of F-statistic exceeds upper critical bound, based on the critical values
provided by Narayan (2005) or by a negative and significant ECMt-1 (t-statistics).
So the value of F-statics (5.4082) is higher than upper bound value (3.61) which indicates the
existence of long run relationship in our model.
Table 6: Bound Testing for the existence of a Level Long-Run Relationship
Bound Critical value
Unrestricted intercept and no trend
F-stat Value I(0) I(1)
5.4082 99 % 3.15 4.43
95 % 2.45 3.61
90 % 2.12 3.23
Page 35
34
7.4.2. Long run effects
I use Microfit 4.1 to obtain the long run estimation (Table 7). According to the estimated
coefficients, the FDI has a positive and significant impact on the GDP of Pakistan in the long
run. This result is consistent with the endogenous theory and Innovation-based growth model,
whereas it doesn‟t support the Dependency theory arguments in case of Pakistan. Both theories
show that the FDI boosts the economy growth through new technology progress, enhances
knowledge, consistency in investment and technological spillover. Thus economic growth
increases continuously over time. Bende –Nebende, A., Ford, J., Santoso B., S Sen, S (2003)
found a positive and significant impact on the economic growth. They also found that FDI have
more positive impact on developing as compared to developed countries. Mohey-ud-din, Ghulam
(2004) also found strong positive impact of FDI on economic growth of Pakistan. Due to new
protection policies and politically stability investors are highly interested in investing to Pakistan
economy.
The inflation has also a negative significant impact on the Pakistan‟s economy, which is similar
as the study of Amna et.al (2010). She found a negative impact of inflation on the Pakistan‟s
economy. The magnitude of the inflation‟s coefficient is -0.39.
This study finds a positive and significant long-run relation between the population and the GDP.
Here the population over age 15 to 64 is used as a labor input. Nawaz.M. Fafi (2015) found a
positive impact of the population on the economics growth of Pakistan. Following to the
exogenous growth theory, an increase in the technology and the knowledge transfer increases the
labor efficiency and the GDP.
The GCF has a negative and insignificant impact on economic growth of Pakistan. The sign of
the coefficient is against to exogenous growth theory. However, the negative sign is consistent
with many previous studies like Nawaz.M. Fafi (2015) to show the negative impact of the GCF
on the economic growth.
Consistently with the findings in the short-run analysis, the trade has no statically significant
impact on the GDP.
Page 36
35
Table 7: Long Run Elasticities
Regressors Coefficient Standard Error T-Ratio Prob
lnFDI -.39725 .15805 -2.5135 .018
lnINF .14383 .097187 1.4799 .050
lnPOP -.62573 .80891 -.77354 .445
lnTRADE .90628 .34753 2.6078 .014
lnGCF .71930 .98169 .73271 .470
Page 37
36
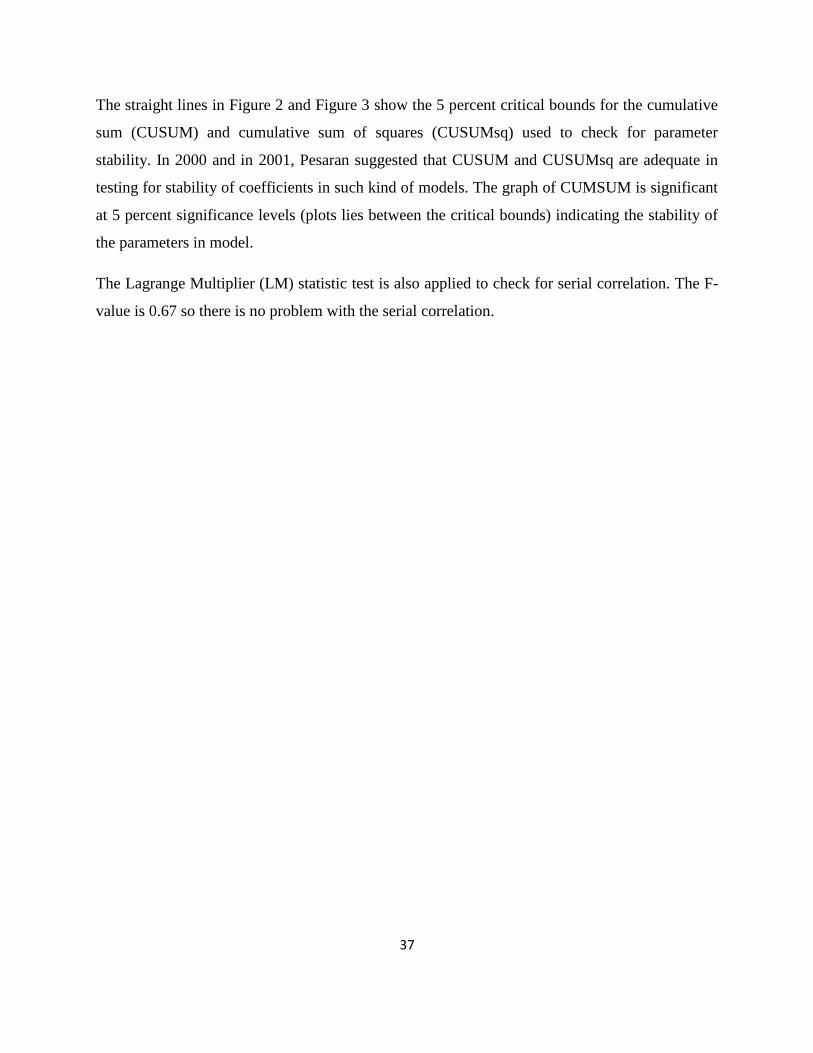
7.5. Sensitivity Analysis and Stability Test
Figure 2: Plot of Cumulative sum of Recursive Residuals (CUSUM)
Figure 3: Plot of Cumulative sum of Squares of Recursive Residuals (CUSUMq)
Plot of Cumulative Sum of Squares of Recursive Residuals
The straight lines represent critical bounds at 5% significance level
-0.5
0.0
0.5
1.0
1.5
1970 1975 1980 1985 1990 1995 2000 2005 2010 2014
Plot of Cumulative Sum of Recursive Residuals
The straight lines represent critical bounds at 5% significance level
-5
-10
-15
-20
0
5
10
15
20
1970 1975 1980 1985 1990 1995 2000 2005 2010 2014
Page 38
37
The straight lines in Figure 2 and Figure 3 show the 5 percent critical bounds for the cumulative
sum (CUSUM) and cumulative sum of squares (CUSUMsq) used to check for parameter
stability. In 2000 and in 2001, Pesaran suggested that CUSUM and CUSUMsq are adequate in
testing for stability of coefficients in such kind of models. The graph of CUMSUM is significant
at 5 percent significance levels (plots lies between the critical bounds) indicating the stability of
the parameters in model.
The Lagrange Multiplier (LM) statistic test is also applied to check for serial correlation. The F-
value is 0.67 so there is no problem with the serial correlation.
Page 39
38
8. CONCLUSION AND DISCUSSION
I aim to find the impact of the FDI on the economic growth of Pakistan over the period of 1966
to 2014 both in long-run and in short run by using ARDL technique. Furthermore, the bound
testing approach is applied to confirm the long run relationship in the estimation model.
The FDI has an overall positive and significant impact on the Pakistan‟s economy both in long
run and short run). One of the reasons to explain the positive impact is that the FDI inflow brings
the advanced technology and the investment enhancing the country economy.
The inflation is significantly negative correlated with the Pakistan economy in the long run while
the population shows positive and significant impact on the Pakistan economy in the long-run.
This study indicates that Pakistan is still struggling to develop from a labor intensive production
to a capital intensive country.
Together with the gross capital information, the trade has insignificant impacts on the GDP of
Pakistan, which is surprising. Pakistan is an agri-economy. Pakistan mostly imports raw material
at cheap rate and import final goods at expensive rates. This phenomenon is also called “Dutch
Disease Effects”. Through the advanced technology and knowledge transfer Pakistan should
increase the export of final goods to support the economy in a better way.
In this paper, I mainly study the relation between the FDI and GDP. It is also importance to
understand how others institutional factors impact the economic growth, which can be addressed
in the future papers. As I stated before, Busse and Hefeker (2007) pointed out that the political
risk and the quality of institutions in the host country matter most for the multinational
companies in making decision about where to invest in developing countries. The countries with
democratic stability are more likely to be attractive for multinationals and opposite to it countries
with higher political risk attract small FDI. The government stability, the absence of religious
and the ethnic conflicts and the democratic accountability processes are more closely to be
associated with the inflow of the FDI. Unfortunately, Pakistan is lacking these characteristics of
stable governments, religious and ethnic tolerance and democratic accountability since decades.
Therefore it has received less FDI as compared to the other countries in the region.
Page 40
39
Some policy suggestions for Government of Pakistan are stated here. In order to encourage the
foreign and domestic investors to invest in Pakistan, it is necessary to improve the protection and
insurance policies. Pakistan should increase the export of final goods through improvement in
infrastructure, construction of new roads, better transport facilities and installing advance
machinery that will reduce production cost inside the country. The corruption control policies,
the political stability are needed for better utilization of the FDI and other capital. There is a
requirement to improve quality and quantity of human capital and skills through better education,
health and training, so that FDI can be utilized in a better way while considering the trained and
skilled labor force.
Page 41
40
REFERENCES.
Agarwal, R., and Horowitz, A. W. (2002) Are International Remittances Altruism or Insurance?
Evidence from Guyana Using Multiple-Migrant Households.World Development, Vol. 30, pp.
2033-2044.
Ahmed, J. (2012) Cyclical Properties of Migrant's Remittances to Pakistan: What the data tell us.
Economics Bulletin, vol. 32(4): 3266-3278.
Alesina, A. and D. Dollar, (2000), “Who Gives Foreign Aid to Whom and Why?” Journal of
Economic Growth 5(1): 33-63.
Aning, K (2007) Security, the War on Terror and Official Development Assistance, Theme Paper
prepared for the project on Southern Perspectives on Reform of the International Development
Architecture.
Ang, J., (2008), “a survey of recent developments in the literature of finance and growth”,Journal
of Economic Surveys 22 (3) :536–576.
Bacha, E. L. (1990) “A Three-Gap Model of Foreign Transfers and the GDPGrowth Rate in
Developing Countries,” Journal of Development Economics, Vol. 32:279–29
Barro, R. and Sala-I-Martin, X. (1991)."Convergence across states and regions." Brookings
Papers on Economic Activity 1991(1): 107-182.
Bauer, P. (1991), “Foreign Aid: Mend It or End It?” in Bauer, P., S. Siwatibauand, and W.
Kasper, eds., Aid and Development in the South Pacific, Australia: Center for Independent
Studies.
Bahmani-Oskooee, M., & Payesteh, S. (1993). Does Exchange-Rate Volatility Deter
TradeVolume of LDCs? Journal of Economics Development, 18(2): 189-202
Barajas, A., Chami, R., Fullenkamp, C., Gapen, M., Montiel, P., (2009). “Do workers'
remittances promote economic growth?”, International Monetary Fund WorkingPaper No.
WP/09/153.
Barajas, A, Chami, R, Ebeke, C and Tapsoba, S (2012) Workers' Remittances: An Overlooked
Channel of International Business Cycle Transmission?IMF Working Paper No. 12/251.
Bende-Nabende, A., Ford, J., Santoso, B., & Sen, S., (2003), “The interaction between FDI,
output and thespillover variables: Co-integration and VAR analyses for APEC”, 1965-99.
Applied Economics Letters, 10(3).
Blomstrom, M., Lipsey, R., &Zejan, M., (1996), “Is fixed investment the key to economic
growth?”, Quarterly Journal of Economics, 111(1) : 269~76.
Page 42
41
Boone, P, (1994), “The impact of foreign aid on savings and growth”, Mimeo, London School of
Economics.
Borensztein, E., Gregorio, J., & Lee, J. (1998), “How does foreign direct investment affect
economic growth”, Journal of International Economics, 45(1) Borjas, G. (1995). “The Economic
Benefits from immigration” Journal of Economic
Burnside, C. and Dollar, D. (2000) Aid, policies, and growth.American Economic Review
90(4):847–868.
Burnside, C., and D. Dollar, (2004), “Aid, Policies and Growth: Revisiting Evidence”, Policy
Research Working Paper 3251. World Bank.Washington, D.C. Cassen, R., and Associates. 1994.
Does Aid Work? 2 nd ed. Oxford: Clarendon Press.
Caves R. E. (1974), „Multinational corporations, competition and productivity in host-country
markets,‟ Economica, 41:176-193.
Carl-Johan Dalgaard, Hhenrik Hansen et Finn Tarp, (2004), “On the empirics of foreign aid and
growth”, The economic journal, 114, F 191- F 216, Royal economic society 2004 .
Catrinscu, Leon-Lesdesma,Piracha et Quillin (2008), “Remittances, Institutions, and Economic
Growth”, World Development Vol. 37, No. 1, pp. 81–92, 2008 Elsevier.
Catrinescu, N., Leon-Ledesma, M., Piracha, M. and Quillin, B. (2009) Remittances, institutions,
andeconomic growth. World Development 37(1): 81–92.
Chenery, H.B. and Strout, A.M., (1966), “Foreign Assistance and Economic Development”,
American Economic Review 56(4): 679-733
Chauvet, L. and P. Guillaumont, (2002), “Aid and Growth Revisited: Policy, Economic
Vulnerability and Political Instability”, paper presented at the Annual Bank Conference or
Development Economics on Towards Pro-poor Policies, June, Oslo.
Chami R, Fullenkamp C and Jahjah S (2003) “Are Immigrant Remittance Flows a Source of
Capital For Development?” Washington, D. C.: IMF.
De Vita, G., & Abbott, A. (2002). Are saving and investment cointegrated? An ARDL bounds
testing approach. Economics Letters, Economics Letters, 77(2) :293-299.
De Jager, J. (2004). Exogenous and Endogenous Growth, University of Pretoria ETD.
Dixon, W.J. & Boswell, T. (1996). Dependency, disarticulation, and denominator effects:
Another look at foreign capital penetration. American Journal of Sociology, (102), 543‐562.
DOMAR, E., (1947) “Expansion and Employment,” American EconomicReview, (1, March),
No.37: 34-55.
Dollar, D, and V. Levin, (2004), “The Increasing Selectivity of Foreign Aid, 1984-2002”, World
Bank Policy Research Working Papers 3299, World Bank: Washington DC.
Page 43
42
Doornik, J. (2007). “Autometrics”.Working Paper, Economics Department, University of
Oxford.
Doornik, J. A. and D. F. Hendry (2007a). Empirical Econometric Modelling - PcGive 12:
Volume I. London: Timberlake Consultants Ltd.
Durham, J. B, (2004), “Absorptive capacity and the effects of foreign direct investment and
equity foreign portfolio investment on economic growth”, European Economic Review, 48(2) :
285-306.
Easterly, W.R. (2006), “The White Man‟s Burden: Why the West‟s Efforts to Aid the Rest Have
Done So Much Ill and So Little Good,” Economic and Statistics, 82(1): 1-11.
El-Sakka, M. and McNabb, R. (1999) The Macroeconomic Determinants of Emigrant
Remittances. World Development, 27(8)1: 493-1502.
Elboiashi, Hosein Ali (2011) The effect of FDI and other foreign capital inflows on growth and
investment in developing economies.
Fosfuri A. M., and Ronde, T. (2001), „Foreign direct Investment and Spillovers through
Workers‟ Mobility,‟ Journal of International Economics, 53: 205-222.
Geneva JackyAmprou et Cauvet Lisa, (2007), “Débatssurl‟Efficacité de l‟aide: fondements et
nouveaux enjeux”, Agencefrançaise de développement, 2007.Journal of Economic Surveys 22
(3) :536– 576.
Glass A. J and Saggi K (2002), „Intellectual Property Rights and Foreign Direct Investment,
“Journal of International Economics, 56: 387 – 410.
Gorg, H and Greenaway, D. (2004). Much ado about nothing. Do domestic firms really benefit
from FDI. The world Bank research Observer, 19(2) :171-197.
Graham, E.H and Krugman, P. (1991). Foreign Direct Investment in the United States. http://onlinelibrary.wiley.com/doi/10.1111/j.1467-6435.1991.tb01777.x/abstract. (Accessed on
10 june 2016 at 10:00).
Grossman, G.M. & Helpman, E. (1994) „Endogenous Innovation in the Theory of Growth‟ the
Journal of Economic Perspectives, Vol. 8, No. 1: 23-44
Hansen, Henrik and Finn Tarp, (2000), “Aid Effectiveness Disputed”, Journal of International
Development. April, 12:3, pp. 375–98.
Haas, H. D., 2008. Migration and Development: A Theoretical Perspective. Working Paper No.
9.International Migration Institute.University of Oxford, Oxford.
Harrod, R., (1948) Towards a Dynamic Economics. London: Macmillan.
Hendry, D. F. and H.-M.Krolzig (2001). Automatic Econometric Model Selection using PcGets.
London: Timberlake Consultants Press.
Page 44
43
Ho, S., Kauffman, R. and Liang, T. (2007). "A growth theory perspective on B2C e-commerce
growth in Europe: An Exploratory study." Electronic Commerce Research and Applications 6:
237-259.
Hussain, F., and Kimuli, C.K (2012). Determinants of Foreign Direct Investment Flows to
Developing countries. SBP Research Bulletin 8(1) :13-31.
Huchet-Bourdon, M. and J. Korinek. (2011). To What Extent Do Exchange Rates and their
Volatility Affect Trade (OECD Trade Policy Working Papers No. 119). OECD Publishing.
Hymer, S. H. (1976), „The International Operations of National Firms: A Study in Direct
Foreign Investment, ‟ PhD dissertation, MIT, 1960, Cambridge, MA: MIT Press.
Hysenbegasi, A. and S. Pozo.(2002) What Prompts Workers to Remit? Evidence Using a Panel
of Latin American and Caribbean Nations.Working Paper, Western Michigan University.
Kentor J. and Boswell T. (2003): Foreign Capital Dependence and Development: A New
Direction, American Sociological Review, Vol. 68, No. 2:. 301-313
Khan . A. H.(1997). Foregin direct investment in pakistan: policies and Trends. The Pakistan
development review, 36(4) :959-985.
Khan, M.A. (2007).Foregin direct investment and economic growth: the role of domestic
financial sector. Pakistan institute of Development economics, working paper, 18(1): 1-47.
Khan, M.A. (2008). Financial Development and Economic growth in Pakistan: Evidence Based
on Autoregressive Distributed lag Approch . South Asia Economic Journal, 9(1) :375-391.
Lall, S. (1978), „Transnationals, Domestic Enterprises and Industrial Structure in LDCs: A
Survey, ‟ Oxford Economic Papers, 30: 217-248.
Leuth, Erik & Ruiz-Arranz, M, (2007) Are Workers‟ Remittances a Hedge Against
Macroeconomic Shocks? The Case of Sri Lanka.IMF Working Paper, 07/22.
Lucas, R.E., (1977). Understanding Business Cycles, in K. Brunner and A.H. Meltzer, eds.,
Stabilization of the Domestic and International Economy, Amsterdam: North Holland.
Lisa Chauvet et Patrick Guillaumont (2003), “AID and growth revisited : Policy, Economic
vulnerability and Political Instability‟‟, CERDI, CNRS, Universitéd'Auvergne, E 2003.27.
Lucas and Stark (1985) Motivations to Remit: Evidence from Botswana, Journal of Political
Economy, Vol. 93(5) :901-918.
Lucas, R.E, (1988), “On Mechanics of Economic Growth,” Journal of monetary Economics, 22
(July):3-42.
Page 45
44
Malik, Sohail. J., S. Aftab, and N. Sultana (1994). Pakistan‟s Economic Performance 1947-1993:
A Descriptive Analysis, SURE Publishers Lahore, Pakistan.
Malik, A. (2009). Quality and Coordination of Official Development Aid in Pakistan, Working
Paper 11. Washington, DC: Wolfensohn Center for Development.
Mankiw, N.G. & Taylor, M.P. (2008) „Macroeconomics‟ New York; Worth Publishers
Migration” World Bank: Washington DC World Bank, (1998), “Assessing Aid: What works,
what doesn't, and why?” New York (Oxford University Press).
Moran, T. (1978): Multinational corporations and dependency: A dialogue for dependentistas
and non‐dependentistas, International Organization, 32:79‐100.
Msley, P., Hudson, J. and HORRELL, S. (1987) “Aid, the Public Sectorand the Market in Less
Developed Countries,” Economic Journal, Vol. 97:616–41.
Mughal, M.Y. (2012) Remittances as development strategy: Stepping stones or slippery
slope?‖Journal of International Development, 24:8.
Mughal, M.Y. and Anwar, A.I. (2012) Remittances, Inequality and Poverty in Pakistan: Macro
and Microeconomic Evidence. Working Papers 2012-2013_2, CATT - UPPA - Université de Pau
et des Pays de l'Adour, revised Aug 2012.
OECD (Organisation for Economic Co-operation and Development) (2012), ODA Receipts and
Selected Indicators for Developing Countries and Territories.
Nawaz, R,M. (2014) An analysis of linkage between foreign directinvestment and GDP per
Capita in Pakistan.http://www.diva-portal.se/smash/get/diva2:703232/ATTACHMENT01.pdf.
(Accessed on 26 Feb 2016 at 11:00).
Papanek, G.F. (1972) The Effects of Aid and Other Resource Transfers on savings and Growth
in Less Developed Countries,” Economic Journal, Vol.82: 934–50.
Pakistan Economic Survey (2012).Pakistan Economic Survey, Ministry of Finance, Government
Pakistan.
Pesaran, M. H., Shin, Y., & Smith, R. J. (2001). Bounds testing approaches to the analysis of
level relationships. Journal of Applied Econometrics, 16(3) :289-326.
Quartey, P., (2007) Migrant Remittances and Household Welfare in times of Macro volatility:
the case of Ghana. ISSER Technical Publication Number 61, ISSER, University of Ghana.
ISBN: 9964-75-057-9.
Page 46
45
Rahman, M. M., (2000). Emigration and Development: The Case of a Bangladeshi Village.
International Migration, Vol. 38 (4)1: 09-130.
Ratha, D. (2003) Workers‟ Remittances: An Important and Stable Source of External
Development Finance. In Global Development Finance 2003, Striving for Development Finance,
The World Bank, Washington D.C.
Ratha, D (2007) Leveraging Remittances for Development.‖ Policy Brief, Migration Policy
Institute, Washington DC.
Romer, P. (1993). "Two Strategies for Economic Development: Using Ideas and Producing
Ideas." The World Bank Economic Review: 63-98.
State Bank of Pakistan (various issues) Balance of Payments Statistics of Pakistan.
Stahl, Charles W. and Fred Arnold, (1986), “Overseas Workers‟ Remittances in Asian
Development,” International Migration Review, 20 (4): 899-925.
Sahoo, P. (2006). Foregin direct investment and growth in south asia:policy , trend, impact and
determinats, (56). Asis Development Bank Insittute Discussion Papers.
https://www.econstor.eu/dspace/bitstream/10419/53445/1/521368502.pdf (Accessed on 26 Feb
2016 at 10:00).
Solow, R., (1956), “A Contribution to the Theory of Economic Growth,” Quarterly Journal of
Economics, 70(February): 65-94.
Suleri, A., and K. Savage. (2006) Remittances in Crisis: A Case Study from Pakistan.
Humanitarian Policy Group, Overseas Development Institute, London.
Taylor, L. (1990) A Three-Gap Model, Problems of Developing Countries in the1990s. World
Bank, Washington DC: 55–90.
Wang, J.-Y., and M. Blomstrom (1992), „Foreign Investment and Technology Transfer, a Simple
Model,‟ European Economic Review 36(1):137-55.
Woodruff, Christopher, and Rene Zenteno.(2001) Remittances and Microenterprises in
Mexico.Unpublished paper, University of California, San Diego.
World Bank. (2005) Global Economic Prospects: Economic Implications of Remittances and
Migration. Washington DC: World Bank.
World Bank, (2006), “Global Economic Prospects, Economic Implications of Remittances and
Migration” World Bank: Washington DC.
World Bank and International Finance Corporation (2011). Ease of doing business 2011, making
a difference for entrepreneur.
Page 47
46
Zakaria, M.(2008). Investment in pakistan: A critical review, MPRA paper 11543.
Page 48
47
APPENDIX.
Table A1. Hurdles’ faced by Pakistan’s economy.
Year Events consequences
1971 -Civil war Creates instability in Country and loss of East Pakistan
-War against Indian and Resources.
-Resignation by president
1977 -Political instability Martial Law rule 11 year and effect public policy.
-Pakistan army took control
1985 -unfair general election Week democracy.
1988 -President died in Plain crash Midterm election, Change in Afghan war policies.
With 29 senior army officer
1990 -Midterm election Opponents from Government.
1993 -Midterm election Opponents from Government.
1996 -Midterm election Opponents from Government.
1998 -Pakistan test nuclear devices America impose International trade restrictions.
1999 -War against India Relation affected with international community.
2005 -Earthquake destroy infrastructure and property, causing 82,000
Deaths.
2007 -terrorism activity start law and order disturbed due to suicide bombing.
in the country
2008 -Bombay bomb attack Raise tension with India and got threats of attack
from India.
2010 -sever flood in Pakistan Affecting crops ,infrastructure and property
[Source: Nawaz, R, M. (2014) ]
Page 49
48
Table A2. Sector wise FDI flow toward Pakistan.
COUNTRY 2008 2009 2010 2011 2012 2013 2014
Oil & Gas 775.0 740.6 512.2 629.4 559.6 502.0 246.1
Financial Business 707.4 163.0 310.1 64.4 314.2 192.8 256.4
Textiles 36.9 27.8 25.3 29.8 10.0 -0.2 43.9
Trade 166.6 117.0 53.0 25.3 5.7 -3.2 50.0
Construction 93.4 101.6 61.1 72.1 46.0 28.8 53.5
Power 130.6 -120.6 155.8 -84.9 28.4 71.4 201.7
Chemicals 74.3 112.1 30.5 96.3 71.6 94.9 55.3
Transport 93.2 132.0 104.6 18.7 44.1 2.7 6.2
Communication
(IT&Telecom) 879.1 291.0 -34.1 -312.6 -385.7 434.2 45.1
Others 763.4 586.3 416.3 282.2 765.5 375.2 -107.0
Total including Pvt.
Proceeds 3,719.9 2,150.8 1,634 820.7 1,456.4 1,698.6 851.2
[Sources: State Bank of Pakistan]