Page 1
ORIGINAL PAPER
Impact of petroleum coke characteristics on the adsorptionof the organic fractions from oil sands process-affected water
P. Pourrezaei • A. Alpatova • P. Chelme-Ayala •
L. A. Perez-Estrada • M. Jensen-Fontaine •
X. C. Le • M. Gamal El-Din
Received: 23 August 2012 / Revised: 30 April 2013 / Accepted: 21 October 2013 / Published online: 7 November 2013
� Islamic Azad University (IAU) 2013
Abstract Petroleum coke (PC) is a waste by-product
generated during the oil upgrading processes by the
petroleum industry. The continuing accumulation of large
quantities of PC requires the development of innovative
strategies for the effective utilization of this carbon-rich
material. In this study, PC was used for the removal of
naphthenic acids (NAs) and acid-extractable fraction
(AEF) from oil sands process-affected water (OSPW),
generated during the oil refining process. A systematic
study on the adsorption of organic fractions, vanadium
leaching from PC, adsorption mechanisms, and the effect
of physico-chemical characteristics of the PC on adsorption
process was performed. Physico-chemical properties of PC
were determined by Fourier transform infrared spectros-
copy (FT-IR), X-ray photoelectron spectroscopy, thermo-
gravimetric analysis (TGA), scanning electron microscopy,
and Brunauer–Emmett–Teller surface area analysis. AEF
and NAs removals of 60 and 75 %, respectively, were
achieved at PC dose of 200 g/L after 16 h of contact. FT-
IR and TGA analysis of PC suggested the physisorption of
organic compounds onto the surface of PC. The calculated
mean free energy of adsorption (E \ 8 kJ/mol) also indi-
cated the physisorption of organics to the PC surface. The
hydrophobic interactions between the NAs and the PC were
suggested as the dominant adsorption mechanisms. The
vanadium release occurred when PC was mixed with
OSPW and vanadium concentration increased with an
increase in the PC dose. Speciation analysis indicated that
the vanadium leached was predominantly vanadium
(V) and insignificant amount of vanadium (IV) was also
detected.
Keywords Adsorption � Petroleum coke � Naphthenic
acids � Vanadium � Oil sands process-affected water
Introduction
With a recoverable 170.4 billion barrels of bitumen,
Athabasca oil sands in Alberta, Canada, constitutes the
third largest oil deposit in the world after Venezuela and
Saudi Arabia (ERCB 2008; Gray et al. 2009; Watkins
2010). The increasing worldwide demand in crude oil
leads to a steady increase in the amount of waste by-
products generated by the petroleum industry including
coke, fly ash, and water tailings (Allen 2008a, b; Majid
and Kotlyar 1999; Malekshahian and Hill 2011). Petro-
leum coke (PC) is generated in large quantities during
the oil refinery process when the ratio of H:C has to be
upgraded (Speight 1998). With a 20 kg of PC typically
produced per barrel of synthetic crude oil (Zubot 2010),
the PC inventory in Alberta has reached 68 million
Electronic supplementary material The online version of thisarticle (doi:10.1007/s13762-013-0406-x) contains supplementarymaterial, which is available to authorized users.
P. Pourrezaei � A. Alpatova � P. Chelme-Ayala �L. A. Perez-Estrada � M. Gamal El-Din (&)
Department of Civil and Environmental Engineering,
University of Alberta, Edmonton, AB T6G 2W2, Canada
e-mail: [email protected]
M. Jensen-Fontaine � X. C. Le
Department of Chemistry, University of Alberta, Edmonton,
AB T6G 2G2, Canada
X. C. Le
Analytical and Environmental Toxicology, Department of
Laboratory Medicine and Pathology, University of Alberta,
Edmonton, AB T6G 2G3, Canada
123
Int. J. Environ. Sci. Technol. (2014) 11:2037–2050
DOI 10.1007/s13762-013-0406-x
Page 2
tonnes in 2010 (ERCB 2011). The presence of low
combustible volatiles and relatively inactive carbon
forms (Friedrich et al. 1983; Parmar and Tollefson 1977)
makes PC ineffective in heat generation as compared to
coal. The high sulfur and heavy metals content raises
significant environmental concern over its potential use
as an alternative energy source. PC has been investigated
as a precursor of activated carbon for the removal of
organic contaminants and heavy metals from aqueous
solutions (Yuan et al. 2010a; Zamora et al. 2004; 2000).
However, it has been reported that the activation of PC
significantly increased the vanadium concentration in the
treated water as compared to water treated with the fresh
PC (Zubot 2010). Therefore, the continuing accumula-
tion and stockpiling of large quantities of PC require the
development of innovative strategies for the effective
utilization of this carbon-rich material on an industrial
scale.
Another environmental concern in petroleum industry is
the process-affected water. One of the examples of such
water is the oil sands process-affected water (OSPW),
generated after Clark hot water extraction of bitumen from
oil sands operations. OSPW is a complex alkaline mixture
of inorganic and organic compounds (Allen 2008a, b).
OSPW is retained on-site, and a part of it is recycled back
to the extraction process to reduce the freshwater con-
sumption. As a result, it becomes corrosive and highly
toxic due to high concentrations of salts and refractory
organic compounds such as naphthenic acids (NAs) (Jones
et al. 2011). The storage of OSPW has raised several
environmental concerns, including the presence of trace
concentrations of NAs in surface waters around the oil
sands operation facilities due to their leaching from tailings
ponds (Allen 2008a).
Adsorption is viewed as an effective process to
remove persistent organic chemicals from wastewaters
(Zubot et al. 2012). Given the complexity of environ-
mental problems and continuous accumulation of dif-
ferent by-products that the petroleum industry is facing,
the process shortcomings can be turned into benefits by
applying one waste to treat another waste product. In
this approach, PC can be used as an in situ adsorbent for
the treatment of OSPW. Since PC is a residual of oil
refining, it is available virtually free of charge and does
not require any transportation costs. As such, the
investment cost associated with the development of any
other technology for OSPW treatment could be signifi-
cantly reduced. Currently, at Syncrude Canada Ltd.
production site in Alberta, Canada, PC, produced after
fluid coking process, is mixed with OSPW at approxi-
mately 22 % (by weight) before its transport to the
tailings ponds for a long-time storage (Zubot 2010). The
operating pipeline acts as a ‘‘plug-flow’’ carbon
adsorption reactor that reduces the concentration of
organic fraction in OSPW during the transfer process.
Water quality analyses have shown that chemical oxy-
gen demand (COD), concentration of acid-extractable
fraction (AEF), and NAs decreased after adsorption
(Gamal El-Din et al. 2011; Zubot 2010). The PC-treated
OSPW required less ozone doses to remove the
remaining organics, and the resulted water was more
biodegradable (Gamal El-Din et al. 2011). Majid and
Kotlyar (1999) showed that PC reduced the concentra-
tion of total dissolved carbon from 300–600 to \50 mg/
L during the removal of free phase bitumen from
wastewater by agglomeration.
Leaching of vanadium from PC and its environmental
impact has been investigated in several publications (Put-
taswamy and Liber 2012; Puttaswamy et al. 2010; Small
et al. 2012; Zubot et al. 2012). Vanadium, released from
PC, was accounted as a primary cause of leachate toxicity
to a freshwater invertebrate Ceriodaphnia dubia in a hard
reconstituted water (Puttaswamy and Liber 2011). In a
follow-up study, Puttaswany and Liber (2012) showed that
the concentrations of nickel and vanadium released into
water, which mimic anion content of OSPW, were above
the chronic C. dubia half-maximal inhibitory concentration
(IC50) or median lethal dose (LC50). However, OSPW
treated with PC did not show any toxicity toward Vibrio
fischeri and rainbow trout as compared to fresh OSPW
(Zubot et al. 2012).
The promising results with respect to the removal of
organic compounds and reduced toxicity of OSPW after
PC treatment require further evaluation of the PC for
the removal of organic compounds in terms of adsorp-
tion mechanism, adsorbent properties, and vanadium
speciation. The objectives of the present study were to:
(1) investigate the effect of the contact time and PC
concentration on the removals of AEF and NAs from
OSPW without any pre-treatment; (2) determine the
mechanisms of NAs adsorption on PC; (3) study the
effect of physico-chemical properties of PC on the
adsorption of NAs; and (4) investigate the vanadium
leaching from PC and its speciation during the adsorp-
tion process. To achieve these objectives, adsorption
studies were performed by mixing the PC and OSPW in
various proportions and for different contact times. The
experimental data were fitted to different adsorption
isotherms to determine the adsorption capacity and
elucidate the mechanism of NAs adsorption. The phys-
ical and chemical characteristics of the adsorbent were
evaluated by using Fourier transform infrared spectros-
copy (FT-IR), X-ray photoelectron spectroscopy (XPS),
thermogravimetric analysis (TGA), scanning electron
2038 Int. J. Environ. Sci. Technol. (2014) 11:2037–2050
123
Page 3
microscopy (SEM), and Brunauer–Emmett–Teller (BET)
surface area analysis. This work was conducted at the
University of Alberta, Canada, and was completed in
November 2011.
Materials and methods
Sampling
OSPW was collected in January 2010 from the West In-Pit
(WIP) recycle tailings pond at Syncrude Canada Ltd.,
Alberta, Canada. The barrels were transported to the Uni-
versity of Alberta, Edmonton, Canada, and stored at 4 �C.
OSPW characteristics are shown in Table 1. OSPW was
used as-received without any pre-treatment and all
adsorption experiments were conducted at room tempera-
ture (20–23 �C).
Adsorbents
PC was also provided by Syncrude Canada Ltd. The
samples were sieved by a No. 40 (0.422 mm) mesh to
separate the larger-sized clumps. Granular activated carbon
(GAC, JA04) was supplied by Jacobi Carbons (Jacobi
Carbons Inc., Columbus, OH, USA), and powdered acti-
vated carbon (PAC, WPX-Z) was purchased from Calgon
Carbon (Calgon Carbon Corporation, Pittsburgh, PA,
USA).
Preliminary adsorption experiments
This set of experiments was aimed at evaluating the
effects of adsorbent concentrations and contact times on
the overall adsorption of organic compounds from
OSPW. Adsorption studies were performed in a batch
mode in 500-mL stoppered conical flasks. Specific pre-
weighed amounts of PC, GAC, or PAC were mixed with
OSPW to result in 50, 100, 200, 300, and 400 g/L
concentrations. The control samples were prepared
without the addition of adsorbents. The flasks were
placed on an incubator shaker (New Brunswick Scien-
tific, Enfield, CT, USA) and shaken at 270 rpm. After
predetermined contact times (1, 3, 6, and 12 h), the
mixtures were filtered through 0.45 lm Nylon filters
(SUPELCO, Bellefonte, PA, USA). Untreated and
treated OSPWs were analyzed in terms of AEF con-
centration, COD, pH, and alkalinity. The two-tailed
t test at 95 % confidence interval was used to determine
the statistically significance of the results.
Equilibrium time experiments for PC
The aim of this set of experiments was to determine the
contact time needed for the concentration of AEF in the
liquid phase to reach equilibrium with the PC. Based on the
COD and AEF removals during the preliminary adsorption
experiments with PC and because of the dense slurry
formed upon mixing 300 and 400 g/L of PC with OSPW,
200 g/L concentration of PC was chosen to perform the
equilibrium time experiments. The experiments were con-
ducted for the contact times of 2, 4, 6, 8, 10, 12, 14, 16, 18,
20, 25, 30, 35, and 40 h by following the same procedure
described in the preliminary adsorption experiments sec-
tion. Untreated and treated OSPWs were analyzed in terms
of AEF removal.
Adsorption isotherms
In this set of experiments, the specific pre-weighed
amounts of PC, GAC, or PAC were added to OSPW to
result in a series of mixtures with the adsorbent concen-
trations in the range of 0–200 g/L for PC and 0–20 g/L
for PAC or GAC. The isotherms of adsorption experi-
ments were conducted in the same manner described in
the preliminary adsorption experiments section for 16 h
and 12 h for PC and GAC/PAC, respectively. The
experimental data were fitted to the Langmuir, Freund-
lich, and Dubinin-Radushkevich isotherm equations as
explained in detail in the Electronic Supplementary
Material (ESM).
End points for NAs analysis and physico-chemical
characterization of adsorbents
Because of the high cost and complexity associated with
the NAs analysis, the NAs removal was measured for
200 g/L of PC after 16 h of treatment and for 50 g/L of
PAC/GAC after 12 h of treatment. These conditions were
also used for the physico-chemical characterization of
adsorbents.
Table 1 Characterization of as-received OSPW (average of n = 3
replicates)
Parameter Value
pH 8.4 ± 0.2
Alkalinity (mg/L as CaCO3) 694 ± 19
COD (mg/L) 233 ± 12
NAs (mg/L) 60.3 ± 3
AEF (mg/L) 81 ± 7
Vanadium (lg/L) 13.1 ± 0.7
Int. J. Environ. Sci. Technol. (2014) 11:2037–2050 2039
123
Page 4
Vanadium leaching and speciation experiments with PC
In adsorption experiments aimed at evaluating vanadium
speciation in the treated OSPW, 2.5 mM ethylenediami-
netetraacetic acid disodium salt dehydrate (Na2EDTA)
(Sigma-Aldrich, Oakville, Ontario, Canada) was added first
to untreated OSPW or Milli-Q water (Millipore, Molsheim,
France) to form a stable complex with vanadium (IV) and
(V) to prevent speciation change (Li et al. 2009). The
adsorption experiments were performed in a similar man-
ner as described in the preliminary adsorption experiments
section. The filtrate was diluted using a 2.5 mM Na2EDTA
to a concentration that fell within the calibration range.
Vanadium speciation was performed by using a PerkinEl-
mer high-performance liquid chromatography–inductively
coupled plasma–mass spectrometer (HPLC-ICP-MS)
instrument (HPLC, PE Instruments, Shelton, CT, USA and
ICP-MS, PE Sciex, Concord, ON, Canada) by following
the method described by Li et al. (2009). A Tukey test in
combination with ANOVA at 95 % confidence interval
was used for the analysis of the obtained data.
Water quality analysis
Milli-Q water from Synergy� UV instrument (Millipore,
Molsheim, France) was used throughout the study. COD,
pH, and alkalinity were determined according to the stan-
dard methods (Greenberg 1992). A solid addition method
was used to determine the pH of the zero surface charge
(PZC) of the adsorbent. The AEF concentrations in OSPW
before and after adsorption were measured using a FT-IR
instrument (PerkinElmer Spectrum, 100 FT-IR Spectrom-
eter, Waltham, USA), following the methodology
explained in details elsewhere (Jivraj et al. 1996; Pour-
rezaei et al. 2011).
Vanadium speciation
Vanadium speciation was performed on a HPLC-ICP-MS
(HPLC, PE Instruments, Shelton, CT, USA, and ICP-MS,
PE Sciex, Concord, ON, Canada) using the method
developed by Li et al. (2009). A PerkinElmer Series 200
HPLC system equipped with an autosampler was con-
nected to a PerkinElmer Elan 6100 DRCplus ICP-MS using
a 38-cm-long piece of Peek tubing (1/16’’ OD, 0.007’’ I.D.)
(Supelco, Bellefonte, PA, USA). The sample injection
volume was 50 L. The mobile phase flow rate was 1 mL/
min. The column was a SAX PRP-X100 column
(50 mm 9 4.1 mm 9 5 lm) (Hamilton, Reno, NV, USA).
A Tukey test in combination with ANOVA at 95 % con-
fidence interval was used to determine whether the
obtained results for various PC concentrations were sta-
tistically different.
Surface functional groups
A Bio-rad diffuse reflectance FT-IR spectrophotometer
(FTS 6000, Philadelphia, PA, USA) was used to identify
the functional groups on the surface of the studied adsor-
bents. The adsorbents were dried at 110 �C overnight in the
oven, mixed with potassium bromide (KBr) (FT-IR grade,
Sigma-Aldrich, Oakville, ON, Canada) at a 5 % by weight
ratio, and grounded to result in a fine powder. Pure KBr
was used to collect the background spectra. The spectra
were recorded with 128 scans and 4 cm-1 spectral
resolution.
Surface area analysis
The surface area was determined from the nitrogen
adsorption/desorption isotherms performed at 350 �C using
a surface analyzer (IQ2MP, Quantachrome, FL, USA).
Prior to analysis, samples were degassed at 300 �C for 5 h.
The specific surface area was calculated by the Brunauer–
Emmett–Teller (BET) equation at the relative pressure
range of 0.01–0.07. The V–t model was used to calculate
the micropore volume. A density functional theory (DFT)
model for slit pores was used to obtain the pore size
distribution.
Thermogravimetric analysis (TGA)
TGA was performed by a thermal analyzer system (TGA/
DSC 1, Mettler Toledo, Mississauga, ON, Canada) under
the 50 standard cubic centimeters per minute N2 flow at a
heating rate of 10 �C/min. The experiments started at
30 �C and finished at 1,000 �C. The temperature was
increased to 120 �C and 400 �C maintaining for 60 min at
each temperature to completely remove moisture and NAs,
respectively. Afterward, the temperature was raised to
1,000 �C.
Scanning electron microscopy (SEM)
SEM (Hitachi SEM S-2500, Tokyo, Japan) was used to
study the morphology of the adsorbents. The sample par-
ticles were first dried at room temperature and then scat-
tered onto the stub pasted with a thin layer of silicon before
it was examined with the SEM instrument.
X-ray Photoelectron spectroscopy analysis (XPS)
The XPS measurements were performed on the AXIS 165
spectrometer (Kratos Analytical, Manchester, UK). The
base pressure in the analytical chamber was less than
3 9 10-8 Pa. A monochromatic Al Ka source
(hm = 1486.6 eV) was used at a power of 210 W. The
2040 Int. J. Environ. Sci. Technol. (2014) 11:2037–2050
123
Page 5
analysis spot was 400 9 700 lm. The resolution of the
instrument is 0.55 eV for Ag 3d and 0.70 eV for Au 4f
peaks. The survey scans were collected for binding ener-
gies spanning from 0 to 1,100 eV with an analyzer pass
energy of 160 eV and a step of 0.4 eV. For the high-res-
olution spectra, the pass energy was 20 eV with a step of
0.1 eV. An electron flood gun was used to compensate for
sample charging. Vision-2 instrument software was used to
process the data. All spectra were calibrated for the C 1 s
binding energy position at 284.8 eV. Compositions were
calculated from the survey spectra using the major ele-
mental peaks and sensitivity factors provided by the NIST
database.
Point of zero charge (PZC)
A solid addition method was used to determine the pH of
the zero surface charge on the adsorbent. Fifty milliliters
solutions of 0.1 N NaCl, adjusted to the desired pH, was
transferred to a series of 125-mL stoppered flasks. The
initial pH of the solutions was adjusted between 2 and 12
by adding 0.1 N HCl or 0.1 N NaOH and recorded as the
initial pH (pH0) of the solutions. Then 1 g of PC was
added to each flask and capped immediately. The sus-
pensions were shaken by the incubator shaker for 48 h to
reach equilibrium. After the designated time, the final pH
(pHf) of the supernatant was recorded. The difference
between the final and initial pH values (DpH = pHf –
pH0) was plotted against the pH0. The point of intersec-
tion of the curve at which DpH = 0 corresponds to the
pHPZC.
Analysis of NAs
Two milliliter of the samples was centrifuged for
10 min at 10,000 rpm. Following centrifugation, 500 lL
of the supernatant was placed in a 2-mL glass vial with
450 lL of methanol (Fisher Scientific, Ottawa, ON,
Canada), and 50 lL of an internal standard (tetradeca-
noic acid-1-13C) (Sigma-Aldrich, Oakville, ON, Can-
ada) solution was added to result in a concentration of
200 ng/mL in each sample. A Waters Acquity UPLC�
System (Milford, MA, USA) was employed for efficient
and rapid chromatographic separation of the NAs and
oxidized products. Detection was performed with a
high-resolution Synapt G2 HDMS mass spectrometer
equipped with an electrospray ionization source oper-
ating in negative ion mode. The system was controlled
using MassLynx� ver. 4.1. Tuning and calibration were
performed using standard solutions of leucine enkeph-
alin and sodium formate, respectively, provided by
Waters Corporation (Milford, MA, USA). TargetLynx�
ver. 4.1 was used for data analysis of the target com-
pounds, and the relative ratio of the chromatographic
peak area of each analyte to that of the internal standard
was calculated for subsequent analysis. Chromato-
graphic separations were run on a Waters UPLC Phenyl
BEH column (1.7 lm, 150 mm 9 1 mm,) using a
mobile phase of: A, 10 mM ammonium acetate solution
prepared in Optima-grade water and B, 10 mM ammo-
nium acetate in 50 % methanol 50 % acetonitrile, both
Optima-grade. Gradient elution was as follows: 1 % B
for the first 2 min, then ramped to 60 % B by 3 min, to
70 % B by 7 min, to 95 % B by 13 min, followed by a
hold until 14 min, and finally returned to 1 % B, fol-
lowed by a further 5.8-min re-equilibration time. The
flow was constant at 100 lL/min, and column temper-
ature was kept at 50 �C, while samples were maintained
at 4 �C.
Results and discussion
pH and total alkalinity
The adsorbents used in this study showed different effects
on the pH and alkalinity of the samples after adsorptive
treatments (Table 2). The PC insignificantly increased the
pH of the treated OSPW, whereas the alkalinity decreased
by 1–27 %. The latter could be related to the dissolution
of metal oxides present in the PC and their subsequent
reaction with bicarbonate ions present in OSPW (Zubot
Table 2 pH and alkalinity of OSPW before and after 12 h of adsorption
Concentration (g/L) pH Alkalinity (mg/L as CaCO3)
PC GAC PAC PC GAC PAC
0 8.4 ± 0.1 8.5 ± 0.1 8.6 ± 0.1 704 ± 4 704 ± 4 704 ± 4
50 8.5 ± 0.1 9.6 ± 0.1 8.8 ± 0.1 688 ± 4 818 ± 5 696 ± 4
100 8.5 ± 0.1 9.9 ± 0.1 9.1 ± 0.1 664 ± 6 912 ± 5 692 ± 11
200 8.5 ± 0.1 10.4 ± 0.1 8.9 ± 0.1 637 ± 4 1,004 ± 6 –
300 8.4 ± 0.1 10.4 ± 0.1 9.0 ± 0.1 595 ± 1 1,042 ± 5 717 ± 24
400 8.6 ± 0.1 10.4 ± 0.1 8.9 ± 0.1 544 ± 3 1,092 ± 5 720 ± 4
Int. J. Environ. Sci. Technol. (2014) 11:2037–2050 2041
123
Page 6
2010). Increasing the concentration of PAC did not
change the pH and alkalinity of the treated OSPW,
whereas increasing the GAC concentration resulted in
increments in pH and alkalinity after treatment. This is
likely due to the higher amount of OH groups present on
the GAC surface (discussed later in XPS analysis section).
The effect of contact time on the pH and alkalinity was
negligible for PC, PAC, and GAC.
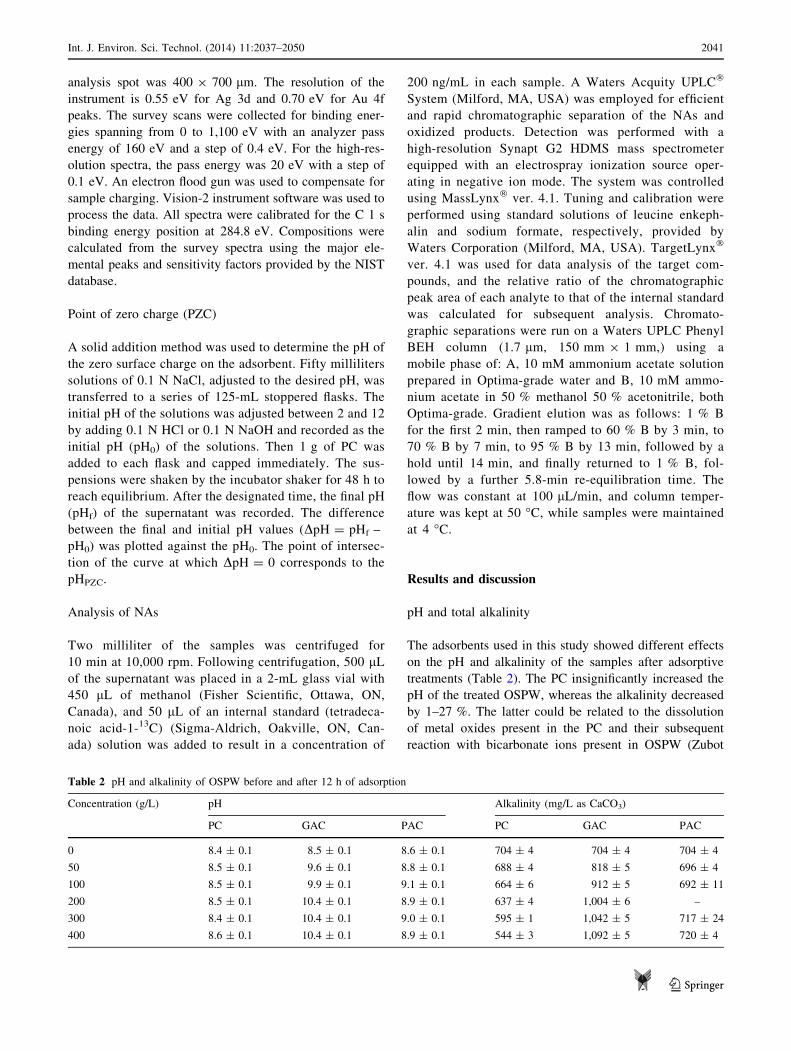
COD and AEF concentrations
An increase in PC concentration resulted in an increase in
the COD removal from OSPW (Fig. ESM-1 in ESM). No
statistically significant difference in the COD removal
was observed at 1, 3, and 6 h of contact time; however,
when contact time approached 12 h, the COD removal
increased for all the studied PC concentrations. The COD
removal at 12-h contact time for 200 g/L PC was sig-
nificantly higher as compared to 50 and 100 g/L, but no
statistically significant difference was observed among
200, 300, and 400 g/L PC at 12 h. At PC concentrations
above 200 g/L, very dense slurries were formed resulting
in improper contact between the PC and OSPW. This may
explain no statistically significant difference in the COD
removal for the PC concentrations above 200 g/L. AEF
removal followed the same trend as the COD removal,
reaching 60 % reduction at 200 g/L PC after 12 h of
contact (Fig. 1). The higher COD and AEF removals at
higher PC concentrations are likely arisen from the higher
available surface area at higher PC concentrations (Khan
et al. 2011; Sharma et al. 2011). Based on the COD and
AEF results, 200 g/L of PC was chosen in further equi-
librium time studies.
The application of GAC and PAC to OSPW treatment
led to COD and AEF removals of[93 %, regardless of the
contact times and adsorbent concentrations. Higher
removal in the case of activated carbons is likely arisen
from the significantly higher surface area of the commer-
cial activated carbons as compared to PC (discussed later in
Surface area analysis section). Therefore, the lowest con-
centrations of 50 g/L of GAC and PAC at 12-h contact
time were chosen for physico-chemical analysis of adsor-
bents and NAs analysis.
0
10
20
30
40
50
60
70
80
90
100
0 50 100 200 300 400
AE
F R
emo
val (
%)
PC concentration (g/L)
1 h 3 h 6 h 12 h
0102030405060708090
100
0 5 10 15 20 25 30 35 40 45
AE
F R
emo
val
(%)
Time (h)
Fig. 1 AEF removal as a
function of PC concentration
and contact time. An inset
shows the AEF removal as a
function of contact time at
200 g/L PC
Table 3 Calculated isotherm parameters for acid-extractable fraction
(AEF) adsorption
Parameters* PC GAC PAC
Langmuir
qm (mg/g) 1.02 50.5 71.0
Kads (L/mg) 0.01 0.02 0.02
RL 0.67 0.39 0.52
r2 0.95 0.98 0.84
Freundlich
K (mg/g)(L/mg)1/n 0.01 1.01 0.23
n 1.22 1.21 1.85
r2 0.95 0.96 0.92
Dubinin-Radushkevich
qm (mg/g) 0.28 12.43 107
b (mol2/J2) 7 9 10-5 5 9 10-6 3 9 10-5
E (kJ/mol) 0.01 0.35 0.13
r2 0.85 0.83 0.97
* qm is the maximum adsorption capacity; Kads and K indicate the
adsorption affinity of the adsorbate for the Langmuir and Freundlich
isotherms, respectively; RL is the separation factor; n is the adsorption
intensity; b is the adsorption energy constant; E is the adsorption free
energy; and r2 is the coefficient of determination
2042 Int. J. Environ. Sci. Technol. (2014) 11:2037–2050
123
Page 7
Equilibrium time studies
AEF removal (Fig. 1) increased gradually from 2 to 16 h
and reached a plateau after 16 h of contact. The linear and
plateau portions of the curve corresponded to the diffusion
of AEF to surface layers and pores, respectively (Goel et al.
2005). The observed effect was indicative of the rapid
adsorption of AEF on the easily accessible adsorption sites
at the beginning of experiment, followed by limited dif-
fusion of the adsorbate molecules into the mesopores
(Yuan et al. 2010b). Based on the results, 16 h was chosen
as the equilibrium contact time for further physico-chem-
ical analysis of PC and NAs analysis.
Adsorption isotherms
The calculated parameters for the Langmuir, Freundlich,
and Dubinin-Radushkevich isotherms for AEF adsorption
are shown in Table 3. Plots of the isotherms can be found
in Fig. 2. Both Langmuir and Freundlich isotherms
showed high correlation coefficients for PC and GAC. For
PAC, Freundlich isotherm showed higher correlation
coefficient as compared to that obtained using the Lang-
muir isotherm. The maximum adsorption capacity (qm)
for the PC to adsorb AEF from OSPW was calculated as
1.0 mg/g by fitting the experimental data to the Langmuir
isotherm. This value, compared to 51 and 71 mg/g for
GAC and PAC, respectively, indicated that larger mass of
PC is required for the removal of the AEF from OSPW.
The adsorption capacity also decreased with the increase
in PC concentration, suggesting that some of the available
sites remained unsaturated (Khan et al. 2011; Sharma and
Forster 1993). The values of the separation factor (RL) in
the range of 0–1 suggested the favorable adsorption of
AEF from OSPW. In addition, the calculated mean free
energy of adsorption (E \ 8 kJ/mol) suggested that the
AEF was physically adsorbed to the surface of the
adsorbents.
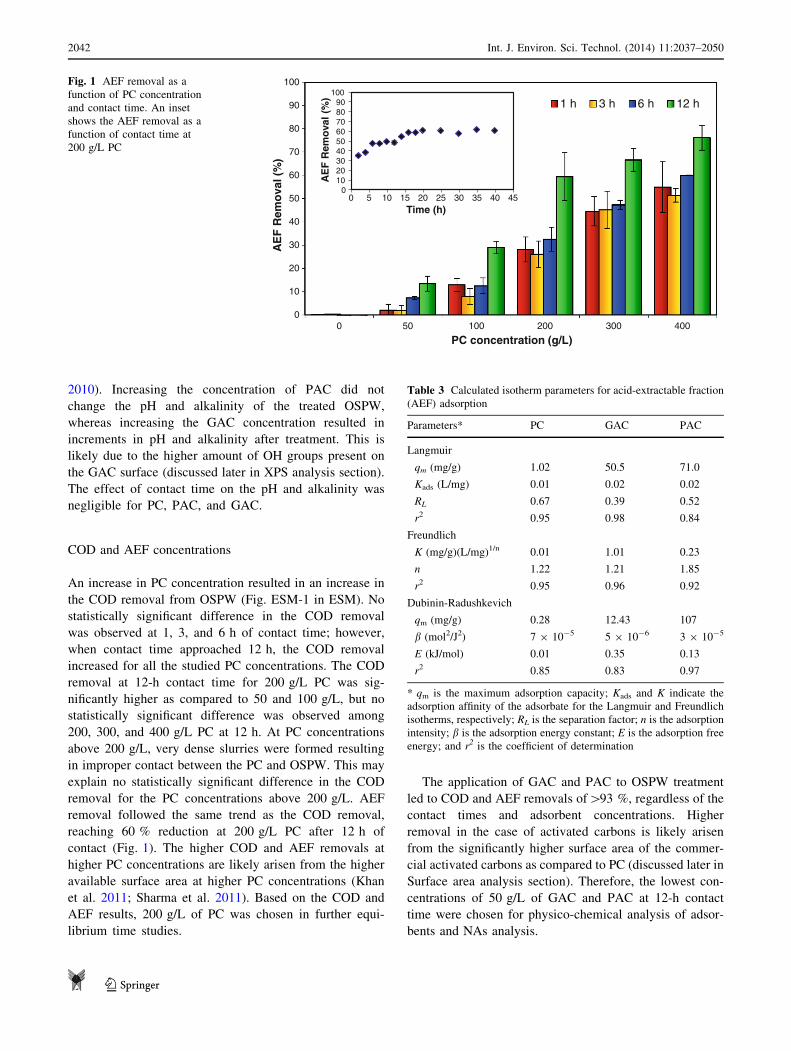
Removal of NAs
Figure 3 shows the distribution of the NAs compounds
present in OSPW as a function of the carbon number
(n) and the number of the rings (-Z/2) before and after
Fig. 2 Freundlich, Langmuir, and Dubinin-Radushkevich (D-R) isotherm plots for PC, GAC, and PAC
Int. J. Environ. Sci. Technol. (2014) 11:2037–2050 2043
123
Page 8
treatments with PC, GAC, and PAC. The total NAs
removals following PC, GAC, and PAC treatment were
75, 97, and 95 %, respectively. The results of the control
samples showed that there was no change in the con-
centration of the NAs as a result of experimental proce-
dure. The NAs found in OSPW were in the carbon range
of 8–22 within 1–6 numbers of rings, indicating that there
were no acyclic NAs compounds present. Consistently
with previous results (Jones et al. 2011; Rowland et al.
2011), monocyclic NAs were the least predominant spe-
cies among all the Z groups; whereas, bicyclic and tri-
cyclic acids within the carbon range of 12–16 were the
most abundant compounds. For the PC (Fig. 3b), the NAs
were predominantly removed in the carbon range of
14–17 (81–100 %), 15–20 (86–100 %), 15–19
(93–100 %), 15–21 (94–100 %), and 17–22 (96–100 %)
for the -Z = 4, 6, 8, 10, and 12 group of compounds,
respectively. This implies that the adsorption of NAs onto
PC increased with the increase in both n and -Z numbers,
with n having greater effect on the adsorption as com-
pared to -Z. The NAs removal followed a similar trend
for GAC and PAC (Fig. 3c, d). For the GAC and PAC
04
8120
1
2
3
4
5
6
7 8 9 10 11 12 13 14 15 16 17 18 19 20 21 22-Z
Co
nce
ntr
atio
n (
mg
/L)
n
Total NAs Concentration: 18.3 mg/L
04
8120
1
2
3
4
5
6
7 8 9 10 11 12 13 14 15 16 17 18 19 20 21 22
-Z
Co
nce
ntr
atio
n (
mg
/L)
n
Total NAs Concentration: 1.8 mg/Lc
04
8120
1
2
3
4
5
6
7 8 9 10 11 12 13 14 15 16 17 18 19 20 21 22
-Z
Co
nce
ntr
atio
n (
mg
/L)
n
Total NAs Concentration: 3.1 mg/Ld
04
8120
1
2
3
4
5
6
7 8 9 10 11 12 13 14 15 16 17 18 19 20 21 22
-Z
Co
nce
ntr
atio
n (
mg
/L)
n
Total NAs Concentration: 60.3 mg/L0
2
4
6
8
10
12
ba
Fig. 3 Distribution of the NAs compounds for a fresh OSPW, b OSPW treated with PC at 200 g/L for 16 h, c OSPW treated with GAC at 50 g/
L for 12 h, and d OSPW treated with PAC at 50 g/L for 12 h
0
1
2
3
4
5
6
7
8
9
0 2 4 6 8 10 12 14 16 18 20 22 24
Lo
g K
ow
Carbon number (n)
Z=2
Z=4
Z=6
Z=8
Z=10
Z=12
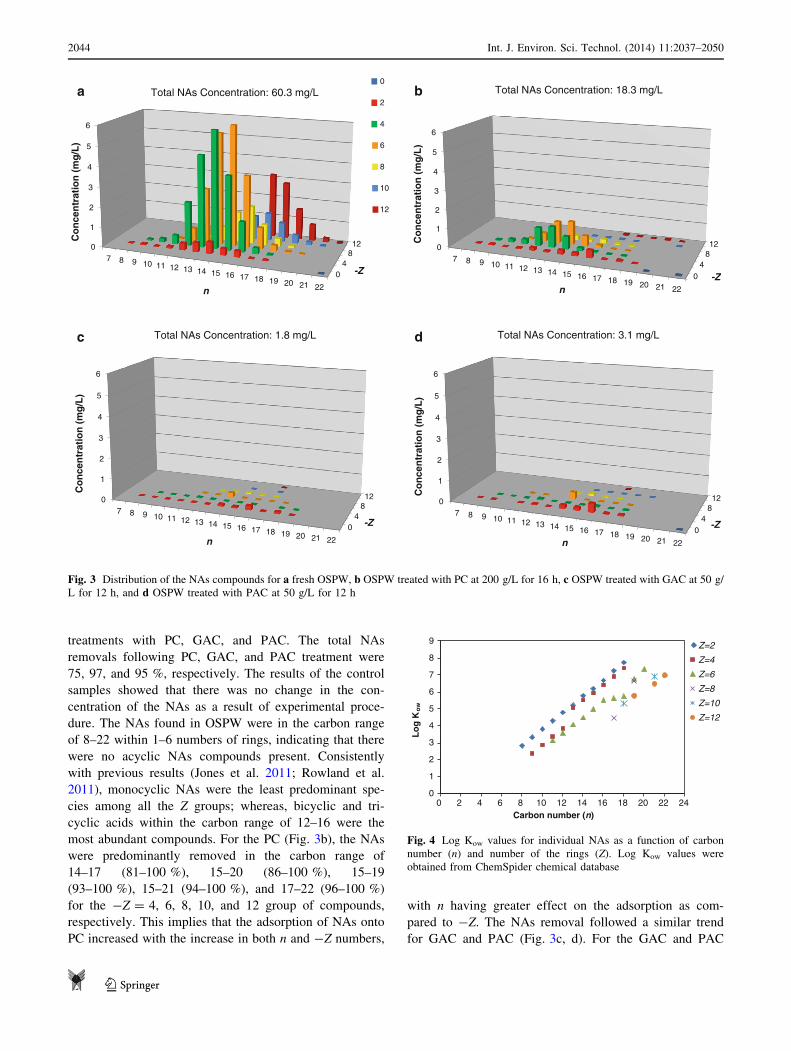
Fig. 4 Log Kow values for individual NAs as a function of carbon
number (n) and number of the rings (Z). Log Kow values were
obtained from ChemSpider chemical database
2044 Int. J. Environ. Sci. Technol. (2014) 11:2037–2050
123
Page 9
treatments, the NAs removals exceeded 88 % for all
individual NAs.
Increase in the molecular mass of NAs renders the
compounds less soluble and more hydrophobic, which, in
turn, increase their affinity for the adsorption on the surface
of the adsorbents (Bansal and Goyal 2005). Octanol/water
distribution coefficient (expressed as log Kow) for the NAs
is shown in Fig. 4 as a function of n and -Z. Increasing
n within each -Z group of compounds resulted in the
increase in the log Kow, which is consistent with the
increase in the removal efficiency of the individual NAs by
n. This confirms the higher tendency of NAs with the
higher number of the carbons to adsorb onto the surface of
the adsorbents (Gotovac et al. 2007).
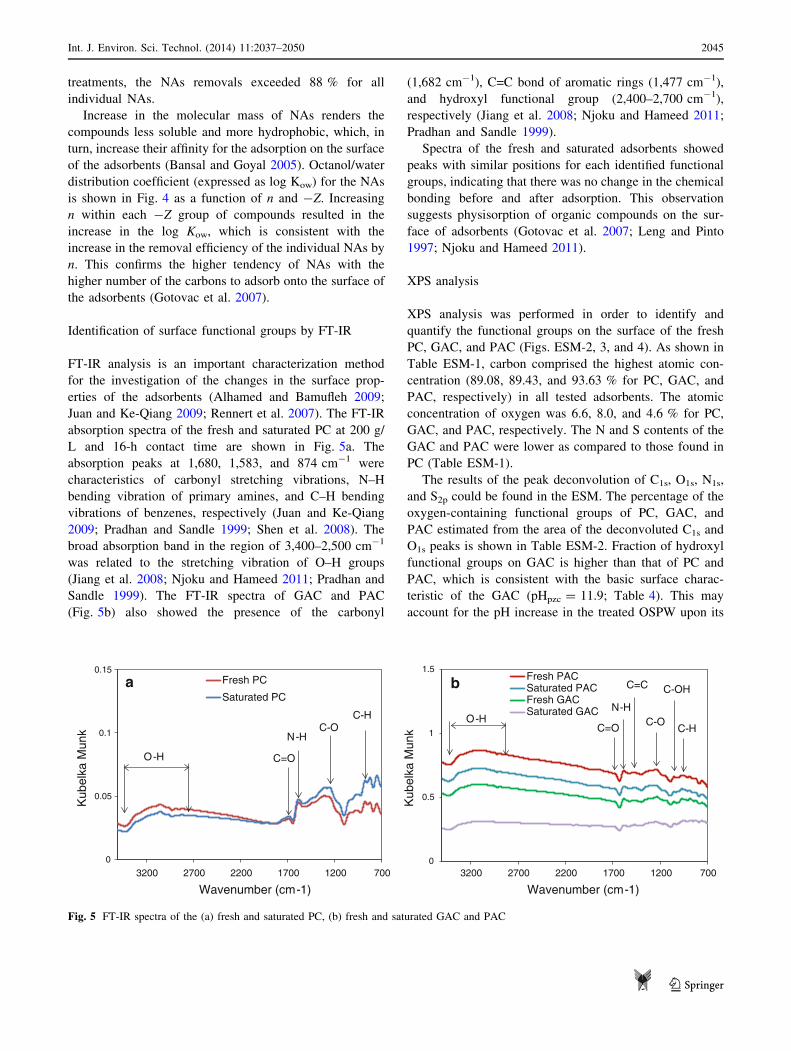
Identification of surface functional groups by FT-IR
FT-IR analysis is an important characterization method
for the investigation of the changes in the surface prop-
erties of the adsorbents (Alhamed and Bamufleh 2009;
Juan and Ke-Qiang 2009; Rennert et al. 2007). The FT-IR
absorption spectra of the fresh and saturated PC at 200 g/
L and 16-h contact time are shown in Fig. 5a. The
absorption peaks at 1,680, 1,583, and 874 cm-1 were
characteristics of carbonyl stretching vibrations, N–H
bending vibration of primary amines, and C–H bending
vibrations of benzenes, respectively (Juan and Ke-Qiang
2009; Pradhan and Sandle 1999; Shen et al. 2008). The
broad absorption band in the region of 3,400–2,500 cm-1
was related to the stretching vibration of O–H groups
(Jiang et al. 2008; Njoku and Hameed 2011; Pradhan and
Sandle 1999). The FT-IR spectra of GAC and PAC
(Fig. 5b) also showed the presence of the carbonyl
(1,682 cm-1), C=C bond of aromatic rings (1,477 cm-1),
and hydroxyl functional group (2,400–2,700 cm-1),
respectively (Jiang et al. 2008; Njoku and Hameed 2011;
Pradhan and Sandle 1999).
Spectra of the fresh and saturated adsorbents showed
peaks with similar positions for each identified functional
groups, indicating that there was no change in the chemical
bonding before and after adsorption. This observation
suggests physisorption of organic compounds on the sur-
face of adsorbents (Gotovac et al. 2007; Leng and Pinto
1997; Njoku and Hameed 2011).
XPS analysis
XPS analysis was performed in order to identify and
quantify the functional groups on the surface of the fresh
PC, GAC, and PAC (Figs. ESM-2, 3, and 4). As shown in
Table ESM-1, carbon comprised the highest atomic con-
centration (89.08, 89.43, and 93.63 % for PC, GAC, and
PAC, respectively) in all tested adsorbents. The atomic
concentration of oxygen was 6.6, 8.0, and 4.6 % for PC,
GAC, and PAC, respectively. The N and S contents of the
GAC and PAC were lower as compared to those found in
PC (Table ESM-1).
The results of the peak deconvolution of C1s, O1s, N1s,
and S2p could be found in the ESM. The percentage of the
oxygen-containing functional groups of PC, GAC, and
PAC estimated from the area of the deconvoluted C1s and
O1s peaks is shown in Table ESM-2. Fraction of hydroxyl
functional groups on GAC is higher than that of PC and
PAC, which is consistent with the basic surface charac-
teristic of the GAC (pHpzc = 11.9; Table 4). This may
account for the pH increase in the treated OSPW upon its
0
0.05
0.1
0.15
70012001700220027003200
Kub
elka
Mun
k
Wavenumber (cm-1) Wavenumber (cm-1)
Fresh PC
Saturated PC
C=OO-H
N-HC-O
C-H
0
0.5
1
1.5
70012001700220027003200
Kub
elka
Mun
k
Fresh PACSaturated PACFresh GACSaturated GAC
C=O
C-OH
C-O
C=C
N-H
C-HO-H
a b
Fig. 5 FT-IR spectra of the (a) fresh and saturated PC, (b) fresh and saturated GAC and PAC
Int. J. Environ. Sci. Technol. (2014) 11:2037–2050 2045
123
Page 10
contact with GAC. PC contained higher percentage of
carbonyl functional groups as compared to GAC and PAC.
Surface area analysis and SEM images
Surface area is an important factor that affects the
adsorption capacity of the adsorbents. BET surface area of
PC was calculated as 7.7 m2/g (Table 4). The low surface
area of PC as compared to 912 and 800 m2/g for GAC and
PAC, respectively, implies that PC has lower porosity as
compared to the highly porous structure of the GAC and
PAC (Ahn et al. 2005; Alhamed and Bamufleh 2009;
Carter et al. 2011; Ding et al. 2008; Lu and Sorial 2004).
The pore size distribution curves of PC, GAC, and PAC are
shown in Fig. ESM-5. Size distribution of the pores in PC
was in the mesoporous range (2.3–36 nm) with the highest
peaks centered at 2.8 and 3.2 nm (Fig. ESM-5a). No mi-
cropores (\2.0 nm) or macropores ([50 nm) were detected
on the surface of the PC, suggesting that mesopores play a
significant role in the adsorption of organic compounds
from OSPW. Size distribution of the pores for GAC and
PAC (Figs. ESM-5b and 5c) was in the range of
0.5–36 nm, with the highest peaks centered in the range of
0.6–1.4 nm among the micropores. SEM images of the PC
(Table 4) also showed the spherical non-porous structure of
adsorbent; whereas, PAC and GAC showed highly porous
structures, which contributed to high surface area and
adsorption capacity of these adsorbents.
Adsorption mechanism
Organic compounds with high molecular weights and
molecular sizes similar to the pore diameters may block the
pores and reduce the available adsorption sites (de Ridder
et al. 2011; Kilduff et al. 1998; Matsui et al. 2002; Moore
et al. 2010; Newcombe and Drikas 1997; Pelekani and
Snoeyink 1999). However, NAs with low molecular
weights (160–500 g/mol) would easily diffuse into the
micro- and mesopores (Moore et al. 2010; Yuan et al.
2010b), and there would be no limitation for their diffusion
into the pores based on their size.
The pHpzc for the PC was found to be 6.5 ± 0.3 (Fig.
ESM-7a). NAs have a pKa in the range of 5–6 (Perez-
Estrada et al. 2011), which implies that over the operating
pH of this study (*8.4), they exist in the dissociated form.
As a result, the surfaces of the PC and NAs are both
negatively charged. Therefore, electrostatic repulsion for-
ces may reduce the adsorption capacity of PC for NAs
(Ayranci et al. 2005; Faria et al. 2008). On the other hand,
the metal ions present in OSPW may neutralize the nega-
tive charge of NAs and thus decrease the repulsion between
the NAs and PC (Pan and Xing 2008). Additionally, based
on XPS results, N–H functional groups on the surface of
the PC may facilitate formation of hydrogen bonds
between the PC and hydroxyl groups of NAs. However,
low nitrogen content of the PC suggests that H-bonding
does not significantly contribute to the adsorption. NAs
with higher molecular weights may contain aromatic rings
or double bonds which may increase the adsorption affinity
of these compounds through the p–p interactions to the
graphitelike surface of the adsorbents (Kavanagh et al.
2009; Lin and Xing 2008; Rowland et al. 2011; Zhu and
Pignatello 2005). Given that NAs are highly hydrophobic
compounds, the hydrophobic interactions between the NAs
and the surface of PC are suggested as a dominant
adsorption mechanism.
At the operating pH of this study, surface of the GAC
(pHpzc = 11.9) and PAC (pHpzc = 9.3) (Figs. ESM-7b and
Table 4 Characterization of PC, PAC and GAC
Parameter PC PAC GAC
Size distribution of the pores (nm) 2.3–36 0.5–36 0.5–36
pH of the zero surface charge (pHpzc) 6.5 9.3 11.9
BET surface area (m2/g) 7.7 800 912
SEM image
2046 Int. J. Environ. Sci. Technol. (2014) 11:2037–2050
123
Page 11
7c) is positively charged, which is favorable for the
adsorption of NAs through the electrostatic attractive for-
ces (Ayranci et al. 2005). Besides, the high surface area
and microporosity of these adsorbents suggest that the
adsorption occurred through the micropore filling mecha-
nism. In addition, no change in the peak positions in the
FT-IR spectra and desorption profile of the samples in
TGA analysis (Fig. ESM-6) of PC before and after
adsorption suggests that the physisorption of the organic
compounds mainly depends on the porosity of the adsor-
bent rather than the surface functionality (Leng and Pinto
1997; Njoku and Hameed 2011). This is in accordance with
the high adsorption capacity of GAC and PAC and low
adsorption capacity of PC.
Vanadium leaching
Leaching of vanadium from PC is a complex process,
which is expected to depend on water matrix. As shown
in Fig. 6, the amount of vanadium leached from PC
increased with the increase in PC concentration from 50
to 400 g/L for both OSPW and Milli-Q water. This is
consistent with Galvin et al. (2012), who observed the
increase in the concentration of a range of metals leached
from different recycled aggregates with the increase in the
amount of the added material. While studying the leach-
ing of copper, zinc, and lead from the cement-based
wasted materials, Li et al. (2001) showed that metal
concentrations increased with increasing solid to liquid
ratio, reached equilibrium, and remained constant after-
ward. Under the experimental conditions applied in this
study, the equilibrium between the solid phase and liquid
phase vanadium was not achieved, suggesting that more
leaching could occur if higher PC concentration is used
for the removal of organic compounds from OSPW.
Depending on the PC concentration, the percentage of
leached vanadium was in the range of 8.7–17.0 and
9.1–11.5 % for OSPW and Milli-Q water, respectively
(Table ESM-3). The leaching of vanadium (V) increases
with increasing pH (Wehrli and Stumm 1989). Puttasw-
amy and Liber (2011) showed that as pH increased, more
vanadium leached from PC into hard reconstituted water
(688 lg/L at pH 5.5 and 2,205 lg/L at pH 9.5 for a PC to
water v/v ratio of 1:4). Therefore, the increase in vana-
dium mobility with the pH increase may account for the
higher amount of vanadium leached from OSPW at pH
8.4 ± 0.2 as compared to that leached from Milli-Q water
at pH 4.6 ± 0.2. While studying the effect of inorganic
anions on vanadium leaching from PC in water which
contained sulfur, chloride, and bicarbonate ions, Put-
taswamy and Liber (2012) showed that bicarbonate ions
increased the release of vanadium from PC. Since the
concentration of bicarbonate ions in OSPW is very high
(775–950 mg/L) (Allen 2008a), this may also promote
leaching of vanadium from PC upon its contact with
OSPW. In addition, the organic fraction of OSPW con-
tains large variety of compounds which could stabilize
vanadium in the aqueous phase and increase its equilib-
rium concentration as compared to Milli-Q water.
Although the percentage of the released vanadium did not
exceed 20 % of the vanadium present in PC for all
studied PC concentrations, its concentrations exceeded the
background vanadium concentrations reported for natural
waters (0.5–300 lg/L) (Crans et al. 1998; Li et al. 2009)
in both OSPW and Milli-Q water.
The vanadium leached from PC was predominantly
vanadium (V) for both OSPW and Milli-Q water, although
vanadium (IV) was also detected (Fig. 6). However, given
that vanadium (IV) is unstable at circumneutral pH, it is
expected that it would be oxidized into vanadium (V) upon
its release into OSPW. Consistently with the vanadium
speciation as a function of pH, the fraction of vanadium
(IV) was larger in Milli-Q water as compared to OSPW at
all studied PC concentrations.
0
1000
2000
3000
4000
5000
6000
7000
8000
9000
0 50 100 200 300 400
Con
cent
ratio
n (µ
g/L)
PC concentration (g/L)
0
1000
2000
3000
4000
5000
6000
7000
0 50 100 200 300 400
Con
cent
ratio
n(µ
g/L)
PC concentration (g/L)
V (IV) V (V) V V (IV) V (V) V a b
Fig. 6 Concentration of vanadium (IV), vanadium (V), and vanadium leached from PC into (a) OSPW and (b) Milli-Q water after 12 h of
contact
Int. J. Environ. Sci. Technol. (2014) 11:2037–2050 2047
123
Page 12
Conclusion
The results of this study demonstrated that two waste by-
products generated by petroleum industry, PC and process-
affected water, can be successfully coupled together in the
adsorption process in order to remove persistent organic
contaminants from liquid stream. This, in turn, could
reduce the adverse impacts of the petroleum industry on the
environment. A significant advantage of this process is that
while the concentration of toxic compounds is reduced, the
amount of dry waste does not increase. A huge amount of
PC is continuously produced worldwide. Currently, PC is
stockpiled in huge quantities on-site of the refinery plants.
PC is virtually cheap, and its direct application as an
adsorbent does not require large investments. The ability of
PC to adsorb organic contaminants in conjunction with the
manner petroleum industry produce, transport, and store
the PC present a unique opportunity to treat generated
process-affected waters for large-scale applications. PC
also has a potential in commercial wastewater applications
provided that the activation process is optimized with
respect to increasing surface area and minimizing leaching
of trace metals.
Electronic Supplementary Material
Adsorption isotherms, XPS analysis, TGA analysis, and
related tables and figures are provided in the Electronic
Supplementary Material.
Acknowledgments The authors acknowledge the financial supports
provided by the research grants from Alberta Innovates-Energy and
Environment Solutions (Gamal El-Din and Le), Syncrude Canada
Ltd. (Gamal El-Din), Helmholtz-Alberta Initiative (HAI) (Gamal El-
Din), NSERC research grant for the research tools and instruments
(Gamal El-Din), and NSERC Industrial Research Chair in Oil Sands
Tailings Water Treatment (Dr. Gamal El-Din). Dr. Le was supported
by the Canadian Water Network and NSERC. The authors
acknowledge the Alberta Centre for Surface Engineering and Science
at the University of Alberta for XPS analysis. Finally, thanks go to
technicians in the Department of Civil and Environmental Engi-
neering and Ms. Xiufen Lu for her help with the HPLC-ICP-MS
analysis.
References
Ahn S, Werner D, Karapanagioti HK, McGlothlin DR, Zare RN,
Luthy RG (2005) Phenanthrene and pyrene sorption and
intraparticle diffusion in polyoxymethylene, coke, and activated
carbon. Environ Sci Technol 39:6516–6526
Alhamed YA, Bamufleh HS (2009) Sulfur removal from model diesel
fuel using granular activated carbon from dates’ stones activated
by ZnCl2. Fuel 88:87–94
Allen EW (2008a) Process water treatment in Canada’s oil sands
industry: I. Target pollutants and treatment objectives. J Environ
Eng Sci 7:123–138
Allen EW (2008b) Process water treatment in Canada’s oil sands
industry: II. A review of emerging technologies. J Environ Eng
Sci 7:499–524
Ayranci E, Hoda N, Bayram E (2005) Adsorption of benzoic acid
onto high specific area activated carbon cloth. J Colloid Interface
Sci 284:83–88
Bansal RC, Goyal M (2005) Activated carbon adsorption. CRC Press,
Taylor & Francis Group, Boca Raton, pp 193–194
Carter EM, Katz LE, Speitel GE, Ramirez D (2011) Gas-phase
formaldehyde adsorption isotherm studies on activated carbon:
Correlations of adsorption capacity to surface functional group
density. Environ Sci Technol 45:6498–6503
ChemsSpider Chemical Database, Royal Society of Chemistry;
http://www.chemspider.com/StructureSearch.aspx. Accessed 26
December 2011
Crans DC, Amin SS, Keramidas AD (1998) Chemistry of relevance to
vanadium in the environment, in vanadium in the environment.
Part 1: chemistry and biochemistry. Wiley, London
de Ridder DJ, Verliefde ARD, Heijman SGJ, Verberk J, Rietveld LC,
van der Aa LTJ, Amy GL, van Dijk JC (2011) Influence of
natural organic matter on equilibrium adsorption of neutral and
charged pharmaceuticals onto activated carbon. Water Sci
Technol 63:416–423
Ding L, Snoeyink VL, Marinas BJ, Yue ZR, Economy J (2008)
Effects of powdered activated carbon pore size distribution on
the competitive adsorption of aqueous atrazine and natural
organic matter. Environ Sci Technol 42:1227–1231
Energy Resources Conservation Board (ERCB) (2008) ST98–2009:
Alberta’s energy reserves 2008 and supply/demand outlook
2009–2018. Government of Alberta, Calgary
Energy Resources Conservation Board (ERCB) (2011) ST98- 2011:
Alberta’s Energy Reserves 2010 and Supply/Demand Outlook
2011–2020. Government of Alberta, Calgary
Faria PCC, Orfao JJM, Pereira MFR (2008) Activated carbon
catalytic ozonation of oxamic and oxalic acids. Appl Catal B
Environ 79:237–243
Friedrich FD, Lee GK, Desai DL (1983) Fluidized-bed combustion of
petroleum coke. Mech Eng 105:81
Galvin AP, Ayuso J, Jimenez JR, Agrela F (2012) Comparison of
batch leaching tests and influence of pH on the release of metals
from construction and demolition wastes. Waste Manage
32:88–95
Gamal El-Din M, Fu HJ, Wang N, Chelme-Ayala P, Perez-Estrada L,
Drzewicz P, Martin JW, Zubot W, Smith DW (2011) Naphthenic
acids speciation and removal during petroleum-coke adsorption
and ozonation of oil sands process-affected water. Sci Total
Environ 409:5119–5125
Goel J, Kadirvelu K, Rajagopal C, Garg VK (2005) Investigation of
adsorption of lead, mercury and nickel from aqueous solutions
onto carbon aerogel. J Chem Technol Biotechnol 80:469–476
Gotovac S, Song L, Kanoh H, Kaneko K (2007) Assembly structure
control of single wall carbon nanotubes with liquid phase
naphthalene adsorption. Colloids Surf A 300:117–121
Gray M, Xu ZH, Masliyah J (2009) Physics in the oil sands of
Alberta. Phys Today 62:31–35
Greenberg AE (1992) Standard methods for the examination of water
and wastewater American Public Health Association Washing-
ton, DC
Jiang BC, Zhang YC, Zhou JX, Zhang K, Chen SY (2008) Effects of
chemical modification of petroleum cokes on the properties of
the resulting activated carbon. Fuel 87:1844–1848
2048 Int. J. Environ. Sci. Technol. (2014) 11:2037–2050
123
Page 13
Jivraj MN, MacKinnon M, Fung B (1996) Naphthenic acid extraction
and quantitative analysis with FT-IR spectroscopy. Syncrude
Canada Ltd, Internal Report, Edmonton
Jones D, Scarlett AG, WC E, RS J (2011) Toxicity of individual
naphthenic acids to Vibrio fischeri. Environ Sci Technol
45:9776–9782
Juan Y, Ke-Qiang Q (2009) Preparation of activated carbon by
chemical activation under vacuum. Environ Sci Technol
43:3385–3390
Kavanagh RJ, Burnison BK, Frank RA, Solomon KR, Van Der Kraak
G (2009) Detecting oil sands process-affected waters in the
Alberta oil sands region using synchronous fluorescence spec-
troscopy. Chemosphere 76:120–126
Khan MA, Lee SH, Kang S, Paeng KJ, Lee G, Oh SE, Jeon BH (2011)
Adsorption studies for the removal of methyl tert-butyl ether on
various commercially available GACs from an aqueous medium.
Separ Sci Technol 46:1121–1130
Kilduff JE, Karanfil T, Weber WJ (1998) Competitive effects of
nondisplaceable organic compounds on trichloroethylene uptake
by activated carbon. II. Model verification and applicability to
natural organic matter. J Colloid Interface Sci 205:280–289
Leng CC, Pinto NG (1997) Effects of surface properties of activated
carbons on adsorption on behavior of selected aromatics. Carbon
35:1375–1385
Li XD, Poon CS, Sun H, Lo IMC, Kirk DW (2001) Heavy metal
speciation and leaching behaviors in cement based solidified/
stabilized waste materials. J Hazard Mater 82:215–230
Li XS, Glasauer S, Le XC (2009) Speciation of vanadium in oil sand
coke and bacterial culture by high performance liquid chroma-
tography inductively coupled plasma mass spectrometry. Anal
Chim Acta 648:128
Lin DH, Xing BS (2008) Adsorption of phenolic compounds by
carbon nanotubes: role of aromaticity and substitution of
hydroxyl groups. Environ Sci Technol 42:7254–7259
Lu QL, Sorial GA (2004) The role of adsorbent pore size distribution
in multicomponent adsorption on activated carbon. Carbon
42:3133–3142
Majid AL, Kotlyar BDS (1999) Potential applications of oil sands
industry wastes. J Can Petrol Technol 38:29–33
Malekshahian M, Hill JM (2011) Effect of pyrolysis and CO2
gasification pressure on the surface area and pore size distribu-
tion of petroleum coke. Energy Fuels 25:5250–5256
Matsui Y, Knappe DRU, Takagi R (2002) Pesticide adsorption by
granular activated carbon adsorbers. 1. Effect of natural organic
matter preloading on removal rates and model simplification.
Environ Sci Technol 36:3426–3431
Moore BC, Wang YJ, Cannon FS, Metz DH, Westrick J (2010)
Relationships between adsorption mechanisms and pore struc-
ture for adsorption of natural organic matter by virgin and
reactivated granular activated carbons during water treatment.
Environ Eng Sci 27:187–198
Newcombe G, Drikas M (1997) Adsorption of NOM onto activated
carbon: electrostatic and non-electrostatic effects. Carbon
35:1239–1250
Njoku VO, Hameed BH (2011) Preparation and characterization of
activated carbon from corncob by chemical activation with
H3PO4 for 2,4-dichlorophenoxyacetic acid adsorption. Chem
Eng J 173:391–399
Pan B, Xing B (2008) Adsorption mechanisms of organic chemicals
on carbon nanotubes. Environ Sci Technol 42:9005–9013
Parmar BS, Tollefson EL (1977) Desulfurization of oil sands coke.
Can J Chem Eng 55:185–191
Pelekani C, Snoeyink VL (1999) Competitive adsorption in natural
water: role of activated carbon pore size. Water Res 33:1209–1219
Perez-Estrada LA, Han XM, Drzewicz P, Gamal El-Din M, Fedorak
PM, Martin JW (2011) Structure-reactivity of naphthenic acids
in the ozonation process. Environ Sci Technol 45:7431–7437
Pourrezaei P, Drzewicz P, Wang YN, Gamal El-Din M, Perez-Estrada
LA, Martin JW, Anderson J, Wiseman S, Liber K, Giesy JP
(2011) The impact of metallic coagulants on the removal of
organic compounds from oil sands process-affected water.
Environ Sci Technol 45:8452–8459
Pradhan BK, Sandle NK (1999) Effect of different oxidizing agent
treatments on the surface properties of activated carbons. Carbon
37:1323–1332
Puttaswamy N, Liber K (2011) Identifying the causes of oil sands
coke leachate toxicity to aquatic invertebrates. Environ Toxicol
Chem 30:2576–2585
Puttaswamy N, Liber K (2012) Influence of inorganic anions on
metals release from oil sands coke and on toxicity of nickel and
vanadium to Ceriodaphnia dubia. Chemosphere 86:521–529
Puttaswamy N, Turcotte D, Liber K (2010) Variation in toxicity
response of Ceriodaphnia dubia to Athabasca oil sands coke
leachates. Chemosphere 80:489–497
Rennert T, Kaufhold S, Mansfeldt T (2007) Identification of iron-
cyanide complexes in contaminated soils and wastes by Fourier
transform infrared spectroscopy. Environ Sci Technol
41:5266–5270
Rowland SJ, West CE, Jones D, Scarlett AG, Frank RA, Hewitt LM
(2011) Steroidal aromatic ‘naphthenic acids’ in oil sands
process-affected water: structural comparisons with environ-
mental estrogens. Environ Sci Technol 45:9806–9815
Sharma DC, Forster CF (1993) Removal of hexavalent chromium
using sphagnum moss peat. Water Res 27:1201–1208
Sharma YC, Uma, Upadhyay SN (2011) An economically viable
removal of methylene blue by adsorption on activated carbon
prepared from rice husk. Can J Chem Eng 89:377–383
Shen W, Li Z, Liu Y (2008) Surface chemical functional groups
modification of porous carbon. Recent Patents Chem Eng
1:27–40
Small CC, Hashisho Z, Ulrich AC (2012) Preparation and character-
ization of activated carbon from oil sands coke. Fuel 92:69–76
Speight JG (1998) The chemistry and physics of coking. Korean J
Chem Eng 15:1–8
Watkins E (2010) PDVSA, Eni initiate heavy oil, refinery projects in
Venezuela. Oil Gas J 108:41–42
Wehrli B, Stumm W (1989) Vanadyl in natural waters—adsorption
and hydrolysis promote oxygenation. Geochim Cosmochim Acta
53:69–77
Yuan M, Tong S, Zhao S, Jia CQ (2010a) Adsorption of polycyclic
aromatic hydrocarbons from water using petroleum coke-derived
porous carbon. J Hazard Mater 181:1115–1120
Yuan MJ, Tong ST, Zhao SQ, Jia CQ (2010b) Adsorption of
polycyclic aromatic hydrocarbons from water using petroleum
coke-derived porous carbon. J Hazard Mater 181:1115–1120
Zamora RMR, Schouwenaars R, Duran Moreno A, Buitron G (2000)
Production of activated carbon from petroleum coke and its
application in water treatment for the removal of metals and
phenol. Water Sci Technol 42:119–126
Zamora RM, Duran Pilotzi A, Mora RD, Moreno AD (2004) Removal
of detergents by activated petroleum coke from a clarified
wastewater treated for reuse. Water Sci Technol 50:91–98
Zhu DQ, Pignatello JJ (2005) Characterization of aromatic compound
sorptive interactions with black carbon (charcoal) assisted by
Int. J. Environ. Sci. Technol. (2014) 11:2037–2050 2049
123
Page 14
graphite as a model. Environ Sci Technol 39:2033–2041
Zubot WA (2010) Removal of naphthenic acids from oil sands
process water using petroleum coke. M.Sc. Dissertation, Uni-
versity of Alberta, Edmonton, Alberta, Canada
Zubot W, MacKinnon MD, Chelme-Ayala P, Smith DW, Gamal El-
Din M (2012) Petroleum coke adsorption as a water management
option for oil sands process-affected water. Sci Total Environ
427–428:364–372
2050 Int. J. Environ. Sci. Technol. (2014) 11:2037–2050
123