Page 1
ORIGINAL PAPER
Impact of pulsed jet actuators on aircraft mass and fuelconsumption
Francesco G. A. Bertels1 • Reinier van Dijk1 • Reno Elmendorp1 •
Roelof Vos1
Received: 21 October 2015 / Revised: 16 June 2016 / Accepted: 11 July 2016 / Published online: 11 August 2016
� The Author(s) 2016. This article is published with open access at Springerlink.com
Abstract Pulsed jet actuators (PJAs) are one of the can-
didate technologies to be integrated in Fowler flaps to
increase the maximum lift coefficient of transport aircraft
in the landing configuration. The total system consists of
the actuators plus sensors, a piping system to supply
pressurized air and a (redundant) power and communica-
tion system to provide actuator control. In this paper, it is
investigated what increase in the maximum lift coefficient
is required to justify the added weight and power off-takes
that accompany the integration of pulsed jet actuators. This
is done by making an automated design process for the
overall aircraft, the piping assembly system, and the elec-
trical wiring interconnection system. These last two sub-
systems rely on KBE techniques that automate dimen-
sioning and performance evaluation. A test case is specified
that encompasses the design of a typical single-aisle mid-
range aircraft with and without the PJA system installed. It
is concluded that the introduction of the PJA system
requires at least an increase in maximum lift coefficient of
0.2 to justify the increase in system mass and power off-
takes. Furthermore, it is shown that if the maximum lift
coefficient increases with 0.4, only small reductions in
maximum take-off weight (-0.3 %) and operating empty
weight (-0.6 %) can be expected, while the total fuel burn
remains virtually constant.
Keywords Pulsed jet actuators � Knowledge-basedengineering � Aircraft design � Aircraft systems �Technology assessment
1 Introduction
Active flow control (AFC) is a subject that has gained
considerable interest in the past years as a solution to the
never-ending demand of further improving the efficiency
of aircraft. However, the number of instances where AFC
has successfully transitioned from a laboratory prototype to
a real-world aeronautical application is small [1–6]. One of
the most important applications of AFC is the delay of
separation to increase the maximum lift coefficient of an
aircraft with high-lift devices. Even with modern simula-
tion techniques using high-fidelity computational fluid
dynamics (CFD), it is difficult to give a reliable prediction
of the effect of AFC on the maximum lift coefficient of a
full-scale transport aircraft that employs slotted high-lift
devices. Theoretical studies on a two-dimensional wing
with slat and flap demonstrated a possible increase of clmaxof 0.7 [7]. Even though the benefits are difficult to quantify,
the penalties in terms of power consumption and weight
addition can be estimated using knowledge-based design
principles and first-order analysis techniques. In this paper,
the effect of a pneumatic pulsed jet actuator on the fuel
weight and maximum take-off weight of a mid-range, high-
subsonic jet transport is considered under the assumption of
a predefined increase in maximum lift coefficient. It is
investigated what increase in the maximum lift coefficient
is required to justify the added weight and power off-takes
that accompany the integration of pulsed jet actuators. This
reverse approach to the assessment of pulsed jet actuators
does not require an expensive and unreliable CFD
This paper is based on a presentation at the CEAS Air & Space
Conference 2015, September 7–11, Delft, The Netherlands.
& Roelof Vos
[email protected]
1 Delft University of Technology, Faculty of Aerospace
Engineering, Kluyverweg 1, 2629 HS Delft, The Netherlands
123
CEAS Aeronaut J (2016) 7:535–549
DOI 10.1007/s13272-016-0201-8
Page 2
investigation and can give a first indication of the feasi-
bility of such a system.
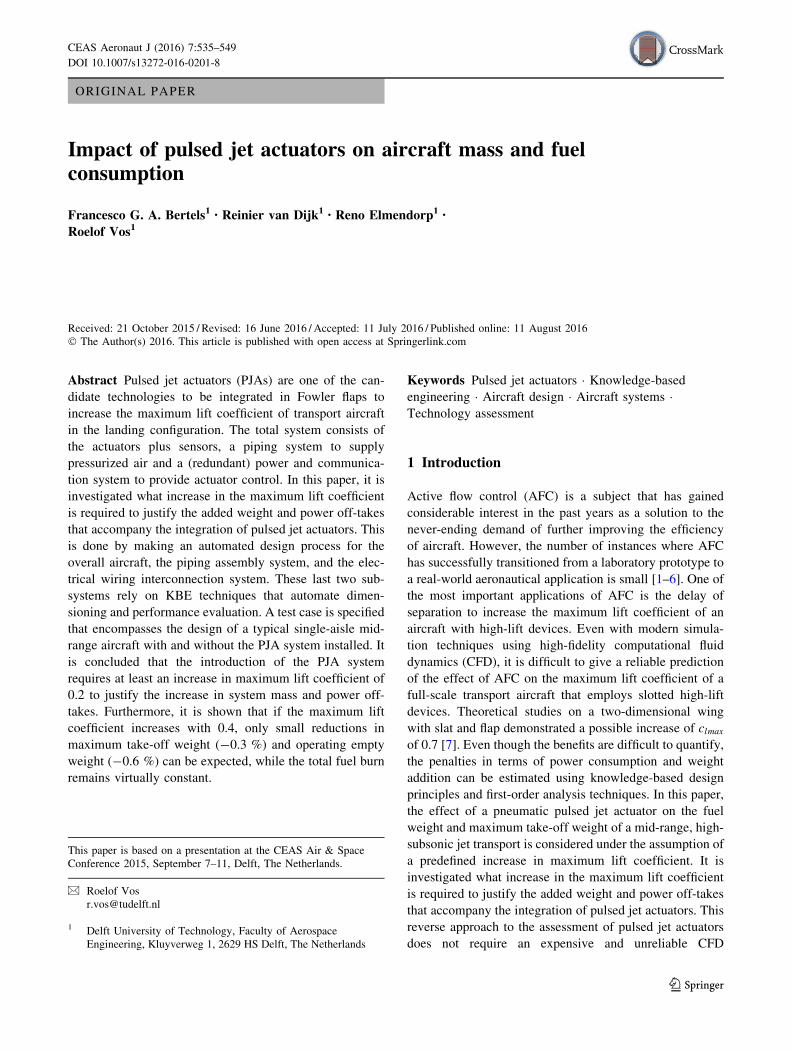
For this study, the pulsed jet actuators (PJA) under
development by Fraunhofer ENAS are used [8]. These
actuators rely on a continuous mass flow of compressed air
and use piezoceramic valves to achieve the pulsation of the
jet stream. Figure 1a depicts a schematic picture of one of
the actuators consisting of 6 individual orifices spaced 1cm
apart. Figure 1b depicts how four standard actuators of ten
orifices are mounted next to each other to form a 40-cm
long strip containing 40 orifices. The Fraunhofer PJA
concept is based on single piezoelectric elements that are
able to switch every single orifice individually. Each
actuator consists of ten orifices and needs to be connected
to an air supply and a signal generator to operate.
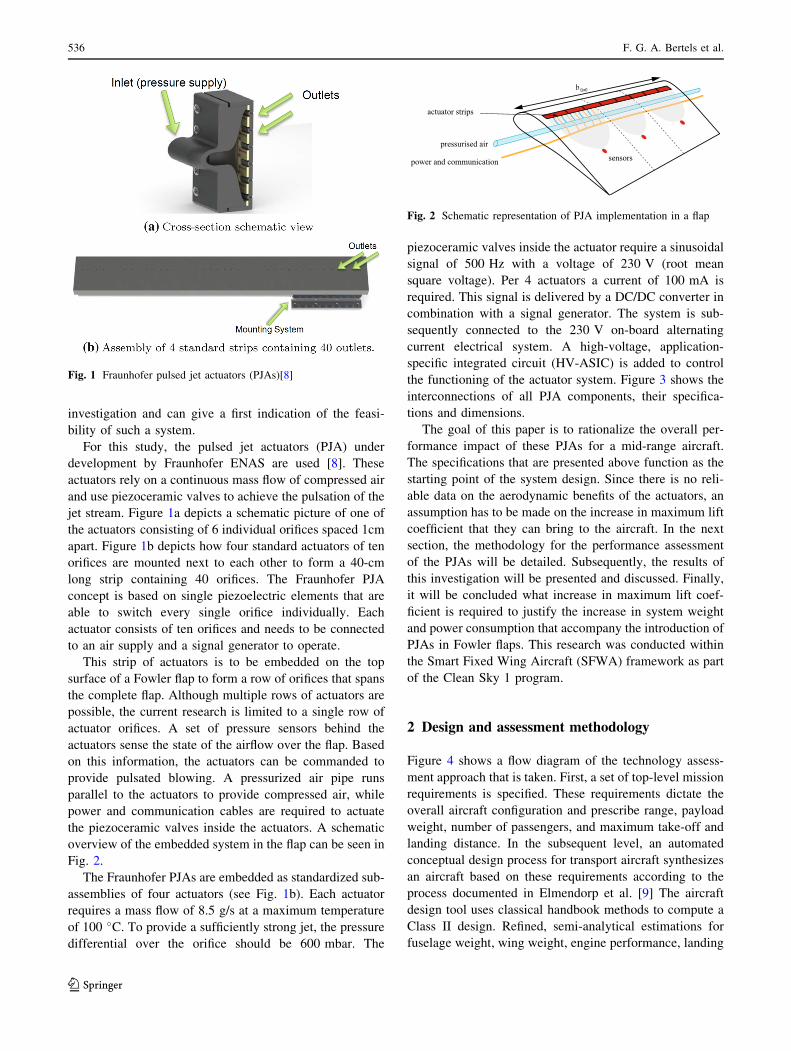
This strip of actuators is to be embedded on the top
surface of a Fowler flap to form a row of orifices that spans
the complete flap. Although multiple rows of actuators are
possible, the current research is limited to a single row of
actuator orifices. A set of pressure sensors behind the
actuators sense the state of the airflow over the flap. Based
on this information, the actuators can be commanded to
provide pulsated blowing. A pressurized air pipe runs
parallel to the actuators to provide compressed air, while
power and communication cables are required to actuate
the piezoceramic valves inside the actuators. A schematic
overview of the embedded system in the flap can be seen in
Fig. 2.
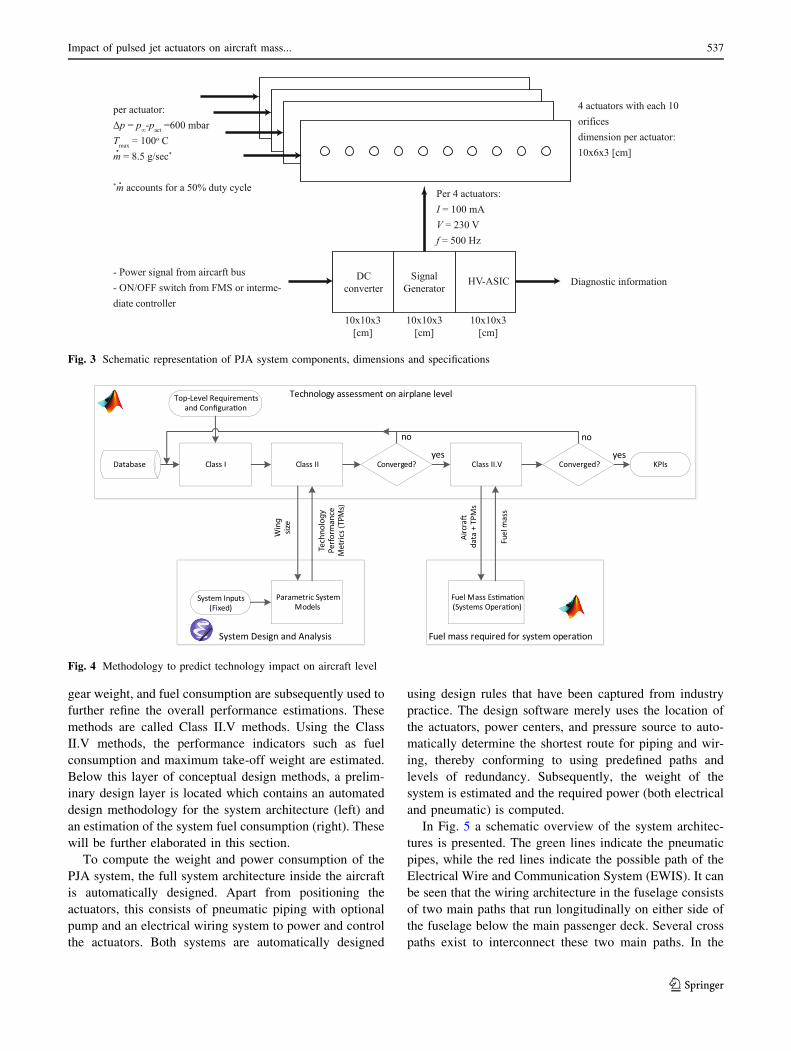
The Fraunhofer PJAs are embedded as standardized sub-
assemblies of four actuators (see Fig. 1b). Each actuator
requires a mass flow of 8.5 g/s at a maximum temperature
of 100 �C. To provide a sufficiently strong jet, the pressure
differential over the orifice should be 600 mbar. The
piezoceramic valves inside the actuator require a sinusoidal
signal of 500 Hz with a voltage of 230 V (root mean
square voltage). Per 4 actuators a current of 100 mA is
required. This signal is delivered by a DC/DC converter in
combination with a signal generator. The system is sub-
sequently connected to the 230 V on-board alternating
current electrical system. A high-voltage, application-
specific integrated circuit (HV-ASIC) is added to control
the functioning of the actuator system. Figure 3 shows the
interconnections of all PJA components, their specifica-
tions and dimensions.
The goal of this paper is to rationalize the overall per-
formance impact of these PJAs for a mid-range aircraft.
The specifications that are presented above function as the
starting point of the system design. Since there is no reli-
able data on the aerodynamic benefits of the actuators, an
assumption has to be made on the increase in maximum lift
coefficient that they can bring to the aircraft. In the next
section, the methodology for the performance assessment
of the PJAs will be detailed. Subsequently, the results of
this investigation will be presented and discussed. Finally,
it will be concluded what increase in maximum lift coef-
ficient is required to justify the increase in system weight
and power consumption that accompany the introduction of
PJAs in Fowler flaps. This research was conducted within
the Smart Fixed Wing Aircraft (SFWA) framework as part
of the Clean Sky 1 program.
2 Design and assessment methodology
Figure 4 shows a flow diagram of the technology assess-
ment approach that is taken. First, a set of top-level mission
requirements is specified. These requirements dictate the
overall aircraft configuration and prescribe range, payload
weight, number of passengers, and maximum take-off and
landing distance. In the subsequent level, an automated
conceptual design process for transport aircraft synthesizes
an aircraft based on these requirements according to the
process documented in Elmendorp et al. [9] The aircraft
design tool uses classical handbook methods to compute a
Class II design. Refined, semi-analytical estimations for
fuselage weight, wing weight, engine performance, landing
Fig. 1 Fraunhofer pulsed jet actuators (PJAs)[8]
pressurised air
power and communication
b flap
actuator strips
sensors
Fig. 2 Schematic representation of PJA implementation in a flap
536 F. G. A. Bertels et al.
123
Page 3
gear weight, and fuel consumption are subsequently used to
further refine the overall performance estimations. These
methods are called Class II.V methods. Using the Class
II.V methods, the performance indicators such as fuel
consumption and maximum take-off weight are estimated.
Below this layer of conceptual design methods, a prelim-
inary design layer is located which contains an automated
design methodology for the system architecture (left) and
an estimation of the system fuel consumption (right). These
will be further elaborated in this section.
To compute the weight and power consumption of the
PJA system, the full system architecture inside the aircraft
is automatically designed. Apart from positioning the
actuators, this consists of pneumatic piping with optional
pump and an electrical wiring system to power and control
the actuators. Both systems are automatically designed
using design rules that have been captured from industry
practice. The design software merely uses the location of
the actuators, power centers, and pressure source to auto-
matically determine the shortest route for piping and wir-
ing, thereby conforming to using predefined paths and
levels of redundancy. Subsequently, the weight of the
system is estimated and the required power (both electrical
and pneumatic) is computed.
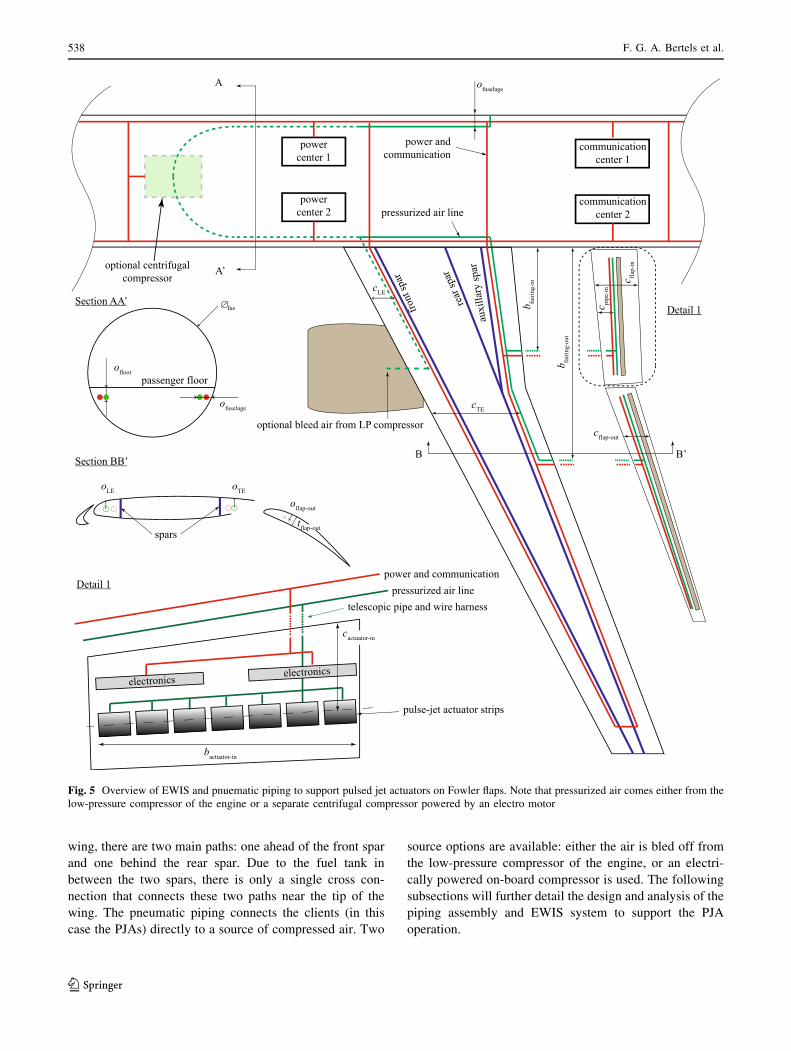
In Fig. 5 a schematic overview of the system architec-
tures is presented. The green lines indicate the pneumatic
pipes, while the red lines indicate the possible path of the
Electrical Wire and Communication System (EWIS). It can
be seen that the wiring architecture in the fuselage consists
of two main paths that run longitudinally on either side of
the fuselage below the main passenger deck. Several cross
paths exist to interconnect these two main paths. In the
per actuator:Δp = p∞-pact =600 mbarTmax = 100o Cm = 8.5 g/sec*
*m accounts for a 50% duty cycle
4 actuators with each 10orificesdimension per actuator:10x6x3 [cm]
Per 4 actuators:I = 100 mAV = 230 Vf = 500 Hz
HV-ASICDCconverter
SignalGenerator
10x10x3[cm]
- Power signal from aircarft bus- ON/OFF switch from FMS or interme-diate controller
•
10x10x3[cm]
10x10x3[cm]
Diagnostic information
•
Fig. 3 Schematic representation of PJA system components, dimensions and specifications
Fuel mass required for system opera�onSystem Design and Analysis
Technology assessment on airplane level
Database Converged? Converged?
Top-Level Requirements and Configura�on
KPIsClass I Class II Class II.V
Fuel Mass Es�ma�on (Systems Opera�on)
Parametric System Models
System Inputs (Fixed)
Fuel
mas
s
Airc
ra�
data
+ T
PMs
yes
no
yes
no
Win
g si
ze
Tech
nolo
gy
Perf
orm
ance
M
etric
s (T
PMs)
Fig. 4 Methodology to predict technology impact on aircraft level
Impact of pulsed jet actuators on aircraft mass... 537
123
Page 4
wing, there are two main paths: one ahead of the front spar
and one behind the rear spar. Due to the fuel tank in
between the two spars, there is only a single cross con-
nection that connects these two paths near the tip of the
wing. The pneumatic piping connects the clients (in this
case the PJAs) directly to a source of compressed air. Two
source options are available: either the air is bled off from
the low-pressure compressor of the engine, or an electri-
cally powered on-board compressor is used. The following
subsections will further detail the design and analysis of the
piping assembly and EWIS system to support the PJA
operation.
b fairi
ng-in
b fairi
ng-o
ut
cTE
cLE
c flap-
in
cflap-out
oLE oTE
oflap-out
Section BB’
Section AA’
Detail 1
spars
front
spar
rear
spar
auxi
llary
spar
c pipe
-in
tflap-out
communicationcenter 1
communicationcenter 2
powercenter 1
powercenter 2
power and communication
pressurized air line
optional centrifugal compressor
optional bleed air from LP compressor
B B’
ofloor
ofuselage
A
A’
passenger floor
ofuselage
Detail 1
electronics electronics
telescopic pipe and wire harness
pulse-jet actuator strips
pressurized air linepower and communication
cactuator-in
bactuator-in
fus
Fig. 5 Overview of EWIS and pnuematic piping to support pulsed jet actuators on Fowler flaps. Note that pressurized air comes either from the
low-pressure compressor of the engine or a separate centrifugal compressor powered by an electro motor
538 F. G. A. Bertels et al.
123
Page 5
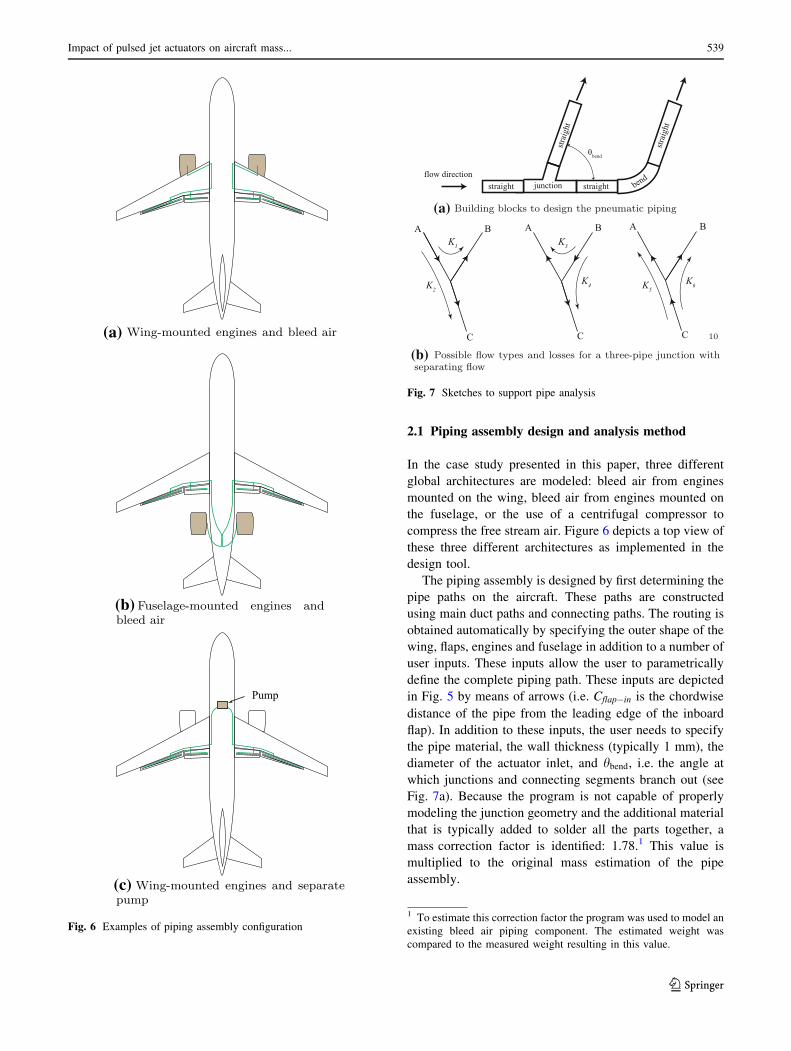
2.1 Piping assembly design and analysis method
In the case study presented in this paper, three different
global architectures are modeled: bleed air from engines
mounted on the wing, bleed air from engines mounted on
the fuselage, or the use of a centrifugal compressor to
compress the free stream air. Figure 6 depicts a top view of
these three different architectures as implemented in the
design tool.
The piping assembly is designed by first determining the
pipe paths on the aircraft. These paths are constructed
using main duct paths and connecting paths. The routing is
obtained automatically by specifying the outer shape of the
wing, flaps, engines and fuselage in addition to a number of
user inputs. These inputs allow the user to parametrically
define the complete piping path. These inputs are depicted
in Fig. 5 by means of arrows (i.e. Cflap�in is the chordwise
distance of the pipe from the leading edge of the inboard
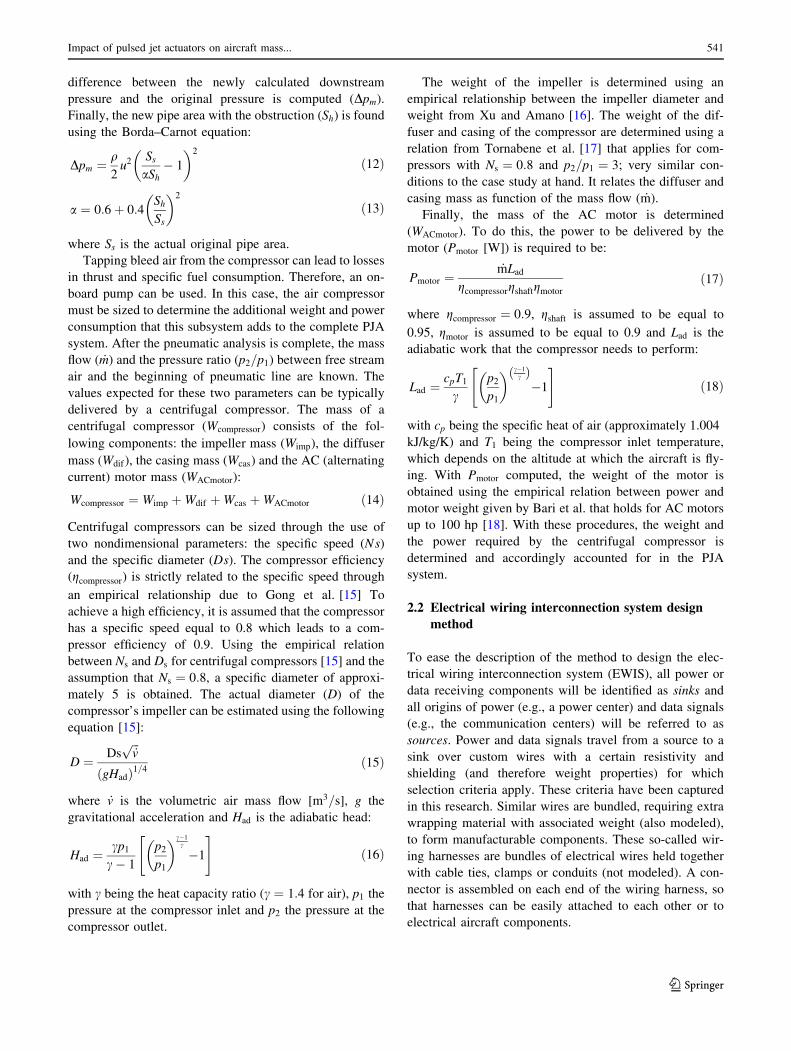
flap). In addition to these inputs, the user needs to specify
the pipe material, the wall thickness (typically 1 mm), the
diameter of the actuator inlet, and hbend, i.e. the angle at
which junctions and connecting segments branch out (see
Fig. 7a). Because the program is not capable of properly
modeling the junction geometry and the additional material
that is typically added to solder all the parts together, a
mass correction factor is identified: 1.78.1 This value is
multiplied to the original mass estimation of the pipe
assembly.
Wing-mounted engines and bleed air
Fuselage-mounted engines andbleed air
Pump
Wing-mounted engines and separatepump
(a)
(b)
(c)
Fig. 6 Examples of piping assembly configuration
junction straight
strai
ght
strai
ght
straight bendflow direction
θbend
Building blocks to design the pneumatic piping
A B
C
A B
C
A B
C
K3K1
K2 K5K4 K6
10
Possible flow types and losses for a three-pipe junction withseparating flow
(a)
(b)
Fig. 7 Sketches to support pipe analysis
1 To estimate this correction factor the program was used to model an
existing bleed air piping component. The estimated weight was
compared to the measured weight resulting in this value.
Impact of pulsed jet actuators on aircraft mass... 539
123
Page 6
Apart from the piping geometry generation, the tool also
analyzes the flow conditions in the whole piping system to
determine the initial flow conditions necessary to be
delivered by the engines or the pump. Since this tool is
meant to be used in the conceptual design phase with many
design iterations, the flow analysis is performed using a
low-order method. For each of the three different piping
blocks, depicted in Fig. 7a, a methodology is presented to
estimate the upstream flow conditions. The analysis starts
downstream where the actuators are connected to the pip-
ing assembly and the desired flow conditions are known
from the actuator specifications. Subsequently, the flow
condition is estimated all the way upstream to the source of
the pressurized air.
The pressure drop for a straight pipe with a constant
diameter is primarily derived from internal wall friction. If
isentropic flow is assumed, the Darcy–Weisbach equation
can be used to find the approximate pressure drop [11]:
Dp ¼ qfLu2
2Dh
ð1Þ
where f is the friction factor, L the length of the pipe and
Dh ¼ 4S=P the hydraulic diameter where S is the cross-
sectional area and P the wetted perimeter. The friction
factor can be determined using the Colebrook equation:
1ffiffiffi
fp ¼ �2log10
�=D
3:7þ 2:51
Reffiffi
fp
� �
ð2Þ
with Re being the Reynolds number and �=D being the
relative roughness, i.e., the ratio of the mean roughness
height and the pipe diameter [11]. Typical values for alu-
minum pipes are 0:001� 0:002� 10�3m [12].
Bends in pneumatic systems lead to additional pressure
losses when compared to straight pipes. These losses can
be accounted for using an equivalent length (Le) which
substitutes L in Eq. 1. The pressure drop through a 90�
bend is estimated using the following equation [13]:
Le
D
� �
90�¼ 19:833 0:003625þ 0:038
ffiffiffiffiffiffiffiffiffiffiffiffiffi
2Rc
Dffiffiffiffiffiffi
Rep
s
" #
�
ffiffiffiffiffiffiffiffiffiffiffiffiffiffiffiffiffi
2Rc
ffiffiffiffiffiffi
Rep
D
s
þ 22:2126 ReD
2Rc
� �2" #0:7888
� Re�0:71438 ReD
2Rc
� �2 !�0:25
ð3Þ
where Rc is the internal bend radius. To determine the
pressure drop in non 90� bends the linear relation bellow is
used:[14]
Le
D
� �
b
¼ b90o
Le
D
� �
90oð4Þ
The pressure losses encountered in three-pipe junctions can
be predicted with the horizontal momentum equation.
These losses are a function of the direction of the flow, the
mass flow, and the size of the pipes. For a blowing piping
system, as used for fluidic actuators, it is required to only
determine the flow behavior in separating junctions. The
pressure difference between the two pipes is given by [10]:
Dp ¼ pup � pdown� �
¼ 1
2qu2up K � 1þ q2w2
� �
ð5Þ
The value of K depends on the flow types at the junction,
which are schematically depicted in Fig. 7b. The coeffi-
cients K# that correspond to Fig. 7b are:
K1 ¼ 1þ q2w2 � 2qwcos3
4p� hð Þ
� �
ð6Þ
K2 ¼1
2þ q2w2 � 3
2qw ð7Þ
K3 ¼ 1þ q2
w2� 2
q
wcos
3
4p� hð Þ
� �
ð8Þ
K4 ¼ 1þ q2
w2� 2
q
wcos
3
4h
� �
ð9Þ
K5 ¼1
2þ q2w2 � 3
2qw ð10Þ
K6 ¼ 1þ q2w2 � 2qwcos3
4h
� �
ð11Þ
where q is the mass flow ratio ð _mdown= _mupÞ, with up rep-
resenting the upstream pipe and down the downstream
pipe. w is the area ratio ðSdown=SupÞ. For example, for K1
q ¼ _mB= _mA and w ¼ SB=SA.
For this case study, the flow conditions downstream at
the actuators are known, which means that at any junction
the two downstream pipes have known conditions and the
pressure in the upstream branch needs to be determined.
The two downstream branches are used to determine the
flow conditions in the upstream pipe using Eqs. (5) through
(11). This might result in two different pressures found for
the upstream branch. Clearly, this cannot be the case.
Therefore, the downstream branch that yields the highest
upstream pressure (pupmax) is kept the same while the
branch that yields the lowest upstream pressure is fitted
with an obstruction. This obstruction virtually changes the
cross-sectional area of the pipe, thereby increasing the
local pressure. The dimension of the obstruction is deter-
mined by first calculating the desired downstream pressure
using Eqs. (5) through (11) with pupmax. Subsequently, the
540 F. G. A. Bertels et al.
123
Page 7
difference between the newly calculated downstream
pressure and the original pressure is computed (Dpm).Finally, the new pipe area with the obstruction (Sh) is found
using the Borda–Carnot equation:
Dpm ¼ q2u2
Ss
aSh� 1
� �2
ð12Þ
a ¼ 0:6þ 0:4Sh
Ss
� �2
ð13Þ
where Ss is the actual original pipe area.
Tapping bleed air from the compressor can lead to losses
in thrust and specific fuel consumption. Therefore, an on-
board pump can be used. In this case, the air compressor
must be sized to determine the additional weight and power
consumption that this subsystem adds to the complete PJA
system. After the pneumatic analysis is complete, the mass
flow ( _m) and the pressure ratio (p2=p1) between free stream
air and the beginning of pneumatic line are known. The
values expected for these two parameters can be typically
delivered by a centrifugal compressor. The mass of a
centrifugal compressor (Wcompressor) consists of the fol-
lowing components: the impeller mass (Wimp), the diffuser
mass (Wdif), the casing mass (Wcas) and the AC (alternating
current) motor mass (WACmotor):
Wcompressor ¼ Wimp þWdif þWcas þWACmotor ð14Þ
Centrifugal compressors can be sized through the use of
two nondimensional parameters: the specific speed (Ns)
and the specific diameter (Ds). The compressor efficiency
(gcompressor) is strictly related to the specific speed through
an empirical relationship due to Gong et al. [15] To
achieve a high efficiency, it is assumed that the compressor
has a specific speed equal to 0.8 which leads to a com-
pressor efficiency of 0.9. Using the empirical relation
between Ns and Ds for centrifugal compressors [15] and the
assumption that Ns ¼ 0:8, a specific diameter of approxi-
mately 5 is obtained. The actual diameter (D) of the
compressor’s impeller can be estimated using the following
equation [15]:
D ¼ Dsffiffiffi
_vp
gHadð Þ1=4ð15Þ
where _v is the volumetric air mass flow [m3=s], g the
gravitational acceleration and Had is the adiabatic head:
Had ¼cp1c� 1
p2
p1
� �
c�1c
�1
" #
ð16Þ
with c being the heat capacity ratio (c ¼ 1:4 for air), p1 the
pressure at the compressor inlet and p2 the pressure at the
compressor outlet.
The weight of the impeller is determined using an
empirical relationship between the impeller diameter and
weight from Xu and Amano [16]. The weight of the dif-
fuser and casing of the compressor are determined using a
relation from Tornabene et al. [17] that applies for com-
pressors with Ns ¼ 0:8 and p2=p1 ¼ 3; very similar con-
ditions to the case study at hand. It relates the diffuser and
casing mass as function of the mass flow ( _m).
Finally, the mass of the AC motor is determined
(WACmotor). To do this, the power to be delivered by the
motor (Pmotor [W]) is required to be:
Pmotor ¼_mLad
gcompressorgshaftgmotorð17Þ
where gcompressor ¼ 0:9, gshaft is assumed to be equal to
0.95, gmotor is assumed to be equal to 0.9 and Lad is the
adiabatic work that the compressor needs to perform:
Lad ¼cpT1
cp2
p1
� �
c�1cð Þ�1
" #
ð18Þ
with cp being the specific heat of air (approximately 1.004
kJ/kg/K) and T1 being the compressor inlet temperature,
which depends on the altitude at which the aircraft is fly-
ing. With Pmotor computed, the weight of the motor is
obtained using the empirical relation between power and
motor weight given by Bari et al. that holds for AC motors
up to 100 hp [18]. With these procedures, the weight and
the power required by the centrifugal compressor is
determined and accordingly accounted for in the PJA
system.
2.2 Electrical wiring interconnection system design
method
To ease the description of the method to design the elec-
trical wiring interconnection system (EWIS), all power or
data receiving components will be identified as sinks and
all origins of power (e.g., a power center) and data signals
(e.g., the communication centers) will be referred to as
sources. Power and data signals travel from a source to a
sink over custom wires with a certain resistivity and
shielding (and therefore weight properties) for which
selection criteria apply. These criteria have been captured
in this research. Similar wires are bundled, requiring extra
wrapping material with associated weight (also modeled),
to form manufacturable components. These so-called wir-
ing harnesses are bundles of electrical wires held together
with cable ties, clamps or conduits (not modeled). A con-
nector is assembled on each end of the wiring harness, so
that harnesses can be easily attached to each other or to
electrical aircraft components.
Impact of pulsed jet actuators on aircraft mass... 541
123
Page 8
Various harnesses are interconnected at the so-called
production breaks that create a manageable manufacturing
and assembly process, but also introduce some extra weight
(modeled). Wiring harnesses may contain hundreds of
wires, and provide connectivity between all the mission
and vehicle systems. As they are critical to the mission,
they need to ensure sufficient redundancy and reliability.
The separation of wires or entire bundles is enforced by
numerous opposing design rules and regulations, for
example, redundancy of flight controls, electromagnetic
compatibility or heat dissipation of power cables.
A custom software tool named CAESAR (Conceptual
Analysis of EWIS System Architectures) has been devel-
oped to automate the conceptual design process for the
EWIS. CAESAR is designed to generically model different
system architectures and electrical system design options
(e.g., data or power) and provide a quick estimate on EWIS
weight, volume (space occupied) and cost. The CAESAR
tool automatically generates a conceptual space reservation
topology from the main pathway definition and system
positioning information. From the geometric model, an
undirected weighted graph representation is derived that
serves as the basis for the signal routing process (see
Fig. 8).
CAESAR has fully parametrized the EWIS design pro-
cess. Some parameters are inputs provided by the user (or
other software tool) and others are derived parameters in
the sense that engineering rules define how to evaluate
them from the inputs. The input for the initial space
reservation mainly consist of 3D positioning of clients,
sources and production breaks as well as connectivity
information (i.e., how are the production break connected
to each other). This is enough information for CAESAR to
generate the space reservation geometry. The electrical
signals are allowed to travel on a predefined grid. This grid
is defined by the production breaks as depicted in Fig. 8.
These production breaks and their interconnections with
each other can be specified though user inputs but also
automatically generated in a similar fashion as for the
pneumatic lines (described in Sect. 2, 2.1); it makes use of
the geometry of the fuselage and wings together with a
number of variables that will completely define their
position.
In addition, the user specifies which sink is connected to
which source, and what should be the redundancy (N). If a
power cable is specified between a source and a sink, the
type (AC or DC), the voltage (V), and the current (I) need
to be specified. If a communication cable is specified, the
1.505 0.5052.005
6.005
6.005
2.005
3.005
2.915
1.505
0.505
3.005
2.915
0.505
0.765
0.505
0.765
3.005
2.005
10.0051.505
10.005
2.0051.505
2.005
0.505
1.0050.505
0.505
2.505
4.005
0.505
0.475
2.505
4.005
0.505
0.475
0.5051.005
2.505
0.505
0.505
0.505
0.505
0.505
0.505
0.505
0.505
0.505
0.505
0.505
1.0052.505
0.505
0.5050.505
0.5050.505
0.5050.505
0.505
power center #2
power center #2
power center #1
0.505
0.505
2.005
4.005
0.505
2.005
4.005
0.505
0.415
0.475
1.805
0.4453.165
1.365
0.475
0.415 0.475
1.8050.445
3.165
1.365
0.475
signal overlap
curve length
production breakGEOMETRY GRAPH
breakout PJA #4
system
main route signal #2
signal #1
power center #1
breakout
Fig. 8 Representation of EWIS main pathway definition. Left geometric model. Right corresponding undirected, weighted graph
542 F. G. A. Bertels et al.
123
Page 9
protocol (e.g., analog, ARINC429 or AFDX), the data rate,
and maximum time delay need to be specified. In addition,
it needs to be specified whether the cable is sensitive to
electromagnetic interference (EMI). In collaboration with
Fokker Elmo, a database has been established that contains
a number of both aluminum and copper cables typically
used to connect power systems in aerospace applications as
well as a number of communication cables. The tool is able
to consult the database and select the appropriate cable
choice given the input requirements. The information
stored per cable in the database includes the gauge, the
mass per unit length (m/l), and the resistivity (x).Wire and bundle separation is an important aspect of the
EWIS design process. The electromagnetic compatibility
(EMC) can restrict the proximity of wires carrying
incompatible signals—they cannot be in the same bundle,
and bundles typically must be separated by a certain
physical distance. A wire routing constraint might take the
form If signal = AC Then do not route with flight controls.
There is an EMC matrix that defines the actual relation-
ships between signals that can travel together or not. These
interrelations are defined as constraints. Four EMC classi-
fications are used: HiDC for high-voltage DC wires, HiAC
for high current AC wires, M for other wires, and S for
wires that are susceptible to interference.
This research accounts for both segregation and sepa-
ration of wires. Segregation is an aspect on aircraft level
and involves the actual segregation of wires into separate
bundles. In the context of PJA, segregation is an important
means to ensure redundancy in system functionality by
providing multiple signals to the same system that travel
over distinct routes through the aircraft with a minimum
overlap. This reduces the likelihood of total system failure
when one of the cable/harnesses is compromised. Separa-
tion is an aspect on a bundle level and deals with minimum
distance constraints between adjacent wires/bundles to
ensure electromagnetic compatibility and proper heat dis-
sipation characteristics. Adequate separation is a function
of the physical and electrical attributes of the wires inside a
bundle and the hazard potential of a failure at any given
point along the length of the bundle.
To route a wire between a source and a sink, the shortest
path is found using a weighted undirected graph where
production breaks or harness breakouts become the nodes,
and the edges are the harness segments between breaks.
The weights of the edges are set equal to their physical
length, an appropriate measure for cable weight, which
needs to be minimized.
Most of the power and communication functionality
should be provided with a certain level of redundancy,
most often two or maximally three distinct signal paths
should be followed. In this case, the routing problem
becomes more challenging and there are no standard
algorithms available to solve it. The extended formulation
is:
min J ¼X
N
i
X
j
lj þX
k
a1lk þX
l
a2Vl
!
ð19Þ
The optimal routing of Eq. (19) introduces several terms
and states that the optimal solution for the routing of N
redundant signals corresponds to the combination of paths
that has minimum length (PN
i
P
j lj), but also minimum
path overlap (P
k lk) and a minimum number of production
break (vertex) intersections (P
l Vl); aspects that act against
each other. Equation (19) is a weighted multi-objective
function where two weight factors a1 and a2 penalize path
and vertex overlap relative to total path length, respec-
tively. A complicating factor is introduced by the
requirement to route redundant signals from different
power/communication sources to further improve reliabil-
ity. This transforms the routing problem into a multi-
source, single destination problem where every next
redundant signal switches to an alternative source node.
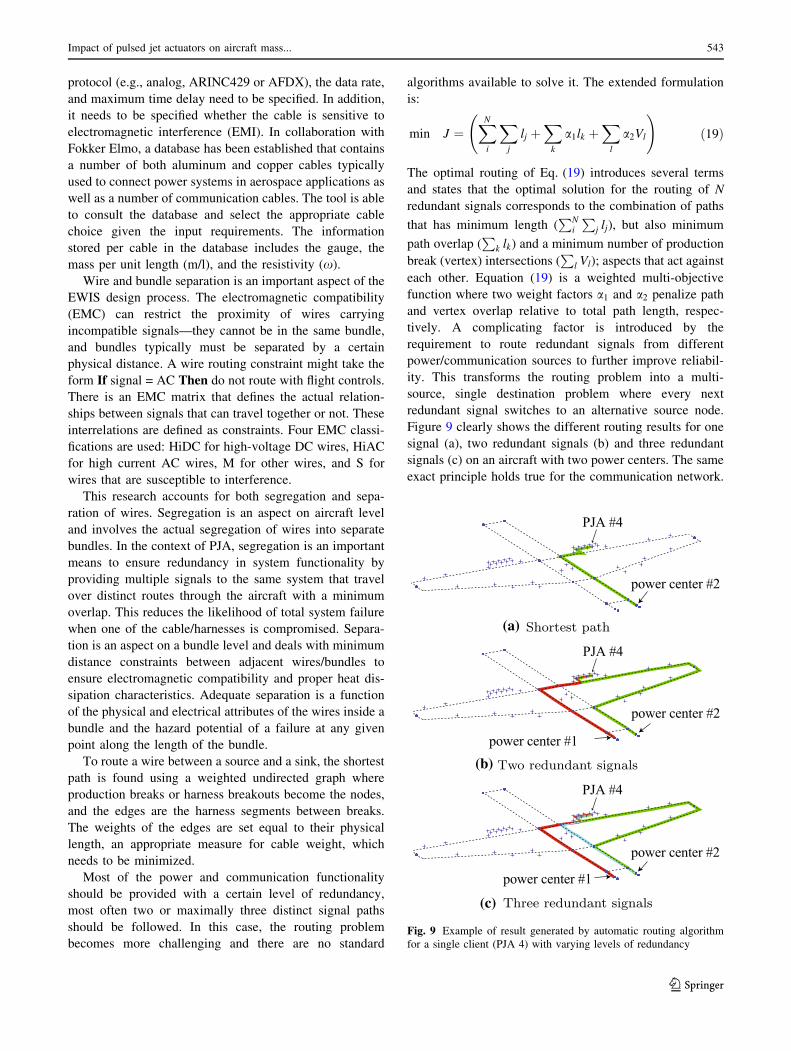
Figure 9 clearly shows the different routing results for one
signal (a), two redundant signals (b) and three redundant
signals (c) on an aircraft with two power centers. The same
exact principle holds true for the communication network.
power center #2
PJA #4
Shortest path
power center #2
power center #1
PJA #4
Two redundant signals
power center #2
power center #1
PJA #4
Three redundant signals
(a)
(b)
(c)
Fig. 9 Example of result generated by automatic routing algorithm
for a single client (PJA 4) with varying levels of redundancy
Impact of pulsed jet actuators on aircraft mass... 543
123
Page 10
An exhaustive search was implemented that finds all
possible paths for all signals and then performs a combi-
natory study evaluating Eq. (19) on each combination of
paths. This approach guarantees an optimal result, but is
not efficient. However, the relatively low number of signals
that need routing for this research and the relative a-
cyclicness of the main pathway topology render the current
approach feasible and adequate. Moreover, two assump-
tions are made. First, the criticality of overlap for different
main pathway segments and production breaks is consis-
tently the same. For this reason Eq. (19) uses a1 and a2instead of ak and al that would otherwise specialize on
different pathways. Second, the objective is to completely
favor minimum overlap over minimum length. In this
respect, weight factors approach infinity a1 ! 1 and a2 !1 and the routing lengths might be over-conservative. If
there are no redundancy requirements, one signal travels
from one source to one sink and the optimal routing cor-
responds to the shortest path (i.e., a1 ¼ a2 ¼ 0).
The selection process for power or communication
cables differs in complexity. Communication cables are
typically quite specific and the selection process boils
down to a direct relationship between communication
protocol and cable type. For power cables there is a larger
range of cables available and the selection process consists
of two steps: the selection of material type and cable size.
Power cables are either made from aluminum or copper
cores. While the default choice is aluminum, some condi-
tions would favor copper. This is true if the cable travels
through an area with limited space, an area with high
temperatures or an unprotected area and has a small gauge.
Evaluation of these rules for each cable involves
detailed knowledge of the various zones in the aircraft. In
the current stage of the research, high-level assumptions
are made for the applicability of the former conditions.
Once the type of metal is defined, the appropriate cable
should be chosen from a cable database.2 Wires carrying
current (I) always have inherent resistance, or impedance,
to current flow. The driving rule for power cable selection
is that the cable should result in an acceptable voltage drop
(DV), which is defined as the amount of voltage loss that
occurs through all or part of a circuit due to impedance.
The allowable voltage drop can be expressed as a relative
constraint, such as DVmax � 4%V (V is the source voltage),
or an absolute value, such a DVmax � 6:5. The idea is to
iterate through the database and select the cable with a
combination of resistivity (x) and nominal cross sections
(a) that just satisfies the following constraint:
xa� DVmax
I � lð20Þ
2.3 Fuel burn estimations
The required fuel mass to operate the electrical system and
the pneumatic system is computed from the mechanical
off-takes (MOT) and bleed air off-takes (BOT), respec-
tively. The fuel mass due to bleed air off-takes (WfBOT ) is
computed using the following relationship [19]:
WfBOT ¼KB p3=p2ð Þ0:475 _m
KE
exptKE � 1� � ð21Þ
where KB is the bleed air power off-take factor which is
assumed to be equal to 0.00499 [20], p3=p2 is the com-
pressor pressure ratio assumed equal to 24.9 [19], and t the
time over which the system is used. To estimate the
mechanical off-take fuel mass (WfMOT) the following is used
[19]:
WfMOT¼ KPPPJAWavgaircraft
nenginesTTOexptKE � 1� �
ð22Þ
where KP is the mechanical power off-take factor assumed
to be 0.01163 N/W [20], Wavgaircraft is the average mass of
the aircraft during the time in which the system is used,
nengines is the number of engines, TTO the take-off thrust of
one engine and KE is an efficiency factor defined as
follows:
KE ¼ SFCcos cð ÞL=D
þ sin cð Þ� �
ð23Þ
with SFC being the specific fuel consumption, c the flight
path angle and L / D the lift-to-drag ratio. The system
requirements (PPJA and _m) are the technology perfor-
mance metrics (TPMs) that are derived from the system
automatically designed system architectures.
3 Verification of prediction results
The methodology presented in Sect. 2 consists of a chain of
analytical tools that are interconnected. Each analysis
block outlined in Fig. 4 introduces errors with respect to a
real aircraft with a detailed system design. Since there are
no active PJA systems documented in the open literature
with disclosed weight data, it is challenging to assess the
accuracy of the predicted system weight. The EWIS is
based on an industry database of actual wires, and the
selection procedure was developed in cooperation with
Fokker ELMO. The design procedure for wire routing and
reliability has been invented by the authors as a logical
means of best practice for wire routing in support of the
2 Note that this rule is somewhat implicit, because the gauge can only
be known once a cable is selected (using the rules below) An initial
selection of a copper cable has to be performed first, after which a
conditional second selection step for an aluminum cable could follow.
544 F. G. A. Bertels et al.
123
Page 11
PJA system. The mass and volume of the system elec-
tronics (DC converter, signal generator, HV-ASIC) as well
as the PJAs themselves are based on best estimates from
experts of the Fraunhofer institute.
Best practices have also been applied to the architecture
of the ducting assembly. The duct sizing has been
generated based on mass flow requirements of the PJA
system, while its route through the aircraft is based on the
location of the engine (source), fuel tank, and primary
structural components. The wall thickness for the ducts was
obtained from a 1.8 m a physical piece of pneumatic
ducting used in a Boeing 737. Furthermore, this ducting
piece was also used to verify design rules and mass pre-
diction. For example, the article showed that behind a
junction the sum of the cross-sectional areas of the two
ducts equalled the cross-sectional area of the single duct
ahead of the junction. The increase in weight due welds,
connections and other refinements has been taken into
account using a correction factor on the predicted weight,
which originally only accounted for length, diameter and
wall thickness.
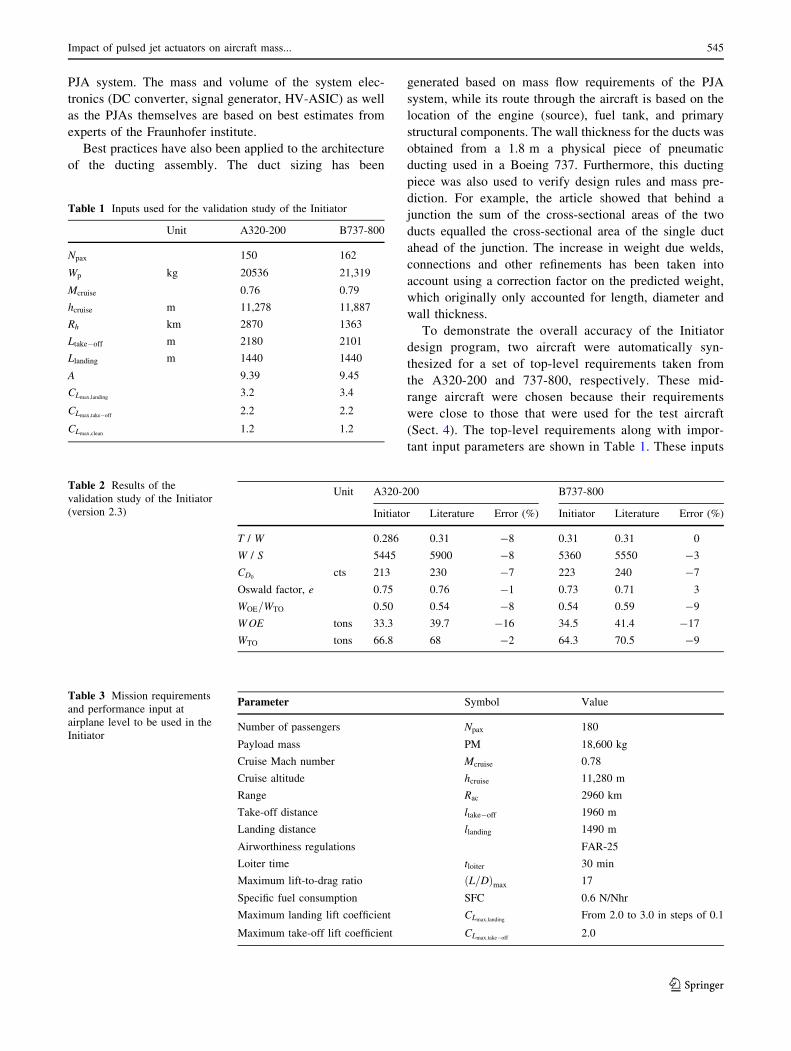
To demonstrate the overall accuracy of the Initiator
design program, two aircraft were automatically syn-
thesized for a set of top-level requirements taken from
the A320-200 and 737-800, respectively. These mid-
range aircraft were chosen because their requirements
were close to those that were used for the test aircraft
(Sect. 4). The top-level requirements along with impor-
tant input parameters are shown in Table 1. These inputs
Table 1 Inputs used for the validation study of the Initiator
Unit A320-200 B737-800
Npax 150 162
Wp kg 20536 21,319
Mcruise 0.76 0.79
hcruise m 11,278 11,887
Rh km 2870 1363
Ltake�off m 2180 2101
Llanding m 1440 1440
A 9.39 9.45
CLmax;landing3.2 3.4
CLmax;take�off2.2 2.2
CLmax;clean1.2 1.2
Table 2 Results of the
validation study of the Initiator
(version 2.3)
Unit A320-200 B737-800
Initiator Literature Error (%) Initiator Literature Error (%)
T / W 0.286 0.31 -8 0.31 0.31 0
W / S 5445 5900 -8 5360 5550 -3
CD0cts 213 230 -7 223 240 -7
Oswald factor, e 0.75 0.76 -1 0.73 0.71 3
WOE=WTO 0.50 0.54 -8 0.54 0.59 -9
WOE tons 33.3 39.7 -16 34.5 41.4 -17
WTO tons 66.8 68 -2 64.3 70.5 -9
Table 3 Mission requirements
and performance input at
airplane level to be used in the
Initiator
Parameter Symbol Value
Number of passengers Npax 180
Payload mass PM 18,600 kg
Cruise Mach number Mcruise 0.78
Cruise altitude hcruise 11,280 m
Range Rac 2960 km
Take-off distance ltake�off 1960 m
Landing distance llanding 1490 m
Airworthiness regulations FAR-25
Loiter time tloiter 30 min
Maximum lift-to-drag ratio L=Dð Þmax 17
Specific fuel consumption SFC 0.6 N/Nhr
Maximum landing lift coefficient CLmax;landingFrom 2.0 to 3.0 in steps of 0.1
Maximum take-off lift coefficient CLmax;take�off2.0
Impact of pulsed jet actuators on aircraft mass... 545
123
Page 12
were collected from sources in the open literature
[22, 23].
In Table 2 the results of the Initiator are compared to
results reported in the open literature [22, 23]. It can be
seen that the maximum take-off mass for the A320 and
B737 is predicted within 2 and 9 %, respectively. Although
this is an acceptable accuracy from a conceptual design
point of view, it should be noticed that the various con-
tributions that influence the maximum take-off weight (i.e.,
CD0, e,WOE) are underestimated up to 17 %. Later versions
of the Initiator (i.e., version 2.5) already demonstrate great
improvements in the individual contributions as is shown
by Elmendorp et al. [9]. However, the present version of
the Initiator is deemed accurate enough to show the effect
of pulsed jet actuators on the change in aircraft mass and
fuel consumption for a given set of top-level requirements
and the design process of the Initiator.
4 Test case definition
The method described above is applied to a test case with
similar top-level requirements of a typical mid-range
aircraft. The PJAs are assumed to be functioning when-
ever the flaps of the aircraft are deflected. This means at
the beginning of the mission during take-off and the
initial part of climb and at the end of the mission during
final descent and touch down. A simplified mission profile
is assumed without a diversion phase. The mission
requirements and the performance parameters are listed in
Table 3. The maximum lift coefficient attainable during
landing (CLmax;landing) is assumed to be taking a range of
values from 2.0 to 3.0 in steps of 0.1. It is assumed that
the aircraft has slats, even at the lowest assumed lift
coefficient. This is to account for the uncertainty in per-
formance of PJAs. For each value of CLmax;landingthe tool is
run. Provided that the landing distance requirement is
actively constraining the wing size (which is the case), for
each different value of CLmax;landinga different aircraft design
is obtained.
All three configurations depicted in Fig. 6 are run in
addition to a baseline configuration without the PJA system
on-board. Furthermore, for each of the three PJA config-
urations, two sets of runs are made to investigate the effect
of having ‘‘reliability 1’’ or ‘‘reliability 2’’ for the EWIS
design:
– Reliability 1: each client is connected to the two power
centers and two communication centers by means of 1
wire, so the total number of wires per client is 4.
– Reliability 2: each client is connected to the two power
centers and two communication centers by means of 2
wires, so the total number of wires per client is 8.
The result yields ð3� 2þ 1Þ � 11 ¼ 77 design iterations
that have been carried out in approximately three nominal
working days on a PC workstation.
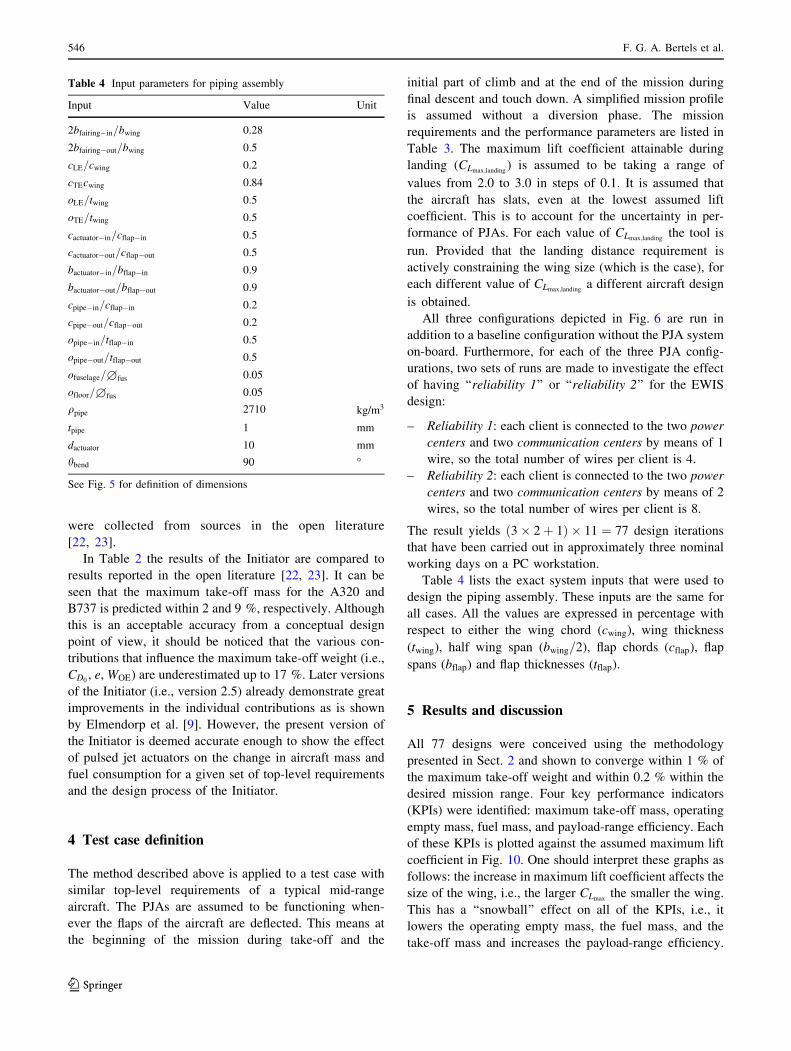
Table 4 lists the exact system inputs that were used to
design the piping assembly. These inputs are the same for
all cases. All the values are expressed in percentage with
respect to either the wing chord (cwing), wing thickness
(twing), half wing span (bwing=2), flap chords (cflap), flap
spans (bflap) and flap thicknesses (tflap).
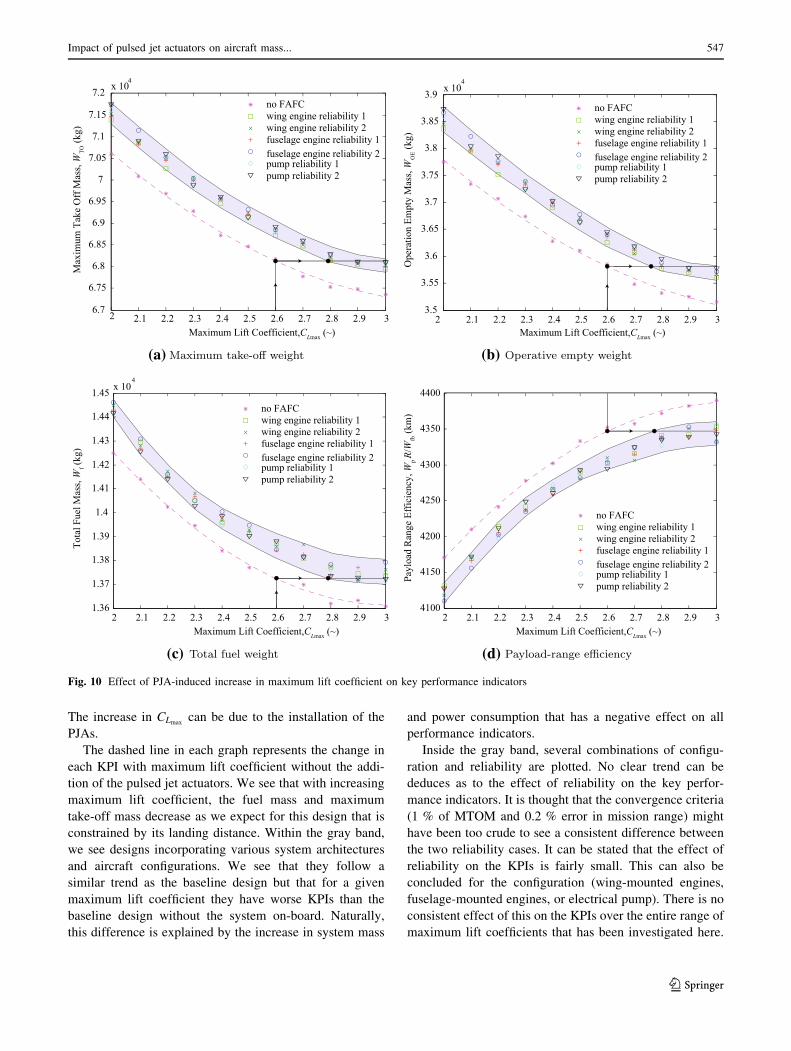
5 Results and discussion
All 77 designs were conceived using the methodology
presented in Sect. 2 and shown to converge within 1 % of
the maximum take-off weight and within 0.2 % within the
desired mission range. Four key performance indicators
(KPIs) were identified: maximum take-off mass, operating
empty mass, fuel mass, and payload-range efficiency. Each
of these KPIs is plotted against the assumed maximum lift
coefficient in Fig. 10. One should interpret these graphs as
follows: the increase in maximum lift coefficient affects the
size of the wing, i.e., the larger CLmaxthe smaller the wing.
This has a ‘‘snowball’’ effect on all of the KPIs, i.e., it
lowers the operating empty mass, the fuel mass, and the
take-off mass and increases the payload-range efficiency.
Table 4 Input parameters for piping assembly
Input Value Unit
2bfairing�in=bwing 0.28
2bfairing�out=bwing 0.5
cLE=cwing 0.2
cTEcwing 0.84
oLE=twing 0.5
oTE=twing 0.5
cactuator�in=cflap�in 0.5
cactuator�out=cflap�out 0.5
bactuator�in=bflap�in 0.9
bactuator�out=bflap�out 0.9
cpipe�in=cflap�in 0.2
cpipe�out=cflap�out 0.2
opipe�in=tflap�in 0.5
opipe�out=tflap�out 0.5
ofuselage=£fus 0.05
ofloor=£fus 0.05
qpipe 2710 kg/m3
tpipe 1 mm
dactuator 10 mm
hbend 90 �
See Fig. 5 for definition of dimensions
546 F. G. A. Bertels et al.
123
Page 13
The increase in CLmaxcan be due to the installation of the
PJAs.
The dashed line in each graph represents the change in
each KPI with maximum lift coefficient without the addi-
tion of the pulsed jet actuators. We see that with increasing
maximum lift coefficient, the fuel mass and maximum
take-off mass decrease as we expect for this design that is
constrained by its landing distance. Within the gray band,
we see designs incorporating various system architectures
and aircraft configurations. We see that they follow a
similar trend as the baseline design but that for a given
maximum lift coefficient they have worse KPIs than the
baseline design without the system on-board. Naturally,
this difference is explained by the increase in system mass
and power consumption that has a negative effect on all
performance indicators.
Inside the gray band, several combinations of configu-
ration and reliability are plotted. No clear trend can be
deduces as to the effect of reliability on the key perfor-
mance indicators. It is thought that the convergence criteria
(1 % of MTOM and 0.2 % error in mission range) might
have been too crude to see a consistent difference between
the two reliability cases. It can be stated that the effect of
reliability on the KPIs is fairly small. This can also be
concluded for the configuration (wing-mounted engines,
fuselage-mounted engines, or electrical pump). There is no
consistent effect of this on the KPIs over the entire range of
maximum lift coefficients that has been investigated here.
2 2.1 2.2 2.3 2.4 2.5 2.6 2.7 2.8 2.9 36.7
6.75
6.8
6.85
6.9
6.95
7
7.05
7.1
7.15
7.2 x 10⁴
Maximum Lift Coefficient,CLmax (~)
Max
imum
Tak
e O
ff M
ass, W
TO (k
g)
no FAFCwing engine reliability 1wing engine reliability 2fuselage engine reliability 1fuselage engine reliability 2pump reliability 1pump reliability 2
Maximum take-off weight
2 2.1 2.2 2.3 2.4 2.5 2.6 2.7 2.8 2.9 33.5
3.55
3.6
3.65
3.7
3.75
3.8
3.85
3.9 x 10⁴
Ope
ratio
n Em
pty
Mas
s, W
OE (kg
)
Maximum Lift Coefficient,CLmax (~)
no FAFCwing engine reliability 1wing engine reliability 2fuselage engine reliability 1fuselage engine reliability 2pump reliability 1pump reliability 2
Operative empty weight
2 2.1 2.2 2.3 2.4 2.5 2.6 2.7 2.8 2.9 31.36
1.37
1.38
1.39
1.4
1.41
1.42
1.43
1.44
1.45 x 10⁴
Tota
l Fue
l Mas
s, W
f (kg
)
Maximum Lift Coefficient,CLmax (~)
no FAFCwing engine reliability 1wing engine reliability 2fuselage engine reliability 1fuselage engine reliability 2pump reliability 1pump reliability 2
Total fuel weight
2 2.1 2.2 2.3 2.4 2.5 2.6 2.7 2.8 2.9 34100
4150
4200
4250
4300
4350
4400Pa
yloa
d R
ange
Eff
icie
ncy,
Wp R/W
fb (k
m)
Maximum Lift Coefficient,CLmax (~)
no FAFCwing engine reliability 1wing engine reliability 2fuselage engine reliability 1fuselage engine reliability 2pump reliability 1pump reliability 2
Payload-range efficiency
(a) (b)
(c) (d)
Fig. 10 Effect of PJA-induced increase in maximum lift coefficient on key performance indicators
Impact of pulsed jet actuators on aircraft mass... 547
123
Page 14
It can be seen, however, that in eight out of the eleven
cases that were investigated, the pump configuration yiel-
ded the lowest amount of fuel burn. This seems to point
towards a positive effect on fuel burn of a more electric
aircraft architecture compared to an architecture based on
engine bleed air. On the other hand, we also see a weight
penalty in the operating empty mass (OEM) with the pump
configuration yielding the highest OEM in eight out of the
eleven cases.
The black line with arrows shows what improvement in
maximum lift coefficient is required to ‘‘break even’’ in
terms of the four KPIs. For example, if the baseline aircraft
can achieve a CLmaxof 2.6, its maximum take-off mass
equals 68.1 metric tons. When the PJA system is fully
installed, it causes a weight penalty of 0.7 metric tons in
terms of MTOM and 0.5 metric tons in terms of OEM. To
offset this weight penalty and keep the maximum take-off
mass constant, the PJAs need to increase the maximum lift
coefficient to at least 2.8. It can be deduced from the black
lines in each of the plots of Fig. 10 that a typical increase
of CLmaxon the order of 0.2–0.4 is required to justify the
added weight and power off-takes of the engine. Assuming
an increase in CLmaxof 0.4 can indeed be achieved, this
would reduce the maximum take-off mass by approxi-
mately 0.2 metric tons (-0.3 %), reduce the operating
empty mass by 0.2 metric tons (-0.6 %), and cause the
total fuel mass to stay the same. Finally, the payload-range
efficiency would increase by approximately 15 km
(?0.3%).
Based on the theoretically estimated [7] (two-dimen-
sional) clmaxincrease of 0.7, it seems plausible that PJAs
can indeed cause an increase in 3D CLmaxof approximately
0.4. However, experimental studies should still confirm
that this can actually be achieved for a 3D wing with
Fowler flap. Apart from this uncertainty, the improvements
in the key performance indicators are relatively mild.
Moreover, the additional complexity that the integration of
this system introduces in the aircraft (particularly in the
Fowler flap) has not been taken into account in this study.
The added complexity yields higher development and
manufacturing cost. In addition, maintenance cost have to
increase due to the fact that the PJAs become part of the
flight critical high-lift system, and are therefore subjected
to the same reliability requirements as the high-lift mech-
anism that controls the deployment of flaps and slats.
6 Conclusions
A study has been carried out to investigate the effect of
flap-based pulsed jet actuators on the key performance
indicators of a mid-range jet aircraft. Automated design
software was successfully used to design the required
piping assembly and electrical wiring interconnection
system that supports the operation of the pulsed jet actua-
tors. Assuming a maximum lift coefficient of 2.6 in landing
configuration, it was shown that the addition of the pulsed
jet system causes an increase in operating empty mass from
55.8 metric tons to 56.3 metric tons for an A320-like air-
craft. This increase could only be offset if a maximum lift
coefficient increase of at least 0.2 was achieved by the
pulsed jet actuators. In addition, it was demonstrated that
when the maximum lift coefficient increases to 0.4 due to
the pulsed jet actuators only a mild decrease in operating
empty mass (-0.6 %) and maximum take-off mass
(-0.3 %) can be expected due to the smaller wing that is
then required. The total fuel burn is expected to stay the
same due to the additional fuel that is required to power the
system when the flaps are deployed.
Acknowledgments The authors would like to acknowledge the
valuable contribution of Fokker Elmo with respect to the design of the
EWIS system. In addition, Martin Schuller and Martin Lipowski from
Fraunhofer ENAS for providing details on the actuator specifications.
This research was conducted within the Smart Fixed Wing Aircraft
(SFWA) framework as part of the Clean Sky 1 program.
Open Access This article is distributed under the terms of the
Creative Commons Attribution 4.0 International License (http://crea
tivecommons.org/licenses/by/4.0/), which permits unrestricted use,
distribution, and reproduction in any medium, provided you give
appropriate credit to the original author(s) and the source, provide a
link to the Creative Commons license, and indicate if changes were
made.
References
1. Pugliese, A.J., Englar, R.J.: Flight testing the circulation control
wing. Presented at the AIAA aircraft system technology meeting,
AIAA 1979–1791, New York (1979)
2. Kibens, V., Bower, W.W.: An overview of active flow control
applications at the Boeing company. In: Proceedings of the 2nd
AIAA Flow Control Conference, pp. 2004–2624 (2004)
3. Greska, B., Krothapalli, A., Seiner, J.M., Jansen, B., Ukeiley, L.:
The effects of microjet injection on an F404 jet engine. In: Pro-
ceedings of the 11th AIAA/CEAS Aeroacoustics Conference,
AIAA 2005–3047, Monterery, CA, 23–25 May 2005
4. Seiner, J., Ukeiley, L., Jansen, B.: Aero-performance efficient
noise reduction for the F404–400 Engine. In: Proceedings of the
11th AIAA/CEAS Aeroacoustics Conference, AIAA 2005–3048,
Monterery, CA, 23–25 May 2005
5. Shaw, L., Smith, B., Saddoughi, S.: Full-Scale flight demon-
stration of active control of a pod wake. In: Proceedings of the
3rd AIAA Flow Control Conference, San Francisco, CA, 5–8
June 2006
6. Cattafesta, L., Sheplak, M.: Actuators for active flow control.
Ann. Rev. Fluid Mech. 43, 247–272 (2011)
7. Shmilovich, A., Yadlin, Y.: J. Active flow control for practical
high-lift systems. J. Aircr. 46(4), 1354 (2009)
8. Schueller, M., Lipowski, M.: Actuators for Active Flow Control.
Cleansky Internal Meeting Presentation, Fraunhofer (2013)
548 F. G. A. Bertels et al.
123
Page 15
9. Elmendorp, R.J. M., Vos, R., LaRocca, G.: A conceptual design
and analysis method for conventional and unconventional air-
craft. In: Grant, I. (ed.) Proceedings of the 29th Congress of the
International Council for the Aeronautical Sciences, ICAS, St.
Petersburg, Russia (2014)
10. Bassett, M., Winterbone, D., Pearson, R.: Calculation of steady
flow pressure loss coefficients for pipe junctions. In: Proceedings
of the Institution of Mechanical Engineers, Part C, Journal of
Mechanical Engineering Science, vol. 215(8), pp. 861–881
(2001)
11. Barber, A.: Pneumatic Handbook, 7th edn. The Trade & Tech-
nical Press Limited, Surrey (1989)
12. Anon.: Engineering Toolbox, Roughness & Surface Coefficients
of Ventilation Ducts (Online; Accessed April 2013). http://www.
engineeringtoolbox.com/surface-roughness-ventilation-ducts-d_
209.html
13. Crawford, N., Cunningham, G., Spedding, P.L.: Prediction of
pressure drop for turbulent fluid flow in 90-degree bends. In:
Proceedings of the Institution of Mechanical Engineers, Part E,
Journal of Mechanical Engineering, vol. 217, pp. 153–155 (2003)
14. Crane, C.: Flow of fluids through valves, fittings, and pipes. Tech.
rep., Crane Co, Joliet, IL (1988) (Technical Paper 410)
15. Gong, Y., Carstens, N., Driscoll, M., Matthews, I.: Analysis of
radial compressor options for supercritical co2 power conversion
cycles. Tech. rep., MIT Department of Nuclear Science and
Engineering (2006) (Report No. MIT-GFR-034)
16. Xu, C., Amano, R.S.: Empirical design considerations for
industrial centrifugal compressors. Int. J. Rotat. Mach. 2012, 1(2012)
17. Tornabene, R., Wnag, X., Steffen, C.J., Freeh, J.: Development of
parametric mass and volume models for an aerospace sofc/gas
turbine hybrid system. Tech. rep., National Aeronautics and
Space Administration (2005) (NASA TM-2055-213819)
18. Bari, M., Roof, C., Oza, A., Chudobay, B.: The future of electric
aircraft. In: Proceedings of the 51st AIAA Aerospace Sciences
Meeting, Grapevine, TX, 7–10 Jan 2013
19. Scholz, D.: Betriebskostenschaetzung von flugzeugsystemen als
beitrag zur entwurfsoptimierung. Deutscher luft- und raum-
fahrtkongress, Bonn, Germany, 26–29 Sept 1995
20. Ahlefelder, S.: Kraftstoffverbrauch durch entnahme von zapfluft
und wellenleistung von strahltriebwerken. Master’s thesis,
Hamburg University of Applied Sciences (2006)
21. Jenkinson, L., Simpkin, P., Rhodes, D.: Civil Jet Aircraft Design.
Butterworth-Heinemann, Oxford (1999)
22. Roux, E.: Avions civils a reaction, Plan 3 vues et donnees car-
acteristiques, 3rd edn. Elodie Roux (2007)
23. Obert, E.: Aerodynamic Design of Transport Aircraft. IOS press,
Delft (2009)
Impact of pulsed jet actuators on aircraft mass... 549
123