IMPACT OF SILVER NANOPARTICLE EXPOSURE ON CRAYFISH (Orconectes virilis) GROWTH, CHEMISTRY AND PHYSIOLOGY IN CONTROLLED LABORATORY EXPERIMENT AND HUDSON RIVER ECOSYSTEM A Final Report of the Tibor T. Polgar Fellowship Program Allen Clayton Polgar Fellow School of Science, Department of Biology Marist College Poughkeepsie, NY 12601 Project Advisor: Dr. Zofia Gagnon School of Science, Department of Environmental Science Marist College Poughkeepsie, NY 12601 Clayton, A.C. and Z.E. Gagnon. 2012. Impact of Silver Nanoparticle Exposure on Crayfish (Orconectes virilis) Growth, Chemistry and Physiology in Controlled Laboratory Experiment and Hudson River Ecosystem. Section VI: 1-36 pp. In S.H. Fernald, D.J. Yozzo and H. Andreyko (eds.), Final Reports of the Tibor T. Polgar Fellowship Program, 2010. Hudson River Foundation. VI - 1
Transcript
IMPACT OF SILVER NANOPARTICLE EXPOSURE ON CRAYFISH (Orconectes virilis) GROWTH, CHEMISTRY AND PHYSIOLOGY IN
CONTROLLED LABORATORY EXPERIMENT AND HUDSON RIVER ECOSYSTEM
A Final Report of the Tibor T. Polgar Fellowship Program
Allen Clayton
Polgar Fellow
School of Science, Department of Biology Marist College
Poughkeepsie, NY 12601
Project Advisor:
Dr. Zofia Gagnon School of Science, Department of Environmental Science
Marist College Poughkeepsie, NY 12601
Clayton, A.C. and Z.E. Gagnon. 2012. Impact of Silver Nanoparticle Exposure on Crayfish (Orconectes virilis) Growth, Chemistry and Physiology in Controlled Laboratory Experiment and Hudson River Ecosystem. Section VI: 1-36 pp. In S.H. Fernald, D.J. Yozzo and H. Andreyko (eds.), Final Reports of the Tibor T. Polgar Fellowship Program, 2010. Hudson River Foundation.
VI - 1
ABSTRACT
The use of nanotechnology has become widespread in commercial, industrial and
medical applications; however, there is concern that their high level of reactivity may
also pose risks to human health and the environment. Previous studies involving metal
nanoparticles have shown them to be toxic and destructive to DNA and metabolic
pathways. Silver nanoparticles (AgNPs) have recently received much attention for their
growing role in biotechnology and life sciences.
Crayfish (Orconectes virilis), a common inhabitant of the Hudson River and its
tributaries, were used as an experimental model in this project. A colloidal solution of
AgNPs was synthesized from chemical reduction of silver nitrate (AgNO3) by sodium
borohydride (NaBH4), and organisms were exposed for 10 days to different
concentrations of colloidal AgNP suspended in Hudson River water. The following
AgNP concentrations were used: 0.0, 0.05, 0.107, 0.16, and 0.214 mg/L. Control
treatments of AgNO3 and NaBH4 were established in the same concentrations used for
synthesis of the AgNP treatments. Additional control treatments were established using
untreated Hudson River water, and cages placed directly in the Hudson River (river
control). Crayfish were harvested and examined for silver accumulation, DNA damage,
and pathological changes. Silver accumulation in major organs was determined by atomic
absorption using a ThermoElemental Solaar M5 spectrophotometer in graphite furnace
mode. DNA damage was examined via single cell gel electrophoresis (comet assay).
The bioaccumulation of Ag in crayfish liver, muscle, and green gland tissues was
detected in all AgNP and AgNO3 treatments. DNA damage was found to be statistically
significant in all laboratory specimens when compared to the river control.
Literature Cited ..................................................................................VI – 34
VI - 3
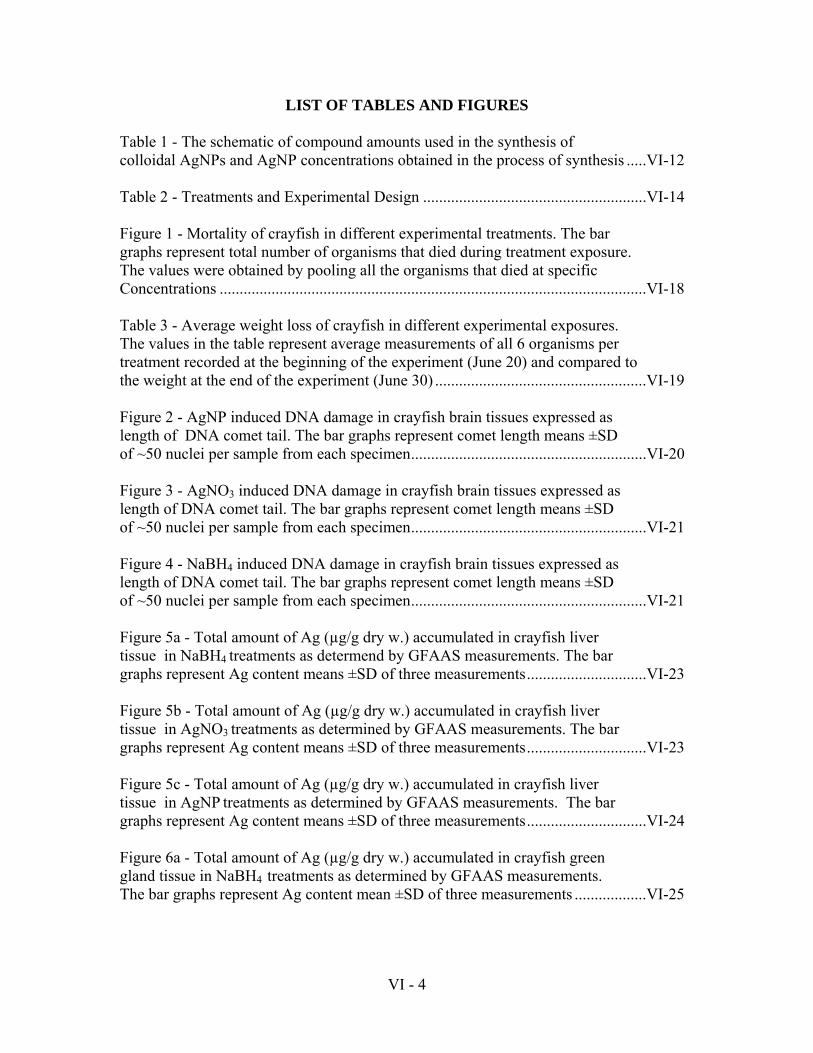
LIST OF TABLES AND FIGURES
Table 1 - The schematic of compound amounts used in the synthesis of colloidal AgNPs and AgNP concentrations obtained in the process of synthesis .....VI-12 Table 2 - Treatments and Experimental Design ........................................................VI-14 Figure 1 - Mortality of crayfish in different experimental treatments. The bar graphs represent total number of organisms that died during treatment exposure. The values were obtained by pooling all the organisms that died at specific Concentrations ...........................................................................................................VI-18 Table 3 - Average weight loss of crayfish in different experimental exposures. The values in the table represent average measurements of all 6 organisms per treatment recorded at the beginning of the experiment (June 20) and compared to the weight at the end of the experiment (June 30) .....................................................VI-19 Figure 2 - AgNP induced DNA damage in crayfish brain tissues expressed as length of DNA comet tail. The bar graphs represent comet length means ±SD of ~50 nuclei per sample from each specimen ...........................................................VI-20 Figure 3 - AgNO3 induced DNA damage in crayfish brain tissues expressed as length of DNA comet tail. The bar graphs represent comet length means ±SD of ~50 nuclei per sample from each specimen ...........................................................VI-21 Figure 4 - NaBH4 induced DNA damage in crayfish brain tissues expressed as length of DNA comet tail. The bar graphs represent comet length means ±SD of ~50 nuclei per sample from each specimen ...........................................................VI-21 Figure 5a - Total amount of Ag (µg/g dry w.) accumulated in crayfish liver tissue in NaBH4 treatments as determend by GFAAS measurements. The bar graphs represent Ag content means ±SD of three measurements ..............................VI-23 Figure 5b - Total amount of Ag (µg/g dry w.) accumulated in crayfish liver tissue in AgNO3 treatments as determined by GFAAS measurements. The bar graphs represent Ag content means ±SD of three measurements ..............................VI-23 Figure 5c - Total amount of Ag (µg/g dry w.) accumulated in crayfish liver tissue in AgNP treatments as determined by GFAAS measurements. The bar graphs represent Ag content means ±SD of three measurements ..............................VI-24 Figure 6a - Total amount of Ag (µg/g dry w.) accumulated in crayfish green gland tissue in NaBH4 treatments as determined by GFAAS measurements. The bar graphs represent Ag content mean ±SD of three measurements ..................VI-25
VI - 4
Figure 6b – Total amount of Ag (µg/g dry w.) accumulated in crayfish green gland tissue in AgNO3 treatments as determined by GFAAS measurements. The bar graphs represent Ag content mean ±SD of three measurements ..................VI-26 Figure 6c - Total amount of Ag (µg/g dry w.) accumulated in crayfish green gland tissue in AgNP treatments as determined by GFAAS measurements. The bar graphs represent Ag content mean ±SD of three measurements ..................VI-26 Figure 7a - Total amount of Ag (µg/g dry w.) accumulated in crayfish muscle tissue in NaBH4 treatments as determined by GFAAS measurements. The bar graphs represent Ag content mean ±SD of three measurements ..................VI-27 Figure 7b - Total amount of Ag (µg/g dry w.) accumulated in crayfish muscle tissue in AgNO3 treatments as determined by GFAAS measurements. The bar graphs represent Ag content mean ±SD of three measurements ..................VI-28 Figure 7c - Total amount of Ag (µg/g dry w.) accumulated in crayfish muscle tissue in AgNP treatments as determined by GFAAS measurements. The bar graphs represent Ag content mean ±SD of three measurements ..................VI-29 Figure 8 - Hypothetical dose response to illustrate a nonconventional dose response .............................................................................................................VI-30
VI - 5
INTRODUCTION
The use of nanotechnology has grown dramatically in commercial, industrial,
medical, and consumer products in the last decade. The National Science and Technology
Council in 2001 defined the scale of nanotechnology as atomic, molecular or
macromolecular levels in the range of ~ 1 – 100 nanometers (Hornyak et al. 2009). The
National Nanotechnology Initiative, established in 2001, led to public funding for
nanoparticle (NP) research in the United States to develop new material applications and
to investigate new commercial applications for NP antimicrobial capability (Ahamed et
al. 2008). Metal oxide NPs currently have wide industrial applications in photocatalytic
water purification systems (Hagfeldt and Graetzel 1995), solar cells (Usui et al. 2004),
electronics, and many everyday products such as sunscreens and cosmetics. NPs also
have exceptionally desirable biological, fungicidal, bacteriological, and algicidal
properties. Today, development of a NP application is frequently considered an
advancement of modern science.
Silver nanoparticles (AgNPs) have recently received broad attention for their
growing role in biotechnology and life science. Among 580 consumer nanotechnology-
based products, the most common material mentioned in product descriptions is silver-
based nanoparticles (Woodrow Wilson Center 2007; Henig 2007). AgNPs have a large
surface area relative to their volume and, as a result of their size, easily interact with other
particles (Ying 2001). AgNPs are used to technologically enhance products such as
bandages, clothing, cosmetics, food, and toys (Woodrow Wilson Center 2007; Henig
2007). The antibacterial effect of AgNPs has brought about their extensive use in health,
electronic, and home goods. Recently, AgNPs have been used in the production of
VI - 6
clothing and food products to reduce bacterial growth (Chau et al. 2007; Vigneshwaran et
al. 2007). AgNPs are used as an antimicrobial agent in consumer goods such as
disinfectants, deodorants, toothpaste, shampoo, and humidifiers (Woodrow Wilson
Center 2007; Henig 2007). AgNPs are proven to be very effective bacterial filters. It has
been suggested that AgNPs be added to aquaculture systems for use as anti-bacterial and
anti-fungal agents in wastewater treatment plants. However, researchers have found that
nanoparticles also eliminate helpful bacteria that remove ammonia, and lethal toxicity
levels of NPs are still under debate (Choi and Hu 2008).
AgNPs are also of interest to defense and engineering programs for new material
applications (Ringer and Ratinac 2004). There is a potential for AgNPs to be an
ingredient in the treatment of diseases that need constant drug concentration in the blood
or to target specific cells or organs (Moghimi et al. 2001; Panyam and Labhasetwar
2003). In vitro tests have shown that AgNPs can be used to inhibit binding of the HIV-1
virus to host cells (Ahamed et al. 2008; Elechiguerra et al. 2005). Medicinally,
antimicrobial activity of AgNPs has been used to reduce infections in burn treatment
(Kim et al. 2007; Ulkur et al. 2005) and to reduce the risk of infection by treating the
surface of catheters (Samuel and Guggenbichler 2004), prostheses (Gosheger et al. 2004),
and human skin (Paddle-Ledinek et al. 2006).
Regardless of the prevalent application of AgNPs, there is a lack of information
relating to their toxicity at the organismal, cellular, and molecular level (Ahamed et al.
2008). The concentrations at which AgNPs become toxic are currently being determined.
Mnyusiwalla et al. (2003) expressed concern that NPs could have potentially adverse
effects on human health and the environment. The high surface to volume ratio gives NPs
VI - 7
catalytic qualities, and their size allows them to pass through cell membranes with
currently unknown biological effects (The Center for Food Safety 2006).
Sung et al. (2008) conducted an extensive study on inhalation exposure of AgNPs
using Sprague-Dawley strain rats. Histopathological examinations indicated that
inflammatory cell infiltrate, chronic alveolar inflammation, and small granulomatous
lesions were proportionally correlated to AgNP dose. The exposure influenced minimal
bile-duct hyperplasia in males and females, chronic alveolar inflammation and
macrophage accumulation in the lungs of males and females, and erythrocyte aggregation
in females. However, the authors of the study reported that an exposure level of 100
µg/m3 had no adverse effect on experimental animals, which was consistent with the
American Council of Government Industrial Hygienists silver dust threshold limit value
(TLV).
In studies on mammal germ line stem cells, AgNPs have been shown to decrease
mitochondrial activity and increase membrane leakage. In addition, AgNPs were found to
increase the creation of reactive oxygen species (ROS), reduce antioxidant activity of
glutathione (GSH), and diminish mitochondrial function in Buffalo rat liver (BRL-3A)
cells (Ahamed et al. 2008; Braydich-Stolle et al. 2005; Hussain et al. 2005). Studies were
done to observe DNA damage in response to polysaccharide surface functionalized
(coated) and non-functionalized (uncoated) AgNPs in two types of mammalian cells,
including mouse embryonic stem (mES) cells and mouse embryonic fibroblasts (MEF)
(Ahamed et al. 2008). The experiment showed more severe damage in coated AgNPs,
suggesting that genotoxicity may be affected by different AgNP surface chemistry
(Ahamed et al. 2008).
VI - 8
Another experiment on AgNPs studied the lipid-based dispersion of NPs,
sometimes helpful in reducing nanoparticle toxicity and in developing therapeutic agents
(Bothun 2008). Accommodation of large hydrophobic NPs in lipid bilayers was
confirmed. It appears that this is done by distortion of lipid bilayers relative to the
thickness of the bilayer (Bothun 2008).
Blood hematology and biochemistry were analyzed and the results found
significant dose-dependent changes on alkaline phosphates and cholesterol values for
both male and female rats, implying slight liver damage from AgNP inhalation exposures
of more than 300 mg (Kim et al. 2007). The study showed accumulation of AgNPs was
more significant in female kidneys than in male kidneys. Conclusions were made that
prolonged AgNP inhalation exposure would significantly increase the occurrence of lung
inflammation, at much lower mass dose concentrations, when compared to
submicrometer particles (Sung et al. 2008).
The safety of NP topical use has also become of great interest. There is very little
known about their potential to penetrate the skin. Larese et al. (2009) evaluated in vitro
skin penetration of AgNPs coated with polyvinylpirrolidone (PVP). The experiments
were done using the Franz diffusion cell method with intact and damaged human skin.
AgNP absorption through intact and damaged skin was detectable by electron
microscopy in the stratum corneum and the outermost surface of the epidermis (Larese et
al. 2009).
The very limited knowledge on toxicological risk assessment of engineered NPs
to biological systems raises public and scientific concern. Questions regarding NPs
associated with commonly used nanotechnology, particularly how much eventually enters
VI - 9
the environment, remain unanswered. Of even greater concern, and poorly understood, is
the potential effect on human health and the fate of nanomaterials in terrestrial and
aquatic environments (Hornyak et al. 2009). Since there are no existing methods for
removal of AgNPs from wastewater effluents (Hornyak et al. 2009), it is especially
urgent to learn how much silver (Ag) from colloidal AgNP suspensions is being
introduced into waterways.
The purpose of this project was to study the effect of AgNP exposure on an aquatic
animal, using crayfish (Orconectes virilis) as experimental model. Crayfish is a common
inhabitant of the Hudson River Watershed and known not to tolerate polluted water. In
this study, crayfish were exposed to varying levels of colloidal AgNPs in Hudson River
water culture media to test the hypothesis that exposure would be correlated with
bioaccumulation of Ag in animal tissues, pathological changes, and DNA damage. An
additional control group of caged crayfish was placed directly in the Hudson River (river
control) during the experimental period to compare laboratory findings with a natural
environment.
METHODS
Experimental Organism
The crayfish (Orconectes virilis), a common inhabitant of the Hudson River and
its tributaries, was chosen as the experimental organism because it lives in the sediment
where most pollutants accumulate. The stock used in the experiment consisted of crayfish
specimens purchased from Northeastern Aquatics in Rhinebeck, NY.
VI - 10
Hudson River Water Dechlorination and Filtration
The aquaria were filled with 20 L of raw, unfiltered Hudson River water. Upon
trial tests of the addition of AgNO3, NaBH4, and AgNP, the AgNO3 water became light
pink which progressed to red and eventually black. The CRC Handbook of Chemistry
and Physics was consulted, and it was determined that the coloration was due to the
formation of the chemical, AgCl. A colormetric test was conducted on untreated Hudson
River water, and free Cl was found to be 0.070mg\L. It turns out that the Marist College
River Lab is located approximately 300 yards down river from the Poughkeepsie Water
Treatment Plant, the apparent source of the chlorine. Due to AgNO3's high reactivity, all
water used in the experiment was allowed to dechlorinate for one week. A separate
aquarium was completely filled with raw Hudson River water to serve as a fresh supply
of dechlorinated water to keep each tank’s water level at 20 L. The contents of the tanks
were filtered during the declorination period with a Lee’s Economy Corner Filter filled
with filter floss for particulates only. Filter floss was replaced on the second, fourth, and
seventh days. Due to its highly absorptive nature and ability to remove metals, activated
charcoal filters were avoided in the experiment (Bansal and Goyal 2005). The filters were
powered using Tetra Whisper aquarium tank air pumps.
Aquaria Preparation
After the declorination period, three cups of quarter inch aquarium stone were
placed on the bottom as substrate. Three five-inch pieces of 2 in. diameter PVC cut in
half lengthwise were placed on the substrate as a shelter for the crayfish.
VI - 11
Crayfish Acclimation
Upon arrival, three experimental organisms were placed in each tank and allowed
to acclimate to the laboratory and Hudson River conditions for one week. From the 120
crayfish purchased, 96 specimens were chosen at random, while at the same time trying
to obtain organisms of relatively the same age and size. Crayfish were fed dry cat food
(one piece per organism). Any excess food was immediately removed from the aquarium.
No ammonia filtration was required due to the low amount of liquid waste produced by
the crayfish and the short, ten day exposure time.
Nanoparticle Synthesis
During the acclimation period, the AgNPs were synthesized. A slightly modified
Creighton method of AgNP synthesis was used for the experiment (Creighton and Eadon
1991). AgNPs were synthesized through the chemical reduction of silver nitrate (AgNO3)
using sodium borohydride (NaBH4) as a reducing agent. AgNPs are an aggregation of
elemental Ag that forms together in a spherical structure, each structure from 1 to 100
nm. An AgNO3 solution (3.4 mg in 20 ml deionized water) cooled to approximately 10°C
Table 1. The schematic of compound amounts used in the synthesis of colloidal AgNPs and AgNP concentrations obtained in the process of synthesis.
3 6 11 0.225 mg/L NaBH4 6 12 0.340 mg/L NaBH4 6 13 0.450 mg/L NaBH4 6 Hudson River Control
14 Cages suspended directly in Hudson River 6
1100 ppm concentration of AgNP was determined in the experiments as LD50 (lethal dose to 50% of chick embryos in earlier preliminary experiments conducted at Marist College)
2 AgNO3 control concentrations were based on concentration of Ag ion, see: Synthesis of Silver Nanoparticles (AgNPs) and Controls. 3 NaBH4 control concentrations based on B (boron) ion, see: Synthesis of Silver Nanoparticles (AgNPs) and Controls.
Gross and Behavioral Observations
VI - 14
The lab specimens were checked for responsiveness to a threat and to food. A
piece of sinking wafer food was broken in half and dropped in front of each crayfish.
Responsiveness was gauged not by whether or not the food was immediately eaten, but
rather by the movement of the mouth. If the mouth appendages began to flutter when
food was placed in the tank, they were said to be responsive to food. Fear response was
gauged by poking a 12 inch glass stirring rod at the crayfish. If the specimen flipped its
tail quickly in a manner similar to escape, they were said to be responsive to fear. Each
day the tanks were refilled to the 20 L mark and the specimens were fed and checked for
any change in behavior or for death. Any dead organism found within the acclimation
period was replaced. Organisms that died after the treatments were administered were
removed from the tank and not processed in the results. The replacement crayfish were
weighed before being placed into the tank. On the final day of the exposure period all
crayfish were again weighed using the same method as with the initial weights.
Tissue Sampling
The experiment was terminated on the 10th day of exposure. On the morning of
harvest, all crayfish were put into bags labeled according to their tank and treatment and
placed on ice for 1 minute to anesthetize them. A specimen was removed from a bag and
surgically decapitated within 5-10 seconds to avoid major stress. The organs harvested
included: brain, gills, liver, green gland, nerve ganglia, heart, and tail muscle. Samples of
brain and liver chosen at random were immediately processed and analyzed for DNA
damage. Samples of liver, green glands, and tail muscles were placed in a drying oven at
80oC for chemical analysis of Ag content.
VI - 15
DNA Analysis by Single Gel Electrophoresis (Comet Assay)
At the time of dissection, one brain and one liver sample per tank (two per
treatment) were immediately processed for DNA damage. The tissue was minced in a 20
mM solution of EDTA in PBS to release cell nuclei. Minced tissue was placed in fresh
solution of 20 mM EDTA and centrifuged for eight minutes. Ten microliters of
supernatant was drawn off immediately above the pellet. This was mixed with 90 μl of
low melting agar. The 100 μl solution was placed on a pre-treated comet assay slide
(Trevigen®). The slide was placed in an alkaline solution of pH 13 to unwind the DNA
for 30 minutes. Slides were then placed in CometAssay™ Electrophoresis System
(Trevigen®) in electrophoresis buffer (pH >13) and was carried out for 30 minutes. After
this time, the slides were placed in 70% alcohol for five minutes and allowed to air dry
overnight. Extracted DNA on the slides was stained with SYBR-green™, which emits
fluorescent light within the 425-500 nm region. The slides were analyzed under a
mercury lit epifluorescent microscope. A Magnafire SP Digital Camera was used to take
pictures of comets viewed with the microscope. Length of DNA (comet) migration was
measured using Image-Pro® Plus software. All nuclei and their comets on the slides were
measured (~50). Distribution of DNA between the tail and head of the comet was used to
evaluate the degree of DNA damage. Measurements were recorded on nuclei with clearly
defined tail boundaries.
Atomic Absorption Analysis
Samples of muscle, liver, and green gland tissue were oven dried for 72 hours at
80°C. The tissue was ground to a fine powder using mortar and pestle, and samples were
weighted to obtain ~0.1g.
VI - 16
In preparation for chemical digestion, tissues were placed in an Xpress vessel
with 5 ml of high purity nitric acid (Fisher Scientific, Optima Grade). Chemical digestion
was performed using the MARS Xpress microwave (CEM). The process parameters were
set to 180 °C operating temperature, 80 watts, ten minute ramp to temperature, and ten
minute run time. The digestion program was run for 30 minutes.
Silver content analyses were conducted via atomic absorption (AA) spectrometry
using a ThermoElemental Solaar M5 atomic spectrophotometer in graphite furnace mode
(GFAAS). Reference 1.0 ppm Ag standard was prepared using a 1.0 x 10³ ppm Ag
solution purchased from Fisher Scientific (Lot # CL4-132AG) and certified by SPEX
CertiPrep. The absorption wavelength of Ag was 328.1 nm, and the temperature was
2500°C. Ag concentrations were established through external calibration standards using
a least squares fit regression curve. Results given by the AA computer output were in
units of µg/L. Calculations were made to determine the Ag content in the 1 g dry weight
of the sample [g (AgNP)/g tissue].
Trace levels of Ag in NaBH4 treatment samples was observed. It was determined that the
NPs persisted in the nalgene cuvettes after the digestion process. Ag contamination was
essentially eliminated by rinsing cuvettes twice with 5 ml of 50% HNO3, then
microwaving the empty cuvettes. Cuvettes were then rinsed twice with deionized water.
Statistical Analysis
The SPSS (ver. 16.0, 2007) statistical package was used to analyze data collected
on comet tail length (DNA damage) and Ag content in the tissue. Analyses of AgNP
accumulation for the different treatment concentrations in the liver, green gland, and
muscle tissue were also performed. Analysis of variance (ANOVA) followed by the
VI - 17
Student-Newman-Keuls multiple comparison procedure was used to conclude the
variation in comet tail length and accumulation of Ag levels at probability level α ≤ 0.05.
RESULTS
Crayfish Mortality
Figure 1 represents the mortality of crayfish exposed to different treatments. The
highest mortality was observed in AgNO3 treatments. A total of 10 crayfish died in
AgNO3 treatments, three crayfish died in AgNP treatment exposures, one died in the
NaBH4 treatments, and one in the laboratory control treatment. No deaths occurred in the
river control.
Figure 1. Mortality of crayfish in different experimental treatments. The bar graphs represent total number of organisms that died during treatment exposure. The values were obtained by pooling all the organisms that died at specific concentrations. All deaths were recorded after treatments were administered.
VI - 18
Table 3. Average weight loss of crayfish in different experimental exposures. The values in the table represent average measurements of all 6 organisms per treatment recorded at the beginning of the experiment (June 20) and compared to the weight at the end of the experiment (June 30).
Our observations revealed that crayfish in AgNP demonstrated the largest change
in weight (Table 3).
Behavioral Changes
Recorded visual observations and external stimuli showed the crayfish in the
AgNO3 became very lethargic and unresponsive to both food and threat. Organisms in the
NaBH4 sporadically would not respond to food, but always to threat. Organisms treated
with AgNP remained responsive to food and threat throughout the experiment.
DNA Analysis
Brain: Results of exposure to treatments, AgNP and the paternal materials AgNO3
and NaBH4, are represented in Figures 2, 3 and 4. All figures show the statistically
significant difference in DNA damage between the river control and the laboratory (lab)
control as measured by DNA migration (comet tail length). DNA damage was not
observed in the river control samples.
As shown in Figure 2, the extent of DNA migration in the AgNP treatments
increased significantly in all concentrations in comparison to the controls (α ≤ 0.05).
There was no statistically significant difference in comet tail length between the 0.05,
VI - 19
0.107, and 0.214 AgNP treatment concentrations; however, comet tail length in the 0.16
mg/L AgNP treatment concentration increased significantly when compared to the other
three AgNP treatment concentrations (α ≤ 0.05). Comet length in the 0.16 mg/L AgNP
treatment concentration increased 46% in comparison to the lab control.
Figure 2. AgNP induced DNA damage in crayfish brain tissues expressed as length of DNA comet tail. The bar graphs represent comet length means ±SD of ~50 nuclei per sample from each specimen. Columns with different letters (a, b, c, d ) are significantly different at probability level α ≤ 0.05 as determined by multiple comparison test Student-Newman-Keuls (SPSS 16.0).
Figure 3 shows that when comparing the AgNO3 treatments to the lab control,
there was a statistically significant difference between the comet tail lengths measured in
the 0.085, 0.17, and 0.34 mg/L treatments (α ≤ 0.05). However, comet tail lengths in the
0.27 mg/L AgNO3 treatment were not significantly different to those measured in lab
control or to the other three AgNO3 treatments.
As shown in Figure 4, there was a statistically significant increase in comet tail
length when comparing the lab control to the 0.115 and 0.225 mg/L NaBH4 treatments;
however, there was no significant difference between those two NaBH4 treatments. DNA
VI - 20
damage in the 0.34 and 0.45 concentrations was too extensive and the resulting comet tail
was too diffuse for an image to be measured by the Image-Pro® Plus software.
Figure 3. AgNO3 induced DNA damage in crayfish brain tissues expressed as length of DNA comet tail. The bar graphs represent comet length means ±SD of ~50 nuclei per sample from each specimen. Columns with different letters (a, b, c, d ) are significantly different at probability level α ≤ 0.05 as determined by multiple comparison test Student-Newman-Keuls (SPSS 16.0).
Figure 4. NaBH4 induced DNA damage in crayfish brain tissues expressed as length of DNA comet tail. The bar graphs represent comet length means ±SD are average length of ~50 nuclei per sample from each specimen. Columns with different letters (a, b, c ) are significantly different at probability level α ≤ 0.05 as determined by multiple comparison test Student-Newman-Keuls (SPSS 16.0). Measurements in the NA concentrations were immeasurable with available equipment because of extreme dispersal of DNA.
VI - 21
Atomic Absorbtion Analysis
The results of atomic absorption analysis of Ag content in liver, green gland, and
muscle tissues are shown in Figures 5a, 5b, 5c, 6a, 6b, 6c, 7a, 7b, and 7c. Each sample
was measured three times, and the absorbance values were averaged before extrapolating
the Ag concentration from the calibration curve. Calibrations were performed using acid-
matched standard solutions of Silver Standard. Metal concentrations were determined
through external calibration, with standards using least-squares fit of regression curves.
Chemical analysis of the liver, green gland, and muscle tissues in river control specimens
did not detect any presence of Ag.
Liver: Figures 5a-5c represent the Ag content determined in crayfish liver
samples. The figures show that there was no statistically significant difference in Ag
content detected in lab control tissue samples when compared to river control samples.
Figure 5a illustrates results from the NaBH4 treatments. There was a trace amount
of Ag detected in liver tissue in the highest concentration, 0.214 mg/L, although no Ag
was in the treatment. The amount of Ag in NaBH4 could be the result of contamination
during tissue processing.
Figure 5b presents Ag content in liver tissue in the AgNO3 treatments. There was
statistically significant accumulation of Ag in the liver tissue in the lowest (0.085 mg/L)
and the highest (0.34 mg/L) AgNO3 treatments when compared to the controls and
remaining treatments (α ≤ 0.05). There was no significant difference in Ag accumulation
between the river control, lab control, 0.17 mg/L, and 0.27 mg/L treatments. In addition,
there was a statistically significant difference in Ag accumulation in the 0.34 mg/L
concentration treatment when compared to the 0.085 mg/L treatment concentration.
VI - 22
Figure 5a. Total amount of Ag (µg/g dry w.) accumulated in crayfish liver tissue in NaBH4 treatments as determined by GFAAS measurements. The bar graphs represent Ag content means ±SD of three measurements. Columns with different letters (a, b ) are significantly different at probability level α ≤ 0.05 as determined by multiple comparison test Student-Newman-Keuls (SPSS 16.0).
Figure 5b. Total amount of Ag (µg/g dry w.) accumulated in crayfish liver tissue in AgNO3 treatments as determined by GFAAS measurements. The bar graphs represent Ag content means ±SD of three measurements. Columns with different letters (a, b, c ) are significantly different at probability level α ≤ 0.05 as determined by multiple comparison test Student-Newman-Keuls (SPSS 16.0).
Atomic absorbtion analysis demonstrated increasing Ag accumulation in the
crayfish liver tissues with increasing AgNP treatment concentration (Figure 5c). The
VI - 23
accumulation was not statistically significant for the 0.05 mg/L AgNP treatment
concentration when compared to the river and lab controls (α ≤ 0.05); however, Ag
accumulation was statistically significant for the 0.107, 0.16, and 0.214 mg/L
concentration treatments. Additionally, each AgNP treatment demonstrated statistically
significant accumulation results when compared to the other three AgNP treatments.
Figure 5c. Total amount of Ag (µg/g dry w.) accumulated in crayfish liver tissue in AgNP treatments as determined by GFAAS measurements. The bar graphs represent Ag content means ±SD of three measurements. Columns with different letters (a, b, c, d ) are significantly different at probability level α ≤ 0.05 as determined by multiple comparison test Student-Newman-Keuls (SPSS 16.0). Green Gland: Figures 6a-6c represent Ag content in the crayfish green gland
tissues. The pair of kidney-like green glands play a very important excretory function.
The figures show that there was a statistically significant difference in Ag content
detected in lab control samples when compared to river control samples.
Figure 6a shows that there was Ag present in the green glands of crayfish in the
NaBH4 treatments. It may be that accumulation of Ag in these treatments resulted from
sample contamination.
VI - 24
Figure 6a. Total amount of Ag (µg/g dry w.) accumulated in crayfish green gland tissue in NaBH4 treatments as determined by GFAAS measurements. The bar graphs represent Ag content means ±SD of three measurements. Columns with different letters (a, b,c,d,e ) are significantly different at probability level α ≤ 0.05 as determined by multiple comparison test Student-Newman-Keuls (SPSS 16.0). Each value is the mean of three measurements.
As can be seen in Figure 6b, the AgNO3 treatments demonstrated statistically
significant differences in Ag content in the 0.085, 0.27, and 0.34 mg/L concentration
treatments when compared to the river control (α ≤ 0.05). No statistically significant
difference was found between the lab control and the 0.27 mg/L concentration treatment.
Additionally, each AgNO3 treatment demonstrated statistically significant accumulation
results when compared to the other three AgNO3 treatments.
VI - 25
Figure 6b. Total amount of Ag (µg/g dry w.) accumulated in crayfish green gland tissue in AgNO3 treatments as determined by GFAAS measurements. The bar graphs represent Ag content means ±SD of three measurements. Columns with different letters (a, b, c, d ) are significantly different at probability level α ≤ 0.05 as determined by multiple comparison test Student-Newman-Keuls (SPSS 16.0). Each value is the mean of three measurements.
Figure 6c. Total amount of Ag (µg/g dry w.) accumulated in crayfish green gland tissue in AgNP treatments as determined by GFAAS measurements. The bar graphs represent Ag content means ±SD of three measurements. Columns with different letters (a, b, c, d, e, f ) are significantly different at probability level α ≤ 0.05 as determined by multiple comparison test Student-Newman-Keuls (SPSS 16.0). Each value is the mean of three measurements.
VI - 26
Figure 6c shows statistically significant different Ag content levels in all AgNP
treatments when compared to river control and lab (α ≤ 0.05). Additionally, each AgNP
treatment demonstrated statistically significant accumulation results when compared to
the other three AgNP treatments.
Muscle: Figures 7a-7c represent Ag accumulation in the crayfish tail muscle. The
figures show that there was a statistically significant difference in Ag content detected in
lab control tissue samples when compared to river control samples. A trace amount of
silver was detected in the NaBH4 treatments (Figure 7a), which may be attributed to
contamination.
Figure 7a. Total amount of Ag (µg/g dry w.) accumulated in crayfish muscle tissue in NaBH4 treatments as determined by GFAAS measurements. The bar graphs represent Ag content means ±SD of three measurements. Columns with different letters (a, b, c ) are significantly different at probability level α ≤ 0.05 as determined by multiple comparison test Student-Newman-Keuls (SPSS 16.0). Each value is the mean of three measurements.
It can be seen in Figure 7b that all AgNO3 treatments demonstrated statistically
significant differences in Ag content when compared to the river control (α ≤ 0.05). No
significant difference was found between the lab control and the 0.085 mg/L
VI - 27
concentration treatment. Additionally, each AgNO3 treatment demonstrated statistically
significant accumulation results when compared to the other three AgNO3 treatments.
Figure 7b. Total amount of Ag (µg/g dry w.) accumulated in crayfish muscle tissue in AgNO3 treatments as determined by GFAAS measurements. The bar graphs represent Ag content means ±SD of three measurements. Columns with different letters (a, b, c, d, e ) are significantly different at probability level α ≤ 0.05 as determined by multiple comparison test Student-Newman-Keuls (SPSS 16.0). Each value is the mean of three measurements. Figure 7c shows significantly different Ag content levels in all AgNP treatments
when compared to river control (α ≤ 0.05). No significant difference was found between
the lab control and the 0.115 mg/L concentration treatment. Additionally, each AgNP
treatment demonstrated statistically significant accumulation results when compared to
the other three AgNP treatments.
VI - 28
Figure 7c. Total amount of Ag (µg/g dry w.) accumulated in crayfish muscle tissue in AgNP treatments as determined by GFAAS measurements. The bar graphs represent Ag content means ±SD of three measurements. Columns with different letters (a, b, c, d, e ) are significantly different at probability level α ≤ 0.05 as determined by multiple comparison test Student-Newman-Keuls (SPSS 16.0). Each value is the mean of three measurements.
DISCUSSION
The results of the comet assay (Figures 5a, 5b, and 5c) show DNA damage in
brain nuclei of all treatments. In recent years comet assay has become a standard and
reliable method for assessing DNA damage in the biological systems of animals, plants,
and humans. The principle of this method, based on single cell gel elecrophoresis, allows
for detection of single and double DNA strand breakage (Frenzilli et al. 2006). DNA
damage detected in our study on crayfish brain tissue exposed to AgNPs suggests that a
similar response could be expected in other living organisms. The observed dose
response to all experimental treatments seems to follow a nonconventional dose response.
Hodgson (2004) suggests that low doses of chemical exposure stimulate a physiological
response that can offset adverse effects. This compensatory response is observed as an
effect opposite to toxic response at a higher levels of chemical exposure. At thereshold
dose, organisms respond with increased stimulation and overcompensation of toxic effect
VI - 29
demonstrated as a return to the zero response level or decrease in toxic effect. Continuing
increased exposure levels overcome the organism’s defence ability at the “pseudo”
threshold level. In this study, the crayfish body’s natural defenses seemed to block toxin
uptake as exposure increased and less damage was observed, shown as hormesis in
Figure 8. After a certain point, increased treatment exposure concentrations demonstrate
the typical dose response to the toxicant, shown graphically as the near linear trend
upwards. It is the pseudothreshold that is often mistaken as the actual threshold.
Figure 8. Hypothetical dose response to illustrate a nonconventional dose response.
The treatments resulted in the most damage to brain DNA. Figure 4 is lacking the two
highest concentrations responses because the photographs taken of the slides showed
either nuclei or DNA comets, but not both. The damage was so great that it was not
possible to measure damage at those concentrations. Hyeon-Jin et al. (2009) considers
NaBH4 as an effective reducing agent. In the synthesis of AgNPs for this experiment,
NaBH4was used as reducing agent to react with AgNO3. Unfortunately there is no
literature on the ecological toxicity of NaBH4. There is, however, a large body of
VI - 30
information on toxicity of the other synthesis component, AgNO3, on aquatic (Bianchini
and Wood 2003) and terrestrial (Pelkonen et al. 2003) organisms.
Data collected in this study demonstrated that the synthesis components of AgNPs
are very toxic given the mortality of crayfish in the AgNO3 treatments (Figure 1), and
cause extensive DNA damage (Figures 3 and 4). Jayabalan et al. (2008) has documented
that AgNPs in colloidal solution can deaggregate to form the parental compounds.
Toxicity of AgNPs in this experiment may also be attributed to the partial deaggregation
of AgNPs in the experimental treatments.
Accumulation of Ag in the experimental organisms did not show any specific
trend in the AgNO3 treatments and was observed at minimal levels in the NaBH4
treatments. The accumulation of Ag among the AgNP concentrations, however, shows an
increase in Ag with increasing treatment concentration, suggesting that as nanoparticle
concentration increases the uptake into the organs also increases. Bothun (2008) found
that nanoparticles could freely pass through barriers in the body. The DNA damage found
in the crayfish neural tissue of our experimental samples supports those findings.
CONCLUSION AND RECOMMENDATIONS
There is a clear trend of Ag accumulation found in the AgNP treatments. The near
linear fit suggests that increased exposure leads to increased absorption. It is also clear
that the organisms exposed to these nanoparticles showed no outward behavioral changes
but were undergoing widespread DNA damage. This can be of concern to humans
because extensive DNA damage can be occurring while no apparent effect is being
observed.
VI - 31
It is of vital importance both to aquatic organisms and to humans that these
materials be studied further. This experiment mirrors others in its findings that AgNPs
cause DNA damage. Production of consumer goods containing this product should be
placed on hold so more research can be done and the Environmental Protection Agency
and the Department of Health and Human Services can issue regulations halting future
exposure.
VI - 32
ACKNOWLEDGEMENTS
I would like express my appreciation to the Hudson River Foundation and the
Tibor T. Polgar Fellowship Committee for the opportunity to conduct this research and
for their support. Completion of this research would not have been possible without the
supervision and mentorship of Dr. Zofia Gagnon, and I extend my sincere thanks for all
her knowledge, expertise, time, and efforts. I would also like to acknowledge Dr. Neil
Fitzgerald for his expertise and support and for providing access to the River Lab and to
Marist College School of Science instrumentation. I also express thanks to my peers
Anne Quach, Rachel Serafin, and Seth Brittle for their assistance during the research
process.
VI - 33
LITERATURE CITED
Ahamed, M., M. Karns, M. Goodson, J. Rowe, S.M. Hussain, J.J. Schlager, and Y. Hong. 2008. DNA damage response to different surface chemistry of silver nanoparticles in mammalian cells. Toxicology and Applied Pharmacology 233: 404-410.
Bansal, R.C. and M. Goyal. 2005. Activated Charcoal Adsorption. Taylor and Francis,
Boca Raton, FL. Bianchini, A. and C.M. Wood. 2003. Mechanism of acute silver toxicity in Daphnia
magna. Environmental Toxicology and Chemistry 22: 1361-1367. Bothun, G.D. 2008. Hydrophobic silver nanoparticles trapped in lipid blazers: size
distribution, bilayer phase behavior, and optical properties. Journal of Nanobiotechnology 6:13, 10 pp.
Braydich-Stolle, L., S.M. Hussain, J.J. Schlager, and M.C. Hoffman. 2005. In vitro
cytotoxicity of nanoparticles in mammalian germline stem cells. Toxicological Sciences 88: 412-419.
Chau, C.F., S.H. Wu, and G.C. Yen. 2007. The development of regulations for food
nanotechnology. Trends in Food Science Technology 18: 269-280. Choi, O. and Z. Hu. 2008. Size dependent and reactive oxygen species related nanosilver
toxicity to nitrifying bacteria. Environmental Science & Technology 42: 4583-4588.
Creighton, J.A. and D.G. Eadon. 1991. Ultraviolet-visible absorption spectra of the
colloidal spectra elements. Journal of the Chemical Society, Faraday Transaction 87: 3881-3892.
Elechiguerra, J.L., J. Burt, J.R. Morones, A. Camacho-Bragado, X. Gao, H.H. Lara, and
M.J. Yacaman. 2005. Interaction of silver nanoparticles with HIV-1. Journal of Nanobiotechnology 3: 6. doi:10.1186/1477-3155-3-6
Frenzilli, G., V. Scarcell, F. Fornal, A. Paparelli, and M. Nigro. 2006. The comet assay as
a method of assessement of neurotoxicity. Annals of the New York Academy of Science 1074: 478-480.
Gosheger, G., J. Hardes, H. Ahrens, A. Streitburger, H. Buerger, M. Erren, A. Gunsel,
F.H. Kemper, W. Winkleman, and C. von Eiff. (2004). Silver-coated megaendoprostheses in a rabbit model—an analysis of the infection rate and toxicological side effects. Biomaterials 25: 5547–5556.
Hagfeldt, A. and M. Graetzel. 1995. Light-induced redox reactions in nanocrystalline
systems. Chemical Reviews 95(1): 49–68. doi: 10.1021/cr00033a003.
VI - 34
Henig, R.M. Our silver-coated future. OnEarth September 1, 2007: 22–29. Hodgson, E. 2004. A Textbook of Modern Toxicology. Wiley-Interscience, Hoboken,
NJ. Hornyak, G.L., H.F. Tibbals, J. Dutta, and J.J. Moore. 2009. Introduction to Nanoscience
and Nanotechnology. CRC Press, Boca Raton, FL. Hussain, S.M., K.L. Hess, J.M. Gearhart, K.T. Geiss, and J.J. Schlager. 2005. In vitro
toxicity of nanoparticles in BRL, 3A rat liver cells. Toxicology in Vitro 19: 975-983.
Hyeon-Jin, S., K.K. Kim, A. Benayad, S. Yoon, K.P. Hyeon, I. Jung, M.H. Jin, H.K.
Jeong, J. Kim, J. Choi, and Y.H. Lee. 2009. Efficient reduction of graphite oxide by sodium borohydride and its effect on electrical conductance. Advanced Functional Materials 19: 1987–1992.
Jayabalan, J., A. Singh, R. Chari, H. Srivastava, P.K. Mukhopadhyay, A.K. Srivastava,
and S.M. Oak. 2008. Aggregated nanoplatelets: optical properties and optically induced disaggregation. Journal of Physics: Condensed Matter 20(44). doi: 10.1088/0953-8984/20/44/445222.
Kim, J.S., E. Kuk, K.N. Yu, J.H. Kim, S.J. Park, H.J. Lee, S.H. Kim, Y.K. Park, Y.H.
Park, C.Y. Hwang, Y.K. Kim, Y.S. Lee, D.H. Jeong, and M.H. Cho. 2007. Antimicrobial effects of silver nanoparticles. Nanomedicine 3: 95–101.
Larese, F.F., F. D’Agostin, M. Crosera, G. Adami, N. Renzi, M. Bovenzi, and G. Maina.
2009. Human skin penetration of silver nanoparticles through intact and damaged skin. Toxicology 255: 33-37.
Mnyusiwalla, A., A.S. Daar, and P.A. Singer. 2003. ‘Mind the gap’: science and ethics in
Moghimi, S.M., A.C. Hunter, and J.C. Murray. 2001. Long-circulating and target-specific
nanoparticles: theory to practice. Pharmacological Reviews 53: 283–318. Paddle-Ledinek, J.E., Z. Nasa, and H.J. Cleland. 2006. Effect of different wound
dressings on cell viability and proliferation. Plastic and Reconstructive Surgery 117: 110S–118S.
Panyam, J. and V. Labhasetwar. 2003. Biodegradable nanoparticles for drug and gene
delivery to cells and tissue. Advanced Drug Delivery Reviews 55: 329–347.
Pelkonen, K.H., H. Heinonen-Tanski, and O.O. Hanninen. 2003. Accumulation of silver
from drinking water into cerebellum and musculus soleus in mice. Toxicology 186: 151-157.
Ringer, S.P and K.R. Ratinac. 2004. On the role of characterization in the design of
interfaces in nanoscale materials technology. Microscopy and Microanalysis 10: 324–335.
Samuel, U. and J.P. Guggenbichler. 2004. Prevention of catheter-related infections: the
potential of a new nano-silver impregnated catheter. International Journal of Antimicrobial Agents 23: 75–78.
Sung, J.H., J.H. Ji, J.U. Yoon, D.S. Kim, M.Y. Song, J. Jeong, B.S. Han, J.H. Han, Y.H.
Chung, J. Kim, T.S. Kim, H.K. Chang, E.J. Lee, J.H. Lee, and I.J. Yu. 2008. Lung function changes in Sprague-Dawley rats after prolonged inhalation exposure to silver nanoparticles. Inhalation Toxicology 20: 567-574.
The Center for Food Safety. “Nanotechnology: It’s a small (and unregulated) world after
all.” Food Safety Now! Autumn 2006. Ulkur, E., O. Oncul, H. Karagoz, E. Yeniz, and B. Celikoz. 2005. Comparison of silver-
coated dressing (Acticoat), chlorhexidine acetate 0.5% (Bactigrass), and fusidic acid 2% (Fucidin) for topical antibacterial effect in methicillin-resistant Staphylococci-contaminated, full-skin thickness rat burn wounds. Burns 31: 874–877.
Usui, H., H. Matsui, N. Tanabe, and S. Yanagida. 2004. Improved dye-sensitized solar
cells using ionic nanocomposite gel electrolytes. Journal of Photochemistry and Photobiology A: Chemistry 164: 97-101.


![The spiny-cheek crayfish, Orconectes limosus (Rafinesque ... · Decapoda: Cambaridae], digs into the UK David Holdich1* and John Black2 ... are unknown it seems likely they were intro-duced](https://static.documents.pub/doc/80x56/5fab5d6194df0a24ac21b348/the-spiny-cheek-crayfish-orconectes-limosus-rafinesque-decapoda-cambaridae.jpg)

