Ecology, 93(8), 2012, pp. 1853–1866 Ó 2012 by the Ecological Society of America Impacts of climate variability and human colonization on the vegetation of the Gala ´pagos Islands ALEJANDRA RESTREPO, 1,6 PAUL COLINVAUX, 2 MARK BUSH, 1,7 ALEXANDER CORREA-METRIO, 1,8 JESSICA CONROY, 3,9 MARK R. GARDENER, 4,10 PATRICIA JARAMILLO, 4 MIRIAM STEINITZ-KANNAN, 5 AND JONATHAN OVERPECK 3 1 Department of Biological Sciences, Florida Institute of Technology, Melbourne, Florida 32901 USA 2 Marine Biology Laboratory, Woods Hole, Massachusetts 02543 USA 3 Department of Geosciences, The University of Arizona, Tucson, Arizona 85721 USA 4 Charles Darwin Foundation, Santa Cruz, Gala ´pagos Islands, Ecuador 5 Department of Biological Sciences, Northern Kentucky University, Highland Heights, Kentucky 41099 USA Abstract. A high-resolution (2–9 year sampling interval) fossil pollen record from the Gala´pagos Islands, which spans the last 2690 years, reveals considerable ecosystem stability. Vegetation changes associated with independently derived histories of El Ni ˜ no Southern Oscillation variability provided evidence of shifts in the relative abundance of individual species rather than immigration or extinction. Droughts associated with the Medieval Climate Anomaly induced rapid ecological change that was followed by a reversion to the previous state. The paleoecological data suggested nonneutral responses to climatic forcing in this ecosystem prior to the period of human influence. Human impacts on the islands are evident in the record. A marked decline in long-term codominants of the pollen record, Alternanthera and Acalypha, produced a flora without modern analogue before 1930. Intensified animal husbandry after ca. 1930 may have induced the local extinction of Acalypha and Alternanthera. Reductions in populations of grazing animals in the 1970s and 1980s did not result in the return of the native flora, but in invasions by exotic species. After ca. 1970 the trajectory of habitat change accelerated, continuously moving the ecosystem away from the observed range of variability in the previous 2690 years toward a novel ecosystem. The last 40 years of the record also suggest unprecedented transport of lowland pollen to the uplands, consistent with intensified convection and warmer wet seasons. Key words: climate change; cloud; El Ni ˜ no; exotic invasive species; extinction; Gala ´pagos; human impact; La Ni ˜ na; paleoecology; rate of ecological change; stability. INTRODUCTION Famous for their past and present role in contributing to evolutionary theory, the Gala´ pagos owed their unique biota to geographic isolation, rarity of successful immigration, and adaptive radiation. Interisland dis- persal played vital roles in speciation (Darwin 1845, Parent et al. 2008, Losos and Ricklefs 2009), and in maintaining small populations, i.e., through the rescue effect (Brown and Kodric-Brown 1977, Grant and Grant 2008). Although major evolutionary events may have occurred on the scale of millions of years, studies have demonstrated the importance of short-term popu- lation dynamics in determining the differential survival of potential competitors, and evolutionary pressures resulting from overlapping niches (Grant et al. 2000, Wikelski and Thom 2000, Grehan 2001). Evolutionary patterns on the Gala´pagos are suggested to have been driven by increasing drought both at subdecadal scales (Grant and Grant 2006) and over millions of years (Grant and Grant 2003). The first paleoecological analysis of the Gala´pagos islands, based on sedimentary records from the crater lake of El Junco on the island of San Cristo´ bal (see Plate 1), demonstrated a history of Holocene drought (Colinvaux 1972, Colinvaux and Schofield 1976a, b). El Junco Lake was dry or ephemeral during the latter portion of the last ice age and the deglacial period. Between 10 400 and 8600 14 C years BP the lake deepened, but another dry period occurred between ca. 8600 and 3000 14 C years BP. (Hereafter all ages are expressed in calibrated 14 C years as BC/AD.) After ca. 1300 BC a deeper lake formed at El Junco (Colinvaux Manuscript received 23 August 2011; revised 9 January 2012; accepted 24 January 2012; final version received 18 March 2012. Corresponding Editor: F. S. Hu. 6 Present address: Center of Tropical Paleoecology and Archaeology, Smithsonian Tropical Research Institute, Box 0843-03092, Balboa, Ancon, Republic of Panama´. 7 Corresponding author: E-mail: mbush@fit.edu 8 Present address: Instituto de Geologı´a, Universidad Nacional Auto´ noma de Me´xico, Mexico, D.F. 04510 Me´ xico. 9 Present address: School of Earth and Atmospheric Sciences, Georgia Institute of Technology, Atlanta, Georgia 30332 USA. 10 Present address: Research Institute for Environment and Livelihoods, Charles Darwin University, NT 0909 Australia. 1853
Transcript
Ecology, 93(8), 2012, pp. 1853–1866� 2012 by the Ecological Society of America
Impacts of climate variability and human colonizationon the vegetation of the Galapagos Islands
ALEJANDRA RESTREPO,1,6 PAUL COLINVAUX,2 MARK BUSH,1,7 ALEXANDER CORREA-METRIO,1,8 JESSICA CONROY,3,9
MARK R. GARDENER,4,10 PATRICIA JARAMILLO,4 MIRIAM STEINITZ-KANNAN,5 AND JONATHAN OVERPECK3
1Department of Biological Sciences, Florida Institute of Technology, Melbourne, Florida 32901 USA2Marine Biology Laboratory, Woods Hole, Massachusetts 02543 USA
3Department of Geosciences, The University of Arizona, Tucson, Arizona 85721 USA4Charles Darwin Foundation, Santa Cruz, Galapagos Islands, Ecuador
5Department of Biological Sciences, Northern Kentucky University, Highland Heights, Kentucky 41099 USA
Abstract. A high-resolution (2–9 year sampling interval) fossil pollen record from theGalapagos Islands, which spans the last 2690 years, reveals considerable ecosystem stability.Vegetation changes associated with independently derived histories of El Nino SouthernOscillation variability provided evidence of shifts in the relative abundance of individualspecies rather than immigration or extinction. Droughts associated with the Medieval ClimateAnomaly induced rapid ecological change that was followed by a reversion to the previousstate. The paleoecological data suggested nonneutral responses to climatic forcing in thisecosystem prior to the period of human influence.
Human impacts on the islands are evident in the record. A marked decline in long-termcodominants of the pollen record, Alternanthera and Acalypha, produced a flora withoutmodern analogue before 1930. Intensified animal husbandry after ca. 1930 may have inducedthe local extinction of Acalypha and Alternanthera. Reductions in populations of grazinganimals in the 1970s and 1980s did not result in the return of the native flora, but in invasionsby exotic species. After ca. 1970 the trajectory of habitat change accelerated, continuouslymoving the ecosystem away from the observed range of variability in the previous 2690 yearstoward a novel ecosystem. The last 40 years of the record also suggest unprecedented transportof lowland pollen to the uplands, consistent with intensified convection and warmer wetseasons.
Key words: climate change; cloud; El Nino; exotic invasive species; extinction; Galapagos; humanimpact; La Nina; paleoecology; rate of ecological change; stability.
INTRODUCTION
Famous for their past and present role in contributing
to evolutionary theory, the Galapagos owed their
unique biota to geographic isolation, rarity of successful
immigration, and adaptive radiation. Interisland dis-
persal played vital roles in speciation (Darwin 1845,
Parent et al. 2008, Losos and Ricklefs 2009), and in
maintaining small populations, i.e., through the rescue
effect (Brown and Kodric-Brown 1977, Grant and
Grant 2008). Although major evolutionary events may
have occurred on the scale of millions of years, studies
have demonstrated the importance of short-term popu-
lation dynamics in determining the differential survival
of potential competitors, and evolutionary pressures
resulting from overlapping niches (Grant et al. 2000,
Wikelski and Thom 2000, Grehan 2001). Evolutionary
patterns on the Galapagos are suggested to have been
driven by increasing drought both at subdecadal scales
(Grant and Grant 2006) and over millions of years
(Grant and Grant 2003).
The first paleoecological analysis of the Galapagos
islands, based on sedimentary records from the crater
lake of El Junco on the island of San Cristobal (see Plate
1), demonstrated a history of Holocene drought
(Colinvaux 1972, Colinvaux and Schofield 1976a, b).
El Junco Lake was dry or ephemeral during the latter
portion of the last ice age and the deglacial period.
Between 10 400 and 8600 14C years BP the lake
deepened, but another dry period occurred between ca.
8600 and 3000 14C years BP. (Hereafter all ages are
expressed in calibrated 14C years as BC/AD.) After ca.
1300 BC a deeper lake formed at El Junco (Colinvaux
Manuscript received 23 August 2011; revised 9 January 2012;accepted 24 January 2012; final version received 18 March 2012.Corresponding Editor: F. S. Hu.
6 Present address: Center of Tropical Paleoecology andArchaeology, Smithsonian Tropical Research Institute, Box0843-03092, Balboa, Ancon, Republic of Panama.
7 Corresponding author: E-mail: [email protected] Present address: Instituto de Geologıa, Universidad
Nacional Autonoma de Mexico, Mexico, D.F. 04510 Mexico.9 Present address: School of Earth and Atmospheric
Sciences, Georgia Institute of Technology, Atlanta, Georgia30332 USA.
10 Present address: Research Institute for Environmentand Livelihoods, Charles Darwin University, NT 0909Australia.
1853
and Schofield 1976a), consistent with an intensification
of El Nino events (Steinitz-Kannan et al. 1998, Moy et
al. 2002, Riedinger et al. 2002, Rein et al. 2005). This
study presents a high-resolution late Holocene paleo-
ecological history of the island, derived from fossil
pollen analysis of the sediments of El Junco crater lake.
Compared with those seminal investigations of pollen
histories in the Galapagos, our ability to identify pollen
types has advanced considerably, and the paleoecolog-
ical and climatic questions that we pose have also
evolved. As concern over global climate change mounts,
it has become imperative to understand finer-scale
variability than that of the previous pollen record from
El Junco (Colinvaux and Schofield 1976a, b). Attention
to centennial-scale events in the last two millennia has
identified climatic changes coeval with the Medieval
Climate Anomaly (AD 800–1250; hereafter MCA) and
the Little Ice Age (AD ;1550–1880, hereafter LIA) in
coral-based paleoclimate records from the Galapagos
and Palmyra Islands (Dunbar et al. 1994, Cobb et al.
2003), in sediment chemistry from the Galapagos
(Seddon et al. 2011), in offshore cores from the Peruvian
coast (Rein et al. 2004), and in sediments from Andean
lakes (e.g., Bird et al. 2011). A prior publication based
on our diatom and pollen data from the El Junco core
record suggests a heterogeneous climate during the
MCA that exhibited a warm phase followed by cooler
conditions (Conroy et al. 2009). Another finding was a
marked warming, increased precipitation, and higher
lake level over the last two centuries (Conroy et al.
2009).
Here, we provide a high-resolution palynological
record of vegetation change from the lake in the crater
of El Junco, San Cristobal, Galapagos Archipelago, in
which we seek to answer three basic questions: (1) To
what extent has climate influenced vegetation on the
Galapagos over the past 2690 years? (2) To what extent
do these highland communities exhibit ecologically
neutral responses to environmental changes? (3) Has
human perturbation of the landscape exerted a greater
or lesser effect than climatic changes?
STUDY SITE
San Cristobal is the most easterly island of the
archipelago. El Junco Crater Lake, at 679 m above sea
level (Fig. 1), is the only permanent freshwater lake on
the islands. The shield cone of the crater provides
gradual slopes from the coastal lowlands to the crater.
The crater is almost circular and has a diameter of ;320
m and a depth from the rim to the lake surface of ;10
FIG. 1. Habitat map of the Galapagos Islands (map courtesy of Mandy Trueman).
ALEJANDRA RESTREPO ET AL.1854 Ecology, Vol. 93, No. 8
m. The lake, within the crater, is almost circular, and has
a diameter of ;220 m. The lake is flat bottomed and is
often shrouded in ground-level cloud, locally termed
garua. The garua forms due to a temperature inversion
over cold, upwelled waters around the Galapagos.
Average air temperatures are ;198C, with a cool, dry
season between June and November (Trueman and
d’Ozouville 2010, Collins and Bush 2011). At this time
of year the garua is at its strongest and results in the
uplands being cloud soaked throughout the cool season,
a pattern that is enhanced during La Nina events. The
site is consistently windy, especially during the cool
season as trade winds blow from the southeast. The
south-facing slopes of San Cristobal catch moisture and
support denser vegetation than north-facing slopes. The
natural vegetation of the arid lowlands of San Cristobal
would be lowland xeric scrub dominated by cactus
(Jasminocereus thouarsii and Opuntia megasperma); the
trees Bursera graveolens, Cordia lutea, Prosopis juliflora;
and the shrubs Chamaesyce hirta, and occasionally
Gossypium darwinii. At elevations .50 m, Bursera
forests disappear, while the shrub Croton scouleri
increases in importance. Hippomane mancinella, Piscidia
carthagenensis, and Pisonia floribunda are common trees
found from coastal elevations to .100 m elevation.
Scalesia pedunculata (the endemic giant Asteraceae) and
long-lived tree Zanthoxylum fagara were documented as
the dominant species in forest at elevations between 150
and 500 m above sea level (Robinson 1902), but as a
vegetation assemblage this has since disappeared (Mau-
champ and Atkinson 2010). At the elevations above 500
m, the shrubMiconia robinsoniana and the ferns Cyathea
weatherbyana and Pteridium aquilinum remain impor-
tant components. A number of introduced species
dominate the landscape above 150 m above sea level,
notably Psidium guajava, Rubus niveus, Syzygium
jambos, and a variety of nonnative grasses.
Increased rainfall during El Nino events induced
strong flowering in lowland shrub and subshrub species
such as Croton scouleri, Lantana peduncularis, Helio-
tropium angiospermum, Chamaesyce amplexicaulis, and
C. recurva (Grant and Grant 1987, Hamann 2004).
Conversely, in the moist mid-elevations, Scalesia pedun-
culata cohorts experienced massive diebacks following
diameter was retrieved from the deepest portion (6 m
water depth) of El Junco crater lake, using a Nesje corer.
The 3.5 m long core was labeled EJ-N-1. Two mud–
water interface cores were collected within a meter of the
main core. Of the mud–water interface cores, EJ-3 was
selected for detailed analysis and subsampled at 4-mm
intervals (Conroy et al. 2008). Cores EJ-2 and EJ-3 were
cross-correlated using distinctive changes in tychoplank-
tonic and epiphytic diatom abundances that were
evident in both cores (Conroy et al. 2009).
For pollen analysis, 113 subsamples were taken from
EJ-3 providing a record from 0 to 45.6 cm depth. After
cores EJ-2, EJ-3, and EJ-N-1 were cross-correlated, 110
subsamples were taken from EJ-N-1 at 5-mm intervals
between 46 and 100.5 cm; 54 samples were collected at 1-
cm intervals between 101 and 154 cm; and 12 samples at
2-cm intervals between 156 and 178 cm.
Standard pollen preparation techniques included
treatment with KOH and acetolysis (after Faegri and
Iversen 1989). To each 0.25-cm3 subsample, 5580 styrene
microspheres were added to allow calculation of pollen
and spore concentrations (after Stockmarr 1971).
All pollen types were quantified, but the pollen sum
used to calculate percentage abundance excluded those
of Cyperaceae and shoreline elements, (e.g., Cuphea,
Utricularia, Hydrocotyle, Apiaceae, Polygonum, and
Ludwigia), those coming from the mainland (e.g., Alnus
and Podocarpus), and spores. Trial counts established
that species diversity approached an asymptote at pollen
sums of 250 grains (Appendix A).
Detrended Correspondence Analysis (DCA) from PC-
ORD 5 (McCune and Mefford 2006) was applied to the
percentage data for the 82 pollen taxa comprising the
pollen sum. The default setting of down-weighting rare
species was used. As DCA axes provided the clearest
separation of samples, the scores of the first two axes
were used to derive the zonation of the pollen diagram.
DCA summarizes data by producing a low-dimen-
sional space scaled in standard deviations (SD) that
conserves ecological distances and original relationships
between species and samples (Gauch 1982). Thus, with
paleoecological data, the ordination defines an ecolog-
ical space delimited by the variability of taxa and
environmental conditions through time. Euclidean
distances between samples rescaled in the first four axes
of the newly generated space are indicators of ecological
change, with a distance of 1 SD indicating a species
turnover of ;50% (Gauch 1982).
Rates of Ecological Change (ROC) were calculated by
dividing the ecological distance between two contiguous
samples by the interpolated time lapsed between those
samples (after Orloci et al. 2006). ROC provide no
indication of whether a series of samples are diverging or
converging, i.e., two peaks in ROC could cancel each
other when the assemblage returns to a prior state or
could be additive when it moves toward a new
assemblage type. To provide a visualization of the
ecological similarity of assemblages before and after
major changes in ROC, a baseline was established
shortly before the observed change. For each of these
samples, their Euclidean distance score was set to 0. The
distances of other samples to that point were expressed
in standard deviations of species turnover (Oksanen et
al. 2009, Correa-Metrio et al. 2011), i.e., dissimilarity to
that assemblage. The subsequent trajectory through time
provided a means to evaluate whether the postdisturb-
August 2012 1855GALAPAGOS VEGETATION HISTORY
ance assemblages trended back toward the baseline or
away from it.
Chronology and stratigraphy
The composite core from El Junco was 3.5 m inlength, spanning the last ca. 9100 cal yr BP. In this
study, only the upper 1.75 m was sampled. Within thissection of the core the sediment was a uniform darkbrown gyttja. The chronology of the cores was described
by Conroy et al. (2008) based on 210Pb, 137Cs, andcalibrated 14C ages from EJ-2 and EJ-N-1 (Appendices
B and C).The uppermost core chronology was established using
210Pb dating the 137Cs bomb spike, and two post-bomb14C ages in the top 20 cm that were calculated usingCALIBOMB (Reimer et al. 2004). Nine bulk-sediment14C dates, between 44 and 184 cm depth, with noreversals provided the chronology for the period
between ca. 800 BC and AD 1630 (2800–350 cal yearBP).The age model (after Conroy et al. 2008) and the
sampling method provide a time frame resolution of 2–9years per sample for the period between ca. AD 870 to
modern (106 cm depth to top 0.4 cm) (Appendix D).From ca. 30 BC to ca. AD 860 (153 to 107 cm depth) thetime intervals per sample vary between 10 and 20 years,
increasing to 40–60 years per sample for the rest of thecore EJ-N-1.
RESULTS
The pollen record
The pollen record of El Junco Crater Lake consisted
of 105 identified pollen types (Fig. 2, Appendix E). Taxa
recorded in the lake were not restricted to the crater, nor
even to the Galapagos Islands. Continental elements
included the pollen of Alnus and other Andean genera,
Brickellia diffusa, and Scalesia pedunculata, either grew
close to the lake or immediately upwind of the crater
(M. R. Gardener and P. Jaramillo, personal observa-
tions). Bursera, Hippomane, and Chamaesyce were taxa
characteristic of the dry zone, which lay ;3 km upwind
and ;500 m downslope of the crater. True coastal
elements, e.g., Rhizophora and Cryptocarpus, which
must have traveled at least 4 km, were present at ,1%of the pollen sum.
The construction and description of local pollen zones
Construction of pollen zones was supported by the
DCA outputs (Figs. 2 and 3). The strongest overall
response in the ordination of the pollen sum data was
the separation of relatively modern samples at the
positive extreme of Axis 1 from all samples predating ca.
AD 1930 toward the negative extreme of Axis 1 (Fig. 3).
The second DCA axis revealed two main opposing
trends prior to the mid AD 1700s. While considerable
overlap existed in all the pre AD 1930 samples, negative
values for Axis 2 reflected samples with .35% Alter-
nanthera, leading to a clustering of samples from the
PLATE 1. The endemic Miconia robinsoniana with El Junco Crater Lake in the background, San Cristobal, Galapagos Islands.Photo credit: M. Bush.
ALEJANDRA RESTREPO ET AL.1856 Ecology, Vol. 93, No. 8
FIG. 2. Fossil pollen data from El Junco Crater Lake, Galapagos, with diagram zonation. El Junco DCA Axes 1 and 2 scores(SD) are plotted against time. Relative abundances of the most abundant angiosperm taxa are plotted against time. All percentagesand total pollen influx (grains�cm�2�yr�1) were calculated from the sum of island elements excluding Cyperaceae (sedges) andcontinental elements. Percentages of the last two groups (shoreline elements and continental elements) were calculated relative tothe pollen sum (see Methods). The notations 33, 53, and others following the scientific names indicate that the scale of the curveshas been multiplied by those values to make them more visible. The gray contour on top of continental elements indicates Alnusabundances.
August 2012 1857GALAPAGOS VEGETATION HISTORY
period between AD 900 and 1250 (approximating theMCA) (Figs. 2 and 3). Positive scores of .0.15 on the
same axis were associated with low pollen influx values(;550 grains�cm�2�yr�1) and high abundances of Acaly-pha (;38%), causing clustering of samples from 690 BC
to AD 550 near the positive extreme of Axis 2 (Figs. 2and 3).
When Axes 1 and 2 were plotted against time, distinctinflection points were seen at ca. AD 150, AD 900, AD
1250, AD 1570, AD 1760, and AD 1930 (Fig. 4). Axis 3revealed a single sample with a positive score (at ca. 150
BC).Between ca. AD 400 and 900, sharp oscillations in
pollen and spore abundances were observed. Acalypha
was the most abundant taxon in the record, accountingfor about 40% of the pollen sum in most samples (Fig.
2). Alternanthera, the second most abundant pollen type,showed the greatest variability, rising to ;40% at ca.
AD 900, but declining markedly in abundance from ca.AD 1250 to 1380 and after ca. AD 1760. For .2500years Alternanthera had been at least 10% of the pollen
sum, but it fell below this historical level ca. AD 1930.After 1930, Alternanthera and Acalypha representation
declined abruptly, whereas Poaceae and Myrtaceaeincreased in abundance. Although sedimentation rates
appeared relatively constant from this date (;0.16 cm/
yr), pollen influx values increased up to fourfold by the
end of the record ca. AD 2000 (Fig. 2).Fossil spores were very abundant throughout the
record, accounting for as much as 400% relative to thepollen sum (Fig. 4). The commonest types were Cyathea
weatherbyana, an endemic tree fern, and a small triletespore that was probably Pteridium. Four periods show
marked declines in spore representation, from ca. 150 to100 BC, at ca. 0 BC, from ca. AD 1270 to 1400, andfrom ca. AD 1470 to1570. The highest abundance of
Cyathea weatherbyana and monolete psilate sporesoccurred between AD 1930 and 1960.
Analysis of ecological distances between neighboringsamples revealed peaks in the change of the assemblage
at ca. 150 BC and at ca. AD 1420 (Fig. 5; Appendix F).The ecological change at 150 BC was associated with
increased Acalypha abundances that coincided with asharp decline in all spores. The event at 1420 AD also
featured an increase in Acalypha abundances and adecline in Alternanthera. Sharp oscillations in spore
abundances co-occurred with these oscillations, but werenot included in the pollen sum used in the statistical
analysis. Neither of these samples stood out on the firsttwo axes on the DCA (Figs. 2 and 4). The highest ROC
was recorded at ca. AD 900 and AD 1420 with 0.08standard deviations of species turnover (SD) per year,
and at ca. AD 1930 with 0.13 SD per year (Fig. 5).Long intersample intervals (.8 years) prior to ca. AD
900, causes the ROC to be flattened. The increase in allthe metrics at AD 900 is at least partially explained by
shortening the intersample to ;3–4 years at this time. Inmost systems, such a change would not be critical, but inthis system, the higher-resolution sampling is capturing
interannual scale ENSO variability between El Nino andLa Nina years, which was previously masked by longer
time intervals between samples (Appendix D). Not allthe change is a product of sampling, as the strongest
assemblage shift of the prehuman era occurs betweenAD 900 and 1000. This shift is represented by many
samples and is marked by a substantial and persistentincrease in Alternanthera as Acalypha declines. By
setting the ecological distance for the time immediatelyprior to this change as zero, i.e., setting the baselines, the
subsequent path of the assemblage can be gauged (Fig.5).
DISCUSSION
On the interpretation of the record
The El Junco pollen record provides a detailed
reconstruction of the ecological changes on the islandof San Cristobal, Galapagos for the last 2690 years.
Given the size of the crater lake (;220 m diameter), andthe small crater (;320 m diameter) in which it sits, much
of the pollen would be expected to have been derivedfrom the outer walls of the cone and from regions
beyond it. Some pollen types are recorded but probablynever grew within the crater of El Junco, e.g., the
FIG. 3. Sample scores from a DCA analysis of the fossilpollen data from El Junco crater lake: DCA Axis 2 (eigenvalue0.034, length 1.455) vs. DCA Axis 1 (eigenvalue 0.120, length1.36) of all elements included in the pollen sum. Open circles aresamples younger than AD 1930, solid squares are those samplesbetween ca. AD 1740 and 1760, upward solid triangles towardpositive values of Axis 2 are those samples from 690 BC to AD550, downward open triangles toward negative Axis 2 scoresrepresent samples from ca. AD 900 to 1250, and crossesrepresent the rest of the samples clumped around the averageAxis 2 scores.
ALEJANDRA RESTREPO ET AL.1858 Ecology, Vol. 93, No. 8
or the lowland Galapagos elements, Rhizophora, Hippo-
mane, and Chamaesyce.
In most samples, Acalypha and Alternanthera ac-
counted for 20–50% of the pollen sum. Neither of these
genera was found in our exploration of the crater.
Indeed in the survey of 1974, Colinvaux’s team found no
Acalypha and, despite a protracted search, just two
individuals identified as Alternanthera helleri a few
hundred meters from the rim of the crater (Colinvaux
and Schofield 1976a). Other surveys did not find A.
helleri near El Junco, though A. halimifolia and A.
rugulosa were documented as rare plants near the crater
(Wiggins and Porter 1971). Svenson (1946) described
Alternanthera as an ‘‘exceedingly difficult group for
study’’ (Svenson 1946:433), with A. helleri and A.
halimifolia as very similar species. Ecologically, A.
halimifolia is an herbaceous species known to occur
within the shaded understory created by Scalesia
(Eliasson 1984). However, this herb tolerates full light
exposure as well as light-limited conditions (Atkinson et
al. 2009).
All Acalypha on the Galapagos are endemic, and three
species have been recorded from San Cristobal, but none
from El Junco. The most likely species to be represented
in the pollen rain at El Junco is A. baurii. When last
observed in the moist southwestern midelevation areas
of the island in 1895, Robinson (1902) described A.
baurii as locally abundant.
Other members of the genera of Alternanthera and
Acalypha are anemophilous and are therefore probably
over-represented to some extent in both modern and
fossil pollen inputs (Bush and Rivera 2001, Smith et al.
2004). Modern pollen traps on El Junco and mud–water
interface samples from the lake document low percent-
ages (0–4%) of Alternanthera and Acalypha, and these
presumably reflect upslope transport of lowland species,
rather than local production (Collins and Bush 2011).
The consistently high representation of Acalypha and
Alternanthera in the fossil record (60–80%) suggests a
substantial presence of these taxa in the highlands of San
Cristobal, and probably within the crater of El Junco,
prior to human occupation on the islands.
Unlike Acalypha, Alternanthera, and Croton scouleri,
the endemic tree fern Cyathea weatherbyana is restricted
to, and indicative of, moist and protected highland
settings. Cyathea weatherbyana, like others in this genus,
FIG. 4. Nonpollen proxies and other elements, not included in the pollen sum, from El Junco crater lake plotted against time.Diatoms abundances were grouped as tychoplanktonic and epiphytic (after Conroy et al. 2009). Sand percentages, based on thelithics fraction after Conroy et al. (2008), indicate runoff from the crater wall into the lake. Shoreline elements are the sum includingCuphea, Utricularia, Ludwigia, Polygonum, and cf. Apiaceae. Percentages of these elements and fossil spore abundances werecalculated relative to the pollen sum (seeMethods). The notations 0.253, 53, following the scientific names indicate that the scale ofthe curves has been adjusted to promote visibility or plotting.
August 2012 1859GALAPAGOS VEGETATION HISTORY
probably responds to increased light availability by
producing additional fronds and spores (Arens and
Sanchez-Baracaldo 1998, Arens 2001). It appears
probable that on the Galapagos, El Nino conditions
promote growth, flowering, and spore production. El
Nino brings increased convective rain in the hot season
that can extend into the rainy period of what otherwise
would have been the cool or garua season. The
combination of moisture and increased light availability
would be beneficial to most species in the highlands.
The influence of climate change on Galapagos vegetation
Prior work has established some of the basic patterns
of climate change that influenced the El Nino 3 and El
Nino 1 þ 2 regions of the Pacific Ocean. Conroy et al.
(2008) inferred very active El Nino events and intense
rains that eroded shoreline sand between ca. 150 BC and
AD 440. The spore data, especially, from El Junco
reflect very active El Nino and La Nina events during
this time (Fig. 4). Strong declines in the moisture-
demanding ferns indicate periods of substantial drought
in addition to wet events that included erosive rains.
Our pollen data are also consistent with the temper-
ature reconstruction for El Nino 3 region from AD 500
to 2000 (Mann et al. 2009) (Fig. 6). Throughout this
record sea surface temperatures (SSTs) were probably
influenced by the El Nino Southern Oscillation (ENSO),
but between ca. AD 500 and near-modern times, the
mean state was generally cooler than the modern mean
(taken to be 1960–1991; after Mann et al. 2009). The
warm departures at ca. AD 500, 1300–1400, and post
1850 were all times of falling abundances of Alter-
nanthera in the pollen record. The warm SSTs probably
resulted in conditions of high light and moisture
availability, typical of El Nino. Under these conditions
Alternanthera populations, which grew in the garua zone
(light-limited, foggy, and dry environment) declined in
abundance. The interpretation that Alternanthera was
favored by hot-season drought and cool-season cloud
immersion, conditions that are most strongly associated
with La Nina, was consistent with its known ecology
(Hamann 2004). Acalypha, apparently benefiting from
declines in Alternanthera, increased in pollen abundance.
The tree fern Cyathea weatherbyana, while favored by
moist conditions, was more vulnerable to periods of
rapidly oscillating climate than Acalypha. Consequently,
the periods of extreme drought at ca. AD 900 and 1300
FIG. 5. Ecological change and rates of ecological change derived from pollen data of El Junco crater lake, showing theecological distance of every sample in the record to samples of age AD 1340, AD 850, and the present (indicated by arrows). Thestar symbol identifies the spike of rate of ecological change (ROC) at ca. AD 1421. All ecological change is measured as standarddeviations (SD) of community turnover as derived from the DCA sample scores. Rates of ecological change for other intervals aregiven in Appendix F.
ALEJANDRA RESTREPO ET AL.1860 Ecology, Vol. 93, No. 8
had strongly negative influences on Cyathea wea-
therbyana populations.
The Medieval Climate Anomaly (MCA; ca. AD 950–
1250) and the Little Ice Age (LIA; ca. AD 1550–1850)
have been identified as periods of significant climate
change in the Andes and the Pacific Ocean (e.g., Conroy
et al. 2009, Sachs et al. 2009, Bird et al. 2011). The MCA
has been described as a time of cool sea surface
temperatures in the Central and Eastern Pacific based
on fossil corals from Palmyra Island (Cobb et al. 2003)
and near coastal sediments off Peru (Rein et al. 2004).
The El Junco fossil diatom record indicates that the lake
fell to its lowest level in the last 1200 years between ca.
AD 1010 and 1300 (Conroy et al. 2009). Increases in
Alternanthera and declining abundances of Acalypha,
Croton, and ferns between ca. AD 900 and 1250 were
consistent with cool conditions during the MCA (Fig.
6), though lake level lagged slightly the climatic trends
evident in the pollen data (Figs. 4 and 6).
The LIA was probably more strongly influenced by El
Nino than the MCA (Cobb et al. 2003, Mann et al.
2009). The LIA was not associated with clearly
delineated changes in pollen composition at El Junco
as Alternanthera rose in abundance throughout this
period. To this point, we have interpreted Alternanthera
as an indicator of drier conditions, but the data from the
LIA suggests a more nuanced and ecologically interest-
ing interpretation. Alternanthera may have been re-
sponding to an ecological threshold, and thus has a
nonlinear response to climate change. Alternanthera
only declined substantially when sea surface tempera-
tures approximated those of the mean 1960–1991
temperatures (Mann et al. 2009). During the LIA,
although the sea surface temperatures were lower than
this range and the climate appears to have been less
drought prone than the MCA (Fig. 4), overall condi-
tions were still favorable for Alternanthera (e.g.,
Hamann 2004).
Another indicator of El Nino conditions is a peak of
Croton scouleri. Croton scouleri is widespread across
temperature and moisture gradients in the Galapagos,
but requires bright growing conditions (Hamann 2004).
The peak of Croton pollen abundance within this period
is indicative of weakening garua and a higher, or less
persistent, cloud cover, consistent with enhanced El
Nino conditions.
In the last 30 years, the pollen abundance of Hippo-
mane, Cryptocarpus, and Bursera all increase by factors
of 3–5 (Fig. 2). These elements are very unlikely to
simply blow upslope because they are consistent in their
rarity throughout the rest of the record. To travel the 3
km upslope to El Junco almost certainly requires
convection to lift these grains high enough to become
entrained in winds. The pollen is washed out of the air
FIG. 6. Fossil pollen data (percentage of total pollen sum) from El Junco crater lake for selected taxa in comparison with theinferred temperature trends in El Nino 3 region of the Pacific Ocean (after Mann et al. [2009]). The notations 0.13, 23, following thescientific names indicate that the scale of the curves has been multiplied by those values to make them more visible or to facilitateplotting. Abbreviated labels are repeated on the right-hand axes. SST stands for sea surface temperature.
August 2012 1861GALAPAGOS VEGETATION HISTORY
during rain events. Increased rainfall and increased
convection, both predictions of increased SSTs, combine
to produce the elevated signal of these coastal elements
and probably of the continental elements in the record.
This signal is entirely consistent with the observed rise in
sea surface temperature (Fig. 6).
System stability
Throughout this record, relatively frequent El Nino
and La Nina events provided a system that was stable in
its regime of disturbance; the balancing effect of
frequent events effectively canceled out any trend
toward a ‘‘wetter’’ or ‘‘drier’’ assemblage. This dynam-
ically stable system between ca. 150 BC and AD 440, as
inferred from strong oscillations of ENSO events, led to
very little long-term (centennial-scale) change in overall
community composition. Within the overall pattern of
stability some perturbations were evident. The change in
the pollen assemblage at ca. AD 900 induced a sustained
shift to new conditions that lasted for ;350 years. The
inferred droughts of the early MCA induced population
changes, but as the strength of the La Nina forcing
faded, the assemblage gradually reverted toward the
predrought state. By ca. AD 1300, there was negligible
ecological distance between the pre- and postdrought
assemblages.
Two further events in the 1400s and in the 1700s
provide similar examples of a trend away from the
baseline, but both result in convergence back close to the
baseline state within a century. These data provide
strong evidence of a pre-human system that responded
to climatic forcing but would bounce back to its prior
state, an expectation of a niche-driven system (after
Clark and McLachlan 2003). When a system is stressed
by an event such as a long period of drought (here we
draw a distinction between single events and perhaps
decadal-scale droughts), but then allowed to relax as
normal rainfall resumes, two basic predictions can be
made. The first would be that the assemblage will exhibit
a neutral response (sensu Hubbell 2001), in which the
species that come to dominate are drawn from the
overall population pool, but will not necessarily be in
similar proportions to the pre-perturbed assemblage.
Indeed, if there is no selective advantage between
species, and if dispersal is not limiting species’ responses,
the neutral prediction would be for a novel assemblage
to form. An alternative view would be that advantage
conferred by niche (e.g., Pitman et al. 2001) leads to the
drought producing a temporary change, and that when
wetter conditions resume, the resulting assemblage is
similar to the pre-drought state (e.g., Clark and
McLachlan 2003) (Fig. 5).
Thus, convergence of species assemblages is a non-
neutral outcome. These results suggest that selection and
niche are important components of this landscape, a
finding resonant with work on finch evolution and
community structure within the islands (Grant and
Grant 2006).
Human influence on vegetation of San Cristobal Island
Modern climate change is undoubtedly contributing
to the rapidity of community change, but so too is
human land use. The highest ROC from El Junco, since
AD 1930, is faster than any previously documented in
the record. When modern conditions are set to zero the
ecological distances of all samples prior to 1930 are very
similar. But post-1930 samples show a sustained
divergence toward an ecosystem without prior analogue.
Two of the most prolific pollen producers, Acalypha and
Alternanthera, go into decline within the last 200 years
and are replaced by a flora rich in exotic species,
gium jambos, (all included within the Myrtaceae pollen
type) and latterly Rubus niveus have replaced them as the
dominant species in the landscape.
Miconia is always rather scarce in this record, and
doubles in abundance as Alternanthera declines. Miconia
shrubs are often buzz-pollinated (Renner and Beck
2003), though whether this is true of M. robinsoniana,
the endemic species of the Galapagos, is not known. But
based on modern stem density and the ;4% represen-
tation of M. robinsoniana in the lake record, it does not
appear to be severely underrepresented in the pollen
spectra (Collins and Bush 2011). If this is true, the
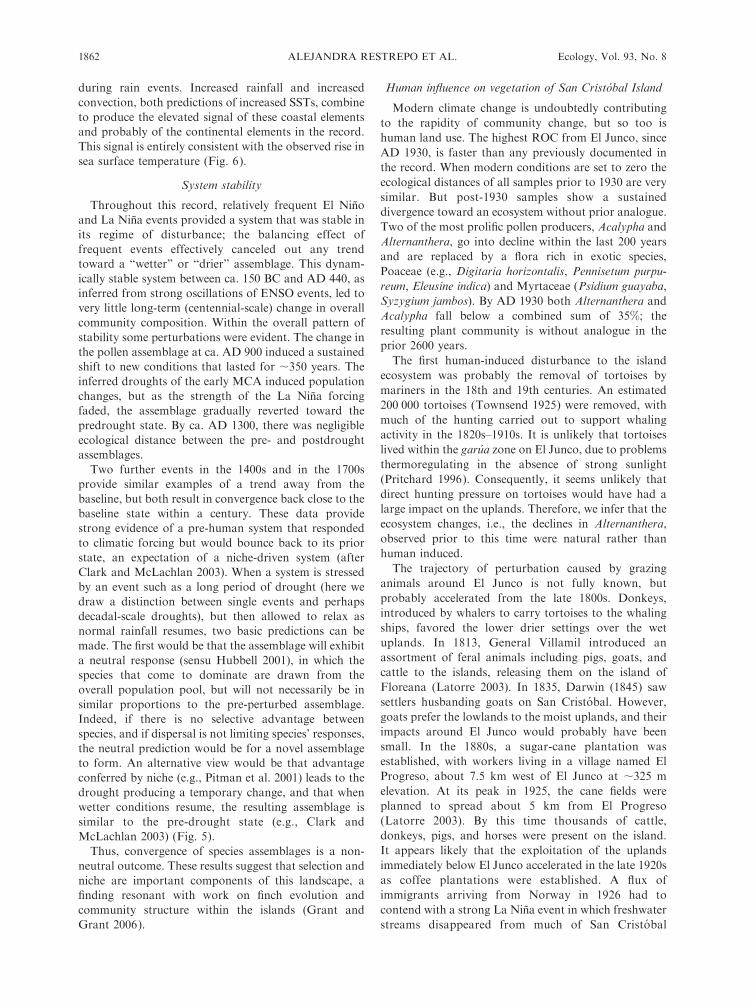
FIG. 7. (a) Photograph of U.S. military personnel beside El Junco crater lake in 1942 (Photo credit: Hugo Idrovo). Note thelack of tree ferns, and short vegetation indicative of heavy grazing pressure. (b) A similar view of the crater taken in 2009 (Photo:M. B. Bush).
apparent importance ofMiconia in the perceived natural
community of San Cristobal may be an example of a
shifting baseline (sensu Pauly 1995), as the first
vegetation descriptions were made after the natural
cover rich in Acalypha and Alternanthera had been lost.
Restoration efforts are underway around El Junco,
with fencing to restrict cattle access (only partially
successful), and poisoning of invasive trees. This study
suggests that the initial reduction in grazing probably
accelerated the invasion of exotic species because of gaps
created by disturbance. Similarly, removal of invasive
trees has facilitated invasion of blackberry (Rubus
niveus), as their shade was previously suppressing it.
Current efforts by Galapagos National Park have
focused on revegetation with the shrub Miconia
robinsoniana; however, little attention has been paid to
ground cover. We suggest that full restoration will need
to include active reintroduction of Alternanthera and
Acalypha species. First, a full search of the humid zone
must be undertaken to determine the identity of the taxa
and their abundance and distribution. Once appropriate
plant material has been found, ex situ propagation
should be carried out in the National Park nursery. Loss
of native species and the invasion of exotic species have
resulted in a dynamic novel ecosystem (sensu Hobbs et
al. 2006) without historical analogue that offers much
uncertainty in terms of its long-term ability to support
an endemic fauna, and in its resilience to ongoing
climate variability and anthropogenic change.
CONCLUSIONS
Within the late Holocene there is no evidence in the
fossil pollen data of permanent changes in the assem-
blage composition caused by climate change. Stability in
this system was provided by the persistent oscillations in
climate conditions caused by ENSO activity. Overall,
there was no replacement of one community with
another despite the differing patterns of ENSO variabil-
ity that occurred in the last 2600 years. Thus, at the
broad scale the community was both stable and resilient
to climate change (sensu Holling 1973). During periods
of climate change, population balances would shift, but
as conditions reverted, so too did the population
balance. Warm temperatures, clearer skies, and rain
without saturating cloud at ground level, may all have
led to El Nino events prompting the highest productivity
around El Junco crater lake. Thus, the answer to our
first research question regarding the extent to which
climate influences vegetation on the islands, was that
climate altered population balances but did not induce
large-scale or persistent changes in communities.
Our second research question asked if the communi-
ties responded to environmental change in neutral or
nonneutral ways. The finding that communities were
disrupted by protracted periods of environmental
change, and that they responded both in terms of
composition and productivity, was consistent with both
neutral and niche-based theories. However, population
balances did change, and appeared to follow predictable
phase shifts, in which very similar combinations of taxa
in the same proportions established themselves repeat-
edly, suggesting that niche rather than neutrality was thekey driver of population responses.
The resilience and stability of the Galapagos ecosys-tem changed with the arrival of humans and their
grazing animals. Declines in the abundance of Alter-
nanthera and Acalypha were probably linked to an
inferred increase in grazing activity that set a new
ecological trajectory for the upland landscape after ca.1930. Invasions of exotic species and the loss of the two
most abundant (in terms of pollen representation) taxa
resulted in a modern landscape without parallel in the
past. Over the past century rates of ecological change
have accelerated and will continue to drive theecosystem further and further from its pristine state.
Little doubt exists that in answer to our third research
question, we find that human actions have had a far
greater, and perhaps irreversible, influence on this island
system than the preceding 2600 years of climate change.
Modern climate change on the islands also appears to
be changing the functioning of the ecosystem. Unprec-edented levels of upslope transport of pollen from the
lowlands within the last 30 years suggest increased
convection, and are consistent with a warming of warm/
wet season temperatures.
ACKNOWLEDGMENTS
We thank NOAA (grant No. NA07OAR4310058), RichardFord (Florida Institute of Technology), and the MicrosoftCorporation for funding the pollen analysis. Additional fundingcame from NSF grant BCS 0926973. We thank Jose IgnacioMartinez from Universidad EAFIT (Medellın, Colombia). Wegreatly appreciate the botanical and ecological insights given byAlan Tye, Mandy Trueman, and Anne Guezou from the CharlesDarwin Foundation. We are grateful for the insightful commentsof two anonymous reviewers.
This is publication No. 67 of the Institute for ClimateChange Research at the Florida Institute of Technology.
LITERATURE CITED
Arens, N. C. 2001. Variation in performance of the tree fernCyathea caracasana (Cyatheaceae) across a successionalmosaic in an Andean cloud forest. American Journal ofBotany 88:545–551.
Arens, N. C., and P. Sanchez-Baracaldo. 1998. Distribution oftree ferns (Cyatheaceae) across the successional mosaic in anAndean cloud forest, Narino, Colombia. American FernSociety 88:60–71.
Atkinson, R., A. Guezou, and P. Jaramillo. 2009. Plantasnativas para jardines en Galapagos. Fundacion CharlesDarwin, Puerto Ayora Isla Santa Cruz, Islas Galapagos,Ecuador.
Bird, B. W., M. B. Abbott, M. Vuille, D. T. Rodbell, N. D.Stansell, and M. F. Rosenmeier. 2011. A 2,300-year-longannually resolved record of the South American summermonsoon from the Peruvian Andes. Proceedings of theNational Academy of Sciences USA 108:8583–8588.
Brown, J. H., and A. Kodric-Brown. 1977. Turnover rates ininsular biogeography: effect of immigration and extinction.Ecology 58:445–449.
Bush, M. B., and R. Rivera. 2001. Reproductive ecology andpollen representation among neotropical trees. GlobalEcology and Biogeography 10:359–367.
ALEJANDRA RESTREPO ET AL.1864 Ecology, Vol. 93, No. 8
Campbell, K., C. Donlan, F. Cruz, and V. Carrion. 2004.Eradication of feral goats Capra hircus from Pinta Island,Galapagos, Ecuador. Oryx 38:328–333.
Clark, J. S., and J. S. McLachlan. 2003. Stability of forestbiodiversity. Nature 423:635–638.
Cobb, K. M., C. D. Charles, H. Cheng, and R. L. Edwards.2003. El Nino/Southern Oscillation and tropical Pacificclimate during the last millennium. Nature 424:271–276.
Colinvaux, P. 1972. Climate and the Galapagos Islands. Nature240:17–20.
Colinvaux, P. A., and E. K. Schofield. 1976a. Historical ecologyin the Galapagos Islands. I. A Holocene pollen record fromEl Junco lake, Isla San Cristobal. Journal of Ecology 64:989–1012.
Colinvaux, P. A., and E. K. Schofield. 1976b. Historical ecologyin the Galapagos Islands. II. A Holocene spore record fromEl Junco lake, Isla San Cristobal. Journal of Ecology64:1013–1028.
Collins, A., and M. B. Bush. 2011. An analysis of modernpollen representation and climatic conditions on the Gala-pagos Islands. The Holocene 21:237–250.
Conroy, J. L., J. T. Overpeck, J. E. Cole, T. M. Shanahan, andM. Steinitz-Kannan. 2008. Holocene changes in easterntropical Pacific climate inferred from a Galapagos lakesediment record. Quaternary Science Reviews 27:1166–1180.
Conroy, J. L., A. Restrepo, J. T. Overpeck, M. Steinitz-Kannan, J. E. Cole, M. B. Bush, and P. A. Colinvaux. 2009.Unprecedented recent warming of surface temperatures inthe eastern tropical Pacific Ocean. Nature Geoscience 2:46–50.
Correa-Metrio, A., D. H. Urrego, K. R. Cabrera, and M. B.Bush. 2011. paleoMAS: paleoecological analysis. R packageversion 1.1. The R Project for Statistical Computing. http://CRAN.R-project.org/package¼paleoMAS
Darwin, C. 1845. Narrative of the surveying voyages of HisMajesty’s Ships Adventure and Beagle between the years1826 and 1836, describing their examination of the southernshores of South America, and the Beagle’s circumnavigationof the globe. Journal and remarks. 1832–1836. HenryColburn, London, UK.
Dunbar, R. B., G. M. Wellington, M. Gerard, M. W. Colgan,and P. W. Glynn. 1994. Eastern Pacific sea surfacetemperature since 1600 A.D.: The dO18 record of climatevariability in Galapagos corals. Paleoceanography 9:291–316.
Eliasson, U. 1984. Native climax forest. Page 101 in R. Perry,editor. Key environments: Galapagos. Pergamon Press,Oxford, New York.
Faegri, K., and J. Iversen. 1989. Textbook of pollen analysis.Munksgaard, Copenhagen, Denmark.
Gauch, H. G. 1982. Multivariate analysis in communityecology. Cambridge University Press, Cambridge, UK.
Grant, B. R., and P. R. Grant. 2003. What Darwin’s finches canteach us about the evolutionary origin and regulation ofbiodiversity. BioScience 53:965–975.
Grant, B. R., and P. R. Grant. 2008. Fission and fusion ofDarwin’s finches populations. Philosophical Transactions ofthe Royal Society B 363:2821–2829.
Grant, P. R., and B. R. Grant. 1987. The extraordinary El Ninoevent of 1982–1983: effects on Darwin’s finches on IslaGenovesa, Galapagos. Oikos 49:55–66.
Grant, P. R., and B. R. Grant. 2006. Evolution of characterdisplacement in Darwin’s finches. Science 313:224–226.
Grant, P. R., B. R. Grant, L. F. Keller, and K. Petren. 2000.Effects of El Nino events on Darwin’s finch productivity.Ecology 81:2442–2457.
Grehan, J. 2001. Biogeography and evolution of the Galapagos:integration of the biological and geological evidence.Biological Journal of the Linnean Society 74:267–287.
Groenman-van Waateringe, W. 1993. The effects of grazing onthe pollen production of grasses. Vegetation History andArchaeobotany 2:157–162.
Hamann, O. 1993. On vegetation recovery, goats, and gianttortoises on Pinta Island, Galapagos, Ecuador. Biodiversityand Conservation 2:138–151.
Hamann, O. 2001. Demographic studies of three indigenousstand-forming plant taxa (Scalesia, Opuntia, and Bursera) inthe Galapagos Islands, Ecuador. Biodiversity and Conserva-tion 10:223–250.
Hamann, O. 2004. Vegetation changes over three decades onSanta Fe Island, Galapagos, Ecuador. Nordic Journal ofBotany 23:143–152.
Hobbs, R. J., et al. 2006. Novel ecosystems: theoretical andmanagement aspects of the new ecological world order.Global Ecology and Biogeography 15:1–7.
Holling, C. S. 1973. Resilience and stability of ecologicalsystems. Annual Review of Ecology and Systematics 4:1–23.
Hubbell, S. P. 2001. The unified neutral theory of biodiversityand biogeography. Princeton University Press, Princeton,New Jersey, USA.
Itow, S. 1995. Phytogeography and ecology of Scalesia(Compositae) endemic to the Galapagos Islands. PacificScience 49:17–30.
Jolaosho, A. O., J. A. Olanite, O. S. Onifade, and A. O. Oke.2006. Seed in the faeces of ruminant animals grazing nativepastures under semi-intensive management in Nigeria.Tropical Grasslands 40:79–83.
Killeen, T. J. 1991. Effect of grazing on native Gramineae inConcepcion, Santa Cruz, Bolivia. Tropical Grasslands 25:12–19.
Latorre, O. 2003. The curse of the giant tortoise: tragedies,mysteries, and crimes in the Galapagos Islands. Fourthedition. National Cultural Fund, Quito, Ecuador.
Losos, J., and R. Ricklefs. 2009. Adaptation and diversificationon islands. Nature 457:830–836.
Mann, M. E., Z. Zhang, S. Rutherford, R. S. Bradley, M. K.Hughes, D. Shindell, C. Ammann, G. Faluvegi, and F. Ni.2009. Global signatures and dynamical origins of the LittleIce Age and Medieval Climate Anomaly. Science 326:1256–1260.
Mauchamp, A., and R. Atkinson. 2010. Rapid, recent, andirreversible habitat loss: Scalesia forest on the GalapagosIslands. Pages 108–112 in M. V. Toral-Granada, L. J. Cayot,and A. M. Luna, editors. Galapagos Report 2009–2010.CDF, GNP, and Governing Council of Galapagos, PuertoAyora, Galapagos, Ecuador.
McCune, B., and M. J. Mefford. 2006. PC-ORD. Multivariateanalysis of ecological data. Version 5.22. Bruce McCune,MjM Software Design, Gleneden Beach, Oregon, USA.
Moy, C. M., G. O. Seltzer, D. T. Rodbell, and D. M. Anderson.2002. Variability of El Nino/Southern Oscillation activity atmellennial timescales during the Holocene epoch. Nature420:162–165.
Oesterheld, M., and O. E. Sala. 1990. Effects of grazing onseedling establishment: the role of seed and safe-siteavailability. Journal of Vegetation Science 1:353–358.
Oksanen, J., R. Kindt, P. Legendre, B. O’Hara, G. Simpson, P.Solymos, M. Stevens, and H. Wagner. 2009. vegan:Community Ecology Package. R package version 1.15-4.The R Project for Statistical Computing. R Foundation forStatistical Computing, Vienna, Austria.
Orloci, L., V. D. Pillar, and M. Anand. 2006. Multiscaleanalysis of palynological records: new possibilities. Commu-nity Ecology 7:53–67.
Parent, C., A. Caccone, and K. Petren. 2008. Colonization anddiversification of Galapagos terrestrial fauna: a phylogeneticand biogeographical synthesis. Philosophical Transactions ofthe Royal Society B 363:3347–3361.
Pauly, D. 1995. Anecdotes and the shifting baseline syndromeof fisheries. Trends in Ecology and Evolution 10:430.
Pitman, N. C. A., J. W. Terborgh, M. R. Silman, P. Nunez V.,D. A. Neill, C. E. Ceron, W. A. Palacios, and M. Aulestia.2001. Dominance and distribution of tree species in upperAmazonian terra firme forests. Ecology 82:2101–2117.
August 2012 1865GALAPAGOS VEGETATION HISTORY
Pritchard, P. C. H. 1996. The Galapagos tortoises: nomencla-tural and survival status. Chelonian Research Foundation,Winter Park, Florida, USA.
Reimer, P. J., T. A. Browns, and R. W. Reimer. 2004.Discussion: reporting and calibration of post-bomb 14C data.Radiocarbon 46:1299–1304.
Rein, B., A. Luckage, L. Reinhardt, F. Sirocko, A. Wolf, andW.-C. Dullo. 2005. El Nino variability off Peru during thelast 20,000 years. Paleoceanography 20:2004PA001099.
Rein, B., A. Luckage, and F. Sirocko. 2004. A major HoloceneENSO anomaly during the Medieval period. GeophysicalResearch Letters 31:L17211. http://dx.doi.org/17210.11029/12004GL020161
Renner, S. S., and S. G. Beck. 2003. A new Miconia(Melastomataceae) from Bolivia, with remarks on angular-branched species in the Andes. Novon: A Journal forBotanical Nomenclature 13:110–112.
Riedinger, M. A., M. Steinitz-Kannan, W. M. Last, and M.Brenner. 2002. A ;6100 14C yr record of El Nino activity fromthe Galapagos Islands. Journal of Paleolimnology 27:1–7.
Robinson, B. L. 1902. Flora of the Galapagos Islands.Proceedings of the American Academy of Arts and Sciences38:77–269.
Sachs, J. P., D. Sachse, R. H. Smittenberg, Z. Zhang, and S.Golubic. 2009. Southward migration of the Pacific conver-gence zone AD 1400–1850. Nature GeoScience 2:519–525.
Seddon, A. W. R., C. A. Froyd, M. J. Leng, G. A. Milne, andK. J. Willis. 2011. Ecosystem resilience and threshold
response in the Galapagos coastal zone. PLoS ONE 6(7):e22376.
Smith, N., S. Mori, A. Henderson, D. Stevenson, and S. Heald.2004. Flowering plants of the Neotropics. Princeton Univer-sity Press and The New York Botanical Garden, Princeton,New Jersey, USA.
Steinitz-Kannan, M., M. A. Riedinger, W. Last, M. Brenner,and M. C. Miller. 1998. Un registro de 6,000 anos demanifestaciones intensas del fenomeno de el Nino ensedimentos de lagunas de las islas Galapagos. Bulletin del’Institut Francais d’Etudes Andines 27(3):581–592.
Stockmarr, J. 1971. Tablets with spores in absolute pollenanalysis. Pollen et Spores 13:615–621.
Svenson, H. K. 1946. Vegetation of the coast of Ecuador andPeru and its relation to that of the Galapagos Islands II.Catalogue of plants. American Journal of Botany 33:427–498.
Townsend, C. H. 1925. The Galapagos tortoises in theirrelation to the whaling industry: a study of old logbooks.Zoologica 4:55–135.
Trueman, M., and N. d’Ozouville. 2010. Characterizing theGalapagos terrestrial climate in the face of global climatechange. Galapagos Research 67:26–37.
Wiggins, I. L., and D. M. Porter. 1971. Flora of the GalapagosIslands. Stanford University Press, Stanford, California,USA.
Wikelski, M., and C. Thom. 2000. Marine iguanas shrink tosurvive El Nino. Nature 403:37–38.
SUPPLEMENTAL MATERIAL
Appendix A
A figure showing asymptotes reached at 250 grains counted for total pollen sums in both the uppermost sample and the sampleat 12 cm depth (Ecological Archives E093-164-A1).
Appendix B
A table of radiometric ages upon which the chronology is based (Ecological Archives E093-164-A2).
Appendix C
Figures showing the inferred pattern of sediment accumulation in cores EJ-N-1 and EJ-2 raised from El Junco Crater Lake(Ecological Archives E093-164-A3).
Appendix D
A table of corresponding age (AD/BC) for each of the depths sampled (Ecological Archives E093-164-A4).
Appendix E
The total number of taxa found in the El Junco Crater Lake pollen record, 105 pollen and spore types (Ecological Archives E093-164-A5).
Appendix F
A figure showing ecological change derived from pollen data of El Junco Crater Lake in which selected times are set to zero toform a baseline with which change can be compared (Ecological Archives E093-164-A6).
ALEJANDRA RESTREPO ET AL.1866 Ecology, Vol. 93, No. 8