Impacts of efficient stoves and cooking fuel substitution in family expenditures of urban households in Dar es Salaam, Tanzania Godfrey Alois Sanga 1 [email protected]Gilberto D. M. Jannuzzi 2 [email protected]Tanzania Traditional Energy Development and Environment Organization, TaTEDO, P O Box 32794, Dar es Salaam, Tanzania 2 State University of Campinas, CEP: 13083, Campinas, São Paulo September 2005 ENERGY DISCUSSION PAPER No. 2.59.1/05 Caixa Postal 6163 CEP 13.083-770 Campinas - São Paulo, Brazil. Tel. +55-19-3249-0288 fax: +55-19-3289-3125 Email: [email protected]Homepage: http://www.iei-la.org IEI Board of Directors Thomas Johansson University of Lund Sweden - Chairman Amulya K.N.Reddy Retired Professor Indian Institute of Science Bangalore - India José Goldemberg University of São Paulo Brazil Robert Williams Princeton University USA Stephen Karekezi African Energy Policy Research Network – Kenya Wim Turkenburg Utrecht University Netherlands Eric Larson Princeton University, USA – President Gilberto M Jannuzzi State University of Campinas, Brazil Executive Director
Transcript
Impacts of efficient stoves and cooking fuel substitution in family expenditures of urban households in Dar es Salaam,
Tanzania Traditional Energy Development and Environment Organization, TaTEDO, P O Box 32794, Dar es Salaam, Tanzania
2 State University of Campinas, CEP: 13083, Campinas, São Paulo
September 2005
ENERGY DISCUSSION PAPER No. 2.59.1/05
Caixa Postal 6163 CEP 13.083-770 Campinas - São Paulo, Brazil. Tel. +55-19-3249-0288 fax: +55-19-3289-3125 Email: [email protected] Homepage: http://www.iei-la.org
IEI Board of Directors
Thomas JohanssonUniversity of Lund
Sweden - Chairman
Amulya K.N.ReddyRetired Professor
Indian Institute of ScienceBangalore - India
José GoldembergUniversity of São Paulo
Brazil
Robert WilliamsPrinceton University
USA
Stephen Karekezi African Energy Policy
Research Network –Kenya
Wim TurkenburgUtrecht University
Netherlands
Eric Larson
Princeton University,USA – President
Gilberto M JannuzziState University of
Campinas, Brazil Executive Director
1
Foreword The Energy Discussion Paper series is intended to disseminate pre-prints and research reports organized or authored by members of the International Energy Initiative (Latin American Office) and its associates with the purpose to stimulate the debate on current energy topics and sustainable development. Any comments or suggestions are welcome and should be addressed to the authors for consideration. Gilberto M. Jannuzzi Diretor (Latin America) International Energy Initiative
Apresentação A série Energy Discussion Paper tem o objetivo de disseminar os artigos e relatórios preparados pelos membros ou associados do escritório regional da International Energy Initiative. A intenção é estimular o debate sobre temas correntes na área de energia e desenvolvimento sustentável. Comentários e sugestões são bem-vindos e devem ser encaminhados diretamente aos autores, para consideração e eventuais revisões. Gilberto M. Jannuzzi Diretor (América Latina) International Energy Initiative
The ideas and opinions expressed in the paper do not represent, nor are necessarily endorsed by the International Energy Initiative and its Board of Directors. Reproduction of the contents is permitted warranted that the source is mentioned accordingly. Atenção As idéias apresentadas neste documento não representam necessariamente as opiniões do International Energy Initiative e seu Conselho de Diretores. Reprodução no todo ou parte do material apresentado é permitida desde que citada a fonte
Sanga, Alois Godfrey Impacts of efficient stoves and cooking fuel substitution in family expenditures of urban households in Dar es Salaam, Tanzania / Godfrey Alois Sanga, Gilberto De Martino Jannuzzi - Campinas, SP: Energy Discussion Paper nº 2.59.1/05, 2005. 1. Cooking energy 2. Fuel substitution 3. Energy costs.
2
IMPACTS OF EFFICIENT STOVES AND COOKING FUEL SUBSTITUTION IN FAMILY EXPENDITURES OF URBAN
HOUSEHOLDS IN DAR ES SALAAM, TANZANIA1
ABSTRACT
The objective of this paper is to verify quantitatively the impacts of energy efficiency improvements and cooking fuels substitution in household and national level in Tanzania. The paper entails information on access to cooking fuels, technologies and a comparative analysis of the economic impacts of energy efficiency improvement and fuel substitution in Dar es Salaam.
Acronyms
AFREPREN African Energy Policy and Research Network ARI Acute Respiratory Infection BEN Balanço Energético Nacional [National Energy Balance, Brazil] BOT Bank of Tanzania CH4 Methane gas CIF Cost Insurance and Freight CO Carbon monoxide CO2 Carbon dioxide ESMAP Energy Sector Management Assistance Programme GJ Giga joule [109 Joule] J Joule KCJ Kenya Ceramic Jiko kJ Kilo joule [103 Joule], 1 kcal=4.186 kJ kW kilowatt kWh Kilowatt-hour [3.6 x 10⁶ Joules] MJ Mega joule [106 Joule] NBS National Bureau of Statistics (Tanzania) TaTEDO Tanzania Traditional Energy Development and Environment Organization TSH Tanzanian Shilling UNDP United Nations Development Program US$ United States Dollar USEPA United States Environmental Protection Agency WEC World Energy Council WHO World Health Organization
1 The present paper is an outcome of the partnership program Sustainable energy solutions in North and South between Sweco Grøner (Norway), Tanzania Traditional Energy Development and Environment Organization (TaTEDO) and the IEI’s Latin American Regional Energy Initiative office (Brazil). Under the program, the lead author concluded a two-year Master program at the State University of Campinas (Brazil) advised by prof. Gilberto De Martino Jannuzzi.
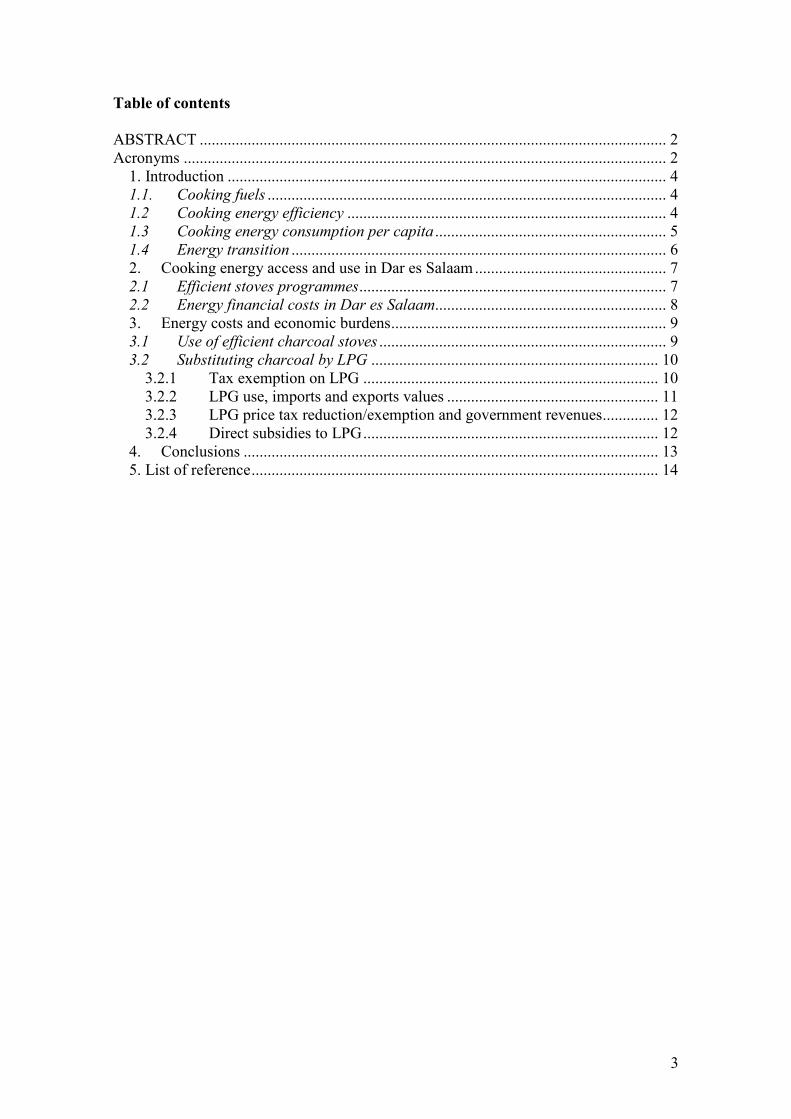
1. Introduction .............................................................................................................. 4 1.1. Cooking fuels .................................................................................................... 4 1.2 Cooking energy efficiency ................................................................................ 4 1.3 Cooking energy consumption per capita .......................................................... 5 1.4 Energy transition .............................................................................................. 6 2. Cooking energy access and use in Dar es Salaam................................................ 7 2.1 Efficient stoves programmes............................................................................. 7 2.2 Energy financial costs in Dar es Salaam.......................................................... 8 3. Energy costs and economic burdens..................................................................... 9 3.1 Use of efficient charcoal stoves ........................................................................ 9 3.2 Substituting charcoal by LPG ........................................................................ 10
3.2.1 Tax exemption on LPG .......................................................................... 10 3.2.2 LPG use, imports and exports values ..................................................... 11 3.2.3 LPG price tax reduction/exemption and government revenues.............. 12 3.2.4 Direct subsidies to LPG.......................................................................... 12
4. Conclusions ........................................................................................................ 13 5. List of reference...................................................................................................... 14
4
1. INTRODUCTION
1.1. COOKING FUELS WEC (1999) groups household cooking fuels in three main categories: traditional (animal dung, agricultural residues and firewood), intermediate (charcoal, kerosene) and modern2 (liquefied petroleum gas - LPG, and electricity). More than half of the world population uses solid fuels from biomass and coal (UNDP/World Bank, 2002). Cooking and heating are the most important applications in most of poor households in the developing countries contributing from 90%-100% of the total household energy consumption (WEC, 1999).
Traditional fuels, normally available locally at low or no cost, are characterized by low combustion efficiency many times cited around 10% (Kammen, 1995; WEC, 1999; Goldemberg and Villaneuva, 2003). Poor combustion efficiency leads to emission of carbon dioxide (CO2), methane (CH4) and nitrous oxide (N2O) which leads to increase of greenhouse gases when the rate of consumption of biomass is higher than its replacement. Also, the use of traditional fuels is associated with elevated emission of suspended particles such as PM10 and PM2.5 in the air. Emission levels of these substances in indoor environment of most rural poor households are as high as 20 times more than recommended limits of the World Health Organization (WHO) and the United States Environment Protection Agency (USEPA). High concentration of indoor air pollution increases the risk of acute respiratory infections (ARI) and other diseases such as cancer and tuberculosis. These infections are among the four major causes of diseases and deaths in the developing countries (Bruce et al., 2002 a,b). ARI causes 4 million deaths each year among children under 5 years. More than one million people, mostly women and children, are victims of indoor air pollution as they stay large part of the day in kitchen preparing foodstuffs.
On the other hand, modern fuels are normally commercialized, more expensive and are characterized by high combustion efficiency of around 30-60%. The use of fossil fuels contributes to the increase of greenhouse gases and global warming. These fuels are usually more expensive in rural areas due to high import and distribution costs. Moreover, their prices vary according to the oil price in the international market.
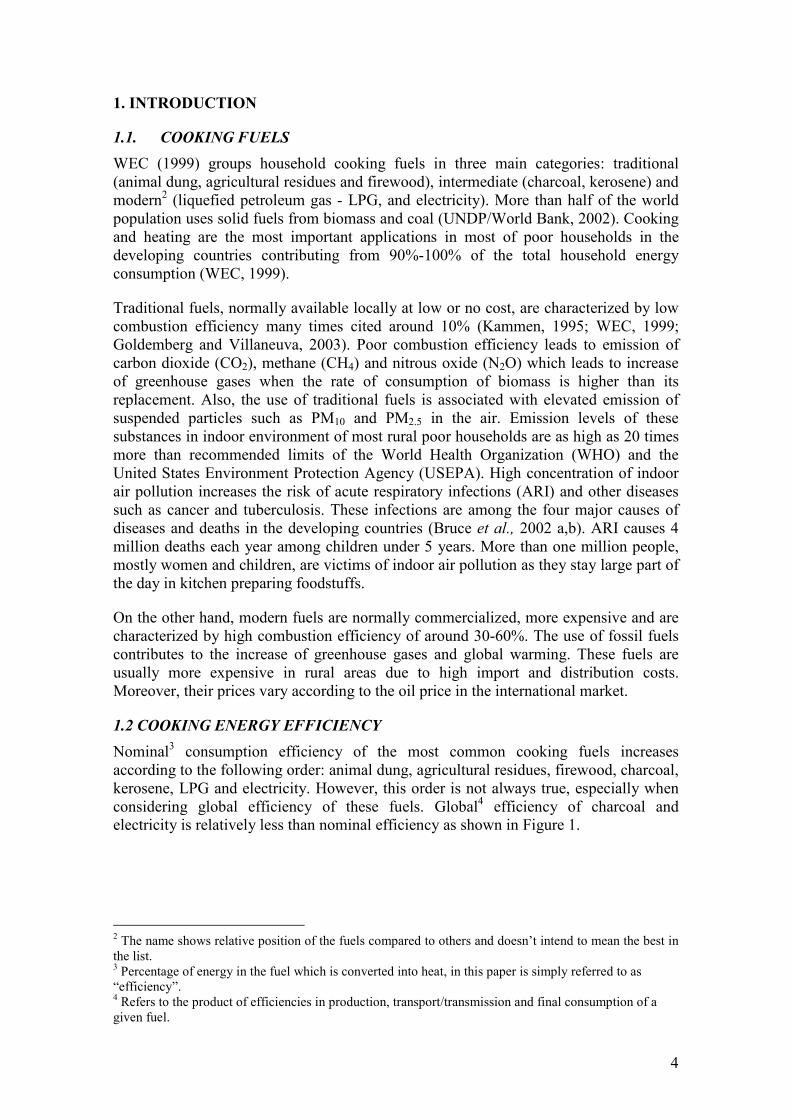
1.2 COOKING ENERGY EFFICIENCY Nominal3 consumption efficiency of the most common cooking fuels increases according to the following order: animal dung, agricultural residues, firewood, charcoal, kerosene, LPG and electricity. However, this order is not always true, especially when considering global efficiency of these fuels. Global4 efficiency of charcoal and electricity is relatively less than nominal efficiency as shown in Figure 1.
2 The name shows relative position of the fuels compared to others and doesn’t intend to mean the best in the list. 3 Percentage of energy in the fuel which is converted into heat, in this paper is simply referred to as “efficiency”. 4 Refers to the product of efficiencies in production, transport/transmission and final consumption of a given fuel.
5
DieselCogenerationCoal
Hidro
0
20
40
60
TAD TAR TF TC EF EC KW KP GLP EE
Effi
cien
cy[%
] Nominal EfficiencyGlobal Efficiency
Figure 1: Variation of nominal and global efficiency and type of stove and fuel
Where:
TAD, TAR, TF and TC: traditional stoves for animal dung, agricultural residues, firewood and charcoal; EF and EC: efficient stoves for firewood and charcoal; KW and KP: wick and pressurized kerosene stoves, LPG and EE: LPG and electric stoves.
Source: Reddy et al. (1997) and elaborations adapted from UNDP (2000).
The maximum charcoal production efficiency is only 35% while electricity generation efficiency is around 40% for diesel generator, 70% for cogeneration plant and less than 30% for a coal plant. Apart from that, in case of electricity, there are transmission and distribution losses of about 15%.
1.3 COOKING ENERGY CONSUMPTION PER CAPITA Cooking energy consumption per capita for a given type of foodstuff varies significantly depending on stove’s efficiency and type of fuel. The consumption of firewood or agricultural residues in food preparation varies from 11.5 to 45 MJ/day/person or 10.3 GJ/year/person. (WEC, 1999). In Bangladesh, for example, between 1970 and 1982, per capita cooking energy consumption varied from 1.6 to 8.1 GJ/year with an average value around 4.7 GJ/year (Ali, 2002). Geller and Dutt (1983) citing Astra (1981) shows that per capita final energy5 consumption in South India, in the beginning of the 80’s, used to be around 8.0 GJ/year, a comparable value as observed by Ali (2002).
In household where there is employment of modern fuels, per capita final energy use varies from 2 to 3 MJ/day (WEC, 1999). In the 70s, average cooking energy consumption in the United States was ranging from 1.5 to 2.0 GJ/year using gas stove (Openshaw, 1978 in Geller and Dutt, 1983). In Brazil, for example, useful energy6
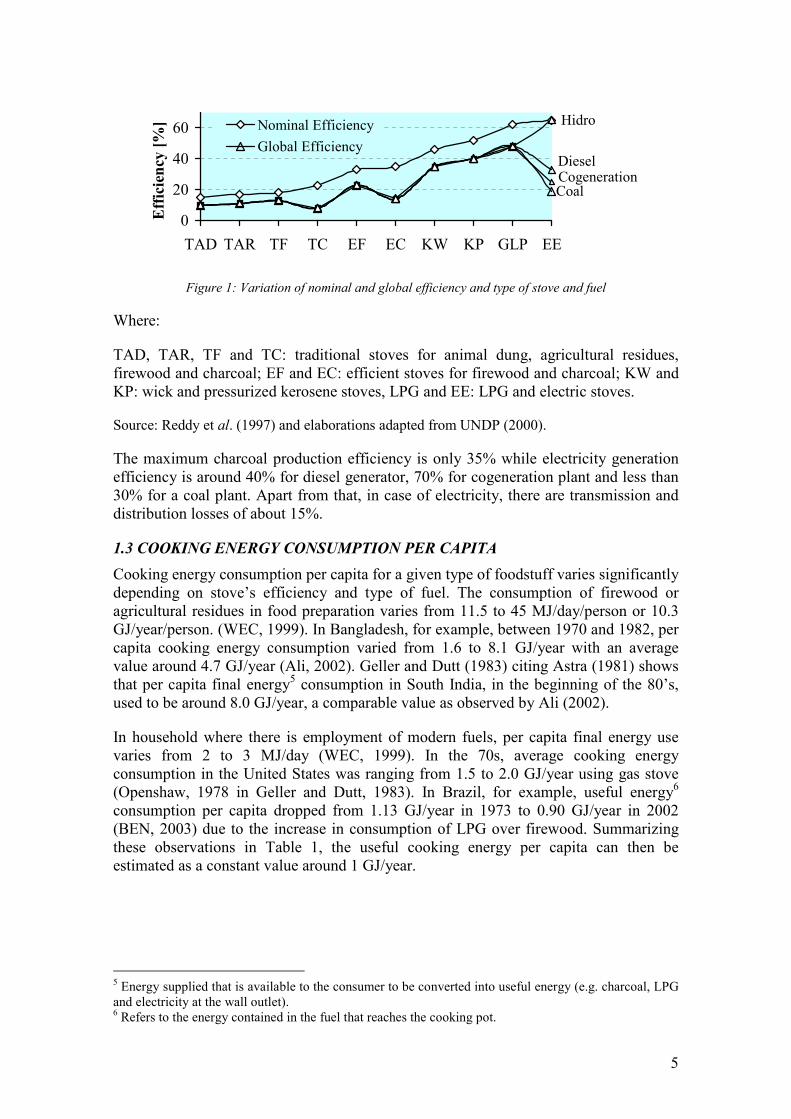
consumption per capita dropped from 1.13 GJ/year in 1973 to 0.90 GJ/year in 2002 (BEN, 2003) due to the increase in consumption of LPG over firewood. Summarizing these observations in Table 1, the useful cooking energy per capita can then be estimated as a constant value around 1 GJ/year.
5 Energy supplied that is available to the consumer to be converted into useful energy (e.g. charcoal, LPG and electricity at the wall outlet). 6 Refers to the energy contained in the fuel that reaches the cooking pot.
6
Table 1: Consumption of useful cooking energy per capita
Average 1.046 Source: Own elaboration from authors in the first column.
1.4 ENERGY TRANSITION Cooking energy transition is a long term transitional process which occurs when there is increase in the consumption of modern fuels and/or decrease in the consumption of traditional fuels. Energy transition is usually accompanied by reduction in per capita energy consumption due to the use of efficient stoves and fuels. For example, in Brazil, the contribution of firewood in the household cooking fuel consumption decreased from almost 90% in 1973 to 47% in 1996 (BEN, 2003). On the other hand, in the same period the participation of LPG increased from 8% to 49%.
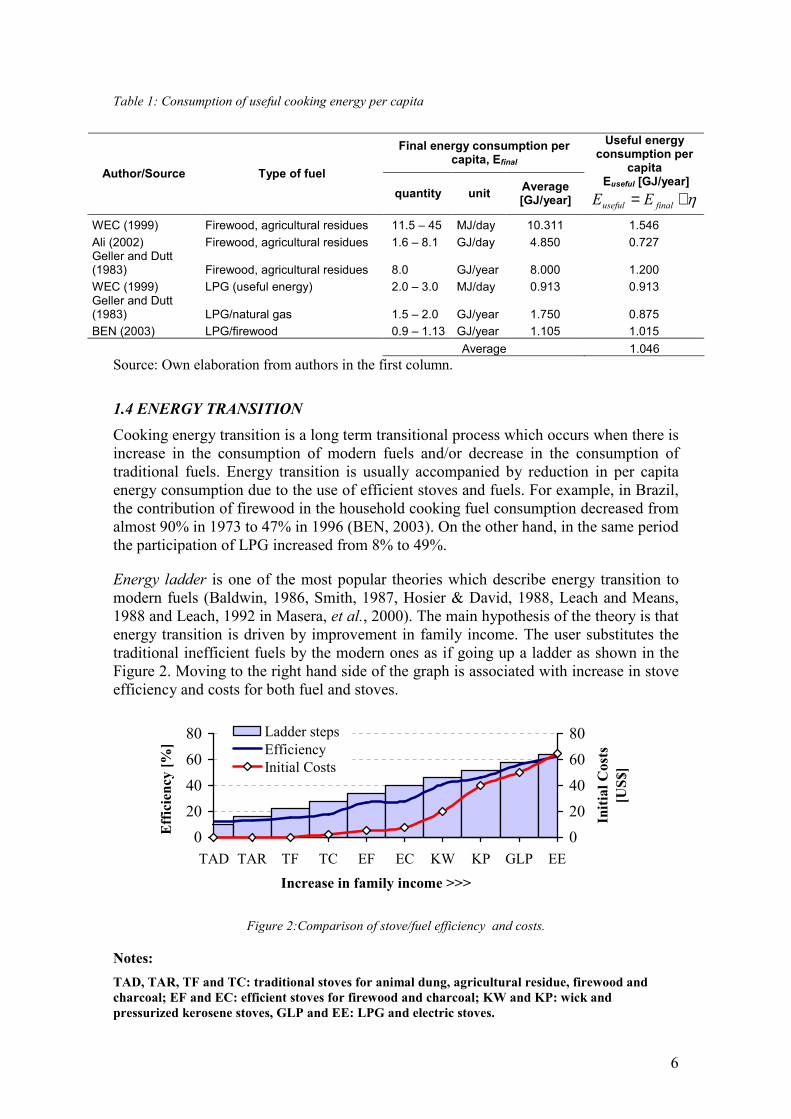
Energy ladder is one of the most popular theories which describe energy transition to modern fuels (Baldwin, 1986, Smith, 1987, Hosier & David, 1988, Leach and Means, 1988 and Leach, 1992 in Masera, et al., 2000). The main hypothesis of the theory is that energy transition is driven by improvement in family income. The user substitutes the traditional inefficient fuels by the modern ones as if going up a ladder as shown in the Figure 2. Moving to the right hand side of the graph is associated with increase in stove efficiency and costs for both fuel and stoves.
020406080
TAD TAR TF TC EF EC KW KP GLP EE
Increase in family income >>>
Effic
ienc
y[%
]
020406080
Initi
alC
osts
[US$
]
Ladder stepsEfficiencyInitial Costs
Figure 2:Comparison of stove/fuel efficiency and costs.
Notes: TAD, TAR, TF and TC: traditional stoves for animal dung, agricultural residue, firewood and charcoal; EF and EC: efficient stoves for firewood and charcoal; KW and KP: wick and pressurized kerosene stoves, GLP and EE: LPG and electric stoves.
7
Source: Own elaborations from Reddy et al. (1997).
However it has been proved that fuel choice and energy transition does not only depend on family income. There are various other factors on demand and supply sides. Masera et al. (2000) shows that energy transition is a function of (a) cost and affordability, (b) efficiency and convenience in use, (c) culture, and (d) amount of emissions per quantity of energy produced. The authors add that energy transition is a bi-directional process, as the users can go up the energy ladder, they can also go down and continue using traditional fuels. It is very rare that the use of biomass fuels can be completely substituted, even with high availability of modern fuels (Reddy et al., 1997; Jannuzzi, 1991; WEC, 1999; Davis, 1998; and Mehlwana and Qase, 1996).
2. COOKING ENERGY ACCESS AND USE IN DAR ES SALAAM
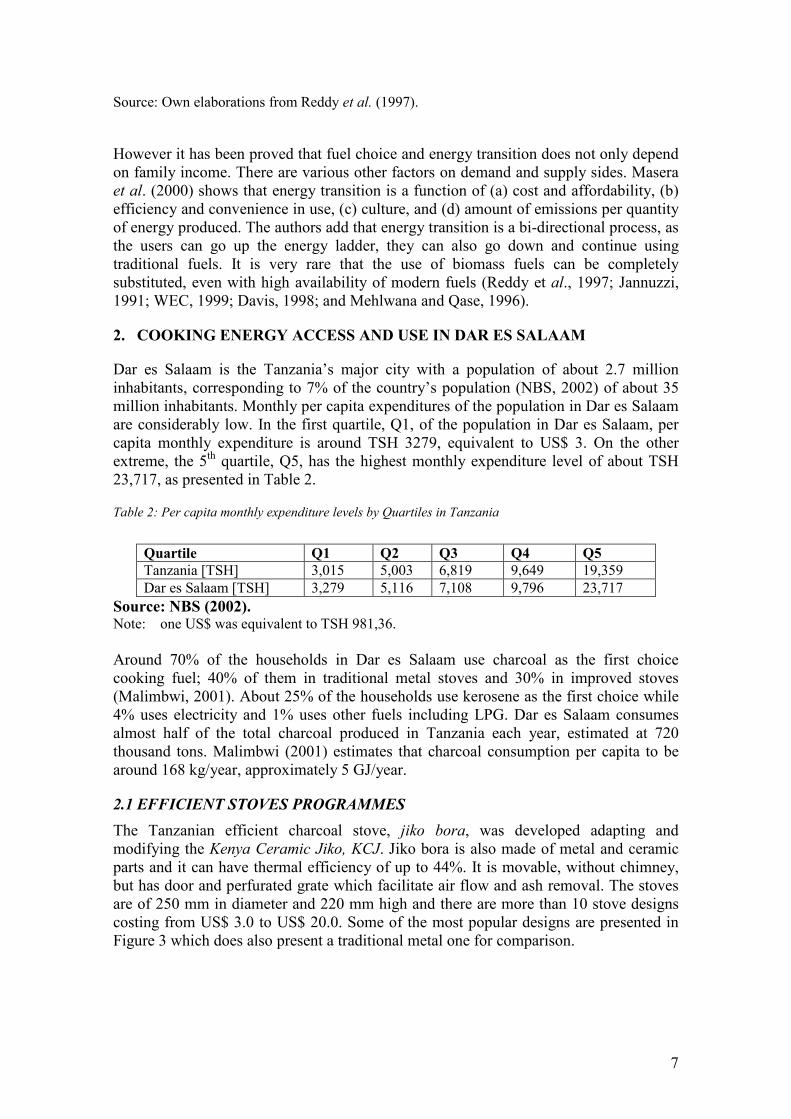
Dar es Salaam is the Tanzania’s major city with a population of about 2.7 million inhabitants, corresponding to 7% of the country’s population (NBS, 2002) of about 35 million inhabitants. Monthly per capita expenditures of the population in Dar es Salaam are considerably low. In the first quartile, Q1, of the population in Dar es Salaam, per capita monthly expenditure is around TSH 3279, equivalent to US$ 3. On the other extreme, the 5th quartile, Q5, has the highest monthly expenditure level of about TSH 23,717, as presented in Table 2.
Table 2: Per capita monthly expenditure levels by Quartiles in Tanzania
Quartile Q1 Q2 Q3 Q4 Q5 Tanzania [TSH] 3,015 5,003 6,819 9,649 19,359 Dar es Salaam [TSH] 3,279 5,116 7,108 9,796 23,717
Source: NBS (2002). Note: one US$ was equivalent to TSH 981,36. Around 70% of the households in Dar es Salaam use charcoal as the first choice cooking fuel; 40% of them in traditional metal stoves and 30% in improved stoves (Malimbwi, 2001). About 25% of the households use kerosene as the first choice while 4% uses electricity and 1% uses other fuels including LPG. Dar es Salaam consumes almost half of the total charcoal produced in Tanzania each year, estimated at 720 thousand tons. Malimbwi (2001) estimates that charcoal consumption per capita to be around 168 kg/year, approximately 5 GJ/year.
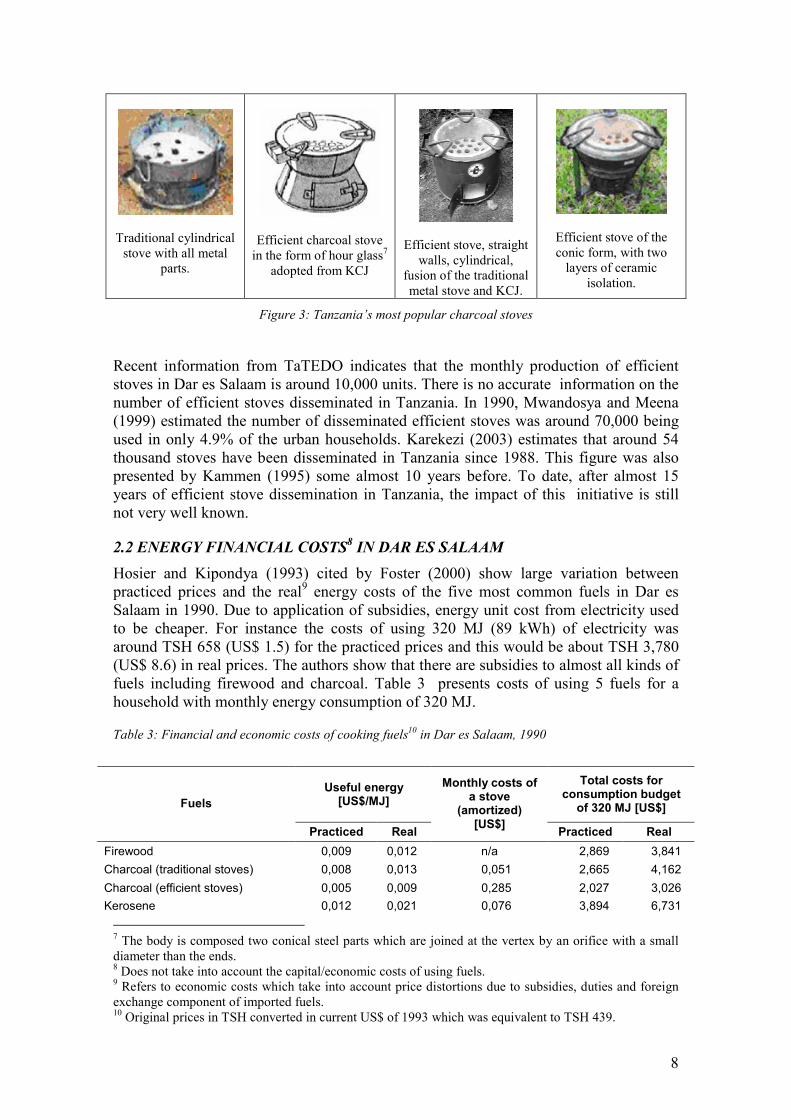
2.1 EFFICIENT STOVES PROGRAMMES The Tanzanian efficient charcoal stove, jiko bora, was developed adapting and modifying the Kenya Ceramic Jiko, KCJ. Jiko bora is also made of metal and ceramic parts and it can have thermal efficiency of up to 44%. It is movable, without chimney, but has door and perfurated grate which facilitate air flow and ash removal. The stoves are of 250 mm in diameter and 220 mm high and there are more than 10 stove designs costing from US$ 3.0 to US$ 20.0. Some of the most popular designs are presented in Figure 3 which does also present a traditional metal one for comparison.
8
Traditional cylindrical stove with all metal
parts.
Efficient charcoal stove in the form of hour glass7
adopted from KCJ
Efficient stove, straight walls, cylindrical,
fusion of the traditional metal stove and KCJ.
Efficient stove of the conic form, with two
layers of ceramic isolation.
Figure 3: Tanzania’s most popular charcoal stoves
Recent information from TaTEDO indicates that the monthly production of efficient stoves in Dar es Salaam is around 10,000 units. There is no accurate information on the number of efficient stoves disseminated in Tanzania. In 1990, Mwandosya and Meena (1999) estimated the number of disseminated efficient stoves was around 70,000 being used in only 4.9% of the urban households. Karekezi (2003) estimates that around 54 thousand stoves have been disseminated in Tanzania since 1988. This figure was also presented by Kammen (1995) some almost 10 years before. To date, after almost 15 years of efficient stove dissemination in Tanzania, the impact of this initiative is still not very well known.
2.2 ENERGY FINANCIAL COSTS8 IN DAR ES SALAAM Hosier and Kipondya (1993) cited by Foster (2000) show large variation between practiced prices and the real9 energy costs of the five most common fuels in Dar es Salaam in 1990. Due to application of subsidies, energy unit cost from electricity used to be cheaper. For instance the costs of using 320 MJ (89 kWh) of electricity was around TSH 658 (US$ 1.5) for the practiced prices and this would be about TSH 3,780 (US$ 8.6) in real prices. The authors show that there are subsidies to almost all kinds of fuels including firewood and charcoal. Table 3 presents costs of using 5 fuels for a household with monthly energy consumption of 320 MJ.
Table 3: Financial and economic costs of cooking fuels10 in Dar es Salaam, 1990
7 The body is composed two conical steel parts which are joined at the vertex by an orifice with a small diameter than the ends. 8 Does not take into account the capital/economic costs of using fuels. 9 Refers to economic costs which take into account price distortions due to subsidies, duties and foreign exchange component of imported fuels. 10 Original prices in TSH converted in current US$ of 1993 which was equivalent to TSH 439.
Source: Adapted from Hosier and Kipondya (1993) in Foster (2000).
Almost ten years after the observation by Hosier and Kipondya (1993) in Foster (2000), TaTEDO (2001), in Table 4, shows that the use of charcoal in efficient stoves is still the cheapest alternative. During the ten years, the unit cost of firewood and kerosene has increased by three times while it has been four and seven times for charcoal and LPG respectively. The prices of LPG and electricity have suffered major increase unlike other fuels which could mean removal of subsidies from the two fuels. Cost ratio of unit energy from LPG and charcoal in efficient stove has increased by two times.
Table 4: Cooking energy costs in Dar es Salaam, in April 2002
The evolution of charcoal prices between 1995 and 2000 shows a linear increase from TSH 1,000/bag to TSH 3,800/bag (Malimbwi, 2001). When these prices are converted in current US$, they show a decrease from US$ 5/bag to US$ 4.5 between 1999 and 2000. In economics this suggests higher charcoal supply than demand and the price increase in the local currency is only attributed by inflation. An average charcoal price during this period is US$ 4/bag or US$ 0.14/kg, consistent with the data presented by TaTEDO (2001) in Table 3.
3. ENERGY COSTS AND ECONOMIC BURDENS
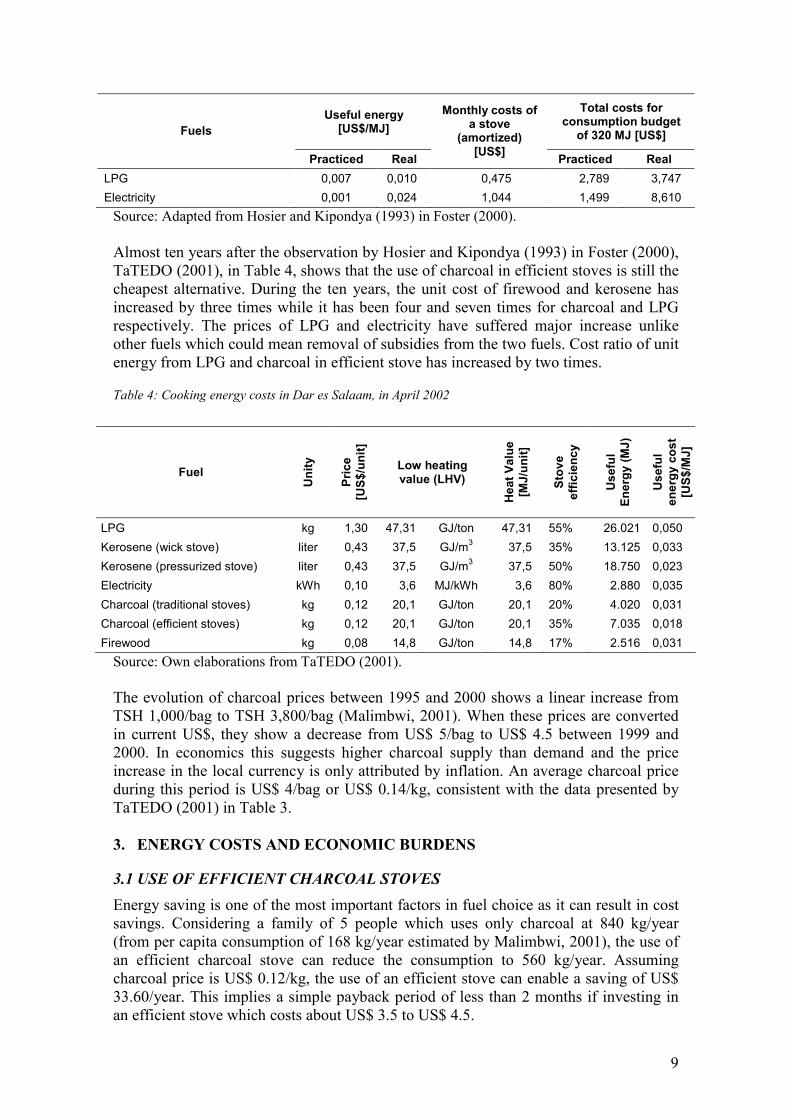
3.1 USE OF EFFICIENT CHARCOAL STOVES Energy saving is one of the most important factors in fuel choice as it can result in cost savings. Considering a family of 5 people which uses only charcoal at 840 kg/year (from per capita consumption of 168 kg/year estimated by Malimbwi, 2001), the use of an efficient charcoal stove can reduce the consumption to 560 kg/year. Assuming charcoal price is US$ 0.12/kg, the use of an efficient stove can enable a saving of US$ 33.60/year. This implies a simple payback period of less than 2 months if investing in an efficient stove which costs about US$ 3.5 to US$ 4.5.
10
Using information on per capita expenditure in Table 2 and per capita useful energy consumption of 1 GJ/year in Table 1, it can be observed that substituting inefficient charcoal stoves by efficient ones reduces significantly the proportion of energy expenditures for families in quartiles Q1, (42% to 28%), Q2 (27% to 18%) and Q3 (19 to 13%) (Figure 4). For the families in Q4 and Q5 energy costs are less than 10%11 of the annual expenditures if using efficient charcoal stoves.
0%10%20%30%40%50%
Q1 Q2 Q3 Q4 Q5
Prop
ortio
nof
ener
gyex
pend
iture
s Traditional stoveEfficient stove10% of Expenditures
Figure 4: Percentage of energy costs in family annual expenditures
3.2 SUBSTITUTING CHARCOAL BY LPG 3.2.1 Tax exemption on LPG
Taxes and distribution margins constitute up to 60% of LPG retail price (TaTEDO, 2001). Table 5 compares the financial costs of using LPG and charcoal. More recently, tax relief from TSH 288/kg to TSH 144/kg, almost US$ 0.11/kg has reduced the proportion of taxes from 40% to 30%. If LPG had been 100% tax exempted, its price would drop to US$ 0.86/kg making it more affordable to consumers although this could mean a reduction in government revenues.
Table 5: Comparison of the financial costs of using charcoal and LPG
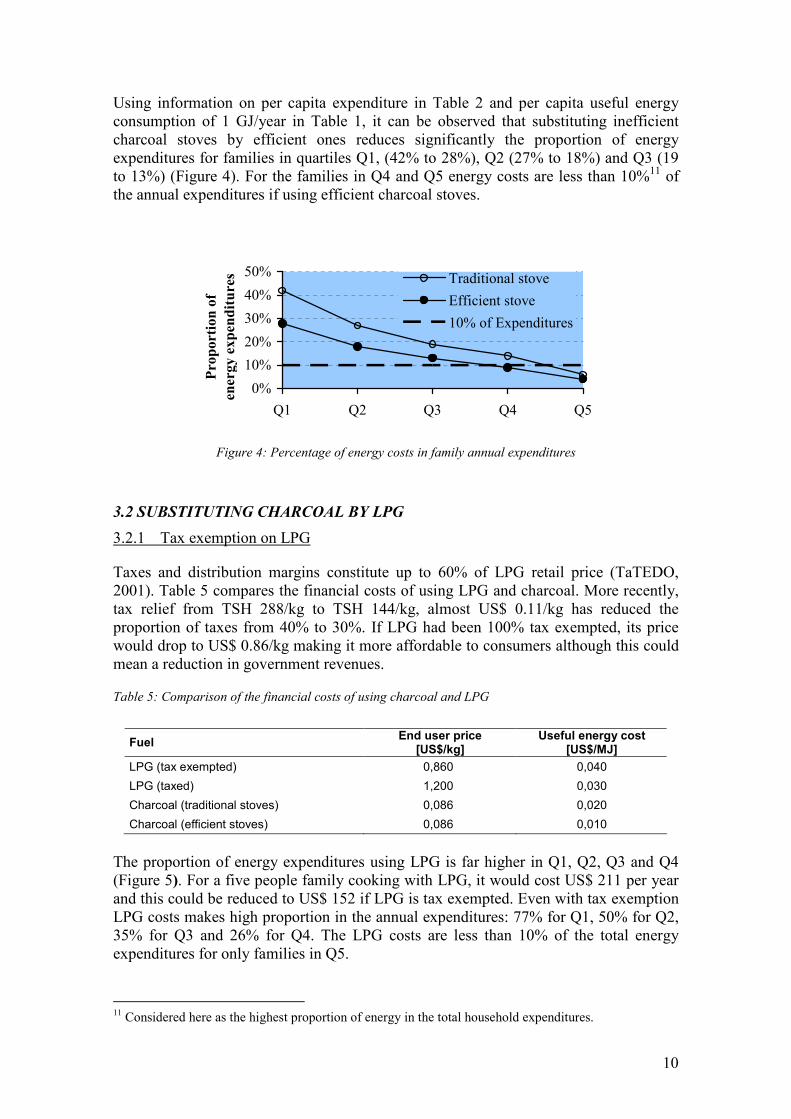
The proportion of energy expenditures using LPG is far higher in Q1, Q2, Q3 and Q4 (Figure 5). For a five people family cooking with LPG, it would cost US$ 211 per year and this could be reduced to US$ 152 if LPG is tax exempted. Even with tax exemption LPG costs makes high proportion in the annual expenditures: 77% for Q1, 50% for Q2, 35% for Q3 and 26% for Q4. The LPG costs are less than 10% of the total energy expenditures for only families in Q5.
11 Considered here as the highest proportion of energy in the total household expenditures.
11
0%
40%
80%
120%
Q1 Q2 Q3 Q4 Q5
Prop
ortio
nof
ener
gyex
pend
iture LPG (tax exempted
LPG (taxed)
f
Figure 5: Percentage of LPG costs in annual family expenditures
3.2.2 LPG use, imports and exports values
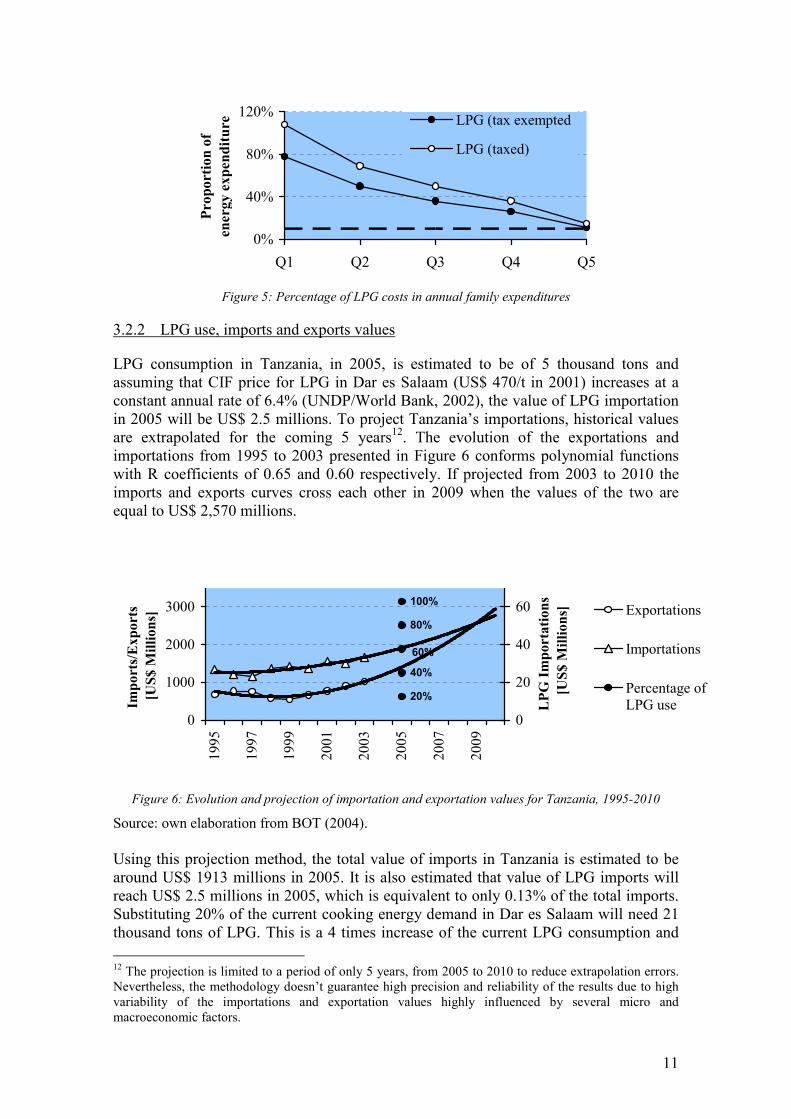
LPG consumption in Tanzania, in 2005, is estimated to be of 5 thousand tons and assuming that CIF price for LPG in Dar es Salaam (US$ 470/t in 2001) increases at a constant annual rate of 6.4% (UNDP/World Bank, 2002), the value of LPG importation in 2005 will be US$ 2.5 millions. To project Tanzania’s importations, historical values are extrapolated for the coming 5 years12. The evolution of the exportations and importations from 1995 to 2003 presented in Figure 6 conforms polynomial functions with R coefficients of 0.65 and 0.60 respectively. If projected from 2003 to 2010 the imports and exports curves cross each other in 2009 when the values of the two are equal to US$ 2,570 millions.
20%
40%
60%
80%
100%
0
1000
2000
3000
1995
1997
1999
2001
2003
2005
2007
2009
Impo
rts/
Exp
orts
[US$
Mill
ions
]
0
20
40
60
LPG
Impo
rtat
ions
[US$
Mill
ions
] Exportations
Importations
Percentage ofLPG use
Figure 6: Evolution and projection of importation and exportation values for Tanzania, 1995-2010
Source: own elaboration from BOT (2004).
Using this projection method, the total value of imports in Tanzania is estimated to be around US$ 1913 millions in 2005. It is also estimated that value of LPG imports will reach US$ 2.5 millions in 2005, which is equivalent to only 0.13% of the total imports. Substituting 20% of the current cooking energy demand in Dar es Salaam will need 21 thousand tons of LPG. This is a 4 times increase of the current LPG consumption and 12 The projection is limited to a period of only 5 years, from 2005 to 2010 to reduce extrapolation errors. Nevertheless, the methodology doesn’t guarantee high precision and reliability of the results due to high variability of the importations and exportation values highly influenced by several micro and macroeconomic factors.
12
implies importation costs of US$ 12.6 millions, equivalent to 0.66% of the projected value of importations in 2005. Even with 100% LPG use, this proportion is only 3.3%, still considered small and it can be observed therefore that LPG importations will not significantly increase total importation values.
3.2.3 LPG price tax reduction/exemption and government revenues
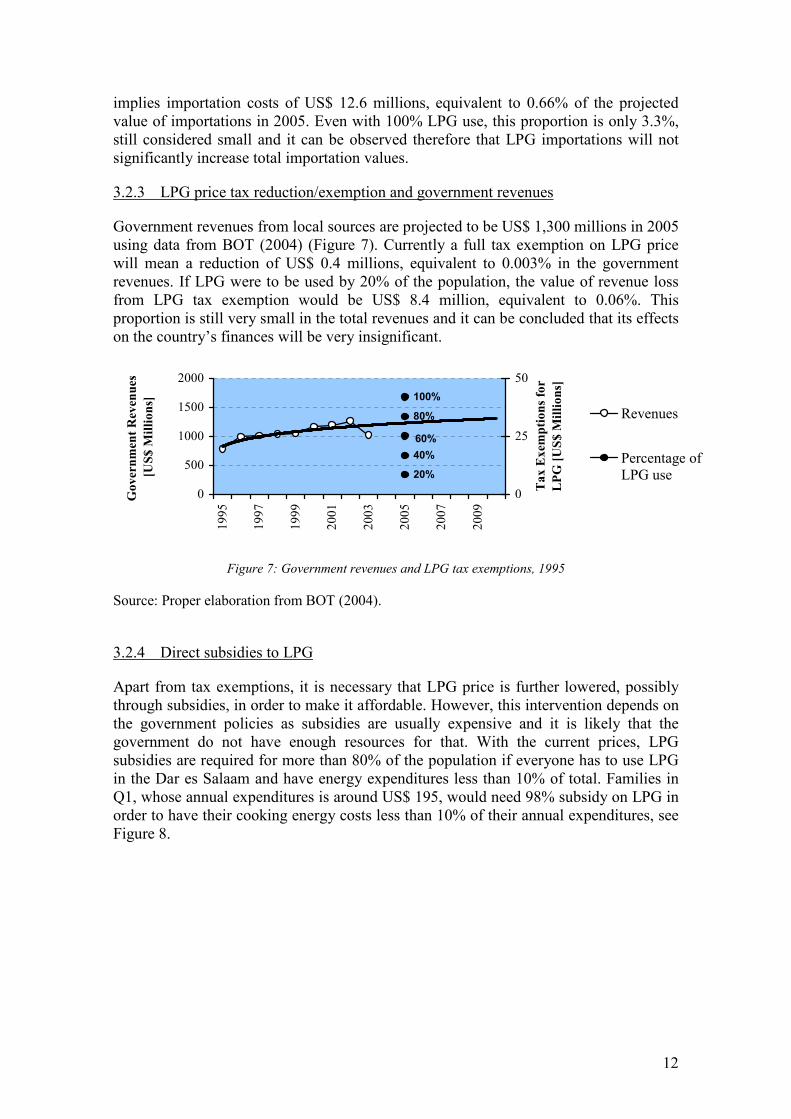
Government revenues from local sources are projected to be US$ 1,300 millions in 2005 using data from BOT (2004) (Figure 7). Currently a full tax exemption on LPG price will mean a reduction of US$ 0.4 millions, equivalent to 0.003% in the government revenues. If LPG were to be used by 20% of the population, the value of revenue loss from LPG tax exemption would be US$ 8.4 million, equivalent to 0.06%. This proportion is still very small in the total revenues and it can be concluded that its effects on the country’s finances will be very insignificant.
20%
40%60%
80%
100%
0
500
1000
1500
2000
1995
1997
1999
2001
2003
2005
2007
2009
Gov
ernm
entR
even
ues
[US$
Mill
ions
]
0
25
50
Tax
Exe
mpt
ions
for
LPG
[US$
Mill
ions
]
Revenues
Percentage ofLPG use
Figure 7: Government revenues and LPG tax exemptions, 1995
Source: Proper elaboration from BOT (2004).
3.2.4 Direct subsidies to LPG
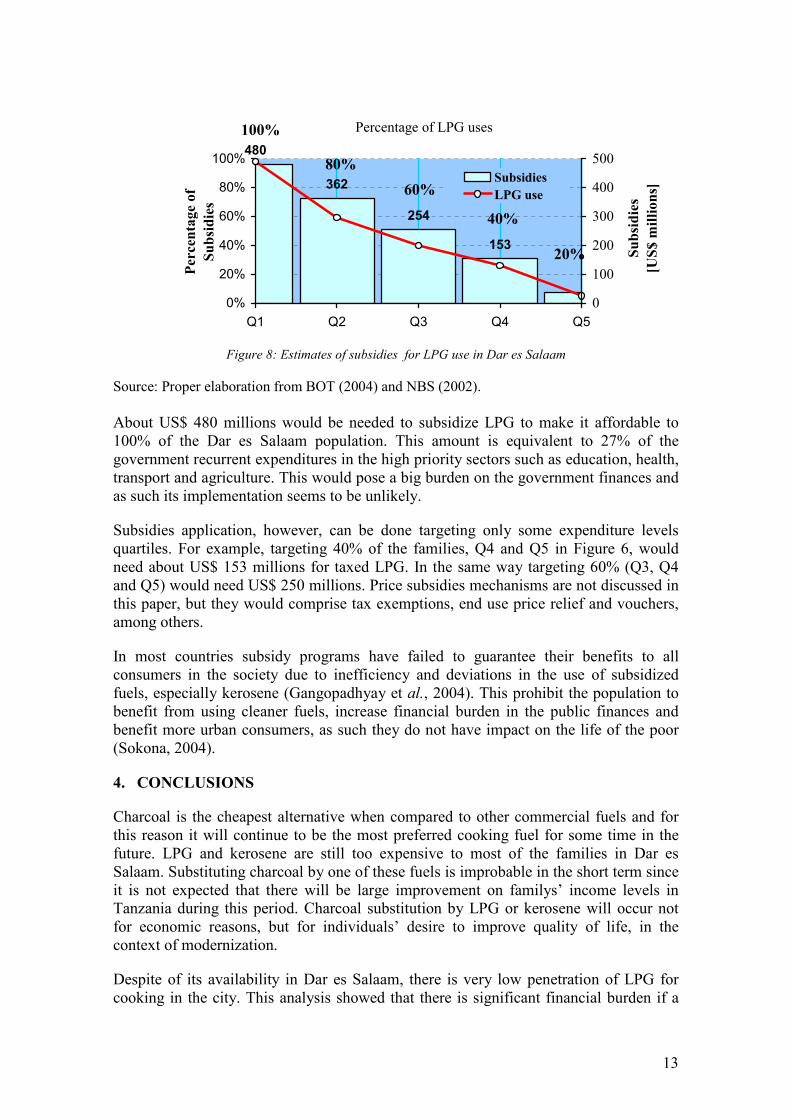
Apart from tax exemptions, it is necessary that LPG price is further lowered, possibly through subsidies, in order to make it affordable. However, this intervention depends on the government policies as subsidies are usually expensive and it is likely that the government do not have enough resources for that. With the current prices, LPG subsidies are required for more than 80% of the population if everyone has to use LPG in the Dar es Salaam and have energy expenditures less than 10% of total. Families in Q1, whose annual expenditures is around US$ 195, would need 98% subsidy on LPG in order to have their cooking energy costs less than 10% of their annual expenditures, see Figure 8.
13
Figure 8: Estimates of subsidies for LPG use in Dar es Salaam
Source: Proper elaboration from BOT (2004) and NBS (2002).
About US$ 480 millions would be needed to subsidize LPG to make it affordable to 100% of the Dar es Salaam population. This amount is equivalent to 27% of the government recurrent expenditures in the high priority sectors such as education, health, transport and agriculture. This would pose a big burden on the government finances and as such its implementation seems to be unlikely.
Subsidies application, however, can be done targeting only some expenditure levels quartiles. For example, targeting 40% of the families, Q4 and Q5 in Figure 6, would need about US$ 153 millions for taxed LPG. In the same way targeting 60% (Q3, Q4 and Q5) would need US$ 250 millions. Price subsidies mechanisms are not discussed in this paper, but they would comprise tax exemptions, end use price relief and vouchers, among others.
In most countries subsidy programs have failed to guarantee their benefits to all consumers in the society due to inefficiency and deviations in the use of subsidized fuels, especially kerosene (Gangopadhyay et al., 2004). This prohibit the population to benefit from using cleaner fuels, increase financial burden in the public finances and benefit more urban consumers, as such they do not have impact on the life of the poor (Sokona, 2004).
4. CONCLUSIONS
Charcoal is the cheapest alternative when compared to other commercial fuels and for this reason it will continue to be the most preferred cooking fuel for some time in the future. LPG and kerosene are still too expensive to most of the families in Dar es Salaam. Substituting charcoal by one of these fuels is improbable in the short term since it is not expected that there will be large improvement on familys’ income levels in Tanzania during this period. Charcoal substitution by LPG or kerosene will occur not for economic reasons, but for individuals’ desire to improve quality of life, in the context of modernization.
Despite of its availability in Dar es Salaam, there is very low penetration of LPG for cooking in the city. This analysis showed that there is significant financial burden if a
480
362
254
153 20%
40%
60%80%
100%
0%
20%
40%
60%
80%
100%
Q1 Q2 Q3 Q4 Q5
Perc
enta
geof
Subs
idie
s
0
100
200
300
400
500
Percentage of LPG uses
Subs
idie
s[U
S$m
illio
ns]Subsidies
LPG use
14
household shifts to the use of LPG instead of charcoal. Recent initiative from the Government of Tanzania to reduce taxes in LPG prices was an important intervention in promoting its use, nevertheless, tax exemption alone is not enough to lower LPG prices and this suggests the need for subsidized promotion of LPG.
The study showed that end-use energy efficiency measures of low cost and fast payback (two months) for charcoal use as cooking fuel would bring significant benefits for the poorer inhabitants by significantly reducing the burden of energy costs in total family’s expenditures. It means that low-income families could use the savings for other purposes, such as food and clothing. Therefore, policies to increase the penetration rate of efficient stoves should be specifically targeted to these families as a means of cost saving and “increasing” income.
For those families who can afford LPG, another set of measures should be used to increase its use. It would promote the creation and establishment of a LPG market, nowadays still incipient, which could in the future be expanded to the poorer families. On the other hand, it is a decision that needs to take into account, for instance, the security of supply.
Tanzania doesn’t produce LPG and uncertainty in supply is the main disadvantage of over dependency on the fuel since it risks cooking energy supply in case of shortage or price increase at the world market. This emphasises on the need to develop and promote the use of other efficient fuels using domestic resources including biomass (liquid and gaseous fuels), hydro, coal and natural gas. In the meantime efforts should be directed to intensify the promotion of energy efficiency in wood fuel production and use as a transitional measure.
5. LIST OF REFERENCE
Ali, M. E., Transfer of sustainable energy technology for rural Bangladesh, opportunity for New Zealand, Discussion paper no. 02.09, Massey University, New Zealand, 2002.
Barnes, D. F., Halpen J., The role of energy subsidies, in ESMAP Energy Report 2000, The World Bank Group, 2000, available in: http://www.worldbank.org/html/fpd/esmap/energy_report2000/ch7.pdf, access date: 15/07/2004
BEN, Balanço Energético Nacional, Ministério de Minas e Energia, 2003, available in: http://www.mme.gov.br/paginasInternas.asp?url=../BEN/default.asp
BOT, Bank of Tanzania, available at www.bot-tz.org
Bruce, N., Perez-Padila R., Albalak, R., The health effects of indoor air pollution in developing countries, World Health Organization, Geneva, 2002, (b). pp.41
Bruce, N., R Perez-Padilla, and R Albalak, Indoor Air Pollution in developing countries: a major environmental and public health challenge, Bulletin of the World Health Organization, 78(9): 1078-1092, 2002(a)
Davis, M., Rural household energy consumption: the effects of access to electricity – evidence from South Africa, Energy Policy, v.26, no.3, pp.207-217, Elsevier Science, 1998.
15
Denton, F., Reducing the gap between projects and policies: comparative analysis of the “butanisation” program in Senegal and the multifunctional platform (MPF) experience in Mali, Energy for sustainable development, v.VIII, n.2, June 2004, pp.17-29.
Foster, V. Measuring the impact of energy reform - practical options, Energy and Development Report 2000, ESMAP, 2000. available at: http://www.worldbank.org/html/fpd/esmap/energy_report2000/, date: 15/06/2004.
Geller, H. S., Dutt G. S. Measuring cooking fuel economy, in Woodfuel Strategy: Forest for local community Development Program, FAO, Roma, 1983. Available at: http://www.fao.org/docrep/Q1085e/q1085e00.htm#Contents, access date: 12/05/2004.
Goldemberg, J., Villaneuva L. D., Energia, meio ambiente & desenvolvimento, São Paulo, Editora de Universidade de São Paulo, 2003, pp.232.
Karekezi, S., Socio-economic and Energy Data for Eastern and Southern Africa on Rural Energy, Renewables and the Rural Poor, available at: http://www.afrepren.org/datahandbook/rural.htm, date: 1/11/2003
Malimbwi, E. R., Charcoal potential in Southern Africa – Final Report for Tanzania, 2001. Available at: www.sei.se/chaposa/chaposaindex.html, access date: 12/05/2004.
Masera, O., Saatkamp B. D., Kammen D. M., From linear fuel switching to multiple cooking strategies; a critique and alternative to the energy ladder model, World Development, v.28, no.12, pp.2083-2103, Elsevier Science, 2000
Mehlwana, A. & Qase, N. 1996. Energy constraints in low-income households in the Western Cape, in Anthology of research, Energy and Development Research Centre, 1999.
Mwandosya, M. J., Meena E., Climate change mitigation in Southern Africa, Tanzanian Country Study, UNEP Collaborating Center on Energy and Environment, 1999. Available at: http://uneprisoe.org/economicsGHG/Tanzania.pdf, access date: 25/06/2004.
National Bureau of Statistics of Tanzania, NBS, Household Budget Survey of 2001, National Bureau of Statistics Dar es Salaam, 2002.
Reddy, A. K. N., Williams R. H., Johansson T. B., Energy after Rio, prospects and challenges. New York: United Nations Publications, 1997, pp.197,
Reddy, A. K. N., Williams R. H., Johansson T. B., Energy after Rio, prospects and challenges. New York: United Nations Publications, 1997, pp.197
Tanzania Traditional Energy Development and Environment Organization, TaTEDO, The LP Gas market in Tanzania, unpublished, TaTEDO, 2001.
United Nations Development Program, UNDP, World Energy Assessment: Energy and the challenge of sustainability, UNDP, 2000.
United Nations Development Program/World Bank, UNDP/World Bank, Access of the poor to clean household fuels in India, Energy Sector Management Assistance Program
16
(ESMAP), 2002. Available at: http://lnweb18.worldbank.org/SAR/sa.nsf/Attachments/ InHHFuel-Ch2/$File/Chapter+2.pdf, date: 12/05/2004.
USEPA, United States Environment Protection Agency, available at: http://www.epa.gov/air/criteria.html
WEC, World Energy Council, The challenge for rural energy poverty in developing countries, WEC/FAO, pp.199, October 1999. available at: http://www.worldenergy.org/wec-geis/global/downloads/rural.pdf, date of access: 16/02/2004.