TRB 6 th International Bridge Engineering Conference July 17-20, 2005 Implementation of Physical Testing Implementation of Physical Testing for Typical Bridge Load and for Typical Bridge Load and Superload Superload Rating Rating Bridge Engineering Center Iowa State University Phares, Wipf, Klaiber, Abu-Hawash, Neubauer
Transcript
TRB 6th International Bridge Engineering Conference July 17-20, 2005
Implementation of Physical Testing Implementation of Physical Testing for Typical Bridge Load and for Typical Bridge Load and SuperloadSuperload RatingRating
Bridge Engineering CenterIowa State University
Phares, Wipf, Klaiber, Abu-Hawash, Neubauer
Bridge RatingBridge RatingBridge Rating
Evaluation based on:– Visual inspection– Code based
Iowa has 25,000 bridges – 4,000 on primary highway system
Invest in innovative solutions to supplement existing rating procedure
Iowa Load Testing NeedsIowa Load Testing NeedsIowa Load Testing NeedsMore accurate ratings for:– Older bridges with unknown or
insufficient design data– Assessing need for temporary load
restriction on damaged bridges– Possibly reducing the number of bridges
that restrict a reasonable flow of overweight trucks
Iowa Load Testing NeedsIowa Load Testing NeedsIowa Load Testing NeedsMore accurate ratings for:– Verifying the need for and the effectiveness
of new strengthening techniques– Removing load restrictions imposed on
additional bridges due to the implementation of new weight laws
– To determine the behavior of structures under heavy load (superload) that have calculated load ratings below anticipated capacity needs
The ProblemThe ProblemThe Problem
Unknown bridge conditions– Live load distribution– End restraint– Edge stiffening– Composite action– Effectiveness of specific bridge details– Other details contributing to bridge
capacity
Other MethodsOther MethodsOther Methods
Proof load testing Destructive testing (laboratory) – Use to complement diagnostic testing for
better understanding
The Diagnostic Testing SolutionThe Diagnostic Testing SolutionThe Diagnostic Testing Solution
Physical testing to understand the specific characteristics of each bridgeField collected data to calibrate a bridge computer modelAccurate, calibrated computer model to determine bridge response to rating vehicles and other loads
Hardwired strain gages
Wireless truck position indicator
Engineering based data interpretation
Structural modeling
Model analysis and optimization with field collected data
Accurate Assessment
Diagnostic Testing of a Bridge-Brief Case StudyDiagnostic Testing of a BridgeDiagnostic Testing of a Bridge--Brief Case StudyBrief Case StudyCarries US 6 over a small stream21.34 m single spanTwo main girders w/ floor beams & stringersWelded plates & strengthening angle on girders
InstrumentationInstrumentationInstrumentation
36 Intelliducers at 17 locations usedFocused on:– Effectiveness of angles– End restraint– Load distribution
Instrumented:– Both girders– Typical floor beam and
stringers
Test ResultsTest ResultsTest Results
Strengthening angles are effectiveL7 (Mid-span of N girder) for Path Y1
-10
0
10
20
30
40
50
60
0 5 10 15 20 25 30
Truck Position (m)
Mic
rost
rain
(mm
/mm
) Top FlangeAngleBottom Flange
Test ResultsTest ResultsTest Results
Significant end restraint identifiedL1 (E Abut. For N girder) for Path Y2
-30
-20
-10
0
10
20
30
0 5 10 15 20 25 30
Truck Position (m)
Mic
rost
rain
(mm
/mm
) Top Flange
Bottom
Test ResultsTest ResultsTest Results
Composite action determined
L12 (Mid-span of stringer) for Path Y3
-100
102030405060
0 5 10 15 20 25 30
Truck Position (m)
Mic
rost
rain
(mm
/mm
)
Top Flange
Bottom Flange
L7-Y1 Neutral Axis Location
-1.0
-0.5
0.0
0.5
1.0
1.5
2.0
0 5 10 15 20 25 30
Truck Position (m)
NA
from
Bot
tom
Fl
ange
(m)
LFD Rating for HS-20 VehicleLFD Rating for HSLFD Rating for HS--20 Vehicle20 Vehicle
Conventional AASHTO LFD Shear (stringer)– 2.44
Flexure (girder)– 2.39
WinSAC LFD
Shear (stringer)– 1.79
Flexure (floor bm)– 3.67
Results of Diagnostic TestingResults of Diagnostic TestingResults of Diagnostic Testing
General increase in flexural rating of all membersShear rating decreased and controlled for this bridgeEffectiveness of unknown structural elements identified
Summer 2003 – Passage of 6 superloadsranging from 600,000 lb. to 900,000 lb.Most bridges along route acceptable by traditional calculationsHand calculations for one bridge –rating factor of approximately 0.5Physical test needed
Six pre-stressed concrete girder linesCritical span~ 122 ft (37 m)40 ft (12 m) roadwaycarrying twolanes of traffic
Initial TestingInitial TestingInitial Testing
Tested with combinations of one and two loaded tandem axle dump trucksMuch learned about behavior– Composite action– End restraint– Live load distribution
» Improved load distribution characteristics used in hand calculations changed RF to 0.9
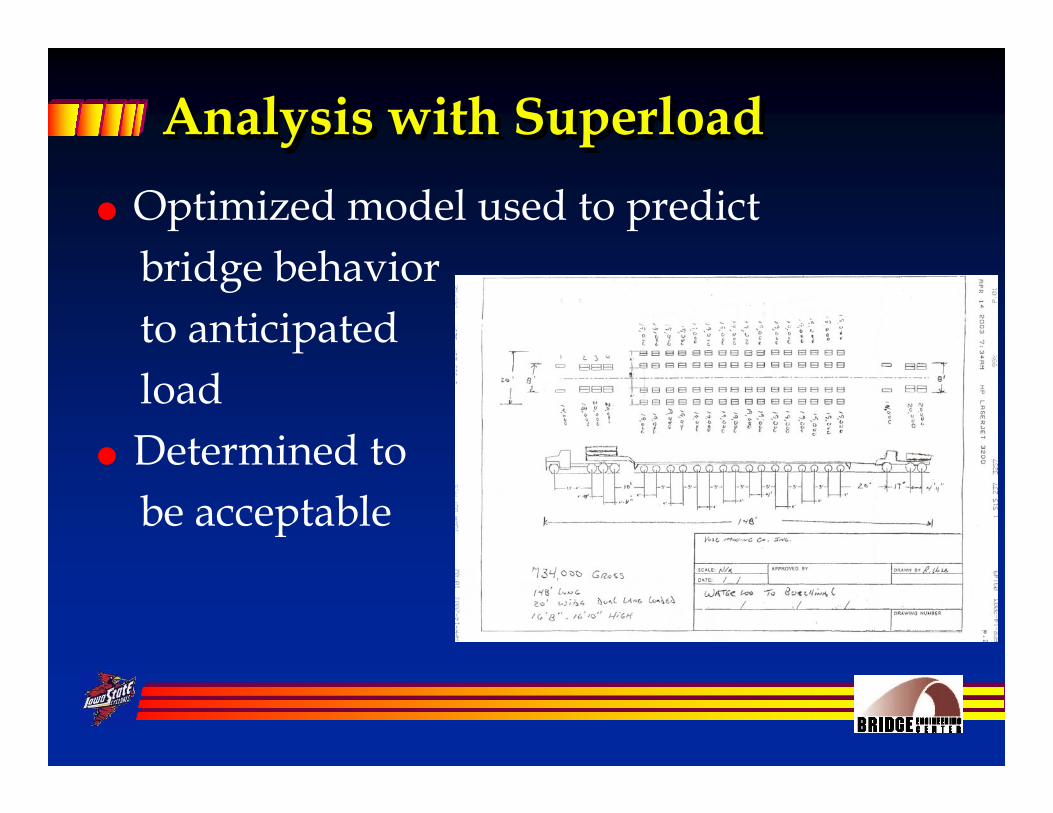
Analysis with SuperloadAnalysis with Analysis with SuperloadSuperloadOptimized model used to predictbridge behaviorto anticipatedloadDetermined tobe acceptable
Monitoring During PassageMonitoring During PassageMonitoring During Passage
Accuracy of PredictionAccuracy of PredictionAccuracy of Prediction
-100
-50
0
50
100
150
200
250
0 100 200 300 400 500 600
Truck Position, ft
Mic
rost
rain
G2G3G4G5
-100
-50
0
50
100
150
200
250
0 100 200 300 400 500 600
Truck Position, ft
Mic
rost
rain
G2G3G4G5
BRIDGELC
G1 G2 G4G3 G5 G6
Analytical: Experimental:
ConclusionsConclusionsConclusionsSystem is well suited to rating “typical”highway bridges– Materials
» Steel» Concrete» Timber
– Type» Simple span» Continuous span» Truss
ConclusionsConclusionsConclusions
Expect more opportunities to obtain superload dataOther “bridge fleet” research underway