Implementing a nitrogen-based model for autotrophic respiration using satellite and field observations
BHASKAR J. CHOUDHURY
Hydrological Sciences Branch, Code 974, Laboratory for Hydrospheric Processes, NASA Goddard Space Flight Center, Greenbelt, MD 20771, USA
Abstract: The rate of carbon accumulation by terrestrial plant communities in a process-level, mechanistic modeling is the difference of the rate of gross photosynthesis by a canopy (Ag) and autotrophic respiration (R) of the stand. Observations for different biomes often show that R to be a large and variable fraction of Ag, ca. 35% to 75%, although other studies suggest the ratio of R and Ag to be less variable. Here, R has been calculated according to the two com-partment model as being the sum of maintenance and growth components. The maintenance respiration of foliage and living fine roots for different biomes has been determined objectively from observed nitrogen content of these organs. The sapwood maintenance respiration is based on pipe theory, and checked against an independently derived equation considering sapwood biomass and its maintenance coefficient. The growth respiration has been calculated from the difference of Ag and maintenance respiration. The Ag is obtained as the product of biome-spe-cific radiation use efficiency for gross photosynthesis under unstressed conditions and inter-cepted photosynthetically active radiation, and adjusted for stress. Calculations have been done using satellite and ground observations for 36 consecutive months (1987-1989) over large contiguous areas (ca. 105 km2) of boreal forests, cropland, temperate deciduous forest, temper-ate grassland, tropical deciduous forest, tropical evergreen forest, tropical savanna, and tun-dra. The ratio of annual respiration and gross photosynthesis, (R/Ag), is found to be 0.5-0.6 for temperate and cold adopted biome areas, but somewhat higher for tropical biome areas (0.6-0.7). Interannual variation of the fluxes is found to be generally less than 15%. Calculated fluxes are compared with observations and several previous estimates. Results of sensitivity analysis are presented for uncertainties in parameterization and input data. It is found that uncertainty in determining maintenance respiration for tropical biomes is such that R/Ag for these biomes could be similar to that for temperate biomes.
Resumen: La tasa de acumulación de carbono en las comunidades de plantas terrestres en
un modelo mecanístico a nivel de procesos, es igual a la diferencia entre la tasa de fotosíntesis bruta en un dosel (Ag) y la respiración autótrofa (R) del rodal. Observaciones en diferentes biomas con frecuencia muestran que R es una fracción grande y variable Ag, ca. 35% al 75%, aunque otros estudios sugieren que el cociente de R y Ag es menos variable. Aquí, R fue calculada de acuerdo al modelo de dos compartimentos como la suma de los components mantenimiento y cre-cimiento. La respiración de mantenimiento del follaje y de las raíces finas vivas ha sido de-terminada objetivamente para diferentes biomas a partir del contenido de nitrógeno observado en estos órganos. La respiración de mantenimiento de la albura está basada en la teoría de tubos, y confrontada con una ecuación derivada independientemente que considera la biomasa de la al-bura y su coeficiente de mantenimiento. La respiración de crecimiento fue calculada como la diferencia de Ag y la respiración de mantenimiento. La Ag se obtiene como el producto de la efi-ciencia específica del bioma del uso de la radiación para la fotosíntesis bruta en condiciones no estresantes, por la radiación fotosintéticamente activa interceptada, y ajustada para el estrés. Para realizar los calculos se usaron observaciones de statélite y las realizadas sobre el terreno durante 36 meses consecutivos (1987-1989) a través de grandes áreas contiguas (ca. 105 km2) de
142 NITROGEN BASED MODEL FOR AUTOTROPHIC RESPIRATION
bosques boreales, tierras de labranza, bosques templados deciduos, pastizales templados, bosque tropical deciduo, bosque tropical perennifolio, sabana tropical y tundra. Se encontró que el co-ciente de la respiración anual sobre la fotosíntesis bruta (R/Ag), tiene valores entre 0.5-0.6 en áreas de biomas templados y con adaptaciones al frío, pero algo más altas para áreas de biomas tropicales (0.6-0.7). Por lo general la variación interanual de los flujos es menor al 15%. Se com-paran los flujos calculados con observaciones y varias estimaciones previas. Se presentan los re-sultados del análisis de sensi-bilidad para las incertidumbres en la parametrización y en los datos incorporados. Se encontró que la incertidumbre en la determinación de la respiración de manten-imiento para biomas tropicales es tal que R/Ag para estos biomas podría ser similar a la de bio-mas templados.
Resumo: A taxa de acumulação de carbono pela comunidade de plantas terrestres, ao nível
de um processo de modelação mecanicista, é a diferença da taxa de fotossíntese bruta ao nível da copa (Ag) e a respiração autotrófica (R) da parcela. As observações para os diferentes biomas mostram muitas vezes que R é maior, e uma fracção variável, do que Ag, atingindo valores que variam entre 35% a 75%, se bem que outros estudos sugiram que os ratios de R e Ag sejam menos variáveis. Aqui, R foi calculado de acordo com as duas componentes do modelo como sendo a soma da manutenção e do crescimento. A respiração de manutenção da folhagem e das raízes finas para os diferentes biomas foi determinada, objectivamente, a partir do teor de azoto destes orgãos. A respiração de manutenção do borne foi baseada na teoria dos tubos (pipe theory), e validada com recurso a uma equação independente derivada considerando a biomassa do borne e o seu coeficiente de manutenção. A respiração do crescimento foi calculada pela diferença entre Ag e a respiração de manutenção. A Ag foi obtida como o produto da eficiência de uso da radiação específica do bioma para a fotossíntese bruta sob condições de ausência de stresses, e a radiação fotossinteticamente activa interceptada, e ajustada para o stress. Os cálculos foram efectuados com recurso às observações de satélite e de solo durante 36 meses consecutivos (1987-1989) numa larga área contígua (ca. 105 km2) de floresta boreal, campo de cultura, floresta temperada decídua, prado temperado, floresta decídua tropical, floresta tropical sempreverde, savana tropical e tundra. O ratio encontrado da respiração anual e da fotossíntese bruta, (R/Ag), foi de 0,5-0,6 para as áreas de bioma temperado e frio, se bem que um pouco mais alto para os biomas tropicais (0,6-0,7). Encontrou-se que a variação inter anual dos fluxos é geralmente menor do que 15%. Os fluxos calculados são comparados com observações e várias avaliações prévias. Os resultados da análise de sensibilidade são apresentados para as incertezas na parametrização dos dados de entrada. Encontrou-se que a incerteza na determinação da respiração de manutenção para os biomas tropicais é tal que R/Ag, para estes biomas, pode ser semelhante à dos biomas temperados.
Key words: Boreal, fine roots, foliage, inter-annual variation, modeling, net primary productivity, ni-
The rate of carbon accumulation by terrestrial plant communities is the difference of the rate of gross photosynthesis by a canopy (Ag) and autotro-phic respiration (R, referred to below as respira-tion). Observations for different biomes often show that R to be a large and variable fraction of Ag, ca. 35% to 75% (Kira 1975; Amthor 1989; Ryan et al.
1997; McKane et al. 1997; Waring & Running 1998; Law et al. 1999), while other studies suggest substantially less variation (McCree 1988; Gifford 1994; Malhi et al. 1999). The maximum rate of gross photosynthesis by leaves (Amax) and photo-synthetically active radiation intercepted by a can-opy (IPAR) are major determinants of seasonal variation of Ag (Monteith 1977), and such variation of R is determined by Ag, biomass accumulation
CHOUDHURY 143
per unit ground area by foliage, stem and roots, and their maintenance coefficients (Amthor 1989). Since these maintenance coefficients generally in-crease with tissue temperature (Amthor 1989), R has often been found to increase with temperature. Thus, considering that different biophysical factors exert important control on Ag and R, a better un-derstanding of the effect of environmental or land use changes on carbon accumulation could be ob-tained by explicit evaluation of these two proc-esses.
Lieth & Box (1977) produced a global map of long-term average annual gross photosynthesis by using a globally applicable empirical model which predicts net primary production of potential (i.e., undisturbed) vegetation from long-term average precipitation and air temperature, and a fitted re-lation between gross and net production developed from measurements for broad leaf forests at 17 locations. Using these empirical relations, Box (1978) calculated zonal variation of long-term av-erage annual respiration (difference of gross and net production), which showed respiration to be 25% to 62% of annual gross production. Since these ground breaking studies providing spatially explicit global perspectives of gross photosynthesis and respiration, several bio-physically based mod-els have been developed to calculate these proc-esses at regional and global scales (for example, Raich et al. 1991; Warnant et al. 1994; Ruimy et al. 1996; Hunt et al. 1996). The difficulties in deter-mining R and methods used for calibration have been elaborated by Ruimy et al. (1996).
Ruimy et al. (1996) have presented an ap-proach for calculating Ag and R over the global land surface using satellite and ancillary data without calibrating the model parameters. The Ag was calculated as the product of radiation use effi-ciency and absorbed photosynthetically active ra-diation (IPAR). The radiation use efficiency was prescribed to be same for all biomes, while satellite observations were used to determine IPAR. The R was calculated as the sum of maintenance and growth respiration (Rm and Rg, respectively) ac-cording to the functional two component model of McCree (1974). The Rm was calculated from the “best guess” values of maintenance coefficient per unit dry matter of living foliage, sapwood and fine roots, and their dry biomass. They noted that maintenance coefficients for many types of vegeta-tion are not available, and the available data show much variability. Thus, the selected values of the
maintenance coefficients of foliage, sapwood and roots were stated to be “best guess”, and were as-sumed to be the same for all biomes. The root bio-mass was assumed to be equal to foliage biomass; the latter was determined as the product of a pre-scribed globally constant value of specific leaf weight and the leaf area index (Lo; m2 projected leaf m-2 soil surface area). Spatial and temporal changes of Lo were derived from satellite observa-tions. The sapwood biomass was estimated from stem and coarse root biomass, which was obtained as the difference of prescribed total biomass for potential vegetation and sum of the calculated sea-sonal maximum foliage and fine root biomass. The Rg was obtained as a constant fraction of the dif-ference of Ag and Rm. Changes in Ag and R due to stresses were not considered. The calculated R/Ag for different biomes varied in the range 0.34 to 0.63. Equatorial rain forests were found to have lower net production compared to some areas of tropical savannas and northern temperate zones, which was not apparent in previous studies. In this context, Ruimy et al. noted that respiration in most previous studies was determined by calibra-tion to match the production data or prescribed as an empirical fraction of gross photosynthesis. Sub-stantial differences are also found for Ag. Box (1978) calculated gross production for the equato-rial forest zone (0o-10oS) to be 4998 g m-2 yr-1, while Ruimy et al. obtained 4409 g m-2 yr-1 for tropical rainforest.
The objective of the present study is to reas-sess gross and net production using independently derived parameters without model calibration. The radiation use efficiency for unstressed conditions (RUE) has been calculated for each biome consid-ering their Amax, foliage temperature and frac-tional diffuse radiation incident on the canopy, because changes in these factors have been shown to affect unstressed RUE (Monteith 1977; Sinclair & Muchow 1999; Choudhury 2001a,b). While maintenance coefficient per unit dry matter has been found to change during growth (McCree 1988; Bunce 1989) and show considerable variation within a canopy, among organs and species (Stock-fors & Linder 1998; Ryan 1995; Brooks et al. 1991; Amthor 1989), this variation decreases when maintenance coefficient is expressed per unit ni-trogen content because protein turnover is consid-ered to be a major determinant of maintenance respiration (McCree 1983; Irving & Silsbury 1987; Ryan 1991; Reich et al. 1998). For example, field
144 NITROGEN BASED MODEL FOR AUTOTROPHIC RESPIRATION
observations for Lolium perenne by Jones et al. (1978) showed that while maintenance respiration of sward per unit dry matter varied by a factor of five during growth, 79% of the variance could be explained by the variation of protein concentra-tion. Observations (n=16) and analysis presented by Ryan (1991) show that while maintenance res-piration per unit dry matter for different species and organs varied by three orders of magnitude, 58% of the variance can be explained by the varia-tion of the associated nitrogen concentration. Thus, in contrast to previous studies, maintenance respiration of different biome has been determined from nitrogen content rather than from dry mat-ter. Also, biomass of living fine root has not been assumed to be equal to foliage biomass. Effects of diurnal and seasonal variations of temperature on maintenance respiration have been considered, together with varied stresses affecting Ag and R. Calculations have been done for 36 consecutive months (1987-1989) for large contiguous areas (ca. 105 km2) of boreal deciduous and evergreen conif-erous forests, crop land, temperate deciduous for-est, temperate grassland, tropical deciduous forest, tropical evergreen forest, tropical savanna, and tundra. The model and input data are discussed below, followed by comparisons with observations, those predicted by Lieth & Box’s (1977) model, cal-culated by Ruimy et al. (1996) and several other estimates. Then, the results of sensitivity analysis are presented for uncertainties in parameteriza-tion and input data.
Model and parameters
Total respiration Following the functional two component model
of McCree (1974), the daily total respiration per unit ground area at a temperature of T {R (T), mol CO2 m-2 d-1} has been calculated as the sum of growth (Rg) and maintenance (Rm) components (Amthor 1989): R (T) = [Rg (T) + Rm (T)] (1) where, the growth respiration per unit ground area (Rg; mol CO2 m-2 d-1) is given by the following equation (Amthor 1989): Rg (T) = (1 – YG) {Ag - Rm (T)} (2) where YG is the growth conversion efficiency (mole C synthesized per mole input C; mol mol-1) and Ag is actual daily total gross photosynthesis per unit ground area (mol CO2 m-2 d-1).
Although the dependence of respiration on temperature is shown explicitly in the above equa-tions, one should note that varied stresses which affect Ag also affect R (Eq. 2).
Growth conversion efficiency Chemical composition of plants is the principal
determinant of YG, and, apart from any biome-spe-cific differences, changes in chemical composition during growth can also introduce variations in YG (Merino et al. 1982; Lafitte & Loomis 1988a; McCree 1988; Griffin 1994). It has been taken to be 0.74 for crops, and 0.69 for woody species (Table 1). The data in Table 1 do not include any value for natural grasslands. However, Baruch & Gomez (1996) have reported the construction cost (kg glu-cose required to produce unit kg of dry matter) de-termined by calorimetry for grassland species of a savanna during rainy and dry season. These data for construction cost would give the mean (n=24) and the coefficient of variation of YG as, respec-tively, 0.74 and 5%, if carbon content of dry matter is taken to be 40% (Dwivedi 1971; Hughes et al. 1999). Thus, YG for natural grasslands has been taken to 0.74. These YG values are close to those used in previous regional and global studies; viz., 0.80 by Raich et al. (1991), Warnant et al. (1994) and Haxeltine & Prentice (1996), 0.72 by Ruimy et al. (1996), 0.67 by Hunt et al. (1996), although these studies considered all biomes to have the same YG. The coefficient of variation of YG appears to be about 12% (Table 1), and the effect of this variation on the fluxes has been addressed by sensitivity analysis.
Actual gross photosynthesis The method used to calculate unstressed gross
photosynthesis (Ag, o) is based on the concept pro-posed by Monteith (1977) and has been fully de-scribed in Choudhury (2000a, 2001a,b). The Ag,,o is obtained as the product of biome-specific values of RUE and IPAR, as briefly elaborated below.
The light response function for the rate of gross photosynthesis by leaves has been taken to be a non-rectangular hyperbola, in which the maximum rate of photosynthesis varies within a canopy as determined by the nitrogen content of leaves. The quantum efficiency varies with foliage temperature. The foliage is separated into sunlit and shaded fraction, and irradiance on these leaves has been determined from a solution of the
CHOUDHURY 145
radiative transfer equation for incident direct and
diffuse PAR. The instantaneous canopy gross pho-
tosynthesis is obtained by summing the photosyn-thesis by sunlit and shaded leaves, and the instan-teneous values have been integrated over the day-light period to obtain Ag,o. The RUE values for clear and overcast conditions are obtained as the ratio of Ag,o and IPAR. Then, the RUE corre-sponding to the incident PAR is obtained by inter-polating the RUE values for clear and overcast conditions using the diffuse fraction of the incident PAR. These RUE values for different biomes and IPAR, determined from satellite observations pro-viding incident irradiance and fractional intercep-tion, have been used to calculate Ag, o.
Adjustment of gross photosynthesis due to stresses follows along previous studies (cf., McGuire et al. 1992; Hunt et al. 1996). The effect of soil water stress has been modeled by the following scalar multiplier to unstressed photosynthesis (Ritchie 1981): ∑g = min {1, W/(0.4 Wmax)} (3) where, W is the root-zone available moisture, and Wmax is its maximum value. The effect of this stress is essentially that the unstressed gross pho-tosynthesis continues until the available moisture decreases to 40% of its maximum value, below which photosynthesis decreases linearly with the available moisture. A biophysical process based model, combining water and energy balance equa-tions with input satellite and ancillary data, has been used to calculate W (Choudhury & DiGi-rolamo 1998). Comparison of calculated soil mois-ture with observations at grassland sites over Illi-nois for 60 months period (1986-1990) is given in Choudhury (2000 b); linear least square regression analysis gave r2 of 0.73 for the moisture values, and r2 of 0.50 for moisture anomalies (i.e., depar-ture from the mean values).
In addition to soil water stress, photosynthesis is also suppressed when foliage temperature is less than optimum (McGuire et al. 1992; Potter et al. 1994), and for time lost to perform photosynthesis during the period when foliage was wet by the in-tercepted rainfall (Ishibashi & Terashima 1995; Choudhury & DiGirolamo 1998).
Maintenance respiration Maintenance respiration per unit ground area
of foliage, sapwood and living fine roots at mean daily temperature of Tj (subscript j denoting foli-
Table 1. A summary of growth conversion effi-ciency (YG, in units of mol C mol-1 C, with percentcoefficient of variation in parenthesis) for wholeplant, shoot, leaf, stem, and roots of cultivated her-baceous and woody species (growing under naturalor controlled conditions), together with theirsources.
146 NITROGEN BASED MODEL FOR AUTOTROPHIC RESPIRATION
age, sapwood and living fine roots; f, s, r), Rm, j (Tj), has been calculated from their values at a ref-erence temperature of 20oC {Rm, j (20); mol CO2 m-2d-1} and their temperature response function, fj (Tj), as (Ryan 1991): Rm,j (Tj) = Rm, j (20) fj (Tj) Io (βj ∆ Tj/2) (4a) where Io (x) is the modified Bessel function, ∆Tj is the diurnal range of temperature (oC) for tissue j, and βj is related to the generally quoted tempera-ture response coefficient (Q10) of tissue j, (Q10,, j), as, βj = ln (Q10, j)/10 (4b)
Both fj (Tj) and Io (x) are dimensionless quanti-ties. The modified Bessel function accounts for the effect of diurnal variation of tissue temperature (taken to be sinusoidal) on respiration. Most previ-ous regional and global studies have not consid-ered this effect of diurnal variation, although ig-noring this effect can underestimate respiration by 5% or more (Ryan 1991).
The temperature response function of tissue j, fj (Tj), is often expressed in terms of Q10 of that tis-sue (Q10, j) as: fj (Tj) = [ Q10, j ] { (Tj – 20)/10 } (5)
Varied approaches have used to prescribe Q10 in regional and global studies. For example, McGuire et al. (1992) considered Q10 to vary with monthly mean air temperature (Q10 increased line-arly from 2.0 to 2.5 as temperature decreased from 5o to 0oC, decreased linearly from 2.0 to 1.5 as temperature increased from 20o to 40oC and was constant at 2.0 for temperature etween 5o and 20oC), while Hunt et al. (1996) considered Q10 to be 2.0 independent of temperature.
The value of Q10 is often observed to be about 2 in mid-temperature range (Amthor 1989), while it increases at lower temperature and decreases at higher temperature because of limiting biophysical processes (Ryan 1991; Criddle et al. 1994; Larcher 1995; Stockfors & Linder 1998; Atkin et al. 2000). Field measurements over a 12-year-old cypress forest (Chamaecyparis obtusa) for three-year pe-riod (Paembonan et al. 1991) gave the following relation between Q10 for shoot (j=foliage and stem) and air temperature (Ta) (Fig. 1): Q10,j = 3.38 – 0.079 Ta (6) with an explained variance (r2) of 0.91, and T was in the range 2.5oC to 25.0oC.
The fj (Tj) derived from Eqs. (5) and (6) is shown in Fig. 2, where applicability of Eq. (6) has been assumed beyond the range of temperature data in Fig. 1. This figure also shows the linear
Fig. 1. Observed variation of the temperature responsecoefficient (Q10) for a cypress forest tree with air tem-perature from Paembonan et al. (1991), together withthe result of linear least square regression.
Fig. 2. The temperature response function for mainte-nance respiration normalized to be 1 at 20oC based onQ10 regression equation in Fig. 1 for the temperaturerange 2.5o to 25.0oC, and extrapolated beyond this rangeof values. The temperature response function used byRuimy et al. (1996) is also shown.
CHOUDHURY 147
response function used by Ruimy et al. (1996), al-though they did not report the measurements used to determine this linear function and the range of temperature over which this response function is valid. These two response functions differ by more than 10% below 16oC and above 28oC. For regional and global modeling, Raich et al. (1991), McGuire et al. (1992), Warnant et al. (1994) and Ruimy et al. (1996) did not distinguish temperature of foli-age, sapwood and roots (which were taken to be equal to the monthly mean air temperature), while Hunt et al. (1996) distinguished the temperature of shoot and roots. Thus, baseline calculations have been done using Eqs. (5) and (6) (i.e., the non-lin-ear function in Fig. 2), while the effect of changing the response function to be linear (as in Ruimy et al.) on the fluxes has been addressed by sensitivity analysis. Also addressed by sensitivity analysis is the effect of distinguishing the temperature of dif-ferent tissues.
It is generally recognized that much of the maintenance cost is due to turnover of protein in live plant tissue (Amthor 1989). A synthesis of ob-servations relating maintenance respiration to ni-trogen content for crops and uncultivated species from temperate and Mediterranean climate gave (Ryan 1991; Choudhury 2000 c): Rm (20) = 0.21 (Nf + Ns + 2 Nr) (7a) where, Nf, Ns and Nr are nitrogen content per unit ground area (mol N m-2) of foliage, sapwood and living fine roots. The first, second and third term on the right hand side of Eq. (7a) are, respectively, the respiration of foliage, sapwood and roots, Rm,f, Rm,s and Rm,r. Higher respiration observed for roots, as compared to shoot, is thought to be due to the additional cost of ion uptake (Amthor 1989).
Ryan (1995) observed that maintenance respi-ration per unit nitrogen content for leaves of sub-alpine and boreal trees and shrubs to be 1.8 times higher than that for temperate species, which was suggested by Ryan (1995) to be in response to ad-aptation to colder climate. Thus, the equation used for boreal and tundra vegetation is the following: Rm (20) = 0.38 (Nf + Ns + 2 Nr) (7b)
Measurements used in developing Eqs. (7a) and (7b) did not include any data for tropical bi-omes. If, at the reference temperature of 20oC, Rm per unit nitrogen content of boreal species is higher as compared to temperate species in re-sponse to adaptation to colder climate (Ryan 1995), one may hypothesize that Rm per unit nitrogen content of tropical species at that reference tem-
perature could be lower as compared to that for temperate species in response to adaptation to warmer climate. The impact of decreasing the nu-merical coefficient in Eq. (7a) for tropical biomes due to possible adaptation to growing at higher temperature has been addressed by sensitivity analysis.
Estimation of Rm (20) for different biomes is presented below.
From harvests of fertilized stands of Zea mays at different times during the period from emer-gence to one week before silking, Plenet & Lemaire (1999) found the following linear relation (r2=0.98, n=23) between nitrogen content of shoot per unit ground area (i.e, Nf + Ns) and projected leaf area index (Lo; m2 leaf m-2 soil surface area), up to the observed maximum Lo of 6: Nf + Ns = 0.206 Lo (8a) while the relation for plants growing under limit-ing nitrogen conditions and Lo greater than 1.5 was, Nf + Ns = 0.145 + 0.073 Lo (8b)
Fig. 3 shows Eq. (8), together with total re-
Fig. 3. Scatter plot of projected leaf area index and totalrespiring nitrogen content of shoot and root per unitground area (mol N m-2) determined from periodic har-vests of stands of Triticum, Sorghum, Glycine, Gos-sypium and Phaseolus. The regression result obtained byPlenet & Lemaire (1999) for the relation between leafarea index and the nitrogen content of shoot per unitground area for fertilized stands of Zea is also shown.
148 NITROGEN BASED MODEL FOR AUTOTROPHIC RESPIRATION
spiring nitrogen content appearing in Eq. (7a) (i.e., Nf + Ns + 2 Nr) and Lo determined from harvest data during the vegetative phase of fertilized stands of Triticum aestivum (Choudhury 2000 c), Sorghum bicolar (Szeicz et al. 1973; Sivakumar et al. 1979; Eck & Musick 1979; Myers 1980; Lafitte & Loomis 1988 b), Glycine max (Hanway & Weber 1971a; Rochette et al. 1995), Gossypium hirsutum (Bassett et al. 1970; Helevy 1976; Mauney et al. 1994; Pettigrew 1999), and Phaseolus vulgaris (Peck & MacDonald 1984; Lynch et al. 1992). A constrained linear least square regression analysis gave the following relation (r2=0.86, n=58): Nf + Ns + 2 Nr = 0.226 Lo (9)
A practical constraint for annual crops is that (Nf + Ns + 2 Nr) be zero when Lo is zero. Observa-tions and analysis presented by Plenet & Lemaire (1999) and in Fig. 3 suggest that Lo can be consid-ered to be an indicator of nitrogen content of a stand of some agricultural crops. Billore (1973) (quoted in Singh & Joshi 1979) had found a linear relation between Lo and chlorophyll content for a grassland community, although both linear and non-linear relations between Lo and chlorophyll content have been noted depending upon the de-gree of shading and structural, non-photosynthetic tissue (Singh & Joshi 1979). It is assumed in this study that Lo can provide an indicator of the nitro-gen content of the stand.
An equation for estimating Rm (20) of culti-vated areas can be obtained by substituting Eq. (9) in Eq. (7a) as: Rm (20) = 0.047 Lo (10)
Assuming that (Nf + Ns + 2 Nr ) scales with Lo
of temperate grasslands as (Appendix A): Nf + Ns + 2 Nr = 1.395 Lo (11) one can obtain the following relation for Rm (20) of temperate grasslands (substituting Eq. 11 in Eq. 7a): Rm (20) = 0.293 Lo (12)
The equation for Rm (20) of tropical grasslands is found to be (Appendix B): Rm (20) = 0.189 Lo (13)
Attempt to apply Eq. (7) in totality to woody vegetation was not very successful because of very limited data for sapwood nitrogen content per unit ground area for different biomes needed to deter-mine stem maintenance respiration. Following Hunt et al. (1996), the concept of pipe model was considered to estimate stem maintenance respira-tion. From available data on above ground stand-ing biomass and an estimate of this biomass con-
Table 2. A compilation of maximum projectedleaf area index (Lo, max) and stem maintenancerespiration per unit ground area of woody speciesunder the prevailing soil water conditions (Rm,smol CO2 m-2d-1) at 20oC using the reported Q10values and available meteorologic data, togetherwith their sources. Species with asterisk are nee-dle leaf, while others are broad leaf species. Thecarbon content of dry matter has been taken to be48% when it was not given.
stituting sapwood, Haxeltine & Prentice (1996) proposed the following equation for sapwood main-tenance respiration in terms of the seasonal maximum Lo (Lo,max): Rm, s (20) = 0.011 Lo, max (14a)
Based on a synthesis of data relating sapwood maintenance respiration to leaf area index (Table 2), we have used the following relations for sap-wood maintenance respiration of trees and shrubs based on the foliage shape:
Needle leaf: Rm, s (20) = 0.009 Lo,max (14b) Broad leaf: Rm, s (20) = 0.014 Lo, max (14c) Waring & Schlesinger (1985) have tabulated
percentage of living cells in sapwood for eight spe-cies each of conifer and broad leaf trees, which gives mean (standard deviation, n=8) of live cells as, respectively, 7.1 (1.4)% and 16.0 (7.2)%. For the same sapwood volume, the cost of maintaining a lower percentage of live cells would be expected to be lower (Eqs. 14b,c).
Note that Eq. (14a), derived independently considering sapwood biomass and its maintenance coefficient, is consistent with the data in Table 2 when needle leaf and broad leaf species are not separated. Haxeltine & Prentice (1996) did not dis-cuss the uncertainty associated with Eq. (14a) due
to variability in the maintenance coefficient and uncertainty in determining the sapwood biomass. The impact of this uncertainty on the fluxes has been assessed by sensitivity analysis.
Then, maintenance respiration at 20oC of foli-age and living fine roots is calculated from Eq. (7a) as: Rm, f + Rm, r = 0.21 (Nf + 2 Nr) (15a) for all biomes, except for boreal forests and tundra, for which the following equation is used (Eq. 7b): Rm, f + Rm, r = 0.38 (Nf + 2 Nr) (15b)
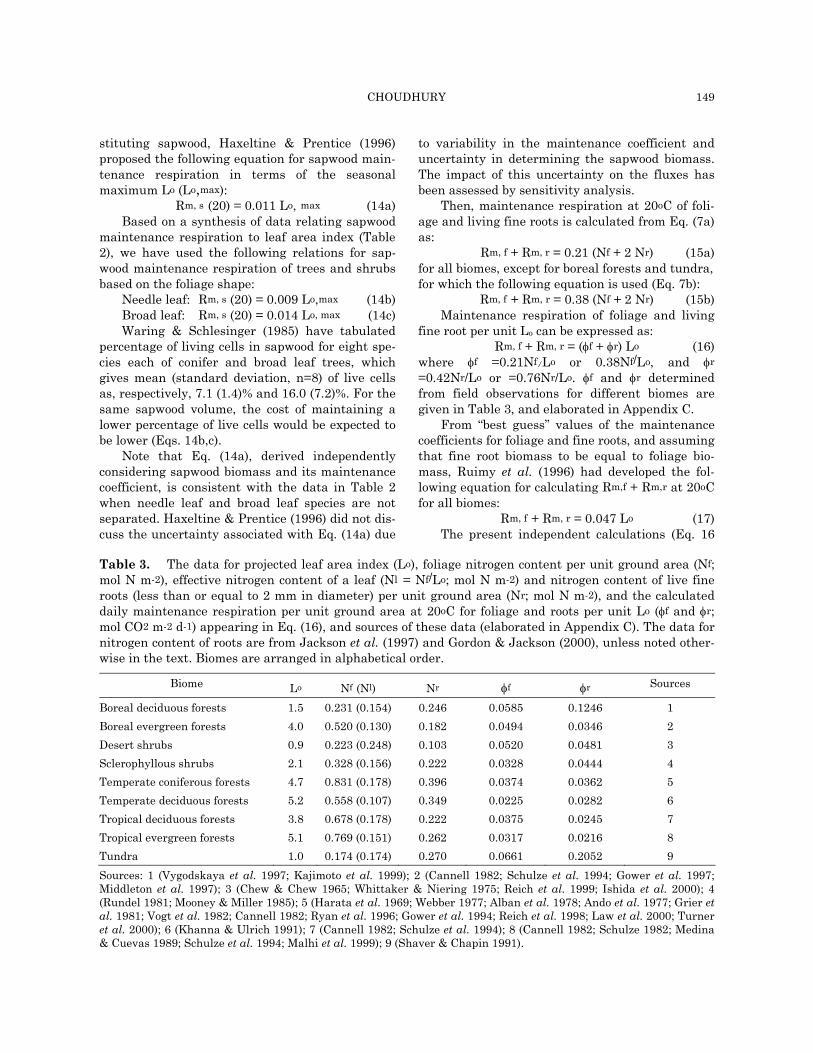
Maintenance respiration of foliage and living fine root per unit Lo can be expressed as: Rm, f + Rm, r = (φf + φr) Lo (16) where φf =0.21Nf/Lo or 0.38Nf/Lo, and φr =0.42Nr/Lo or =0.76Nr/Lo. φf and φr determined from field observations for different biomes are given in Table 3, and elaborated in Appendix C.
From “best guess” values of the maintenance coefficients for foliage and fine roots, and assuming that fine root biomass to be equal to foliage bio-mass, Ruimy et al. (1996) had developed the fol-lowing equation for calculating Rm,f + Rm,r at 20oC for all biomes: Rm, f + Rm, r = 0.047 Lo (17)
The present independent calculations (Eq. 16
Table 3. The data for projected leaf area index (Lo), foliage nitrogen content per unit ground area (Nf;mol N m-2), effective nitrogen content of a leaf (Nl = Nf/Lo; mol N m-2) and nitrogen content of live fineroots (less than or equal to 2 mm in diameter) per unit ground area (Nr; mol N m-2), and the calculateddaily maintenance respiration per unit ground area at 20oC for foliage and roots per unit Lo (φf and φr;mol CO2 m-2 d-1) appearing in Eq. (16), and sources of these data (elaborated in Appendix C). The data fornitrogen content of roots are from Jackson et al. (1997) and Gordon & Jackson (2000), unless noted other-wise in the text. Biomes are arranged in alphabetical order.
Biome Lo Nf (Nl) Nr φf φr Sources
Boreal deciduous forests 1.5 0.231 (0.154) 0.246 0.0585 0.1246 1 Boreal evergreen forests 4.0 0.520 (0.130) 0.182 0.0494 0.0346 2 Desert shrubs 0.9 0.223 (0.248) 0.103 0.0520 0.0481 3 Sclerophyllous shrubs 2.1 0.328 (0.156) 0.222 0.0328 0.0444 4 Temperate coniferous forests 4.7 0.831 (0.178) 0.396 0.0374 0.0362 5 Temperate deciduous forests 5.2 0.558 (0.107) 0.349 0.0225 0.0282 6 Tropical deciduous forests 3.8 0.678 (0.178) 0.222 0.0375 0.0245 7 Tropical evergreen forests 5.1 0.769 (0.151) 0.262 0.0317 0.0216 8 Tundra 1.0 0.174 (0.174) 0.270 0.0661 0.2052 9 Sources: 1 (Vygodskaya et al. 1997; Kajimoto et al. 1999); 2 (Cannell 1982; Schulze et al. 1994; Gower et al. 1997; Middleton et al. 1997); 3 (Chew & Chew 1965; Whittaker & Niering 1975; Reich et al. 1999; Ishida et al. 2000); 4 (Rundel 1981; Mooney & Miller 1985); 5 (Harata et al. 1969; Webber 1977; Alban et al. 1978; Ando et al. 1977; Grier et al. 1981; Vogt et al. 1982; Cannell 1982; Ryan et al. 1996; Gower et al. 1994; Reich et al. 1998; Law et al. 2000; Turner et al. 2000); 6 (Khanna & Ulrich 1991); 7 (Cannell 1982; Schulze et al. 1994); 8 (Cannell 1982; Schulze 1982; Medina & Cuevas 1989; Schulze et al. 1994; Malhi et al. 1999); 9 (Shaver & Chapin 1991).
150 NITROGEN BASED MODEL FOR AUTOTROPHIC RESPIRATION
and Table 3) agree reasonably well (within 10%) with Eq. (17) for tropical evergreen forests and temperate deciduous forests, but not for other bi-omes. Eq. (10) derived for crops (including stem) is also in good agreement with Eq. (17), although Ruimy et al. (1996) did not consider crops to be a separate biome (their calculations are for potential vegetation). The present calculations are based on field data for fine root biomass, instead of the as-sumption that fine root biomass being equal to fo-liage biomass.
Net carbon accumulation
Net carbon accumulation per unit ground area per day (C; mol m-2 d-1) has been calculated as the difference of gross photosynthesis (Ag) and respira-tion (R): C = Ag – R (18)
By inserting Eqs. (1) and (2) in Eq. (18), one can also write C as: C = YG (Ag – Rm) (19)
Note that, while IPAR is a major determinant of Ag, Rm is independent of IPAR. A radiation use efficiency corresponding to C (defined as the ratio of C and IPAR) would be conservative under condi-tions when respiration varies in proportion to pho-tosynthesis (Choudhury 2001 b). Attempt to de-termine C without explicit calculation of Ag and R would require that C be parameterized in a way which can account for different sensitivities of Ag and R to biophysical factors.
Input data and methods
Calculations have been done at a spatial reso-lution of 0.25ox0.25o (latitude x longitude cell di-mension) for 36 consecutive months (1987-1989) using spatially representative, geo-referenced data derived from satellite and surface observations (Choudhury & DiGirolamo 1998; Choudhury 2001a). The leaf area index (Lo) has been deter-mined following the algorithm of Los et al. (2000) using monthly maximum composite of visible and near infrared observations by the Advanced Very High Resolution Radiometer (AVHRR) on board the NOAA satellites after correcting the reflec-tances for the atmospheric effects (Rayleigh and aerosol scattering, and absorption by ozone, mixed gases and water vapor) and sensor degradation (Choudhury & DiGirolamo 1998). The algorithm for Lo was derived and tested against field data
(Los et al. 2000). Observations by the Tiros Opera-tional Vertical Sounder (TOVS) on board the NOAA satellites have been used to determine air temperature (Choudhury & DiGirolamo 1998). Comparison with surface observations for 12 months period (year 1988) at globally distributed 134 stations, which were selected to be away from large water bodies (viz., major lakes and oceans) and mountainous areas, gave the RMS error of 2.9oC and explained variance of 96% (the range of temperature was -40oC to 40oC). The diurnal tem-perature range needed for calculating maintenance respiration (Eq. 4a) is based upon climatologic data (Muller 1982).
The input data used for calculating gross pho-tosynthesis (Ag,o and ∑g) are fully described in Choudhury (2001 a) and Choudhury & DiGirolamo (1998), which include the maximum rate of photo-synthesis by leaves, incident photosynthetically active radiation, air temperature, precipitation, vapor pressure deficit of air, fractional cloud cover, surface albedo, and friction velocity. A large part of these data are needed for solving water and energy balance equations, which provide root-zone soil moisture needed for determining ∑g (Eq. 3). The maximum rate of photosynthesis by leaves has been determined from compilations given in Me-dina (1986), Korner (1994), Vygodskaya et al. (1997), among others.
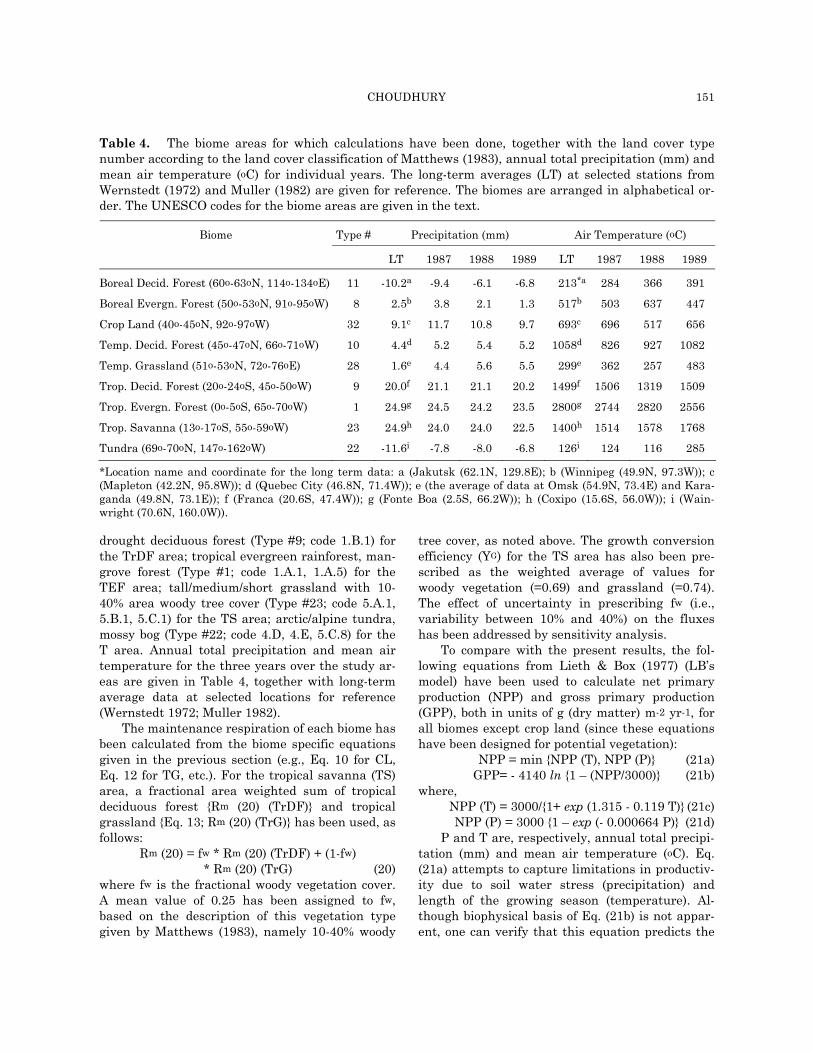
Calculations have been done for three consecu-tive years (1987-1989) for large contiguous areas (ca. 105 km2) of boreal deciduous coniferous forest (BDF), boreal evergreen coniferous forest (BEF), crop land (CL), temperate deciduous forest (TDF), temperate grassland (TG), tropical deciduous for-est (TrDF), tropical evergreen forest (TEF), tropi-cal savanna (TS), and tundra (T), based on con-sulting vegetation maps of Olson & Watts (1983), Matthews (1983) and Haxeltine & Prentice (1996) (Table 4). The vegetation types for these areas, according to the land cover data of Matthews (1983) following the UNESCO classification sys-tem, are given in Table 4. These are: cold-decidu-ous forest, without evergreens (Type #11 in Mat-thews; UNESCO code, 1.B.3) for BDF area; tem-perate/sub-polar evergreen needle-leaf forest (Type #8; code 1.A.10) for BEF area; cultivation (Type #32) on nearly 100% of the area for the CL area; cold-deciduous forest, with evergreens (Type #10; code 1.B.2) for the TDF area; meadow, short grass-land, no woody cover (Type #28; code 5.C.5, 5.C.6, 5.C.7) for the TG area; tropical/sub-tropical
CHOUDHURY 151
drought deciduous forest (Type #9; code 1.B.1) for the TrDF area; tropical evergreen rainforest, man-grove forest (Type #1; code 1.A.1, 1.A.5) for the TEF area; tall/medium/short grassland with 10-40% area woody tree cover (Type #23; code 5.A.1, 5.B.1, 5.C.1) for the TS area; arctic/alpine tundra, mossy bog (Type #22; code 4.D, 4.E, 5.C.8) for the T area. Annual total precipitation and mean air temperature for the three years over the study ar-eas are given in Table 4, together with long-term average data at selected locations for reference (Wernstedt 1972; Muller 1982).
The maintenance respiration of each biome has been calculated from the biome specific equations given in the previous section (e.g., Eq. 10 for CL, Eq. 12 for TG, etc.). For the tropical savanna (TS) area, a fractional area weighted sum of tropical deciduous forest {Rm (20) (TrDF)} and tropical grassland {Eq. 13; Rm (20) (TrG)} has been used, as follows: Rm (20) = fw * Rm (20) (TrDF) + (1-fw) * Rm (20) (TrG) (20) where fw is the fractional woody vegetation cover. A mean value of 0.25 has been assigned to fw, based on the description of this vegetation type given by Matthews (1983), namely 10-40% woody
tree cover, as noted above. The growth conversion efficiency (YG) for the TS area has also been pre-scribed as the weighted average of values for woody vegetation (=0.69) and grassland (=0.74). The effect of uncertainty in prescribing fw (i.e., variability between 10% and 40%) on the fluxes has been addressed by sensitivity analysis.
To compare with the present results, the fol-lowing equations from Lieth & Box (1977) (LB’s model) have been used to calculate net primary production (NPP) and gross primary production (GPP), both in units of g (dry matter) m-2 yr-1, for all biomes except crop land (since these equations have been designed for potential vegetation): NPP = min {NPP (T), NPP (P)} (21a) GPP= - 4140 ln {1 – (NPP/3000)} (21b) where, NPP (T) = 3000/{1+ exp (1.315 - 0.119 T)} (21c) NPP (P) = 3000 {1 – exp (- 0.000664 P)} (21d)
P and T are, respectively, annual total precipi-tation (mm) and mean air temperature (oC). Eq. (21a) attempts to capture limitations in productiv-ity due to soil water stress (precipitation) and length of the growing season (temperature). Al-though biophysical basis of Eq. (21b) is not appar-ent, one can verify that this equation predicts the
Table 4. The biome areas for which calculations have been done, together with the land cover typenumber according to the land cover classification of Matthews (1983), annual total precipitation (mm) andmean air temperature (oC) for individual years. The long-term averages (LT) at selected stations fromWernstedt (1972) and Muller (1982) are given for reference. The biomes are arranged in alphabetical or-der. The UNESCO codes for the biome areas are given in the text.
Type # Precipitation (mm) Air Temperature (oC) Biome
*Location name and coordinate for the long term data: a (Jakutsk (62.1N, 129.8E); b (Winnipeg (49.9N, 97.3W)); c (Mapleton (42.2N, 95.8W)); d (Quebec City (46.8N, 71.4W)); e (the average of data at Omsk (54.9N, 73.4E) and Kara-ganda (49.8N, 73.1E)); f (Franca (20.6S, 47.4W)); g (Fonte Boa (2.5S, 66.2W)); h (Coxipo (15.6S, 56.0W)); i (Wain-wright (70.6N, 160.0W)).
152 NITROGEN BASED MODEL FOR AUTOTROPHIC RESPIRATION
ratio (NPP/GPP) to decrease monotonically or (R/GPP) to increase monotonically with increasing NPP (the implication being that the ecosystem or the location which has higher NPP will also have higher R/GPP).
The P and T values for the three years given in Table 4 have been averaged for calculating NPP and GPP. Since the present calculations give the fluxes in carbon rather than dry matter equiva-lent, it was necessary to prescribe the carbon con-tent of dry matter to compare with the results de-rived from LB’s model. Thus, the carbon content of dry matter has been taken to be 40% for grass-lands (Dwivedi 1971; Hughes et al. 1999), 45% for savanna (Ajtay et al. 1979), and 48% for all other biomes (Raich et al. 1991) to convert NPP and GPP to, respectively, C and Ag. This conversion of the fluxes introduces an uncertainty of 5-10% because of variability of the carbon content (Singh & Singh 1991). Then, R has been calculated as the differ-ence of Ag and C. Note that the ratio of the fluxes (R/Ag) is not affected by the choice of carbon con-tent of dry matter.
Results and discussion
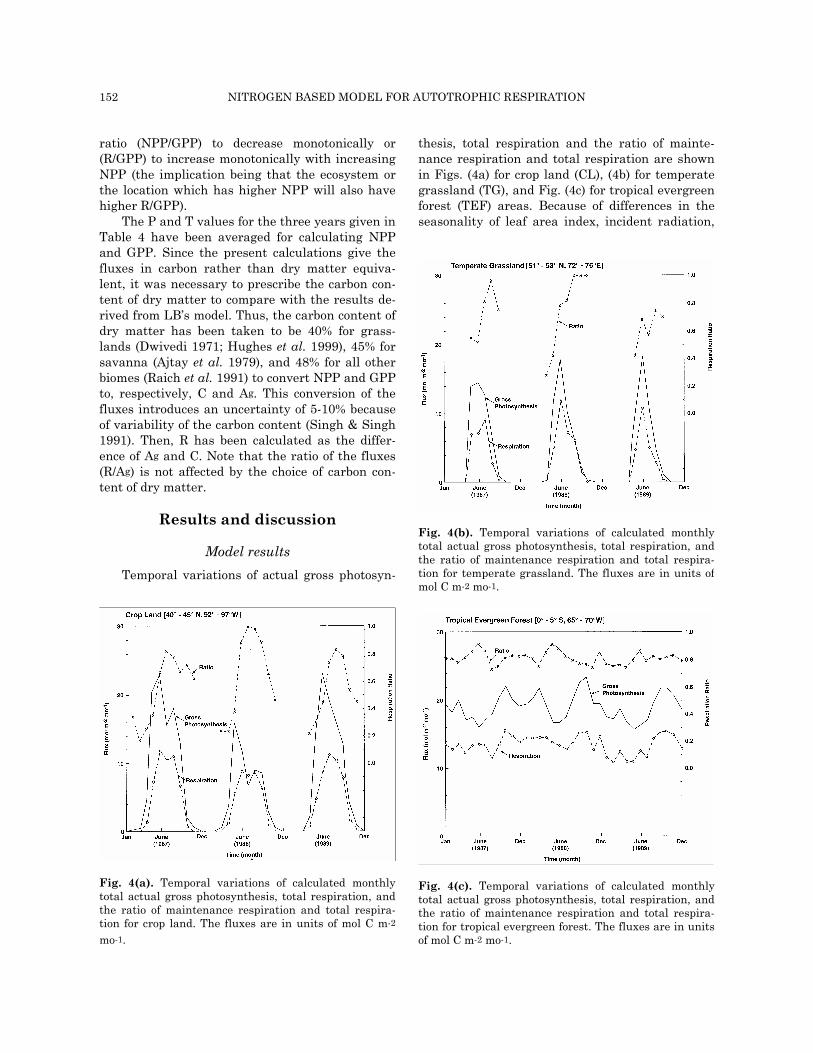
Model results Temporal variations of actual gross photosyn-
thesis, total respiration and the ratio of mainte-nance respiration and total respiration are shown in Figs. (4a) for crop land (CL), (4b) for temperate grassland (TG), and Fig. (4c) for tropical evergreen forest (TEF) areas. Because of differences in the seasonality of leaf area index, incident radiation,
Fig. 4(b). Temporal variations of calculated monthlytotal actual gross photosynthesis, total respiration, andthe ratio of maintenance respiration and total respira-tion for temperate grassland. The fluxes are in units ofmol C m-2 mo-1.
Fig. 4(c). Temporal variations of calculated monthlytotal actual gross photosynthesis, total respiration, andthe ratio of maintenance respiration and total respira-tion for tropical evergreen forest. The fluxes are in unitsof mol C m-2 mo-1.
Fig. 4(a). Temporal variations of calculated monthlytotal actual gross photosynthesis, total respiration, andthe ratio of maintenance respiration and total respira-tion for crop land. The fluxes are in units of mol C m-2
mo-1.
CHOUDHURY 153
temperature and soil moisture, which are the ma-jor driving forces for photosynthesis and respira-tion, the temporal variations of the fluxes are sig-nificantly more pronounced for CL and TG areas as compared to TEF area.
The seasonal maximum photosynthesis (total respiration) for the CL area is calculated to be 23 (12), 16 (9), and 23 (11) mol m-2 mo-1 for respec-tively, 1987, 1988, and 1989 (Fig. 4a). Precipitation during 1988 was about 150 mm lower than that during 1987 and 1989 (Table 4), and thus affecting the fluxes. For example, it is seen in Fig. 4a that during 1987 both photosynthesis and respiration reach their maximum during June, then they de-crease during July, followed by increase in August, and then progressive decrease. This temporal pat-tern for the fluxes match the temporal variation of the soil water stress factor (Fig. 5). The ratio of maintenance respiration and total respiration at-tains its maximum during July in 1987 (Fig. 4a), when leaf area index (Lo) reaches its maximum (Fig. 5). Respiration exceeds photosynthesis during July 1988 (Fig. 4a).
The seasonal maximum photosynthesis for the TG area is calculated to be 14, 18, and 18 mol m-2 mo-1 for respectively, 1987, 1988, and 1989 (Fig. 4b). The seasonal maximum Lo was found to be 0.9 in 1988, but somewhat lower in 1987 and 1989 (Lo = 0.7). The annual total precipitation for the TG
area was maximum in 1989, followed by 1987 and 1988 (Table 4). Temporal variation of precipitation is shown in Fig. 6. Precipitation during the initial growing period (May-June) was 73, 68, and 84 mm for 1987, 1988 and 1989. Thus, while Lo was lower in 1989, the available water was higher. Both Lo and soil water stress are contributing to the inter-annual variation of gross photosynthesis. The sea-sonal maximum total respiration is calculated to be 9, 12, and 11 mol m-2 mo-1 for respectively, 1987, 1988, and 1989, and, of this total, mainte-nance respiration contributed, respectively, 83, 79, and 69%. These seasonal maximum values of res-piration and photosynthesis temporally coincide for 1988 and 1989, but are offset by one month in 1987. With the onset of the growing season, the fraction of total respiration due to maintenance increases because of vegetation growth, but then the fraction decreases because of senescence. It is seen in Fig. 4b that photosynthesis increases from zero to the seasonal maximum in two months, but then it decreases to zero in three months during all three years. Such temporal variation is also seen for total respiration during 1988 and 1989, but not during 1987.
The seasonal maximum gross photosynthesis for the TEF area is calculated to be about 25 mol m-2 mo-1, while the seasonal minimum photosyn-thesis is found to be 16 mol m-2 mo-1 (Fig. 4c). The
Fig. 5. Temporal variations of leaf area index for thecrop land area during 1987, and the calculated actualgross photosynthesis, and soil water stress factor.
Fig. 6. Monthly total precipitation (mm) and daily meanair temperature (oC) for the temperate grassland areafor the three years.
154 NITROGEN BASED MODEL FOR AUTOTROPHIC RESPIRATION
seasonal maximum total respiration is found to be about 15 mol m-2 mo-1, while the seasonal mini-mum to be about 12 mol m-2 mo-1. Thus, the sea-sonal range of photosynthesis and total respiration are, respectively, about 9 and 3 mol m-2 mo-1. The maintenance respiration is found to contribute about 80% of the total respiration.
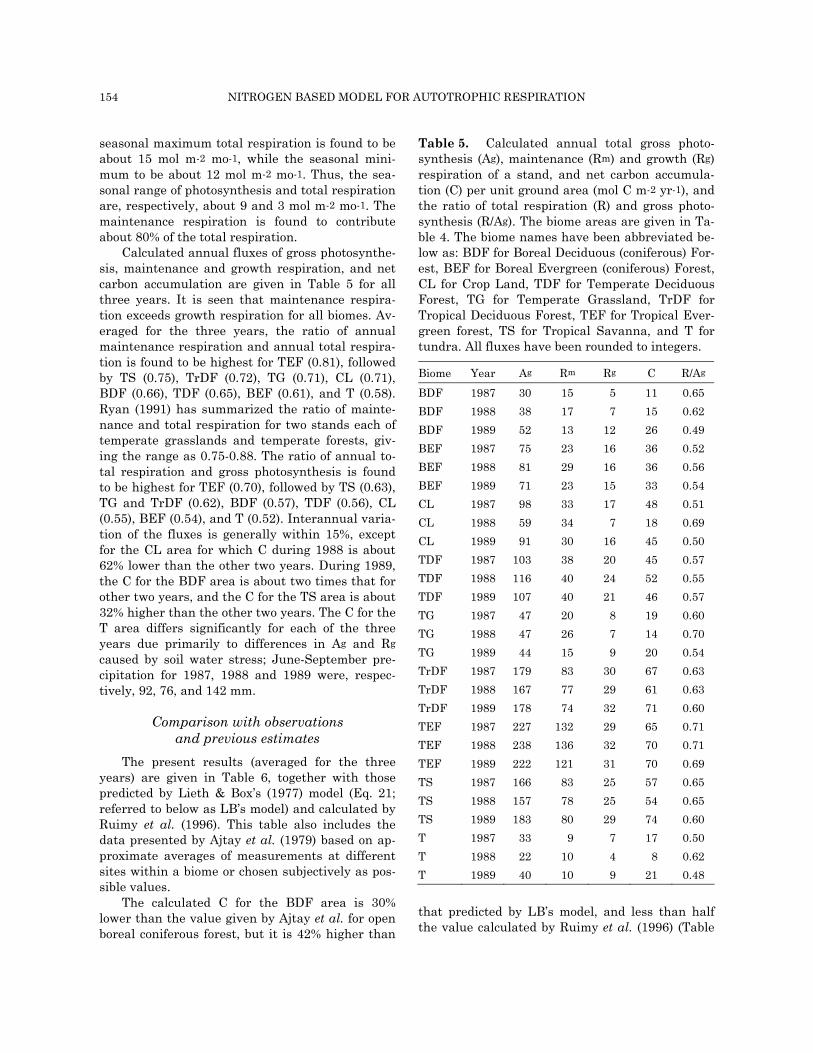
Calculated annual fluxes of gross photosynthe-sis, maintenance and growth respiration, and net carbon accumulation are given in Table 5 for all three years. It is seen that maintenance respira-tion exceeds growth respiration for all biomes. Av-eraged for the three years, the ratio of annual maintenance respiration and annual total respira-tion is found to be highest for TEF (0.81), followed by TS (0.75), TrDF (0.72), TG (0.71), CL (0.71), BDF (0.66), TDF (0.65), BEF (0.61), and T (0.58). Ryan (1991) has summarized the ratio of mainte-nance and total respiration for two stands each of temperate grasslands and temperate forests, giv-ing the range as 0.75-0.88. The ratio of annual to-tal respiration and gross photosynthesis is found to be highest for TEF (0.70), followed by TS (0.63), TG and TrDF (0.62), BDF (0.57), TDF (0.56), CL (0.55), BEF (0.54), and T (0.52). Interannual varia-tion of the fluxes is generally within 15%, except for the CL area for which C during 1988 is about 62% lower than the other two years. During 1989, the C for the BDF area is about two times that for other two years, and the C for the TS area is about 32% higher than the other two years. The C for the T area differs significantly for each of the three years due primarily to differences in Ag and Rg caused by soil water stress; June-September pre-cipitation for 1987, 1988 and 1989 were, respec-tively, 92, 76, and 142 mm.
Comparison with observations and previous estimates
The present results (averaged for the three years) are given in Table 6, together with those predicted by Lieth & Box’s (1977) model (Eq. 21; referred to below as LB’s model) and calculated by Ruimy et al. (1996). This table also includes the data presented by Ajtay et al. (1979) based on ap-proximate averages of measurements at different sites within a biome or chosen subjectively as pos-sible values.
The calculated C for the BDF area is 30% lower than the value given by Ajtay et al. for open boreal coniferous forest, but it is 42% higher than
that predicted by LB’s model, and less than half the value calculated by Ruimy et al. (1996) (Table
Table 5. Calculated annual total gross photo-synthesis (Ag), maintenance (Rm) and growth (Rg)respiration of a stand, and net carbon accumula-tion (C) per unit ground area (mol C m-2 yr-1), andthe ratio of total respiration (R) and gross photo-synthesis (R/Ag). The biome areas are given in Ta-ble 4. The biome names have been abbreviated be-low as: BDF for Boreal Deciduous (coniferous) For-est, BEF for Boreal Evergreen (coniferous) Forest,CL for Crop Land, TDF for Temperate DeciduousForest, TG for Temperate Grassland, TrDF forTropical Deciduous Forest, TEF for Tropical Ever-green forest, TS for Tropical Savanna, and T fortundra. All fluxes have been rounded to integers.
6). It is, however, not clear whether the value given by Ajtay et al. is appropriate for boreal de-ciduous coniferous forest or boreal forest – tundra ecotone (forest tundra). Potter et al. (1993) calcu-lated C to be 13 mol m-2 yr-1, which is 31% lower than the present result. Hunt et al. (1996) calcu-lated C to be 17 mol m-2 yr-1, which is in agree-ment with the present result. Lloyd (1999) calcu-lated C to be 19 mol m-2 yr-1, which is 11% higher than the present result. For deciduous and ever-green coniferous forests in Siberia, Schulze et al. (1999) determined above ground production to be 7 mol m-2 yr-1, and depending upon the assumption used to determine below-ground production (turn-over of fine roots), C was estimated to be 9-12 mol m-2 yr-1. For a deciduous coniferous stand near Tura (64.3oN, 100.2oE), Kajimoto et al. (1999) determined above ground production to be 6 mol m-2 yr-1, and depending upon the assumption used to determine below-ground production (turnover of fine roots), C was estimated to be 8-31 mol m-2 yr-1. The present values of C for 1987 and 1988 are fairly consistent with these estimated values, and, although the result for 1989 is somewhat higher, it is within the range of estimated values (Table 5).
While there are substantial differences in Ag cal-culated in the present study and those determined from LB’s model and calculated by Ruimy et al. (1996) (Table 6), there does not appear to be any measured gross production or respiration against which to evaluate these calculated results. The present R/Ag compares well with Ruimy et al. but substantially higher than that predicted by LB’s model.
The calculated for C for the BEF area is 9% higher than the value given by Ajtay et al. and that predicted by LB’s model, and 25% higher than the value calculated by Ruimy et al. (1996) (Table 6). Using a calibrated process-based model McGuire et al. (1992) calculated C to be 19 mol m-2 yr-1 for boreal forest, which is 84% lower than the present calculation. Also using a calibrated proc-ess-based model Warnant et al. (1994) calculated C to be 35 mol m-2 yr-1 for needle-leaf forest, which agrees well with the present calculation. Using a calibrated radiation use efficiency based model, Potter et al. (1993) calculated mean C for needle-leaf evergreen trees to be 19 mol m-2 yr-1, which is about half the value calculated in this study. Lloyd (1999) calculated C to be 10 mol m-2 yr-1, which is
Table 6. The present results (averaged over the three years), together with those determined from Li-eth and Box’s (1977) model using precipitation and temperature data in Table 4 (averaged for the threeyears), calculated by Ruimy et al. (1996) and a synthesis of measurements given by Ajtay et al. (1979). Thecarbon content of 45% given by Ajtay et al. (1979) has been used to convert their fluxes quoted in units ofdry matter to its carbon equivalent. Percent discrepancy (%) between the present value of C and the valuegiven by Ajtay et al. (1979) is given. The fluxes are in units of mol C m-2 yr-1, and abbreviation for biomenames and symbols are as given in Table 5.
Present Lieth & Box Ruimy et al. Ajtay et al. % Biome
Ag C R/Ag Ag C R/Ag Ag C R/Ag C
BDF 40 17 0.57 17 12 0.31 77 35 0.55 24*a -30
BEF 76 35 0.54 51 32 0.38 61 28 0.55 32b +9
CL 82 37 0.55 - - - - - - 45c -18
TDF 108 48 0.56 68 40 0.41 96 44 0.54 49d -2
TG 46 18 0.62 34 22 0.35 67 41 0.39 19e -5
TrDF 175 66 0.62 159 74 0.53 136 55 0.60 60f +10
TEF 229 68 0.70 289 99 0.66 165 62 0.63 86g -21
TS 169 62 0.63 167 74 0.56 114 54 0.53 86h -28
T 32 15 0.52 17 12 0.31 20 12 0.39 13i +15
*a (Boreal coniferous, open); b (Boreal coniferous, closed); c (Temperate annuals); d (Temperate deciduous/mixed); e (Temperate dry grassland); f (Tropical seasonal forest); g (Tropical humid forest); h (Grass dominated savanna); i (Low arctic/alpine).
156 NITROGEN BASED MODEL FOR AUTOTROPHIC RESPIRATION
about one third the value calculated here. The cal-culated Ag is 49% and 25% higher than that from LB’s model and estimated by Ruimy et al. (1996) respectively. The calculated ratio R/Ag is much higher than that predicted by LB’s model, but agrees well with that calculated by Ruimy et al. (1996). Ryan et al. (1997) have given carbon bal-ance data for two boreal coniferous stands each of Picea mariana and Pinus banksiana, while Malhi et al. (1999) have given such data for one stand of Picea mariana. The mean (standard deviation, range, n=5) of Ag is 80 (11, 64-91) mol m-2 yr-1, C is 26 (10, 19-43) mol m-2 yr-1, R is 54 (14, 37-69) mol m-2 yr-1, and (R/Ag) is 0.67 (0.12, 0.46-0.77). The present Ag is 5% lower, the C is 35% higher, while (R/Ag) is 19% lower than the mean values from these carbon balance data, although the present results for C and (R/Ag) are within the range of the carbon balance data. It appears that the present calculations are underestimating R by about 20%.
The calculated C for the CL area is 18% lower than the value given by Ajtay et al. (Table 6). Con-sidering the specific crops which are grown within and around the study area and field measure-ments of dry matter production of these crops, the C for the CL area is estimated to be about 49 mol m-2 yr-1 (Appendix D), and the calculated C is 24% lower. Warnant et al. (1994) calculated C to be 64 mol m-2 yr-1, which is 42% higher than the present result. Potter et al. (1993) calculated mean C for all cultivated areas to be 24 mol m-2 yr-1. Lloyd (1999) calculated C to be 106 mol m-2 yr-1, which is about a factor of two higher than the present re-sult. The results in Table 5 show that C for 1988 is substantially lower than the other two years. The average C for 1987 and 1989 is 47 mol m-2 yr-2, which is 4% higher than the value given by Ajtay et al. but 4% lower than the estimated value for the area (Appendix D). Considering available measurements, Amthor (1989) has suggested that annual respiration (R) for CL is about 50% of Ag. The present calculations, averaged over the three years, are giving this fraction as 55% (Table 6). Again, if the results for 1988 are excluded, the R/Ag for the other two years agrees well with that suggested by Amthor (1989) (Table 5).
The present result for C for the TDF area agrees well with the value given by Ajtay et al. (1979) but is 20% and 9% higher than that derived from LB’s model and calculated by Ruimy et al. (1996) respectively (Table 6). McGuire et al. (1992) calculated C to be 61 mol m-2 yr-1, which is 21%
higher than the present result. Warnant et al. (1994) calculated C to be 55 mol m-2 yr-1, which is 13% higher than the present result. Potter et al. (1993) calculated mean C for broad-leaf deciduous and mix of broad-leaf and needle-leaf trees to be 26 mol m-2 yr-1, which is 85% lower than the present value. The present Ag is, respectively, 59% and 13% higher than that derived from LB’s model and calculated by Ruimy et al. (1996). The carbon bal-ance data given in Kira (1975), Ryan (1991) and Malhi et al. (1999) give mean (standard deviation, range, n=10) of Ag as 113 (41, 56-181) mol m-2 yr-1, C as 57 (14, 30-79) mol m-2 yr-1, R as 56 (31, 26-120) mol m-2 yr-1, and (R/Ag) as 0.48 (0.09, 0.37-0.66). These mean Ag and C are, respectively, 4% and 16% higher, while the mean (R/Ag) is 17% lower than the present results. These carbon bal-ance data data suggest that R is being overesti-mated by about 10%.
The present result for C for the TG area is 5% lower than the value given by Ajtay et al. (1979) but it is 18% and 56% lower than that derived from LB’s model and calculated by Ruimy et al. (1996) respectively (Table 6). McGuire et al. (1992) calculated C to be 17 mol m-2 yr-1 for temperate short grassland, which is 6% lower than the pre-sent result. Potter et al. (1993) calculated C to be 15 mol m-2 yr-1 for perennial grassland, which is 20% lower than the present result. Warnant et al. (1994) calculated C to be 28 mol m-2 yr-1 for grass-land, which is 36% higher than the present result. Lloyd (1999) calculated C for grasslands to be 27 mol m-2 yr-1, which is 33% higher than the present result. The present Ag is 35% higher than that from LB’s model, and 31% lower than that calcu-lated by Ruimy et al. (1996). The present R/Ag (viz., 0.62) is substantially higher than that from LB’s model and determined by Ruimy et al. (ca. 0.37). Sims & Coupland (1979) have presented measurements for net primary production at 10 locations for one to three years periods, which give mean (standard deviation, range, n=24) as 0.80 (0.30, 0.23-1.43) kg (dry matter) m-2 yr-1. These measurements at the Matador (50.7oN, 107.8oW) site, which is at the similar latitude as the present study area and has similar annual precipitation (338 mm), reported for three years give mean and the range of C, respectively, as 0.70 and 0.54-0.87 kg (dry matter) m-2 yr-1. The mean (range) NPP at Matador would correspond to C of 23 (18-29) mol m-2 yr-1, if the carbon content of dry matter is taken to be 40% (Dwivedi 1971; Hughes et al.
CHOUDHURY 157
1999). The present result for C is 22% lower than the mean value at Matador, but it is at the lower end of the range. Heslehurst & Wilson (1974) have present field data for R/Ag of Panicum maximum as 0.57, while Ryan (1991) has reported two stud-ies giving this ratio as 0.53 and 0.61. While the present result for R/Ag averaged over the three years (viz., 0.62; Table 6) is little higher than these reported measurements, the results for C and R/Ag for 1987 and 1989 are more along the line of above quoted measurements (Table 5).
The calculated C for the TrDF area is 10% higher than the value given by Ajtay et al. (1979) but it is 11% lower than that from LB’s model and 20% higher than that calculated by Ruimy et al. (1996) (Table 6). Warnant et al. (1994) calculated C to be 59 mol m-2 yr-1, which is 12% lower than the present result. Using a process-based model Raich et al. (1991) determined C to be 70 mol m-2 yr-1, which is 6% higher than the present result. Esti-mates from the measurements reported at four sites give C in the range 44-80 mol m-2 yr-1 (Ap-pendix E), which averages to 58 mol m-2 yr-1. The present result (66 mol m-2 yr-1) is 14% higher than this average. The present value of R/Ag (viz., 0.62) agrees well with Ruimy et al. (1996) (viz., 0.60), but 17% higher than that predicted by LB’s model (0.53). Brown & Lugo (1982) have given gross and net dry matter production for a stand of sub-tropi-cal dry forest near Ensenada (18.0oN, 65.9oW) as, respectively, 19.0 and 11.0 t ha-1 yr-1, which would give R/Ag as 0.58.
The present result for C for the TEF area is 21% lower than the value given by Ajtay et al. (1979) and 31% lower than that from LB’s model, but 10% higher than that calculated by Ruimy et al. (1996) (Table 6). Warnant et al. (1994) calcu-lated C to be 77 mol m-2 yr-1, which is 12% higher than the present result. Potter et al. (1993) calcu-lated C to be 86 mol m-2 yr-1, which is 21% higher than the present value. Modeling by Raich et al. (1991) had given C as 81 mol m-2 yr-1, which is 16% higher than the present result. The present Ag is 21% lower than that from LB’s model, but 39% higher than that estimated by Ruimy et al. Mearements at Khao Chong (7.6oN, 99.8oE) re-ported by Kira (1975) give Ag as 334 mol m-2 yr-1, while gross ecosystem production at Reserva Jaru (10.1oS, 61.9oW) and near Manaus (2.5oS, 60.1oW) were determined to be, respectively, 204 and 250 mol m-2 yr-1 (Lloyd et al. 1995; Malhi et al. 1998). The present value of Ag is within the range of
these reported measurements, and it agrees well with the average of two measurements within the Amazonian forest (viz., 204 and 250 mol m-2 yr-1). The ratio (R/Ag) was determined to be 0.66 at Khao Chong (Kira 1975), and 0.46 near Manaus (Malhi et al. 1999). At El Verde (18.3oN, 65.8oW), net and gross dry matter production were determined to be, respectively, 28.9 and 100 t ha-1 yr-1 (Lieth & Box 1977), giving (R/Ag) as 0.71. For Pasoh Forest (3.0oN, 102.3oE), net and gross dry matter produc-tion have been determined to be, respectively, 22.5 and 81 t ha-1 yr-1 (Aoki et al. 1975; Cannell 1982; Yoda 1983), which would give (R/Ag) as 0.72. Allen & Lemon (1976) have reported the average gross and net CO2 assimilation for two days of meas-urements for a stand near Turrialba (9.9oN, 83.6oW) as, respectively, 41.6 and 17.0 g (CO2) m-2 d-1, which would give (R/Ag) as 0.59. While the pre-sent result for R/Ag (viz., 0.70) is within the range of reported values, measurements near Manaus reported by Malhi et al. (1999) and comparison in Table 6 suggest that respiration is being overesti-mated by about 20%.
The calculated C for the TS area is 28% lower than the data given by Ajtay et al. and it is 19% lower than that from LB’s model but 15% higher than that calculated by Ruimy et al. (Table 6). Us-ing an empirical model, Scholes & Hall (1996) es-timated C to be 53 mol m-2 yr-1, which is 17% lower than the present result. Warnant et al. (1994) calculated C to be 54 mol m-2 yr-1, which is 15% lower than the present result. Modeling by Raich et al. (1991) had given C to be 78 mol m-2 yr-1, which is 21% higher than the present result. Scholes & Hall (1996) have summarized available measurements of C by TS areas. According to this summary, the data is available at Nylsvley (24.7oS, 28.7oE) and three sites near Lamoto (6.2oN, 5.0oE). By taking the carbon content of dry matter for trees and grasses as, respectively, 48% and 40%, one obtains the value of C at Nylsvley as 35 mol m-2 yr-1 (of which 46% was contributed by the grass layer), while it averages to be 104 mol m-2 yr-1 (range 93-110 mol m-2 yr-1) for sites near Lamoto (of which 94% was contributed by the grass layer). For a TS within the Chandraprabha sanctuary (25.9oN, 83.2oE), Singh (1989) has given C to be 39 mol m-2 yr-1 (of which 78% was contrib-uted by the grass layer). For three sites on the Vindhya plateau (24.2o-24.4oN, 82.9o-83.1oE), Pandey & Singh (1992) found the average C to be 58 mol m-2 yr-1 (range 50-67 mol m-2 yr-1), with
158 NITROGEN BASED MODEL FOR AUTOTROPHIC RESPIRATION
herbaceous cover contributing about 74% of the total C. The present value of C is within the range of these measurements. The average of the C val-ues at Nylsvley, Lamoto, Chandraprabha and Vindhya is 59 mol m-2 yr-1, which is 5% lower than the calculated C. The present Ag agrees well with that calculated from LB’s model, but it is 48% higher than the value calculated by Ruimy et al.. The present R/Ag is higher than that predicted by LB’s model and calculated by Ruimy et al. by about 17%. I could not find any reported measurements for Ag and R, which might allow a better under-standing of the discrepancy of 28% for C (Table 6). However, based on some assumptions, McGuire et al. (1992) determined carbon balance at Nylsvley, which gives R/Ag as 0.60. The present R/Ag is 5% higher.
The present result for C for the T area is 15% higher than the value given by Ajtay et al. and 25% higher than the values from LB’s model and that calculated by Ruimy et al. (Table 6). Calcula-tion of Warnant et al. (1994) had given C to be 18 mol m-2 yr-1, which is 17% higher than the present result. Potter et al. (1993) calculated C to be 7 mol m-2 yr-1, which is less than half of the present re-sult. McGuire et al. (1992) calculated C to be 8 mol m-2 yr-1 for wet/moist tundra, which is 88% lower than the present result. Considering available measurements, Bliss (2000) has given net primary production to be in the range, 0.15-0.45 kg (dry matter) m-2 yr-1, which would be equivalent to C of 6-16 mol m-2 yr-1 if carbon content of dry matter is taken to be 48%. The present result is at the high end of this range (Table 6). Using a calibrated eco-system-level model, Hobbie et al. (1998) deter-mined C during one year (1995) for the Kuparuk River basin (ca. 69o-70oN, 149.2o-149.8oW) to be 8 mol m-2 yr-1, which is about half the value calcu-lated here for three year average (15 mol m-2 yr-1) but agrees with the result for 1988 (Table 5). The values C for 1987 and 1988 are within the range suggested by Bliss (2000), but it is outside the range for 1989 (Table & 5). The present Ag is 88% and 60% higher than, respectively, from LB’s model and that calculated by Ruimy et al. The pre-sent R/Ag is higher than that calculated from LB’s model and obtained by Ruimy et al. Considering available data, McGuire et al. (1992) reported C and Ag for wet tundra near Toolik Lake (68.6oN, 149.6oW) to be, respectively, 10 and 37 mol m-2 yr-1, giving R/Ag as 0.73. Based on measurements and ecosystem-level modeling, McKane et al. (1997)
determined Ag for Carex-Eriophorum meadow vegetation at Barrow (71.3oN, 156.7oW) and tus-sock tundra at Toolik Lake (68.6oN, 149.6oW) to be, respectively, 17 and 39 mol m-2 yr-1, and the present Ag for three year average (32 mol m-2 yr-1; Table 6) is within this range, but Ag for 1989 is outside this range (Table 5). Rather high Ag for 1989 is because of significantly higher precipita-tion during this year (Table 4), and thus minimiz-ing stress. McKane et al. (1997) determined R/Ag for these two sites to be, respectively, 0.57 and 0.76, and, while the present result for three year average (0.52; Table 6) is outside the range, the result for 1988 is within the range (Table 5). Both Ag and R/Ag for 1989 are outside the range deter-mined from measurements and results from a cali-brated model (Table 5). If we exclude the results for 1989, the average C for the other two years, viz., 12 mol m-2 yr-1, is 8% lower than the value given by Ajtay et al. and R/Ag (0.56) is closer to the range of values determined by McKane et al. (1997).
From the above comparisons, the calculated C (averaged for the three years) differ by about 30% from the measurements summarized by Ajtay et al. (1979) for the BDF and TS areas; the discrep-ancy for all other biome areas is generally less than 20%. There are more reported measurements for C than for Ag or R. These data suggest that R is being underestimated for the BEF area, and over-estimated for TEF area by about 20%.
Results of sensitivity analysis Sensitivity analysis has been done for variabil-
ity in the growth conversion efficiency (YG; Table 1), differences in the temperature response function for maintenance respiration {f (T); Eq. 4 and Fig. 2}, distinguishing the temperature of shoot and root (Eq. 4), variability in the sapwood maintenance respiration per unit seasonal maximum leaf area index (Eq. 14 and Table 2), the effect of variations in the fraction of tree cover in the TS area (fw, Eq. 20), and decreasing Rm of foliage and roots per unit nitrogen content for tropical biomes as compared to temperate biomes (i.e., decreasing the values of in Table 3 for tropical biomes) due to possible adapta-tion to growing temperature (Ryan 1995).
Any variability in YG can directly translate to an equivalent variability in Rg (Eq. 2) and C (Eq. 19). Thus, 12% increase (decrease) in YG can in-crease (decrease) the calculated C values by 12%.
CHOUDHURY 159
Any discrepancy between the calculated and ob-served C up to about 12% may not be resolved sat-isfactorily because of the uncertainty in pre-scribing YG (Table 1). There is insufficient data to resolve possible biome-specific differences (for ex-ample, YG for alpine and arctic plants could well be lower than that for tropical plants because of higher lipid content of tundra plants; Golley 1961). Modeling of Choudhury (2000 c) showed that R/Ag decreased during growth when YG was assumed not to change during growth, but variations in R/Ag decreased considerably when changes in YG during growth was taken into consideration. These sensitivity results suggest that a better quantifica-tion of YG is desirable for a more accurate assess-ment of R/Ag.
The impact of changing the temperature re-sponse function from non-linear to linear on Rm, R, and C (averaged for the three years) is given in Table 7. The impact is found to be generally less than 5%, except for the BDF, TDF and T areas, for which R increased by about 10% and C decreased by 10%.
The results presented above were obtained by taking shoot and root temperature to be equal to air temperature, as was done in the studies re-
ported by Raich et al. (1991), McGuire et al. (1992), Warnant et al. (1994) and Ruimy et al. (1996), al-though Hunt et al. (1996) distinguished the tem-perature of shoot and roots. Measurements re-ported by Toy et al. (1978), Zheng et al. (1993), among others, show that mean soil temperature of vegetated ground in non-mountainous areas at 0.1-0.3 m depth during the growing season can differ from air temperature by 1-3oC. Calculations done by taking root temperature to be equal to soil tem-perature, rather than air temperature, showed that R is not affected by more than 3% (Table 8). Changes of less than 1% are calculated for crop land (CL) and tropical evergreen forest (TEF) ar-eas. For CL, nitrogen content of roots is about 15% of that in shoot (Fig. 3; Eqs. 8 and 9) and thus its contribution to the maintenance respiration of a stand is small. For TEF, soil temperature did not change significantly for being in moist condition and because of high vegetation cover (leaf area in-dex of about 5). Measurements of temperature for a typical day (November 22, 1973) above and within a rainforest (Pasoh Forest; 3.0oN, 102.3oE) reported by Aoki et al. (1975) show that mean daily temperature above the canopy and at soil surface to be almost identical (respectively, 23.5o and 23.4oC). Thus, it is reasonable to approximate mean daily root temperature by the corresponding air temperature for TEF area.
The sapwood maintenance respiration per unit
Table 7. Results of sensitivity analysis for theeffect of changing the temperature response func-tion for maintenance respiration (Fig. 2) on themaintenance respiration of a stand (Rm), totalrespiration (R) and net carbon accumulation (C)for the biome areas, averaged for the three years.Percent changes are positive when the effect ofchanging the response function was to increasethe flux relative to the standard case (Tables 5and 6). Abbreviation for the biome names is asnoted in Table 5.
Biome ∆Rm (%) ∆R (%) ∆C (%)
BDF +13 +7 -10
BEF +9 +4 -5
CL +6 +4 -4
TDF +19 +9 -11
TG +4 +2 -4
TrDF 0 0 0
TEF -2 -2 +2
TS -2 -1 +1
T +28 +12 -12
Table 8. Results of sensitivity analysis for dis-tinguishing shoot and root temperature for calcu-lating their maintenance respiration. Percentchange from the base values (Tables 5 and 6) formaintenance respiration of the stand (∆Rm), totalrespiration (∆R) and net carbon accumulation (∆C)of the biome areas, averaged for the three years,when root temperature was taken to be soil tem-perature rather than air temperature.
160 NITROGEN BASED MODEL FOR AUTOTROPHIC RESPIRATION
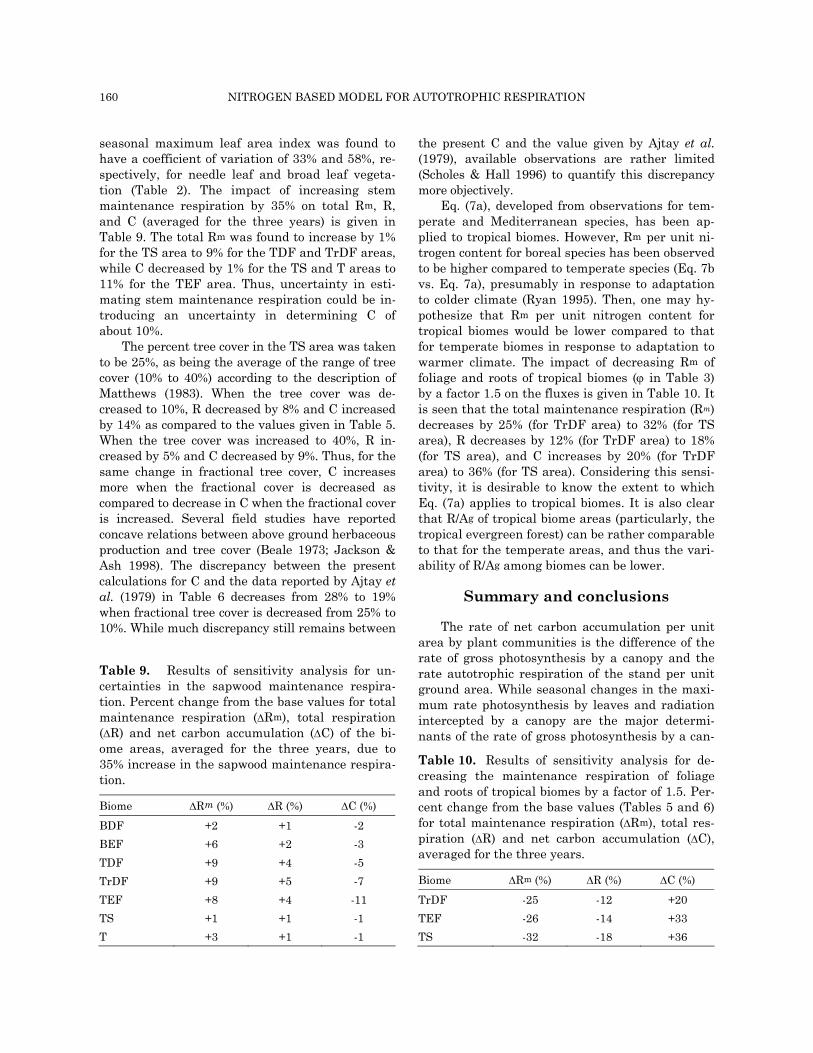
seasonal maximum leaf area index was found to have a coefficient of variation of 33% and 58%, re-spectively, for needle leaf and broad leaf vegeta-tion (Table 2). The impact of increasing stem maintenance respiration by 35% on total Rm, R, and C (averaged for the three years) is given in Table 9. The total Rm was found to increase by 1% for the TS area to 9% for the TDF and TrDF areas, while C decreased by 1% for the TS and T areas to 11% for the TEF area. Thus, uncertainty in esti-mating stem maintenance respiration could be in-troducing an uncertainty in determining C of about 10%.
The percent tree cover in the TS area was taken to be 25%, as being the average of the range of tree cover (10% to 40%) according to the description of Matthews (1983). When the tree cover was de-creased to 10%, R decreased by 8% and C increased by 14% as compared to the values given in Table 5. When the tree cover was increased to 40%, R in-creased by 5% and C decreased by 9%. Thus, for the same change in fractional tree cover, C increases more when the fractional cover is decreased as compared to decrease in C when the fractional cover is increased. Several field studies have reported concave relations between above ground herbaceous production and tree cover (Beale 1973; Jackson & Ash 1998). The discrepancy between the present calculations for C and the data reported by Ajtay et al. (1979) in Table 6 decreases from 28% to 19% when fractional tree cover is decreased from 25% to 10%. While much discrepancy still remains between
the present C and the value given by Ajtay et al. (1979), available observations are rather limited (Scholes & Hall 1996) to quantify this discrepancy more objectively.
Eq. (7a), developed from observations for tem-perate and Mediterranean species, has been ap-plied to tropical biomes. However, Rm per unit ni-trogen content for boreal species has been observed to be higher compared to temperate species (Eq. 7b vs. Eq. 7a), presumably in response to adaptation to colder climate (Ryan 1995). Then, one may hy-pothesize that Rm per unit nitrogen content for tropical biomes would be lower compared to that for temperate biomes in response to adaptation to warmer climate. The impact of decreasing Rm of foliage and roots of tropical biomes (ϕ in Table 3) by a factor 1.5 on the fluxes is given in Table 10. It is seen that the total maintenance respiration (Rm) decreases by 25% (for TrDF area) to 32% (for TS area), R decreases by 12% (for TrDF area) to 18% (for TS area), and C increases by 20% (for TrDF area) to 36% (for TS area). Considering this sensi-tivity, it is desirable to know the extent to which Eq. (7a) applies to tropical biomes. It is also clear that R/Ag of tropical biome areas (particularly, the tropical evergreen forest) can be rather comparable to that for the temperate areas, and thus the vari-ability of R/Ag among biomes can be lower.
Summary and conclusions
The rate of net carbon accumulation per unit area by plant communities is the difference of the rate of gross photosynthesis by a canopy and the rate autotrophic respiration of the stand per unit ground area. While seasonal changes in the maxi-mum rate photosynthesis by leaves and radiation intercepted by a canopy are the major determi-nants of the rate of gross photosynthesis by a can-
Table 9. Results of sensitivity analysis for un-certainties in the sapwood maintenance respira-tion. Percent change from the base values for totalmaintenance respiration (∆Rm), total respiration(∆R) and net carbon accumulation (∆C) of the bi-ome areas, averaged for the three years, due to35% increase in the sapwood maintenance respira-tion.
Table 10. Results of sensitivity analysis for de-creasing the maintenance respiration of foliageand roots of tropical biomes by a factor of 1.5. Per-cent change from the base values (Tables 5 and 6)for total maintenance respiration (∆Rm), total res-piration (∆R) and net carbon accumulation (∆C),averaged for the three years.
opy, seasonal changes in biomass of organs, their specific respiration coefficient and temperature are important determinants of the rate of respiration by the stand, in addition to photosynthesis. A bet-ter understanding of the carbon balance of plant communities, and how this balance might change due to changes in land cover or environmental conditions requires explicit evaluation of the rates of photosynthesis and respiration.
The autotrophic respiration (R) was calculated as the sum of maintenance (Rm) and growth (Rg) components using satellite and field observations. The Rm of foliage and living fine roots per unit ground area for different biomes was determined objectively from observed nitrogen content of these organs per unit ground area, and taking into con-sideration of diurnal and seasonal variations of temperature. The Rm of stems of herbaceous crops and natural grasslands was also determined from the nitrogen content. An empirical equation for sapwood maintenance respiration was derived ac-cording to pipe model, which was found to be con-sistent with an equation derived independently considering sapwood biomass and its maintenance coefficient. The Rg was calculated from the differ-ence of gross photosynthesis by a canopy per unit ground area (Ag) and Rm. The Ag was expressed as a product of biome-specific radiation use efficiency for gross photosynthesis under unstressed condi-tions (RUE), intercepted photosynthetically active radiation (IPAR), and stress factors to account for soil water stress and temperature away from op-timum. The unstressed RUE for different biomes was determined from the maximum rate of photo-synthesis by leaves, foliage temperature and frac-tional diffuse incident radiation. All stresses which affect Ag also affect R. The rate of net carbon ac-cumulation per unit ground area (C) was deter-mined as the difference of Ag and R.
Calculations were done using spatially repre-sentative, synchronous data for 36 consecutive months (1987-1989) derived from satellite and field observations for large contiguous areas (ca. 105 km2) of boreal deciduous coniferous forest (BDF), boreal evergreen coniferous forest (BEF), crop land (CL), temperate deciduous forest (TDF), temperate grassland (TG), tropical deciduous for-est (TrDF), tropical evergreen forest (TEF), tropi-cal savanna (TS), and tundra (T).
On annual basis, Rm was found to exceed Rg for all biome areas. Averaged for the three years, the ratio of Rm and R was found to be highest for
TEF (0.81), followed by TS (0.75), TrDF (0.72), TG (0.71), CL (0.71), BDF (0.66), TDF (0.65), BEF (0.61), and T (0.58). The ratio of R and Ag was found to be highest for TEF (0.70), followed by TS (0.63), TG and TrDF (0.62), BDF (0.57), TDF (0.56), CL (0.55), BEF (0.54), and T (0.52). Inter-annual variation of the fluxes was generally within 15%, except for the BDF area for which C during 1989 was about a factor two higher than the other two years, while C for the CL area during 1988 was about 62% lower than the other two years. The C for the TS area during 1989 was about 32% higher than the other two years. The C for the T area for 1988 was half the value found for 1987, and nearly one-third the value for 1989. Previous large-scale modeling studies did not addressed in-terannual variations of respiration and net carbon accumulation for different biomes.
The calculated C (averaged for the three years) was found to be about 30% lower for the BDF and TS areas, when compared against a synthesis of observed and likely values of C. However, in the absence of observed Ag and R, it could not be de-termined which of these two fluxes is contributing more, and/or which way, to this discrepancy. The discrepancy for C for other biome areas was gener-ally less than 20%. Aggregately for all biome area, the calculated C was about 10% lower than the reported data. The calculated Ag values were gen-erally within the range of measurements, where available. The present calculations for R might be underestimating the flux for BEF area, and over-estimating it for TEF area by about 20%.
Sensitivity analysis was done to assess the im-pact of variability in the growth conversion effi-ciency (YG), differences in the temperature re-sponse function for maintenance respiration, dif-ferences in shoot and root temperature, variability in the sapwood maintenance respiration per unit of the seasonal maximum leaf area index, the ef-fect of variations in the fractional cover of trees in the TS area, and uncertainty in determining main-tenance respiration per unit nitrogen content of tropical biomes from measurements on temperate species.
Any variability in YG directly translates to equivalent variability in C. Variability of YG was found to be about 12%, and, if this variability is assumed to be due only to differences in biochemi-cal composition of plants, any discrepancy between the calculated and observed C up to about 12% cannot be resolved satisfactorily.
162 NITROGEN BASED MODEL FOR AUTOTROPHIC RESPIRATION
The impact of changing the temperature re-sponse function was found to be generally less than 5%, except for the TDF and T area, for which R increased by about 10% and C decreased by 10%. Calculations done by taking root temperature to be equal to soil temperature, rather than air tem-perature, showed that R is not affected by more than 3%.
The effect of increasing sapwood maintenance respiration by 35% was to increase total respira-tion by 1% (for the TS and T areas) to 5% (for the TrDF area), while C decreased by 1% (for the TS and T areas) to 11% (for the TEF area).
The fraction of woody cover in the TS area was taken to be 25%, being the average of the range of woody cover (10% to 40%) suggested for the area. When the woody cover was decreased to 10%, R decreased by 8% and C increased by 13%. When the woody cover was increased to 40%, R increased by 5% and C decreased by 9%.
Relationships between maintenance respira-tion and nitrogen content used in the present study are based upon observations for temperate, Mediterranean, and boreal species, and their ap-plicability to tropical species is not known. When maintenance respiration foliage and roots per unit nitrogen content for the tropical biome areas was decreased by a factor of 1.5 as compared to that for temperate species, R for tropical biome areas de-creased by 12-18% and C increased by 20-36%. Considering this sensitivity, it is desirable to de-termine variation of maintenance respiration with nitrogen content for tropical biomes. If mainte-nance respiration per unit nitrogen content for tropical species is observed to be lower than that for temperate species, R/Ag for the tropical biome areas could become comparable to that for the temperate regions.
The results presented in this study can be im-proved, for example, by quantifying, (a) temporal variation of biomass and nitrogen content of living fine roots in relation to those of foliage, and (b) fo-liage maintenance respiration per unit nitrogen content for species growing in the tropics.
References
Adu-Bredu, S., T. Yokota & A. Hagihara. 1997. Long-term respiratory cost of maintenance and growth of field-grown young hinoki cypress (Chamaecyparis obtusa). Annals of Botany 80: 753-758.
Ajtay, G. L., P. Ketner & P. Duvigneaud. 1979. Terrestrial primary production and phytomass. pp. 129-181. In: B. Bolin, E. T. Degens, S. Kempe & P. Ketner (eds.) The Global Carbon Cycle. John Wiley, New York.
Alban, D. H., D. A. Perala, & B. E. Schlaegel. 1978. Bio-mass and nutrient distribution in aspen, pine, and spruce stands on the same soil type in Minnesota. Canadian Journal of Forest Research 8: 290-299.
Allen, Jr., L. H. & E. R. Lemon. 1976. Carbon dioxide exchange and turbulence in a Costa Rican tropical rain forest. pp. 265-308. In: J. L. Monteith (ed.) Vegetation and the Atmosphere, Vol. 2. Academic Press, New York.
Amthor, J. S. 1989. Respiration and Crop Productivity. Springer-Verlag, New York.
Ando, T., K. Chiba, T. Nishimura & T. Tanimoto. 1977. Temperate fir and hemlock forests in Shikoku. pp. 213-245. In: T. Shidei & T. Kira (eds.) Primary Pro-ductivity of Japanese Forests. University of Tokyo Press, Tokyo.
Aoki, M., K. Yabuki & H. Koyama. 1975. Micrometeorol-ogy and assessment of primary production of a tropical rain forest in west Malaysia. Journal of Ag-ricultural Meteorology 31: 115-124.
Atkin, O. K., C. Holly & M. C. Ball. 2000. Acclimation of snow gum (Eucalyptus pauciflora) leaf respiration to seasonal and diurnal variations in temperature: the importance of changes in the capacity and tempera-ture sensitivity of respiration. Plant Cell and Envi-ronment 23: 15-26.
Baruch, Z. & J. A. Gomez. 1996. Dynamics of energy and nutrient concentration and construction cost in a native and two alien C4 grasses from two neotropi-cal savannas. Plant and Soil 181: 175-184.
Bassett, D. M., W. D. Anderson & C. H. E. Werkhoven. 1970. Dry matter production and nutrient uptake in irrigated cotton (Gossypium hirsutum). Agronomy Journal 62: 299-303.
Beale, I. F. 1973. Tree density effects on yield of herbage and tree components in south west Queensland mulga (Acacia aneura F. Meull.) scrub. Tropical Grassland 7: 135-142.
Beaver, J. S. & R. L. Cooper. 1982. Dry matter accumu-lation patterns and seed yield components of two indeterminate soybean cultivars. Agronomy Journal 74: 380-383.
Beaver, J. S., R. L. Cooper & R. J. Martin. 1985. Dry matter accumulation and seed yield of determinate and indeterminate soybeans. Agronomy Journal 77: 675-679.
Blackmer, A. M. & C. A. Sanchez. 1988. Response of corn to nitrogen-15-lebeled anhydrous ammonia with and without nitrapyrin in Iowa. Agronomy Journal 80: 95-102.
CHOUDHURY 163
Bliss, L. C. 2000. Arctic tundra and Polar desert biome. pp.1-40. In: M. G. Barbour & W. D. Billings (eds.) North American Terrestrial Vegetation. Cambridge Univ. Press, New York.
Blumenthal, J. M. & M. P. Russelle. 1996. Subsoil ni-trate uptake and symbiotic dinitrogen fixation by al-falfa. Agronomy Journal 88: 909-915
Box, E. 1978. Geographical dimensions of terrestrial net and gross primary productivity. Radiation and En-vironmental Biophysics 15: 305-322.
Brooks, J. R., T. M. Hinckley, E. D. Ford & D. G. Sprugel. 1991. Foliage dark respiration in Abies amabilis (Dougl.) forbes: Variation within a canopy. Tree Physiology 9: 325-338.
Brown, S. & A. E. Lugo. 1982. The storage and produc-tion of organic matter in tropical forests and their role in the global carbon cycle. Biotropica 14: 161-187.
Bunce, J. A. 1989. Growth rate, photosynthesis and res-piration in relation to leaf area index. Annals of Bot-any 63: 459-463.
Buxton, D. R. & W. F. Wedin. 1970. Establishment of perennial forages. Agronomy Journal 62: 93-97.
Cannell, M. G. R. 1982. World Forest Biomass and Primary Production Data. Academic Press, New York.
Chew, R. M. & A. E. Chew. 1965. The primary produc-tivity of a desert-shrub (Larrea tidentata) commu-nity. Ecological Monographs 35: 355-375.
Choudhury, B. J. 2000 a. Evaluation of a model adapt-able to satellite data for estimating daily gross pho-tosynthesis. Remote Sensing of Environment 71: 133-140.
Choudhury, B. J. 2000 b. Seasonal and interannual variations of total evaporation and their relations with precipitation, net radiation, and net carbon ac-cumulation for the Gediz basin area. Journal of Hy-drology 229: 77-86.
Choudhury, B. J. 2000 c. A sensitivity analysis of the radiation use efficiency for gross photosynthesis and net carbon accumulation by wheat. Agricultural and Forest Meteorology 101: 217-234.
Choudhury, B. J. 2001a. Estimating gross photosynthe-sis using satellite and ancillary data: Approach and preliminary results. Remote Sensing of Environment 75: 1-21.
Choudhury, B. J. 2001b. Modeling radiation- and carbon-use efficiencies of maize, sorghum, and rice. Agricultural and Forest Meteorology 106: 317-330.
Choudhury, B. J., & N. E. DiGirolamo. 1998. A biophysi-cal process-based estimate of global land surface evaporation using satellite and ancillary data. I.
Model description and comparison with observa-tions. Journal of Hydrology 205: 164-185.
Clawson, K. L., J. E. Specht & B. L. Blad. 1986. Growth analysis of soybean isolines differing in pubescence density. Agronomy Journal 78: 164-172.
Criddle, R. S., M. S. Hopkin, A. D. McArthur & L. D. Hansen. 1994. Plant distribution and the tempera-ture coefficient of metabolism. Plant, Cell and Envi-ronment 17: 233-243.
Crookston, R. K., C. A. Fox, D. S. Hill & D. N. Moss. 1978. Agronomic cropping for maximum biomass production. Agronomy Journal 70: 899-902.
Curran, B. S., K. D. Kephart & E. K. Twidwell. 1993. Oat companion crop management in alfalfa estab-lishment. Agronomy Journal 85: 998-1003.
DeLoughery, R. L., & R. K. Crookston. 1979. Harvest index of corn affected by population density, matur-ity rating, and environment. Agronomy Journal 71: 577-580.
Dubach, M. & M. P. Russelle. 1994. Forage legume roots and nodules and their role in nitrogen transfer. Agronomy Journal 86: 259-266.
Dwivedi, R. 1971. Suitability of measuring carbon as-similation rates for evaluation of solar energy con-servation and dry-matter production in plants. Tropical Ecology 12: 123-132.
Eck, H. V. & J. T. Musick. 1979. Plant water stress ef-fects on irrigated grain sorghum. II. Effects on nu-trients in plant tissues. Crop Science 19: 592-598.
Edwards, N. T. & P. J. Hanson. 1996. Stem respiration in a closed canopy upland oak forest. Tree Physiol-ogy 16: 433-439.
Foth, H. D. 1962. Root and top growth of corn. Agronomy Journal 54: 49-52.
Gifford, R. M. 1994. The global carbon cycle: A viewpoint on the missing sink. Australian Journal of Plant Physiology 21: 1-15.
Golley, F. B. 1961. Energy value of ecological materials. Ecology 42: 581-584.
Gordon, W. S. & R. B. Jackson. 2000. Nutrient concen-trations in fine roots. Ecology 81: 275-280.
Gower, S. T., H. L. Gholz, K. Nakane & V. C. Baldwin. 1994. Production and carbon allocation patterns of pine forests. Ecological Bulletins 43: 115-135.
Gower, S. T., J. G. Vogel, J. M. Norman, C. J. Kucharik, S. J. Steele & T. K. Stow. 1997. Carbon distribution and above ground net primary production in aspen, jack pine, and black spruce stands in Saskatchewan and Manitoba, Canada. Journal of Geophysical Re-search 102: 29,029-29,041.
Grier, C. C., K. A. Vogt, M. R. Keyes & R. L. Edmonds. 1981. Biomass distribution and above- and below-ground production in young and mature Abies amabilis zone ecosystems of the Washington Cas-
164 NITROGEN BASED MODEL FOR AUTOTROPHIC RESPIRATION
cades. Canadian Journal of Forest Research 11: 155-167.
Griffin, K. L. 1994. Calorimetric estimates of construc-tion cost and their use in ecological studies. Func-tional Ecology 8: 551-562.
Ham, G. E. & A. C. Caldwell. 1978. Fertilizer placement effects on soybean seed yield, N2 fixation, 33P up-take. Agronomy Journal 70: 779-783.
Hanway, J. J. & C. R. Weber. 1971a. N, P, and K per-centages in soybean (Glycine max (L.) Merrill) plant parts. Agronomy Journal 63: 286-290.
Hanway, J. J. & C. R. Weber, C. R. 1971b. Dry matter accumulation in eight soybean (Glycine max (L.) Merrill) varieties. Agronomy Journal 63: 227-230.
Hanway, J. J. & W. A. Russell. 1969. Dry-matter accu-mulation in corn (Zea mays L.) plants: Comparisons among single-cross hybrids. Agronomy Journal 61: 947-951.
Hattendorf, M. J., M. S. Redelfs, B. Amos, L. R. Stone & R. E. Gwin, Jr. 1988. Comparative water use char-acteristics of six row crops. Agronomy Journal 80: 80-85.
Harata, H., H. Sato, I. Hotta & Y. Tadaki. 1969. On the amount of nutrient contained in 28-year-old Cryp-tomeria forest (C. japonica D. Don) and Chamaecy-paris forest (C. obtusa Sieb. et Zucc.). Journal of Japanese Forestry Society 51: 125-133.
Haxeltine, A. & I. C. Prentice. 1996. BIOME3: An equi-librium terrestrial biosphere model based on eco-physiological constraints, resource availability, and competition among plant functional types. Global Biogeochemical Cycle 10: 693-709.
Helevy, J. 1976. Growth rate and nutrient uptake of two cotton cultivars brown under irrigation. Agronomy Journal 68: 701-715.
Helsel, Z. R. & W. F. Wedin. 1981. Harvested dry matter from single and double-cropping systems. Agronomy Journal 73: 895-900.
Heslehurst, M. R. & G. L. Wilson. 1974. Studies on the productivity of tropical pasture plants. IV. Separa-tion of photosynthetic and respiratory components of net assimilation rate by growth analysis and gas exchange techniques under natural lighting. Austra-lian Journal of Agricultural Research 25: 415-424.
Hobbie, J. E., B. L. Kwiatkowski, E. B. Rastetter, D. A. Walker & R. B. McCane. 1998. Carbon cycling in the Kuparuk basin: Plant production, carbon storage, and sensitivity to future changes. Journal of Geo-physical Research 103: 29,065-29,073.
Hughes, R. L., J. B. Kauffman & V. J. Jaramillo. 1999. Biomass, carbon, and nutrient dynamics of secon-dary forests in humid tropical region of Mexico. Ecology 80: 1892-1907.
Hunt, Jr., E. R., S. C. Piper, R. Nemani, C. D. Keeling, R. D. Otto & S. W. Running. 1996. Global net carbon exchange and intra-annual atmospheric CO2 con-centrations predicted by an ecosystem process model and three-dimensional atmospheric transport model. Global Biogeochemical Cycle 10: 431-456.
Irving, D. E. & J. H. Silsbury. 1987. A comparison of the rate of maintenance respiration in some crop leg-umes and tobacco determined by three methods. Annals of Botany 59: 257-264.
Ishibashi, M., & I. Terashima. 1995. Effects of continu-ous leaf wetness on photosynthesis: adverse aspects of rainfall. Plant, Cell and Environment 18: 431-438.
Ishida, A., T. Toma & Marjenah. 2000. Leaf gas ex-change and canopy structure in wet and drought years in Macaranga conifera, a tropical pioneer tree. pp.129-142. In: E. Guhardja, M. Fatawi, M. Sutisna, T. Mori, & S. Ohta (eds.) Rainforest Ecosystems of East Kalimatan. Springer, New York.
Jackson, J. & A. J. Ash. 1998. Tree-grass relationships in open eucalypt woodlands of northeastern Austra-lia: Influence of trees on pasture productivity, forage quality and species distribution. Agroforestry Sys-tems 40: 159-176.
Jackson, R. B., J. Canadell, J. R. Ehleringer, H. A. Mooney, O. E. Sala & E. –D. Schulze. 1996. A global analysis of root distributions for terrestrial biomes. Oecologia 108: 389-411.
Jackson, R. B., H. A. Mooney & E. –D. Schulze. 1997. A global budget for fine root biomass, surface area, and nutrient content. Proceedings of the National Academy of Sciences USA 94: 7362-7366.
Johnson, D. R. & D. J. Major. 1979. Harvest index of soybeans as affected by planting date and maturity rating. Agronomy Journal 71: 538-541.
Jokela, W. E. & G. W. Randall. 1989. Corn yield and residual soil nitrate as affected by time and rate of nitrogen application. Agronomy Journal 81: 720-726.
Jones, M. B., E. L. Leafe, W. Stiles & B. Collett. 1978. Pattern of respiration of a perennial ryegrass crop in the field. Annals of Botany 42: 693-703.
Juan, N. A., C. C. Sheaffer, D. K. Barnes, D. R. Swanson & J. H. Halgerson. 1993. Leaf and stem traits and herbage quality of multifoliolate alfalfa. Agronomy Journal 85: 1121-1127.
Kajimoto, T., Y. Matsuura, M. A. Sofronov, A. V. Volo-kitina, S. Mori, A. Osawa & A. P. Abaimov. 1999. Above- and belowground biomass and net primary productivity of a Larix gmelinii stand near Tura, central Siberia. Tree Physiology 19: 815-822.
Khanna, P. K. & B. Ulrich. 1991. Ecochemistry of tem-perate deciduous forests. pp.121-163. In: E. Rohrig
CHOUDHURY 165
& B. Ulrich (eds.) Temperate Deciduous Forests. El-sevier, New York.
Kira, T. 1975. Primary production of forests. pp. 5-40. In: J. Cooper (ed.) Photosynthesis and Productivity in Different Environments. Cambridge University Press, New York.
Kitajima, K., S. S. Mulkey & S. J. Wright. 1997. Sea-sonal leaf phenology in the canopy of a tropical dry forest: photosynthetic characteristics and associated traits. Oecologia 109: 490-498.
Knight, D. H. 1973. Leaf area dynamics of a shortgrass prairie in Colorado. Ecology 54: 891-895.
Korner, C. 1994. Leaf diffusive conductances in the ma-jor vegetation types of the globe. pp. 463-490. In: E. –D. Schulze & M. M. Caldwell (eds.) Ecophysiology of Photosynthesis. Springer-Verlag, New York.
Lafitte, H. R. & R. S. Loomis. 1988a. Calculation of growth yield, growth respiration and heat content of grain sorghum from elemental and proximal analy-ses. Annals of Botany 62: 353-361.
Lafitte, H. R. & R. S. Loomis. 1988b. Growth and com-position of grain sorghum with limited nitrogen. Agronomy Journal 80: 492-498.
Larcher, W. 1995. Physiological Plant Ecology. Springer, New York.
Lavigne, M. B. & M. G. Ryan. 1997. Growth and main-tenance respiration rates of aspen, black spruce and jack pine stems at northern and southern BOREAS sites. Tree Physiology 17: 543-551.
Law, B. E., M. G. Ryan & P. M. Anthoni. 1999. Seasonal and annual respiration of a ponderosa pine ecosys-tem. Global Change Biology 5: 169-182.
Law, B. E., M. Williams, P. M. Anthoni, D. D. Baldocchi & M. H. Unsworth. 2000. Measuring and modelling seasonal variation of carbon dioxide and water va-pour exchange of a Pinus ponderosa forest subject to soil water deficit. Global Change Biology 6: 613-630.
Lehto, T. & J. Grace. 1994. Carbon balance of tropical tree seedlings: a comparison of two species. New Phytologist 127: 455-463.
Lieth, H. & E. Box. 1977. The gross primary productivity pattern of the land vegetation: A first attempt. Tropical Ecology 18: 109-115.
Lloyd, J. 1999. The CO2 dependence of photosynthesis, plant growth responses to elevated CO2 concentra-tions and their interaction with soil nutrient status, II. Temperate and boreal forest productivity and the combined effects of increasing CO2 concentrations and increased nitrogen deposition at a global scale. Functional Ecology 13: 439-459.
Lloyd, J., J. Grace, A. C. Miranda, P. Meir, S. C. Wong, H. S. Miranda, I. R. Wright, J. H. C. Gash & J. McIntyre. 1995. A simple calibrated model of Ama-zon rainforest productivity based on leaf biochemi-
cal properties. Plant, Cell and Environment 18: 1129-1145.
Loomis, R. S. & H. R. Lafitte. 1987. The carbon economy of a maize crop exposed to elevated CO2 concentra-tions and water stress, as determined from elemen-tal analyses. Field Crops Research 17: 63-74.
Lory, J. A., M. P. Russelle & G. H. Heichel. 1992. Quan-tification of symbiotically fixed nitrogen in soil sur-rounding alfalfa roots and nodules. Agronomy Jour-nal 84: 1033-1040.
Los, S. O., G. J. Collatz, P. J. Sellers, C. M. Malmstrom, N. H. Pollack, R. S. DeFries, L. Bounoua, M. T. Parris, C. J. Tucker & D. A. Dazlich. 2000. A global 9-yr biophysical land surface dataset from NOAA AVHRR data. Journal of Hydrometeorology 1: 183-199.
Lynch, J., A. Gonzalez, J. M. Tohme & J. A. Garcia. 1992. Variation in characters related to leaf photo-synthesis in wild bean populations. Crop Science 32: 633-640.
Malhi, Y., A. D. Nobre, J. Grace, B. Kruijt, M. G. P. Pereira, A. Culf & S. Scott. 1998. Carbon dioxide transfer over a central Amazonian rain forest. Journal of Geophysical Research 103: 31, 593-31, 612.
Malhi, Y., D. D. Baldocchi & P. G. Jarvis. 1999. The car-bon balance of tropical, temperate and boreal for-ests. Plant, Cell and Environment 22: 715-740.
Matthews, E. 1983. Global vegetation and land use: New high-resolution data bases for climate studies. Journal of Climate and Applied Meteorology 22: 474-487.
Mauney, J. R., B. A. Kimball, P. J. Pinter, Jr., R. L. LaMorte, K. F. Lewin, J. Nagy & G. R. Hen-drey. 1994. Growth and yield of cotton in re-sponse to a free-air carbon dioxide enrichment environment. Agricultural and Forest Meteorol-ogy 70: 49-67.
Mayaki, W. C., I. D. Teare & L. R. Stone. 1976. Top and root growth of irrigated and nonirrigated soybeans. Crop Science 16: 92-94.
Medina, E. 1986. Forests, savannas and montane tropi-cal environment. pp. 139-171. In: N. R. Baker & S. P. Long (eds.) Photosynthesis in Contrasting Envi-ronments. Elsevier, New York.
Medina, E. & E. Cuevas. 1989. Patterns of nutrient ac-cumulation and release in Amazonian forests of the upper Rio Negro basin. pp. 217-240. In: J. Proctor (ed.) Mineral Nutrients in Tropical Forest and Sa-vanna Ecosystems. Blackwell, Boston.
McCree, K. J. 1974. Equations for the rate of dark respi-ration of while clover and grain sorghum, as func-tions of dry weight, photosynthetic rate, and tem-perature. Crop Science 14: 509-514.
166 NITROGEN BASED MODEL FOR AUTOTROPHIC RESPIRATION
McCree, K. J. 1983. Carbon balance as a function of plant size in sorghum plants. Crop Science 23: 1173-1177.
McCree, K. J. 1988. Sensitivity of sorghum grain yield to ontogenic changes in respiration coefficient. Crop Science 28: 114-120.
McGuire, A. D., J. M. Melillo, L. A. Joyce, D. W. Kick-linghter, A. L. Grace, B. Moore, III, & C. J. Voros-marty. 1992. Interactions between carbon and ni-trogen dynamics in estimating net primary produc-tivity for potential vegetation in North America. Global Biogeochemical Cycle 6: 101-124.
McKane, R. B., E. B. Rastetter, G. R. Shaver, K. J. Nadelhoffer, A. E. Giblin, J. L. Laundre & F. S. Chapin, III. 1997. Reconstruction and analysis of historical changes in carbon storage in Arctic tun-dra. Ecology 78: 1188-1198.
Merino, J., C. Field & H. A. Mooney. 1982. Construction and maintenance costs of Mediterranean-climate evergreen and deciduous leaves. I. Growth and CO2 exchange analysis. Oecologia 53: 208-213.
Middleton, E. M. 1992. Quantifying reflectance anisot-ropy of photosynthetically active radiation in grass-lands. Journal of Geophysical Research 97: 18,935-18,946.
Middleton, E. M., J. H. Sullivan, B. D. Bovard, A. J. Deluca, S. S. Chan & T. A. Cannon. 1997. Seasonal variability in foliar characteristics and physiology for boreal forest species at the five Saskatchewan tower sites during the 1994 Boreal Ecosystem-At-mosphere Study. Journal of Geophysical Research 102: 28,831-28,844.
Monteith, J. L. 1977. Climate and the efficiency of crop production in Britain. Philosophical Transactions of the Royal Society of London B. 281: 277-294.
Mooney, H. A. & P. C. Miller. 1985. Chaparral. pp. 213-231. In: B. F. Cabot & H. A. Mooney (eds.) Physio-logical Ecology of North American Plant Communi-ties. Chapman & Hall, New York.
Muller, M. J. 1982. Selected Climatic Data for a Global Set of Standard Stations for Vegetation Science. Dr. W. Junk, Boston.
Myers, R. J. K. 1980. The root system of a grain sor-ghum crop. Field Crops Research 3: 53-64.
Nadelhoffer, K. H. & J. W. Raich. 1992. Fine root pro-duction estimates and belowground carbon alloca-tion in forest ecosystems. Ecology 73: 1139-1147.
Oechel, W. C. & W. Lawrence. 1981. Carbon allocation and utilization. pp. 185-235. In: P. C. Miller (ed.) Resource Use by Chaparral and Matorral. Springer-Verlag, New York.
Olson, T. C. 1971. Yield and water use by different populations of dryland corn, grain sorghum, and forage sorghum in the western corn belt. Agronomy
sorghum in the western corn belt. Agronomy Jour-nal 63: 104-106.
Olson, J.S. & J.A. Watts. 1983. Major World Ecosystems Complexes Ranked by Carbon in Live Vegetation (Map, scale – 1:30 million). Oak Ridge National Laboratory, Oak Ridge, Tennessee.
Paembonan, S. A., A. Hagihara & K. Hozumi. 1991. Long-term measurement of CO2 release from the aboveground parts of a hinoki forest tree in relation to air temperature. Tree Physiology 8: 399-405.
Pandey, C. B. & J. S. Singh. 1992. Rainfall and grazing effects on net primary productivity in a tropical sa-vanna, India. Ecology 73: 2007-2021.
Pearce, R. B., G. Fissel & G. E. Carlson. 1969. Carbon uptake and distribution before and after defoliation of alfalfa. Crop Science 9: 756-759.
Peck, N. H. & G. E. MacDonald. 1984. Snap bean plant responses to nitrogen fertilization. Agronomy Jour-nal 76: 247-253.
Perry, Jr., L. J. & W. A. Compton. 1977. Serial measures of dry matter accumulation and forage quality of leaves, stalks, and ears of three corn hybrids. Agronomy Journal 69: 751-755.
Peterson, R. K. D., S. D. Danielson & L. G. Higley. 1993. Yield responses of alfalfa to simulated alfalfa weevil injury and development of economic injury levels. Agronomy Journal 85: 595-601.
Peterson, T. A., & G. E. Varvel. 1989. Crop yield as af-fected by rotation and nitrogen rate. III. Corn. Agronomy Journal 81: 735-738.
Pettersson, R., A. –C. Hansson, O. Andren & E. Steen. 1986. Above- and below-ground production and ni-trogen uptake in lucerne (Madicago sativa). Swed-ish Journal of Agricultural Research 16: 167-177.
Pettigrew, W. T. 1999. Potassium deficiency increases specific leaf weights and leaf glucose levels in field-grown cotton. Agronomy Journal 91: 962-968.
Plenet, D., & G. Lemaire. 1999. Relationships between dynamics of nitrogen uptake and dry matter accu-mulation in maize crops. Determination of critical N concentration. Plant and Soil 216: 65-82.
Pons, T. L., A. van der Werf & H. Lambers. 1994. Photo-synthetic nitrogen use efficiency of inherently slow- and fast-growing species: Possible explanations of observed differences. pp. 61-77. In: J. Roy & E. Gar-nier (eds.) A Whole Plant Perspective on Carbon-Ni-trogen Interactions. SPB Publications, The Hague.
Potter, C. S., J. T. Randerson, C. F. Field, P. A. Matson, P. M. Vitousek, H. A. Mooney & S. A. Klooster. 1993. Terrestrial ecosystem production: A process model based on global satellite and surface data. Global Biogeochemical Cycle 7: 811-841.
CHOUDHURY 167
Power, J. F. & P. T. Koerner. 1994. Cover crop produc-tion for several planting and harvest dates in east-ern Nebraska. Agronomy Journal 86: 1092-1097.
Raich, J. W., E. B. Rastetter, J. M. Melillo, D. W. Kick-linghter, P. A. Steudler, B. J. Peterson, A. L. Grace, B. Moore, III, & C. J. Vorosmarty. 1991. Potential net primary productivity in South America: Application of a global model. Ecological Applications 1: 399-429.
Reich, P. B., M. B. Walters, D. S. Ellsworth, J. M. Vose, J. C. Volin, C. Gresham & W. D. Bowman. 1998. Relationships of leaf dark respiration to leaf nitro-gen, specific leaf area and leaf life-span: A test across biomes and functional groups. Oecologia 114: 471-482.
Reich, P. B., D. S. Ellsworth, M. B. Walters, J. M. Vose, C. Gresham, J. C. Volin & W. D. Bowman. 1999. Generality of leaf trait relationships: A test across six biomes. Ecology 80: 1955-1969.
Ripley, E. A. & R. E. Redmann. 1976. Grassland. pp. 349-398. In: J. L. Monteith (ed.) Vegetation and the Atmosphere. Vol. 2. Academic Press, New York.
Risser, P. G. & W. J. Parton. 1982. Ecosystem analysis of the tallgrass prairie: Nitrogen cycle. Ecology 63: 1342-1351.
Ritchie, J. T. 1981. Water dynamics in the soil-plant-atmosphere system. Plant and Soil 58: 81-96.
Rochette, P., R. L. Desjardins, E. Pattey & R. Lessard. 1995. Crop net carbon dioxide exchange rate and radiation use efficiency in soybean. Agronomy Jour-nal 87: 22-28.
Rominger, R. S., D. Smith & L. A. Peterson. 1976. Yield and chemical composition of alfalfa as influenced by high rates of K top-dressed as KCL and K2SO4. Agronomy Journal 68:573-577.
Ruimy, A., G. Dedieu & B. Saugier. 1996. TURC: A di-agnostic model of continental gross primary produc-tivity and net primary productivity. Global Biogeo-chemical Cycle 10: 269-285.
Rundel, P. W. 1981. The matorral zone of Chile. pp. 175-201. In: F. di Castri, D. W. Goodall & R. L., Specht (eds.) Mediterranean-type Shrublands. Elsevier, New York.
Russelle, M. P., R. D. Hauck, R. D. & R. A. Olson. 1983. Nitrogen accumulation rates in irrigated maize. Agronomy Journal 75: 593-589.
Ryan, M. G. 1991. Effects of climate change on plant respiration. Ecological Applications 1: 157-167.
Ryan, M. G. 1995. Foliar maintenance respiration of subalpine and boreal trees and shrubs in relation to nitrogen content. Plant, Cell and Environment 18: 765-772.
Ryan, M. G., S. T. Gower, R. M. Hubbard, R. H. Waring, H. L. Gholz, W. P. Cropper, Jr. & S. W. Running. 1995. Woody tissue maintenance respiration of four
conifers in contrasting climates. Oecologia 101: 133-140.
Ryan, M. G., R. M. Hubbard, S. Pongracic, R. J. Raison & R. E. McMurtrie. 1996. Foliage, fine-root, woody-tissue and stand respiration in Pinus radiata in re-lation to nitrogen status. Tree Physiology 16: 333-343.
Ryan, M. G., M. B. Lavigne & S. T. Gower. 1997. Annual carbon cost of autotrophic respiration in boreal for-est ecosystems in relation to species and climate. Journal of Geophysical Research 102: 28,871-28,883.
Schapaugh, Jr., W. T. & J. R. Wilcox. 1980. Relation-ships between harvest indices and other plant char-acteristics in soybeans. Crop Science 20: 529-533.
Schmid, A. R., R. D. Goodrich, R. M. Jordan, G. C. Mar-ten & J. C. Meiske. 1976. Relationships among ag-ronomic characteristics of corn and sorghum culti-vars and silage quality. Agronomy Journal 68: 403-406.
Scholes, R. J. & D. O. Hall. 1996. The carbon budget of tropical savannas, woodlands and grasslands. pp. 69-100. In: A. I. Breymeyer, D. O. Hall, J. M. Melillo & G. I. Agren (eds.) Global Change: Effects on Co-niferous Forests and Grasslands. John Wiley, New York.
Schulze, E. –D. 1982. Plant life forms and their carbon, water and nutrient relations. pp. 615-676. In: O. L., Lange, P. S. Nobel, C. B. Osmond & H. Ziegler (eds.) Physiological Plant Ecology. vol. 12B. Springer-Verlag, New York.
Schulze, E. –D., F. M. Kelliher, C. Korner, J. Lloyd & R. Leuning. 1994. Relationships among maximum stomatal conductance, ecosystem surface conduc-tance, carbon assimilation rate, and plant nitrogen nutrition. A global ecology scaling exercise. Annual Reviews of Ecology Systematics 25: 629-660.
Schulze, E. –D., J. Lloyd, F. M. Kelliher, C. Wirth, C. Rebmann, B. Luhker, M. Mund, A. Knohl, I. M. Milyukova, W. Schulze, W. Ziegler, A. B. Varlagin, A. F. Sogachev, R. Valentini, S. Dore, S. Grigoriev, O. Kolle, M. I. Panfyorov, N. Tchebakova, & N. N. Vygodskaya. 1999. Productivity of forests in Eurosi-berian boreal region and their potential to act as a carbon sink – a synthesis. Global Change Biology 5: 703-722.
Shaver, G. R. & F. S. Chapin, III. 1991. Production : biomass relationships and element cycling in con-trasting Arctic vegetation types. Ecological Mono-graphs 61: 1-31.
Sims, P. L. & R. T. Coupland. 1979. Producers. pp. 49-72. In: R. T. Coupland (ed.) Grassland Ecosystems of the World: Analysis of Grasslands and Their Uses. Cambridge Univ. Press, New York.
168 NITROGEN BASED MODEL FOR AUTOTROPHIC RESPIRATION
Sinclair, T. R. & R. C. Muchow. 1999. Radiation use effi-ciency. Advances in Agronomy 65: 215-265.
Singh, J. S. & M. C. Joshi. 1979. Primary production. pp. 197-218. In: R. T. Coupland (ed.) Grassland Ecosys-tems of the World: Analysis of Grasslands and Their Uses. Cambridge Univ. Press, New York.
Singh, K.P. & R.P. Singh. 1981. Seasonal variation in biomass and energy of small roots in tropical dry de-ciduous forest, Varanasi, India. Oikos 37: 88-92.
Singh, L. & J. S. Singh. 1991. Species structure, dry matter dynamics and carbon flux of a dry tropical forest in India. Annals of Botany 68: 263-273.
Sivakumar, M. V. K., H. M. Taylor & R. H. Shaw. 1977. Top and root relations of field-grown soybeans. Agronomy Journal 69: 470-473.
Sivakumar, M. V. K., N. Seetharama, S. Singh & F. R. Bidinger. 1979. Water relations, growth, and dry matter accumulation of sorghum under post-rainy season conditions. Agronomy Journal 71: 843-847.
Sobrado, M. A. 1991. Cost-benefit relationships in de-ciduous and evergreen leaves of tropical dry forest species. Functional Ecology 5: 608-616.
Smith, J. R., R. L. Nelson & B. L. Vasilas. 1988. Varia-tion among soybean breeding lines in relation to yield and seed-fill duration. Agronomy Journal 80: 825-829.
Stockfors, J. & S. Linder. 1998. The effect of nutrition on the seasonal course of needle respiration in Norway spruce stands. Trees 12: 130-138.
Strugnell, R. G. & C. D. Pigott. 1978. Biomass, shoot-production and grazing of two grasslands in the Rwenzori National Park, Uganda. Journal of Ecol-ogy 66: 73-96.
Sulc, R. M. & K. A. Albrecht. 1996. Alfalfa establish-ment with diverse annual ryegrass cultivars. Agronomy Journal 88: 442-447.
Szaniawski, R. K. 1981. Growth and maintenance respi-ration of shoot and roots of Scots pine seedlings. Zeitschrift für Pflanzenphysiologie 101: 391-398.
Szeicz, G., C. H. M. van Bavel & S. Takami. 1973. Stomatal factor in the water use and dry matter production by sorghum. Agricultural Meteorology 12: 361-389.
Toy, T. J., A. J. Kuhaida & B. E. Munson. 1978. The prediction of mean monthly soil temperature from mean monthly air temperature. Soil Science 126: 181-189.
Turner, D. P., S. A. Acker, J. E. Means & S. L. Garman. 2000. Assessing alternative allometric algorithms for estimating leaf area of Douglas-fir trees and stands. Forest Ecology and Management 126: 61-76.
USDA. 1992. Census of Agriculture, U. S. Department of Agriculture, Washington, D.C.
Van Riper, G. E. & F. G. Owen. 1964. Effect of cutting height on alfalfa and two grasses as related to pro-duction, persistence, and available soil moisture. Agronomy Journal 56: 291-295.
Vogt, K. A., C. C. Grier, C. E. Meier & R. L. Edmounds.
1982. Mycorrhizel role in net primary production and nutrient cycling in Abies amabilis ecosystems in western Washington. Ecology 63: 370-380.
Voorhees, W. B., J. F. Johnson, G. W. Randall & W. W. Nelson. 1989. Corn growth and yield as affected by surface and subsoil compaction. Agronomy Journal 81: 294-303.
Vygodskaya, N. N., I. Milyukova, A. Varlagin, F. Tatari-nov, A. Sogachev, K. I. Kobak, R. Desyatkin, G. Bauer, D. Y. Hollinger, F. M. Kelliher & E. –D. Sculze. 1997. Leaf conductance and CO2 assimila-tion of Larix gmelinii growing in the eastern Sibe-rian boreal forest. Tree Physiology 17: 607-615.
Waring, R. H. & W. H. Schlesinger. 1985. Forest Ecosys-tems Concepts and Management. Academic Press, New York.
Waring, R. H. & S. W. Running. 1998. Forest Ecosystems Analysis at Multiple Scales. Academic Press, New York.
Warnant, P., L. Francois, D. Strivay & J. –C. Gerard. 1994. CARAIB: A global model of terrestrial biologi-cal productivity. Global Biogeochemical Cycle 8: 255-270.
Watanabe, I. 1976. Transformation factor from CO2 net assimilation to dry matter in crop plants. Japanese Agricultural Journal Quarterly 10: 114-118.
Webber, B. D. 1977. Biomass and nutrient distribution patterns in a young Pseudotsuga menziesii ecosys-tem. Canadian Journal of Forest Research 7: 326-334.
Wernstedt, F. L. 1972. World Climatic Data. Lemont, Pennsylvania.
Whittaker, R. H. & W. A. Niering. 1975. Vegetation of the Santa Catalina mountains, Arizona. V. Biomass, production, and diversity along the elevation gradi-ent. Ecology 56: 771-790.
Yoda, K. 1983. Community respiration in a lowland rain forest in Pasoh, Peninsular Malaysia. Japanese Journal of Ecology 33: 183-197.
Zemenchik, R. A., N. C. Wollenhaupt, K. A. Albrecht & A. H. Bosworth. 1996. Runoff, erosion, and forage production from established alfalfa and smooth bromegrass. Agronomy Journal 88: 461-466.
Zemenchik, R. A., K. A. Albrecht, C. M. Boerboom & J. G. Lauer. 2000. Corn production with kura clover as a living mulch. Agronomy Journal 92: 698-705.
CHOUDHURY 169
Zheng, D., E. R. Hunt, Jr. & S. W. Running. 1993. A daily soil temperature model based on air tempera-ture and precipitation for continental applications. Climate Research 2: 183-191.
Appendix A
This appendix elaborates on the data used to relate total respiring nitrogen content per unit ground area to the projected leaf area index (Lo) of ungrazed temperate grasslands.
By synthesizing available measurements, Jackson et al. (1997) and Gordon & Jackson (2000) have given average (standard deviation, n) living fine roots (less than 2 mm in diameter) biomass as 0.95 (0.078, 21) kg m-2 and its nitrogen concentra-tion as 1.11 (0.002, 54)%, which would give the av-erage nitrogen content of living fine roots per unit ground area (Nr) as 0.753 mol m-2 (= 0.95 x 103 x 1.11 x 10-2/14). They have also given the percent-age of total roots to be living fine roots as 63%.
The above data for nitrogen content of living fine root needs to be supplemented by the nitrogen content of living foliage and stem (Nf and Ns). Sims & Coupland (1979) have tabulated peak green shoot biomass and peak root biomass (live and dead) for grasslands at several locations ac-cording to the year of measurements (two to three years). There are 14 concurrent pairs of such data near five locations (Cottonwood, Matador, Osage, Pantex, and Pawnee). These data give the mean (standard deviation; n=14) peak green shoot bio-mass as 0.176 (0.082) kg m-2, while mean peak root (live and dead) biomass as 1.461 (0.614) kg m-2. Taking 63% of this mean peak root biomass one obtains 0.921 kg m-2, which agrees well with the value for living root biomass given by Jackson et al. (1997) quoted above. Thus, the living fine root biomass data given by Jackson et al. might corre-spond to an average live shoot biomass of 0.176 kg m-2.
Measurements by Risser & Parton (1982) near Osage gave nitrogen concentration of live shoot at the time of peak green shoot biomass as 0.89%. This concentration would give the average nitro-gen content of live foliage and stem per unit ground area (Nf + Ns) as 0.112 mol m-2.
Thus, the average respiring nitrogen content per unit ground area, (Nf + Ns + 2 Nr), appears to be 1.618 mol m-2.
Considering that leaf area index might provide an indicator of the above ground biomass (Singh &
Joshi 1979), we wanted to relate the mean live shoot biomass to Lo. Measurements near Pawnee during 1970 gave peak Lo as 0.55 (Knight 1973), while the peak green shoot dry biomass as 0.091 kg m-2 (Sims & Coupland 1979). Measurements near Matador gave the peak Lo during 1970 and 1971as, respectively, 1.5 and 1.0 (Ripley & Redmann 1976), while the peak green shoot bio-mass was, respectively, 0.187 and 0.163 kg m-2
(Sims & Coupland 1979). Measurements near Manhattan by Middleton (1992) at two sites domi-nated by grass species gave mean (standard devia-tion) Lo as 2.06 (0.44) and 1.43 (0.41), while the corresponding mean green shoot dry biomass were, respectively, 0.282 and 0.245 kg m-2. These data give the mean (standard deviation, n=5) ratio of green shoot biomass and Lo as 0.152 (0.020) kg m-2. Thus, Lo corresponding to the average green shoot biomass of 0.176 kg m-2 has been taken to be 1.16 (=0.176/0.152).
The data presented above suggests that (Nf + Ns + 2 Nr) of 1.618 mol m-2 might correspond to Lo of 1.16. If (Nf + Ns + 2 Nr) is considered to scale with Lo, one can write the following equation: Nf + Ns + 2 Nr = 1.395 Lo (A1) where the numerical coefficient is obtained as the ratio of 1.618 mol m-2 for (Nf + Ns + 2 Nr) and 1.16 for Lo. While there is rather limited data to quan-tify the dynamics of living fine root nitrogen con-tent in relation to that for shoot, the above param-eterization does not assume fine root biomass to be equal to foliage biomass (Ruimy et al. 1996; Hunt et al. 1996).
Appendix B
This appendix elaborates on the data used to determine the maintenance respiration per unit ground area of tropical grasslands at 20oC.
Jackson et al. (1997) and Gordon & Jackson (2000) have given the mean (standard deviation, n=5) living fine root biomass as 0.51 (0.13) kg m-2, and its nitrogen concentration as 1.11 (0.002)%. These data give mean nitrogen content of living fine roots per unit ground area (Nr) as 0.404 mol m-2. They also give the mean (standard deviation, n=5) total root biomass as 0.99 (0.24) kg m-2 (frac-tion of living roots being about 52%).
Strugnell & Pigott (1978) have tabulated tem-poral variations of total (live and dead) root bio-mass for a tropical grassland near Mweye (0.2oS, 29.9oE), which show that the biomass during
170 NITROGEN BASED MODEL FOR AUTOTROPHIC RESPIRATION
January and February to be, respectively, 0.73 and 1.16 kg m-2. These root biomass values encompass the mean total root biomass given above (0.99 kg m-2).The mean (standard deviation) of live shoot biomass during these two months has been given as 0.21 (0.11) and 0.19 (0.08) kg m-2 , which aver-ages to about 0.20 kg m-2. The average nitrogen concentration of live shoot during these two months has been given as, respectively, 1.83% and 1.96%. For a mean nitrogen concentration of 1.90%, one obtains nitrogen content of live shoot per unit ground area (= Nf + Ns) as 0.271 mol m-2. The mean (standard deviation) Lo for these two months has been tabulated as, respectively, 0.96 (0.31) and 1.45 (0.54), suggesting an average Lo of 1.2.
From the data given above, Rm, o (20) is ob-tained as: Rm, o (20) = 0.189 Lo (B1) where the numerical coefficient has been calcu-lated by taking (Nf + Ns + 2 Nr) as 1.079 mol m-2 and Lo as 1.2 in Eq. (6a) (0.21x1.079/1.2=0.189).
Appendix C The data given in Table 3 are elaborated in
this appendix. Unless stated otherwise, average biomass and
nitrogen concentration of living fine roots given by Jackson et al. (1997) and Gordon & Jackson (2000) have been used to determine the nitrogen content of living fine roots per unit ground area for each biome (Nr; mol N m-2) given in Table 3. These data are averages across location and time for specific biomes. The nitrogen content of roots has been supplemented by projected leaf area index (Lo) and foliage nitrogen content per unit ground area (Nf; mol N m-2), as follows.
For a stand of boreal deciduous coniferous for-est (Larix gmelinii), Vygodskaya et al. (1997) have given Lo, specific leaf weight and leaf nitrogen con-centration as, respectively, 1.5, 138 g m-2 and 1.56%. These data give foliage biomass and nitro-gen content as, respectively, 207 g m-2 and 0.231 mol m-2. The fine root biomass has been taken to be 1.5 times the foliage biomass (Kajimoto et al. 1999), and nitrogen concentration has been taken to be 1.11% (Gordon & Jackson 2000). Thus, nitro-gen content of fine roots is obtained as 0.246 mol m-2.
The foliage biomass and Lo values of boreal ev-ergreen coniferous forest have been determined from the paired data for these two canopy charac-
teristics given in Cannell (1982) and Gower et al. (1997). When several such paired values were available from a locality, they have been averaged first so as to minimize possible bias introduced by that specific locality on the overall average. Thus, for example, the data for 17 stands of Picea abies at 62oN, 34oE given in Cannell (1982) have not been counted individuality, but as one average pair of values. The mean (standard deviation; n=6) Lo and foliage biomass were found to be, respectively, 5.2 (3.8) and 0.867 (0.426) kg m-2. The mean (standard deviation) obtained by excluding the highest and the lowest values are, respectively, 4.0 (0.8) and 0.750 (0.134) kg m-2 (n=4). Variability in the stand characteristics decreases considerably when the highest and the lowest values are excluded; the variability for Lo decreases from 73% to 20%, and for foliage biomass from 49% to 18%. These mean Lo and foliage biomass suggest an effective specific leaf weight of 0.188 kg m-2 (=0.750/4.0). The foliage nitrogen concentration of boreal conifer species given in Schulze et al. (1994) and Middleton et al. (1997) give the mean concentration (standard de-viation; n=7) as 0.97 (0.13)%. The data presented by Middleton et al. (1997) give average (n=2) spe-cific leaf weight and foliage nitrogen concentration of Picea glauca as, respectively, 0.193 kg m-2 and 0.95%. Thus, Nf has been calculated from biomass and nitrogen concentration as 0.520 mol m-2 (=0.750 x 103 x 0.97 x 10-2/14).
For a desert shrub community, Chew & Chew (1965) have reported Lo to be in the range 0.9 and 1.3, from which an average value of 1.1 has been taken. They have also reported the specific leaf weight as 0.230 kg m-2, which gives foliage bio-mass as 0.253 kg m-2 (= 1.1 *0.230). For Larrea tridentata, which was the dominant species of this community, Reich et al. (1999) have given the ni-trogen concentration of leaf as 1.94%, and thus Nf is calculated to be 0.351 mol m-2. For a desert community dominated by Larrea divaricata, Whittaker & Niering (1975) have given Lo as 0.6 and foliage chlorophyll content as 0.34 g m-2. By taking molar weight of chlorophyll as 900 g mol-1 and the molar ratio of chlorophyll and nitrogen as 0.004 mol mol-1 (Pons et al. 1994; Ishida et al. 2000), we get Nf as 0.095 mol m-2. The average Lo and Nf for these two desert communities are, re-spectively, 0.9 and 0.223 mol m-2.
For sclerophyllous shrubs, Rundel (1981) has given Lo, foliage biomass and nitrogen concentra-tion of leaves for seven dominant species (five ev-
CHOUDHURY 171
ergreen and two deciduous) growing at Fundo Santa Laura (Chile; 33.1oS, 71.0oW). Mooney & Miller (1985) have given Lo, specific leaf weight, and nitrogen concentration of leaves for seven dominant evergreen shrub species growing at Echo Valley (USA; 32.9oN, 116.7oW). For these two data sets, mean (standard deviation, n=14) Lo is 2.2 (0.9) and Nf is 0.334 (0.147) mol m-2. The mean (standard deviation, n=12) obtained by excluding the highest and lowest values are, 2.1 (0.7) for Lo, and 0.328 (0.124) mol m-2 for Nf.
For temperate evergreen coniferous forests, Harata et al. (1969) have given foliage biomass and Nf for stands of Cryptomeria japonica and Chamaecryparis obusta, and Lo for these stands were determined using specific leaf weight of simi-lar age stands (Cannell 1982). Webber (1977) has given foliage biomass and Nf for a stand of Pseu-dotsuga menziesii and Lo was determined using the specific leaf weight given by Turner et al. (2000). Ando et al. (1977) have given Lo and Nf for stands of Abies firma and Tsuga sieboldii. Alban et al. (1978) have given foliage biomass and Nf for stands of Pinus resinosa, P. banksiana and Picea glauca. For these stands Lo has been determined using specific leaf weight data (Cannell 1982, Reich et al. 1998). Grier et al. (1981) and Vogt et al. (1982) have given Lo and Nf for two stands of Abies amabilis, which have been averaged to form one pair of Lo and Nf. Gower et al. (1994) have given foliage biomass, among other data, for sev-eral stands of pine growing in temperate and other climate. These data for three stands (Pinus palus-tris, P. rigida, and P. strobus) growing in temper-ate climate were supplemented by specific leaf area and nitrogen concentration given by Reich et al. (1998). Foliage biomass and Lo data for three stands (P. sylvestris, Abies lasiocarpa, and Taxodium distichum) growing in temperate cli-mate given by Cannell (1982) were supplemented by nitrogen concentration given by Reich et al. (1998). Pertinent data for P. radiata have been given by Ryan et al. (1996), while Law et al. (2000) have given such data for P. ponderosa. These data for 17 stands give mean (standard deviation, n=17) Lo as 4.9 (2.6) and Nf as 0.815 (0.294) mol m-2. The mean (standard deviation, n=15) obtained by ex-cluding the highest and the lowest values are, 4.7 (1.8) for Lo and 0.831 (0.246) mol m-2 for Nf.
For temperate broad-leaf deciduous forests, Khanna & Ulrich (1991) have given mean (stan-dard deviation, n=19) of Lo, and foliage biomass as,
respectively, 5.2 (0.3) and 0.350 (0.029) kg m-2, while the nitrogen concentration of leaves for dif-ferent species and sites quoted by Khanna & Ul-rich (1991) give the average concentration as 2.23% (n=22). The Nf derived from mean foliage biomass and nitrogen concentration is 0.558 mol m-2.
The Lo and foliage biomass values of tropical broad-leaf deciduous forests have been determined from the paired data given in Cannell (1982). The mean (standard deviation; n=10) of Lo was found to be 3.8 (1.5), and these for foliage biomass as 0.360 (0.139) kg m-2. The mean (standard devia-tion) obtained by excluding the highest and the lowest values was 3.8 (1.2) for Lo and as 0.350 (0.117) kg m-2 for foliage biomass (n=8). These data give an effective specific leaf weight of 0.092 kg m-2. The mean (standard deviation, n=46) foli-age nitrogen concentration given by Schulze et al. (1994) is 2.71 (0.10)%. Observations presented by Sobrado (1991) and Kitajima et al. (1997) give mean (standard deviation; n=16) specific leaf weight and nitrogen concentration as, respectively, 0.075 (0.026) kg m-2 and 2.79 (0.64)%. Thus, nitro-gen concentration of 2.71% has been used for cal-culating the foliage nitrogen content.
The Lo and foliage biomass of tropical ever-green forests within Brazil and Venezuela have been determined from the paired data given in Cannell (1982), Schulze (1982), Medina & Cuevas (1989) and Malhi et al. (1999), and foliage nitrogen concentration in Schulze et al. (1994). The mean (standard deviation; n=7) of Lo was found to be 5.3 (1.3), and these for Nf as 0.740 (0.270) mol m-2. The mean (standard deviation; n=5) obtained by excluding the highest and the lowest values is found to be 5.1 (0.4) for Lo and 0.769 (0.157) mol m-2 for Nf.
Shaver & Chapin (1991) have given Lo and Nf of vascular plants, among other data, for four tun-dra communities; tussock, shrub, wet sedge, and heath. The below-ground biomass of these four communities are given as, respectively, 0.482, 0.962, 0.349, and 0.103 kg m-2. Because of substan-tial differences in Lo and Nf among these commu-nities some thought was given in using data so as to be consistent with the data for living fine root biomass and nitrogen concentration given by Jack-son et al. (1997) and Gordon & Jackson (2000). The root biomass of the shrub community (0.962 kg m-2) is comparable to the value quoted by Jackson et al. (1997) (viz., 0.96 kg m-2) and Jackson et al.
172 NITROGEN BASED MODEL FOR AUTOTROPHIC RESPIRATION
(1996) (viz., 1.2 kg m-2). This would suggest that Lo and Nf of the shrub community would be ap-propriate for associating with the living fine root data given by Jackson et al. However, Shaver & Chapin (1991) have noted that all roots were not extracted in their study. Thus, equally weighted average of Lo and Nf of tussock, shrub and wet sedge communities was considered in determining Lo and foliage nitrogen content. These weighted average values are given in Table 3, together with the calculated φ. For reference, we note that the Lo, Nf and φ for the shrub community are found to be, respectively, 1.4, 0.240 mol N m-2 and 0.211 mol CO2 m-2 d-1, while these for the tussock com-munity are found to be, respectively, 1.1, 0.211 mol m-2 and 0.257 mol m-2 d-1, and for the wet sedge community are found to be, respectively, 0.4, 0.074 mol m-2 and 0.322 mol m-2 d-1.
Appendix D This appendix elaborates on the data and
methods used to determine net carbon accumula-tion (C) for the crop land area.
The study area for crop land includes a major portion of the State of Iowa and smaller portions of the States of Missouri, Nebraska, South Dakota, and Minnesota. Important crops for the State of Iowa, with respect to land area, are Zea mays, Gly-cine max and hays (primarily Madicago sativa and mixture), constituting respectively, about 56%, 36% and 8% of the total area of these crops (over 92,000 km2 USDA 1992).
Considering the reported above ground dry matter production at locations within and around the study area, the mean (standard deviation) pro-duction for Zea mays, Glycine max and Madicago sativa is found to be, respectively, about 13.90 (2.99), 8.95 (0.73) and 8.78 (0.83) t ha-1 yr-1 (Table D1). Determination of above ground production of Glycine max is somewhat difficult because leaves begin to fall from the plants during the later stages of reproductive growth period, and the bio-mass of these leaves is often not quantified or in-cluded in the reported data (Hanway & Weber 1971 a & b; Beaver & Cooper 1982). Although there are many reports providing grain yield, these data have not been used to calculate above ground production because of variability of the harvest index (Johnson & Major 1979; DeLoughery & Crookston 1979; Schapaugh & Wilcox 1980). Pro-duction of root (taken here to be root dry biomass for annual crops), as percent of above ground pro-
duction, is about 9% for Zea mays (Foth 1962), 13% for Glycine max (Mayaki et al. 1976), and 56% for Madicago sativa (Pearce et al. 1969; Pettersson et al. 1986). Thus, the mean (standard deviation) to-tal dry matter production for Zea mays, Glycine max and Madicago sativa is found to be respec-tively, as 15.15 (3.26), 10.11 (0.82) and 13.70 (1.29) t ha-1 yr-1.
By taking the carbon content of dry matter to be 44% for Zea mays (Ajtay et al. 1979; Loomis & Lafitte 1987), 48% for Glycine max (Watanabe 1976), and 45% for Madicago sativa (Ajtay et al. 1979; Dubach & Russelle 1994), the mean (stan-dard deviation) C for Zea mays, Glycine max and Madicago sativa is obtained as, respectively, 56 (12), 40 (3), and 51 (5) mol m-2 yr-1. When these C values are weighted by the fractional area of these crops (56%, 36%, and 8%, respectively) one obtains an area average mean (standard deviation) C as 50 (8) mol m-2 yr-1.
There are other uncertainties in the above value of C because of, (a) not considering several other crops like Avena sativa, Secale cereale, Sor-ghum bicolar, Triticum sp. which are also grown, and land use categories like woodland, land under conservation, and urban areas, and (b) the study area includes parts of several States other than the State of Iowa, where the cropping patterns are different.
According to Ajtay et al. (1979), C for temper-ate woodlands and urban areas are, respectively, 56 and 19 mol m-2 yr-1.
Changes in the cropping pattern can affect the value of C. For example, Zea mays, Glycine max and hays are also the major crops for the State of Missouri, but the fractional areas occupied by these crops are, respectively, 25%, 41% and 34%. For these fractional areas, the weighted mean C would be 48 mol m-2 yr-1. The major crops for the State of Nebraska are Zea, hays, Glycine, Triticum, and Sorghum, which occupy, respectively, 47%, 18%, 14%, 11%, and 10% of the total area for these crops (over 64,000 km2). If the mean values of C for Triti-cum and Sorghum are taken to be, respectively, 38 and 47 mol m-2 yr-1 (unpublished preliminary syn-thesis of production data within and around the area), the area weighted mean C would be 50 mol m-2 yr-1. The major crops for the State of Minnesota are Zea, Glycine, Triticum, and hays, which occupy, respectively, 40%, 31%, 16%, and 13% of the total area for these crops (over 66,000 km2). The area weighted mean C would be 48 mol m-2 yr-1.
CHOUDHURY 173
Table 11. Selected data for above ground dry matter production (DM; t ha-1) of Zea mays, Glycine max and Medicago sativa within and around the study area for crop land. Data given are: location name and coordinate, number of data values (n), mean (standard deviation) and range of DM, and the sources for these data. Summary statistics for DM of each crop based on the mean values at all locations, and those obtained by excluding the highest and the lowest DM values are also given.
Sources: 1 (Hanway & Russell 1969; Helsel & Wedin 1981; Blackmer & Sanchez 1988); 2 (Jokela & Randall 1989); 3 (Voorhees et al. 1989); 4 (Zemenchick et al. 2000); 5 (Perry & Compton 1977); 6 (Olson 1971); 7 (Hattendorf et al. 1988); 8 (Russelle et al. 1983; Peterson & Varvel 1989); 9 (Blackmer & Sanchez 1988); 10 (DeLoughery & Crookston 1979; Schmid et al. 1976); 11 (Crookston et al. 1978; DeLoughery & Crookston 1979); 12 (DeLoughery & Crookston 1979; Jakela & Randall 1989; Voorhees et al. 1989); 13 (Hanway & Weber 1971b); 14 (Sivakumar et al. 1977); 15 (Johnson & Major 1979); 16 (Power & Koerner 1994); 17 (Clawson et al. 1986); 18 (Ham & Caldwell 1978); 19 (Beaver & Cooper 1982; Beaver et al. 1985; Smith et al. 1988); 20 (Buxton & Wedin 1970); 21 (Sulc & Albrecht 1996); 22 (Curran et al. 1993); 23 (Lory et al. 1992; Blumenthal & Russelle 1996); 24 (Zemenchik et al. 1996); 25 (van Riper & Owen 1964; Peterson et al. 1993); 26 (Rominger et al. 1976); 27 (Juan et al. 1993).
174 NITROGEN BASED MODEL FOR AUTOTROPHIC RESPIRATION
The above results suggest that the C for the crop land area is about 49 mol m-2 yr-1, with an uncertainty of about 15%.
Appendix E
This appendix elaborates on the estimate of net production of tropical deciduous forests (Table 11).
Cannell (1982) has given above ground dry matter production for a stand near Varanasi (25.3oN, 83.0oE) as 14.87 t ha-1 yr-1, and litterfall dry matter as 6.78 t ha-1 yr-1.
By synthesizing the available data, Nadelhof-fer & Raich (1992) have suggested that annual fine root production (FRP; g (carbon) m-2 yr-1) can be estimated from litterfall (LFC; g (carbon) m-2 yr-1) using the following empirical equation: FRP = (130 + 1.92 LFC)/3 (D1)
Additionally, for synthesizing the available data, they converted all organic matter fluxes to carbon units by taking 48% as conversion factor.
Thus, for LFC of 325.4 (=6.78 x 100 x 0.48) g (carbon) m-2 yr-1, Eq. (D1) gives FRP = 251.6 g (carbon) m-2 yr-1 or 21 mol m-2 yr-1. Adding this root production to the above ground production gives net carbon accumulation as 80 mol m-2 yr-1.
For another forest near Varanasi (24.9oN, 83.2oE), Cannell (1982) has given above and below ground net dry matter production as, respectively, 9.50 and 3.54 t ha-1 yr-1, which gives the total net production as 13.04 t ha-1 yr-1. This net production corresponds to C of 52 mol m-2 yr-1, when carbon content of dry matter is taken to be 48%.
Brown & Lugo (1982) have given net dry mat-ter production for a stand of sub-tropical dry forest near Ensenada (18.0oN, 65.9oW) as 11.0 t ha-1 yr-1. This corresponds to C of 44 mol m-2 yr-1, when car-bon content of dry matter is taken to be 48%.
Measurements in the Marihan range of East Mirzapur Forest Division (24.9o-25.2oN, 82.5o-82.8oE) by Singh & Singh (1991) gave net carbon accumulation as 6.7 (+/- 1.0) t ha-1 yr-1 or 56 (+/- 8) mol m-2 yr-1.