Improved Energy Efficiency in Paper Making by Reducing Dryer Steam Consumption Using Advanced Process Control Paul Austin, John Mack & Matt McEwan: Perceptive Engineering Ltd Puya Afshar & Martin Brown: The University of Manchester Jan Maciejowski: Cambridge University Engineering Dept PaperCon 2011 Page 1133
Transcript
Improved Energy Efficiency in Paper Making by Reducing Dryer Steam Consumption
Using Advanced Process Control
Paul Austin, John Mack & Matt McEwan: Perceptive Engineering LtdPuya Afshar & Martin Brown: The University of Manchestery yJan Maciejowski: Cambridge University Engineering Dept
PaperCon 2011 Page 1133
Synopsis
• The energy used in paper making• The need for multivariable process control: Advanced Process Control• Reduction in the energy used in paper making: some dryer steam reduction
results from recent APC implementation projects- Board making: >10% energy reduction to date + consequent production
benefitbenefit- Newsprint: also >10% energy reduction to date
• Towards further reduction of dryer steam use: results from current paper machine investigations of the potential for dryer steam reductionmachine investigations of the potential for dryer steam reduction- by better control of drainage- by optimisation of the dryer hood
• Case study material from several paper machines:• Case study material from several paper machines: - Two ply board machines in England and Australasia- Newsprint machines in England and in North America
• Conclusion
PaperCon 2011 Page 1134
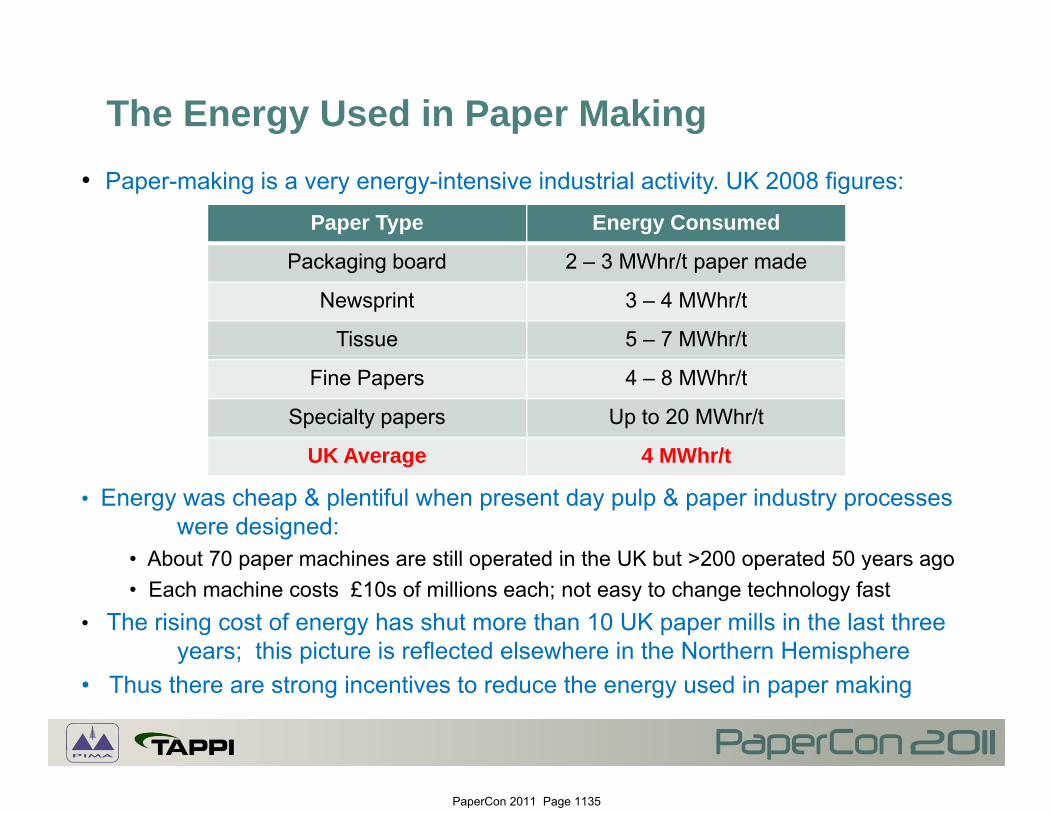
The Energy Used in Paper Making• Paper-making is a very energy-intensive industrial activity. UK 2008 figures:
Paper Type Energy Consumed
Packaging board 2 – 3 MWhr/t paper made
Newsprint 3 – 4 MWhr/t
Tissue 5 – 7 MWhr/t
Fine Papers 4 – 8 MWhr/t
Specialty papers Up to 20 MWhr/t
UK Average 4 MWhr/t
• Energy was cheap & plentiful when present day pulp & paper industry processes were designed:
• About 70 paper machines are still operated in the UK but >200 operated 50 years ago
UK Average 4 MWhr/t
• About 70 paper machines are still operated in the UK but >200 operated 50 years ago• Each machine costs £10s of millions each; not easy to change technology fast
• The rising cost of energy has shut more than 10 UK paper mills in the last three years; this picture is reflected elsewhere in the Northern Hemispherey p p
• Thus there are strong incentives to reduce the energy used in paper making
PaperCon 2011 Page 1135
Energy Use on the Paper Machine
• Paper machines use between 50% and 80% of mill energy (when there are no pulp mills on site)
• Some of this is electrical energy used in drives and in running vacuum pumps and stock pumps (for moving fluids)
• But steam used in drying the sheet is the biggest energy consumer• Water content of the sheet:
- when sheet is just formed, 99.1% is water: vacuums and aerofoils drain it- as it enters the press section the sheet is ~88% water- as it enters the press section the sheet is ~88% water- as it enters the dryer the sheet is ~50% water: steam is used to dry the
sheet to ~8% water content
PaperCon 2011 Page 1136
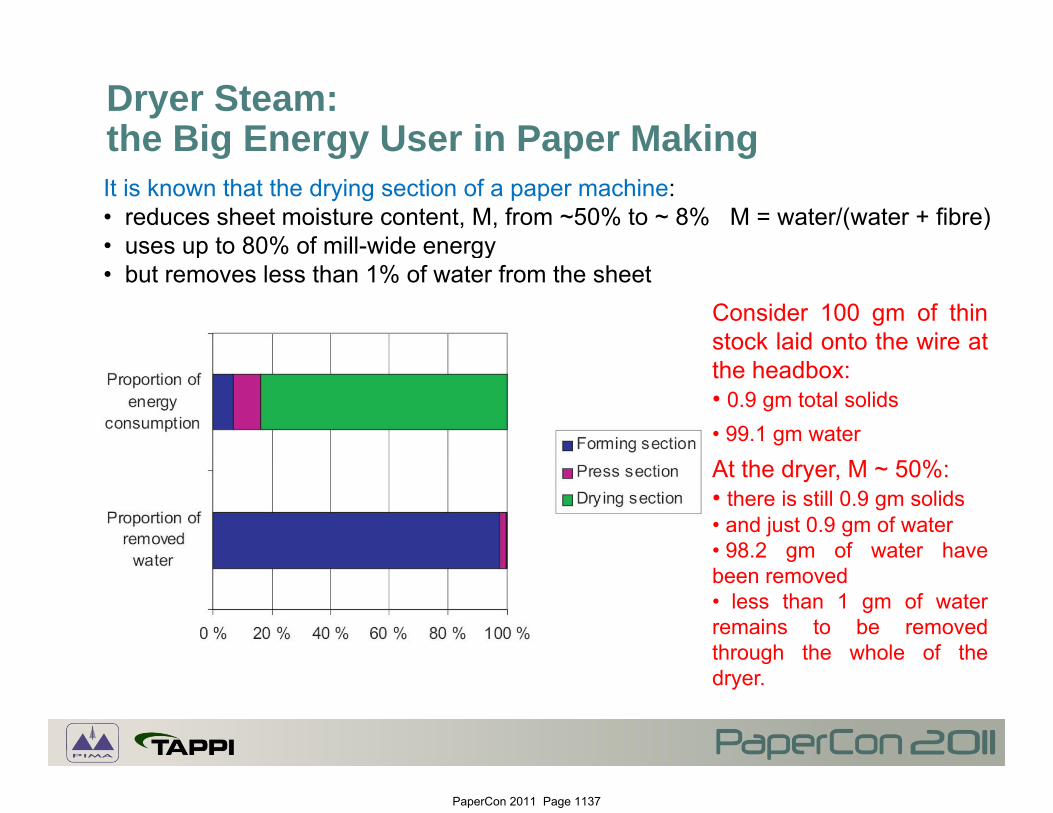
Dryer Steam: the Big Energy User in Paper Makingthe Big Energy User in Paper MakingIt is known that the drying section of a paper machine:• reduces sheet moisture content, M, from ~50% to ~ 8% M = water/(water + fibre)• uses up to 80% of mill-wide energyuses up to 80% of mill wide energy• but removes less than 1% of water from the sheet
Consider 100 gm of thinstock laid onto the wire atthe headbox:• 0.9 gm total solids• 99.1 gm water
At the dryer, M ~ 50%:• there is still 0.9 gm solids• and just 0.9 gm of water• 98.2 gm of water havegbeen removed• less than 1 gm of waterremains to be removedthrough the whole of thegdryer.
PaperCon 2011 Page 1137
Effect on Dryer Steam Use of Decreasing Sheet Moisture Content at Dryer Entryy y
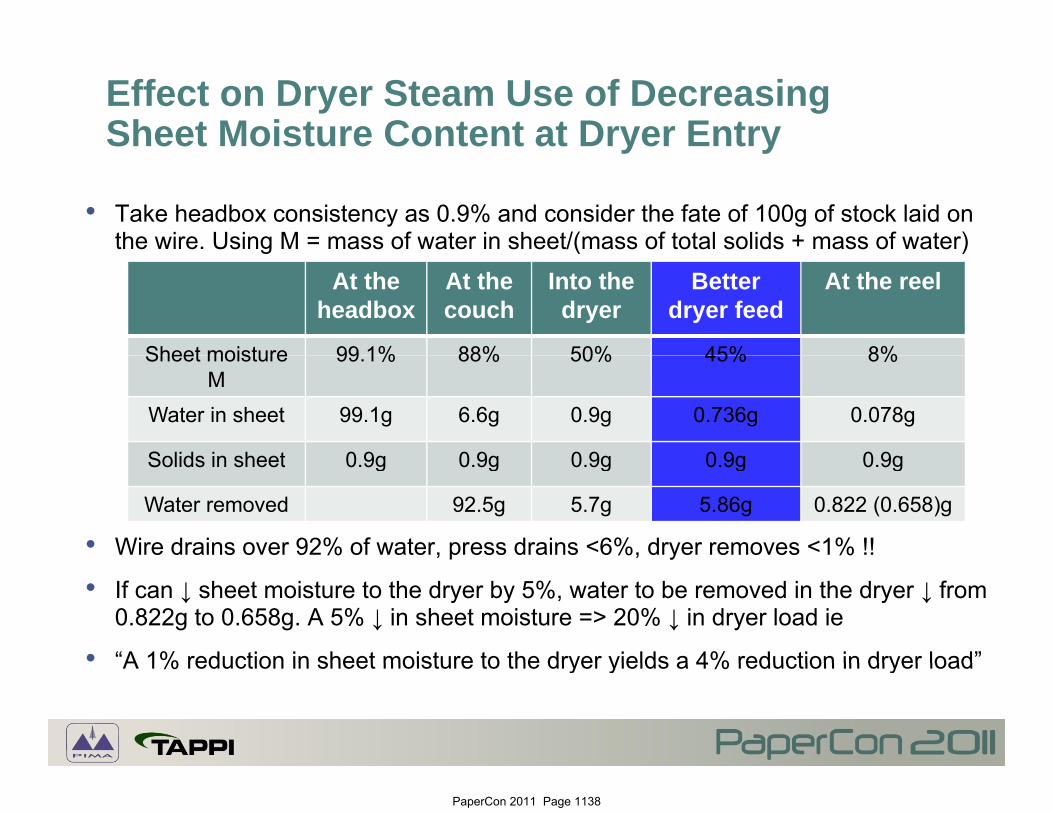
• Take headbox consistency as 0.9% and consider the fate of 100g of stock laid on the wire. Using M = mass of water in sheet/(mass of total solids + mass of water)g ( )
At the headbox
At the couch
Into the dryer
Better dryer feed
At the reel
Sheet moisture 99 1% 88% 50% 45% 8%Sheet moisture M
99.1% 88% 50% 45% 8%
Water in sheet 99.1g 6.6g 0.9g 0.736g 0.078g
Solids in sheet 0 9g 0 9g 0 9g 0 9g 0 9g
• Wire drains over 92% of water, press drains <6%, dryer removes <1% !!
Solids in sheet 0.9g 0.9g 0.9g 0.9g 0.9g
Water removed 92.5g 5.7g 5.86g 0.822 (0.658)g
• If can ↓ sheet moisture to the dryer by 5%, water to be removed in the dryer ↓ from 0.822g to 0.658g. A 5% ↓ in sheet moisture => 20% ↓ in dryer load ie
• “A 1% reduction in sheet moisture to the dryer yields a 4% reduction in dryer load”A 1% reduction in sheet moisture to the dryer yields a 4% reduction in dryer load
PaperCon 2011 Page 1138
Ways to Reduce Dryer Steam Use in Paper MakingUse in Paper Making
Dryer steam use constitutes up to 80% of the energy used in making paper => interest in determining opportunities to reduce dryer steam use:
• Reduce the incidence of over-drying of the sheet- A 1% increase in sheet moisture content ↓ dryer steam demand by 1.34%
• Reduce the incidence of over-weight making of the sheetA 1% d ti i h t i ht d d t d d b 1 034%- A 1% reduction in sheet weight reduces dryer steam demand by 1.034%
• Increase drainage of the sheet before it enters the dryer:- A 1% reduction in sheet moisture entering the dryer delivers a reduction in dryer
steam demand of 4%: a very useful magnification factor!steam demand of 4%: a very useful magnification factor!• Improve dryer efficiency: measuring dryer efficiency in terms of
mass water evaporated/mass of steam usedpaper dryers are typically ~50% efficient. Opportunities to improve this:p p y yp y pp p- Better regulate and optimise the operation of the dryer hood- Use all available variables for control of sheet drying: for each dryer section use
• Diff ti l ll l t• Differential pressures as well as supply steam pressures• Condensate recovery rates – where these are separately manipulable
PaperCon 2011 Page 1139
Advanced Process Control in Paper Making
• Most processes in the pulp & paper industry are strongly multivariable• Control problems in the paper industry require multivariable solutions:
A hi h d t l i bl b it h- A paper machine has many unused control variables because it has never been clear how to use them in a PID control law eg • Formation and drainage are jointly affected by the same input variables,
often >15 of them- Key quality variables are often controlled using a PID loop that adjusts just one
of several variables affecting the quality variable eg• Recycled pulp brightness: controlled by bleach rate alone (expensive),
i i th i fl b i ht liftignoring other influences on brightness uplift• Advanced Process Control (APC) offers optimal multivariable Model-based
Predictive Control (MPC) subject to specified constraints:- profit can often be made by operating close to or at constraintsprofit can often be made by operating close to or at constraints- why control a tank level to a setpoint (as with PID) when what is required is
simply to keep the tank from over-flowing or under-flowing• APC was developed in oil & petrochem – still quite new in the paper industryp p q p p y
PaperCon 2011 Page 1140
Advanced Process Control:Some Important CharacteristicsSome Important Characteristics
• Need first to build a multivariable process model: the model pdescribes how each input affects all the outputs
• There can be a model for each grade range
• C if t i t h i t d h t t• Can specify constraints on each input and on each output
• In pulp & paper, operating priorities can change hour by hour => need real-time optimisation: can run APC with optimisers to determine optimal setpoint targets within the specified constraints
• Every application has given considerable performance i t APC id t h i t l t h limprovement: APC provides a step change in control technology
• We have engineered successful APC applications on most p&p processes: project payback times to date have been between 0 5 and 9 months0.5 and 9 months
PaperCon 2011 Page 1141
Energy Reduction in Paper Making Using APC: Some Recent ResultsUsing APC: Some Recent Results
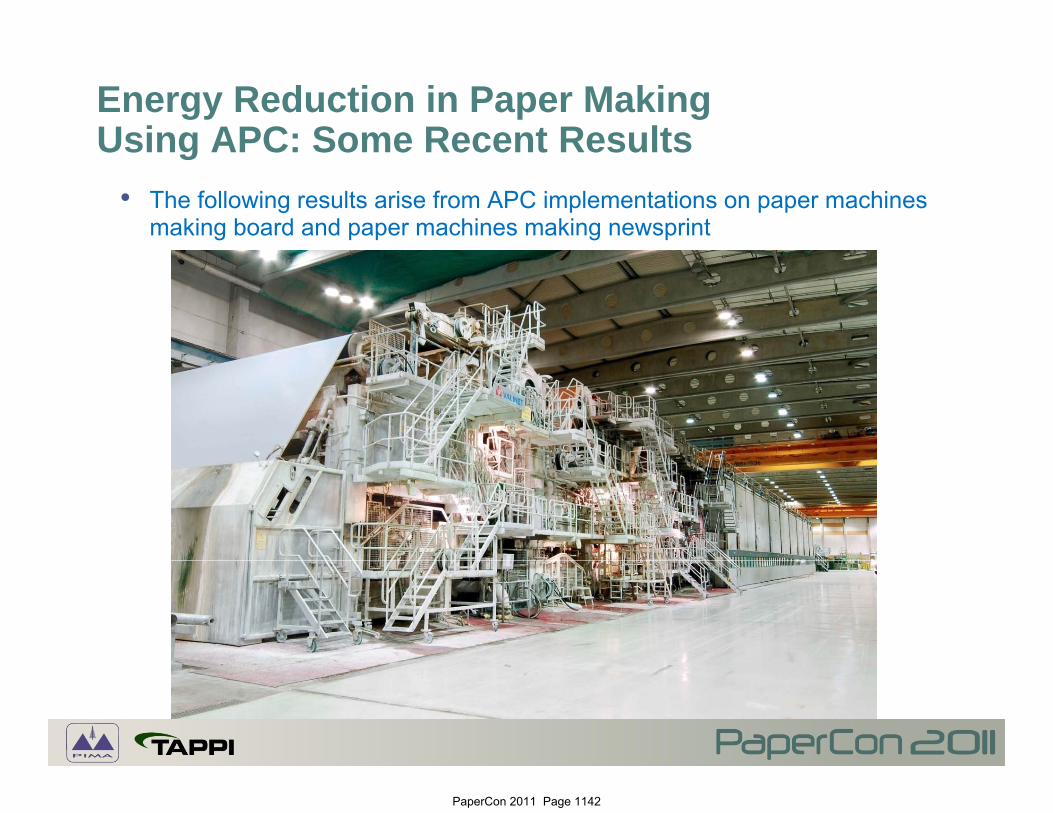
• The following results arise from APC implementations on paper machines making board and paper machines making newsprint
PaperCon 2011 Page 1142
Reduced Energy Consumption in Paper Making:The Role of Wet End Stability Improvementy p• To optimise and better control energy use in paper making, a
necessary first step is often to improve wet end stability Whi i i h f i d• White water consistency, retention, ash content, formation and drainage are all affected by a number of stock approach and machine variables, many having an impact on energy use in paper making:- refiner specific energy targetsrefiner specific energy targets- the flowrates & consistencies of fresh stock, broke and recovered fibre- the dosage rates of wet end chemicals, including retention aids & fillers- headbox parameters such as slice gap and jet to wire ratiop g p j- wire vacuums
• APC Objective: maintain stability of white water consistency, retention, ash content and other quality parameters to provide a platform from
hi h t b bl t ti i d i i d t i i iwhich to be able to optimise drainage in order to minimise energy use• Multivariable model-based control tools are very well suited to this
multi-dimensional control and optimisation problem
PaperCon 2011 Page 1143
Performance Improvement in Paper Making: 1 Multi-Ply Board MachinesMaking: 1. Multi Ply Board Machines
• Design objectives for an APC implementation on an Australasian 2 pl board machine making 100 220 gsm prod cts2-ply board machine making 100 – 220 gsm products:- Improve machine stability- Reduce energy usage- Increase production
• Many board machines are dryer-bottlenecked => reducing steam consumption can have three benefits:- Lowers cost of paper production by reducing specific energy
consumption- Less steam needed/tonne => more tonnes possible: increased
productionproduction- Drier sheet => improved runnability and faster average speeds
PaperCon 2011 Page 1144
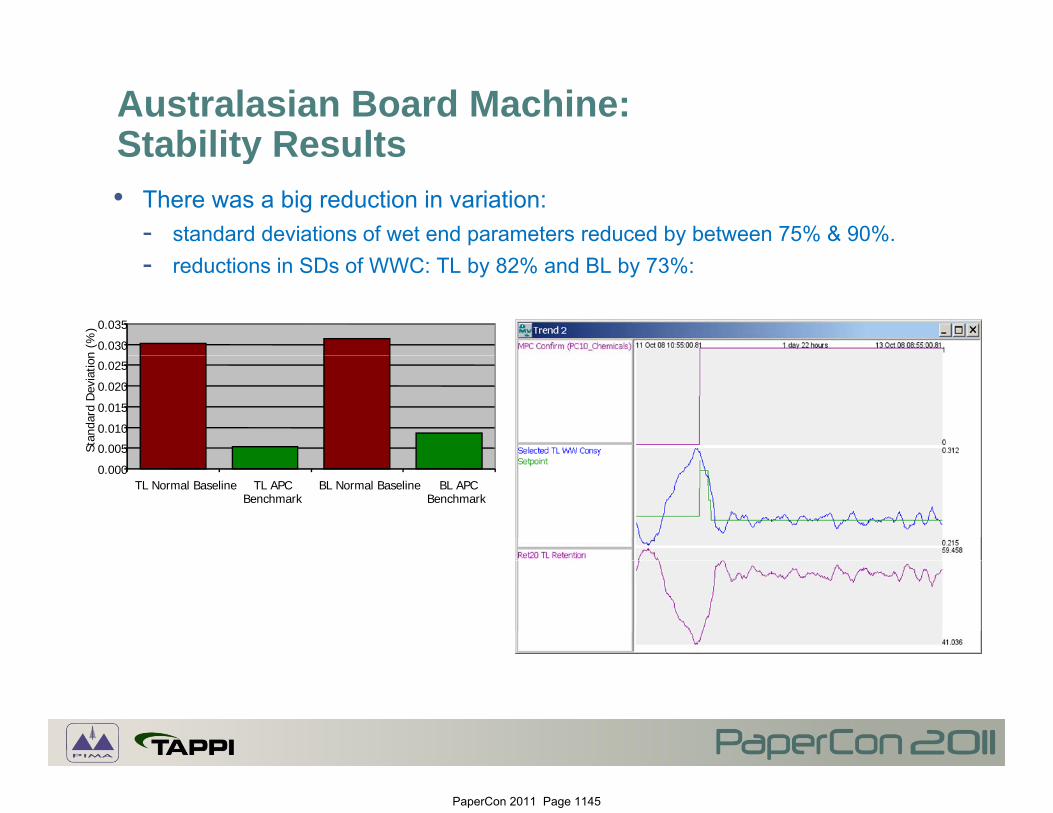
Australasian Board Machine:Stability ResultsStability Results• There was a big reduction in variation:
- standard deviations of wet end parameters reduced by between 75% & 90%. - reductions in SDs of WWC: TL by 82% and BL by 73%:
• How? APC uses flowrate of drainage aid (cheaper) preferentially to retention aid in controlling white water stability => increased drainage flowrates & reduced variation in drainage flowrates at the former:
• Mill now focussing on further improvements in drainage: effect of vacuums & headbox parameters on drainage (current project, reported later)
PaperCon 2011 Page 1146
Australasian Board Machine:Better Quality & Production IncreaseBetter Quality & Production Increase
• Reduced variation in MD weight & moisture: though the controller was g gfocussed on improving wet end stability alone:- The standard deviation of MD Basis Weight was reduced by 19.8%- The standard deviation of MD Moisture was reduced by 14.1%The standard deviation of MD Moisture was reduced by 14.1%
• Production benefits due to: - improvements in runnability- reduction of the dryer bottleneck (by reducing specific steam consumption)- reduction of the dryer bottleneck (by reducing specific steam consumption) gave a production increase in excess of 5.5%
PaperCon 2011 Page 1147
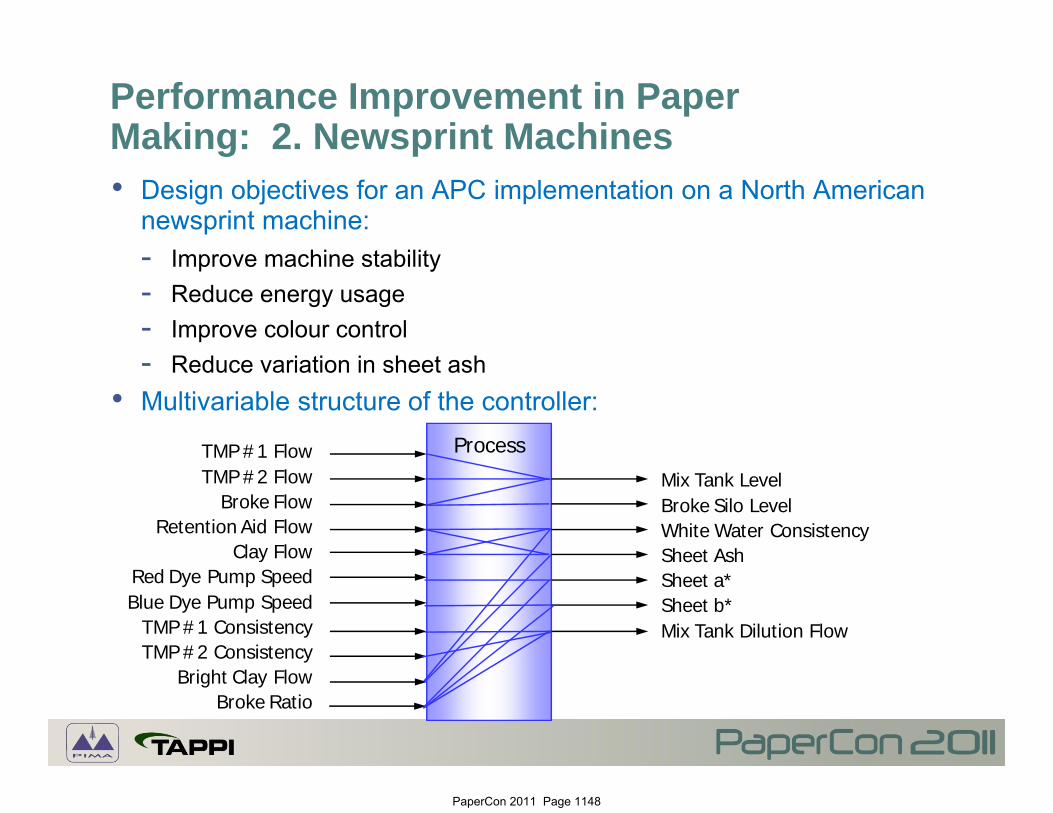
Performance Improvement in Paper Making: 2. Newsprint Machinesg p• Design objectives for an APC implementation on a North American
newsprint machine:I hi t bilit- Improve machine stability
- Reduce energy usage- Improve colour control
R d i i i h h- Reduce variation in sheet ash• Multivariable structure of the controller:
ProcessTMP #1 FlowTMP #2 Flow
Broke FlowRetention Aid Flow
Clay Flow
Mix Tank LevelBroke Silo LevelWhite Water ConsistencySheet Ashy
Red Dye Pump SpeedBlue Dye Pump Speed
TMP #1 ConsistencyTMP #2 Consistency
Sheet AshSheet a*Sheet b*Mix Tank Dilution Flow
Bright Clay FlowBroke Ratio
PaperCon 2011 Page 1148
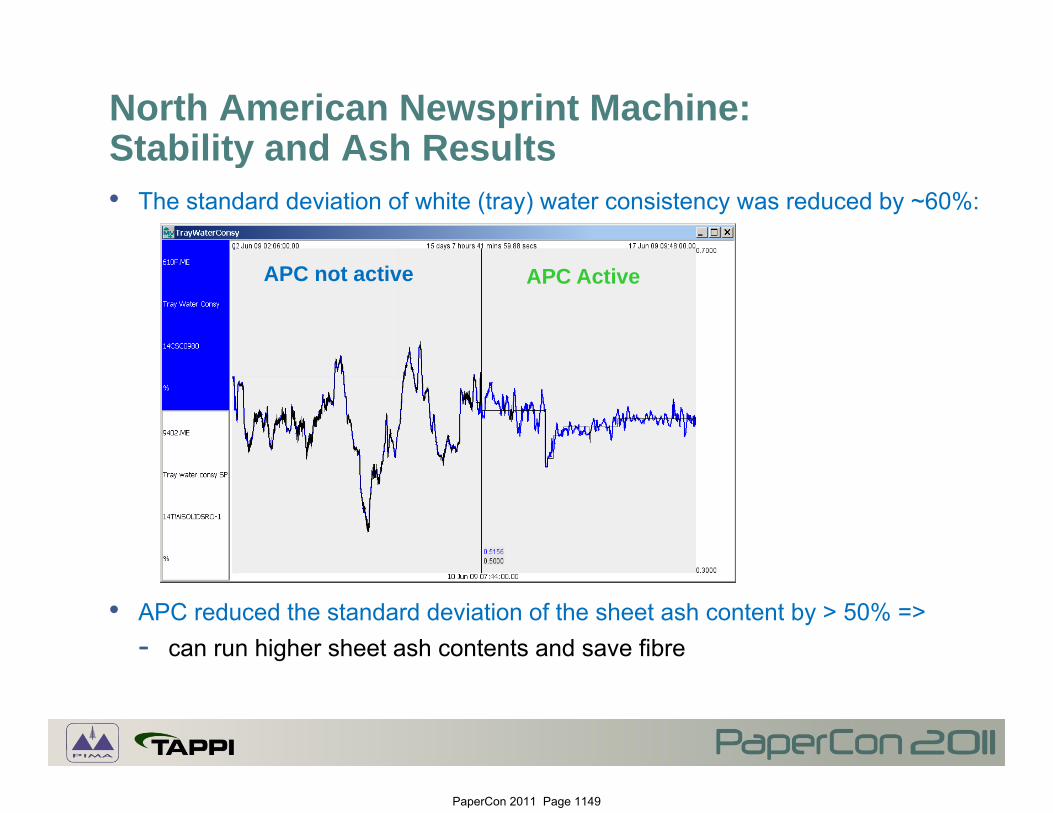
North American Newsprint Machine:Stability and Ash ResultsStability and Ash Results• The standard deviation of white (tray) water consistency was reduced by ~60%:
APC not active APC Active
• APC reduced the standard deviation of the sheet ash content by > 50% => - can run higher sheet ash contents and save fibre
PaperCon 2011 Page 1149
North American Newsprint Machine:Energy Saved >10%Energy Saved >10%
• Recent discussions about extending the controller have focussed on:- better control of drainage to further reduce dryer steam consumption
f
Averages 1.848 1.662 10.1
- better control of the dryer and sheet moisture- control of luminance/brightness by optimising the use of bright clays, in
conjunction with the improved ash control APC has provided
PaperCon 2011 Page 1150
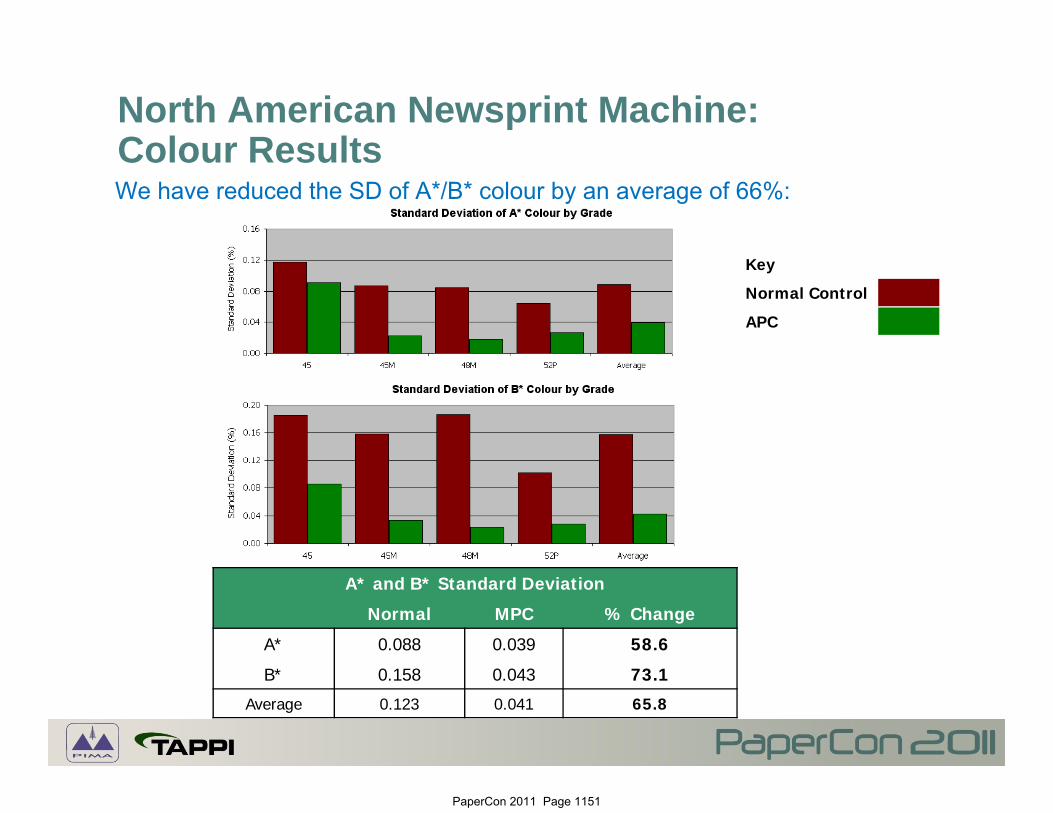
North American Newsprint Machine:Colour ResultsColour ResultsWe have reduced the SD of A*/B* colour by an average of 66%:
Key
Normal Control
APC
A* and B* Standard Deviation
Normal MPC % Change
A* 0.088 0.039 58.6
B* 0.158 0.043 73.1
Average 0.123 0.041 65.8
PaperCon 2011 Page 1151
Towards Further Reduction of Energy Use in Paper Making: Better Control of DrainagePaper Making: Better Control of Drainage• Better control of drainage =>
- Optimise vacuum power and steam saving, maximise solids content of sheet entering dryer => reduce dryer steam use (1% ↓ in moisture => 4%↓ in steam)
- Provide better control of sheet moisture• Many influences on sheet drainage: amount of refining, rate of use of chemical
• All of these variables affect other sheet properties than moisture alone => multivariable control can provide coordinated control of drainage and other quality g yand production variables
• Thus, more intelligent control of drainage can have simultaneous energy reduction and quality improvement objectives resulting in:- Reduced steam usage in the dryer, by draining to lower moisture contents - Steadier sheet MD moisture profiles- Hence steadier draw in the press section
B l f f i (if d li )- Better control of formation (if measured online)
PaperCon 2011 Page 1152
Overview of a Recent Drainage Study on a Two-Ply Board Machineon a Two-Ply Board Machine• Purpose: determine the influence of a comprehensive set of wet-end,
headbox and wire-section variables on drainage and sheet moisture.
• Sensors had been installed to measure sheet solids content online at 3 wet end locations: pre-former, post-former, pre-couch
• Study Objectives:- Identify which wire-section vacuums have an influence on drainage and
what that influence is.- Determine which other wet-end and headbox variables also affect
drainagedrainage. - Apply process response tests to the variables and develop a process
model from this data.- Recommend which of the non-automated vacuums should be automated.- Suggest optimal settings for vacuums at the forming table and the former
to maximise sheet dryness.- Using either regulatory or Advanced Process Control techniques, provide
ti f t l t t f th d th tsuggestions for a process control strategy for these vacuums and the wet end and headbox variables that are found to influence drainage.
PaperCon 2011 Page 1153
Audit MethodologyD ll d b h b d hi ’ APC C lMV Data was collected by the board machine’s APC system, ControlMV.
Process response tests were applied to 35 key wet-end/wire-section variables. Data analysis, correlation, process modelling and simulation was completed
using Perceptive Engineering's offline development package ArchitectMVusing Perceptive Engineering's offline development package, ArchitectMV. Correlation matrix displays were used to determine nature of process
interactions. Later slides show some representative examples of process behaviour Later slides show some representative examples of process behaviour.
The coloured boxes represent the strength of the relationship and the time delay.
GOODBlack – Very Strong No delay
The “cause” is the variable being
Black – Very Strong. No delay.
Dark Blue – Strong with time delay.
BADvariable being tested.
Light Blue – Weak with time delay.
Dark Green – Strong/ incorrect delay.
Light Green – Weak/incorrect delay.
PaperCon 2011 Page 1154
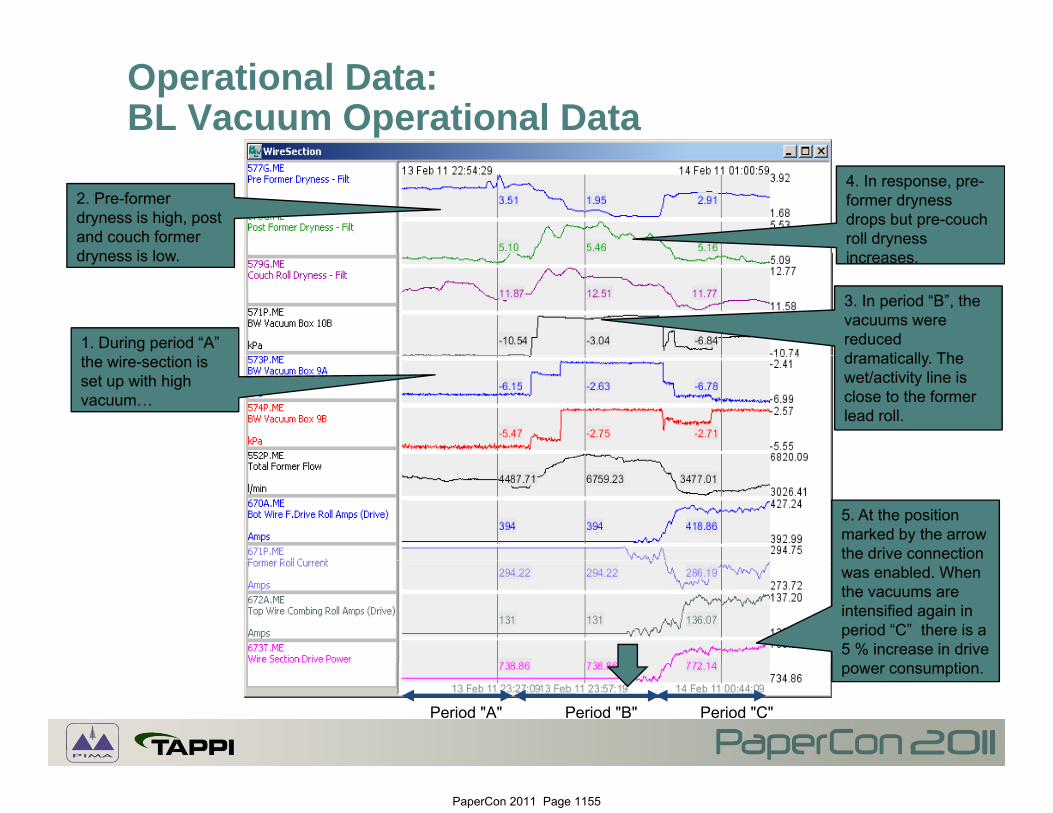
Operational Data:BL Vacuum Operational Data
2. Pre-former dryness is high, post and couch former dr ness is lo
4. In response, pre-former dryness drops but pre-couch roll dryness i
1. During period “A”
dryness is low.
3. In period “B”, the vacuums were reduced dramatically The
increases.
the wire-section is set up with high vacuum…
dramatically. The wet/activity line is close to the former lead roll.
5. At the position marked by the arrow the drive connection was enabled. When the vacuums are intensified again in period “C” there is a 5 % increase in drive
ti
Period "A" Period "B" Period "C"
power consumption.
PaperCon 2011 Page 1155
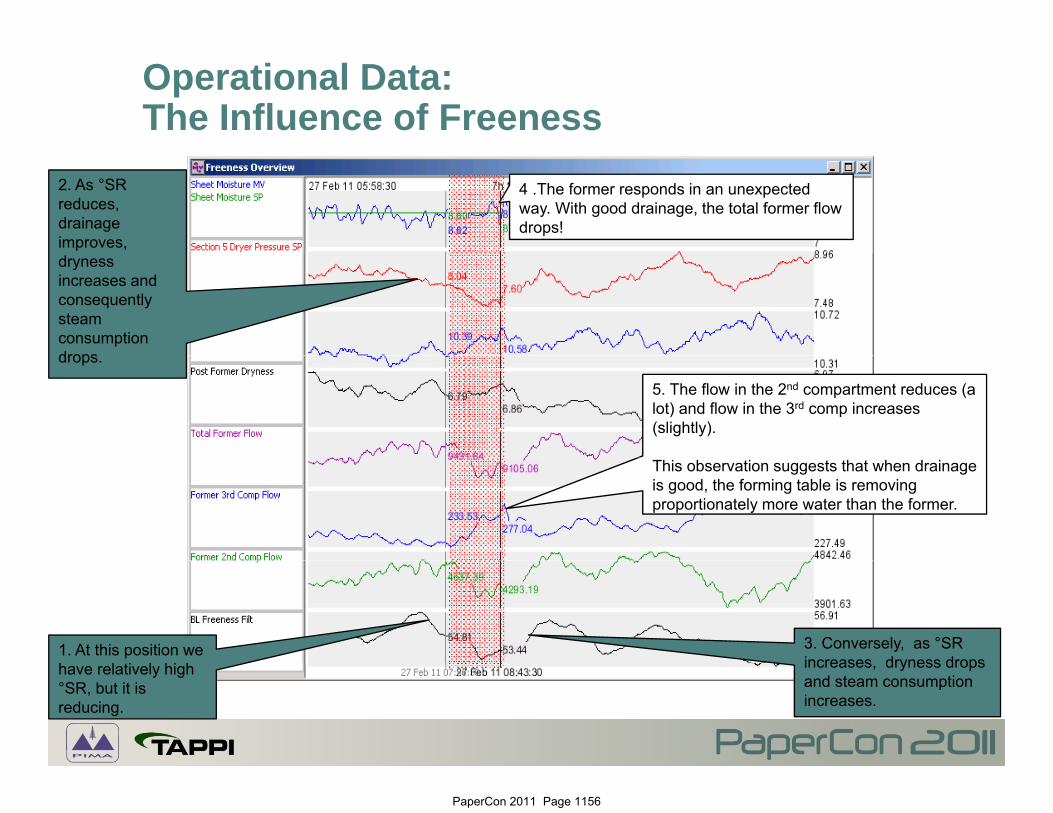
Operational Data:The Influence of Freeness
2. As °SR reduces, drainage improves,
4 .The former responds in an unexpected way. With good drainage, the total former flow drops!
dryness increases and consequently steam consumption dropsdrops.
5. The flow in the 2nd compartment reduces (a lot) and flow in the 3rd comp increases (slightly).
This observation suggests that when drainage is good, the forming table is removing proportionately more water than the former.
1. At this position we h l i l hi h
3. Conversely, as °SR increases dryness dropshave relatively high
°SR, but it is reducing.
increases, dryness drops and steam consumption increases.
PaperCon 2011 Page 1156
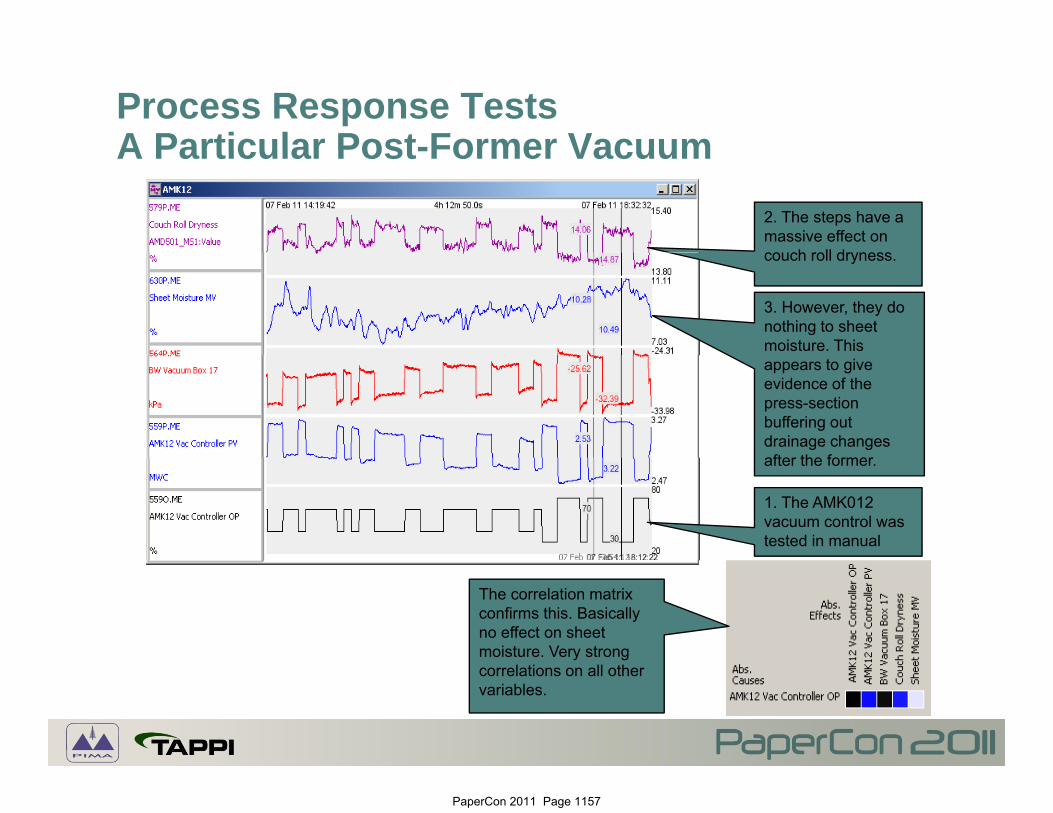
Process Response TestsA Particular Post-Former VacuumA Particular Post-Former Vacuum
2. The steps have a massive effect on couch roll drynesscouch roll dryness.
3. However, they do nothing to sheet moisture. This appears to give evidence of the press-section buffering out drainage changes after the former
1. The AMK012 vacuum control was tested in manual
after the former.
The correlation matrix confirms this. Basically no effect on sheet moisture. Very strong correlations on all other variables.
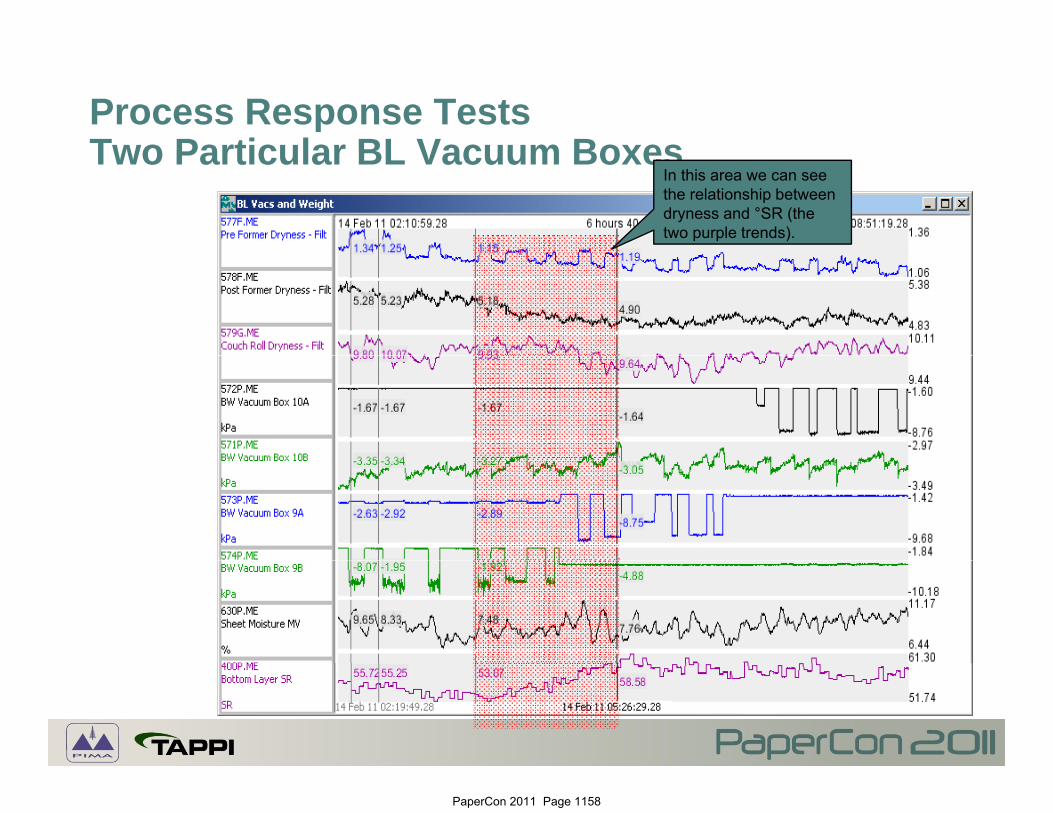
In this area we can see the relationship between dryness and °SR (the two purple trends).
PaperCon 2011 Page 1158
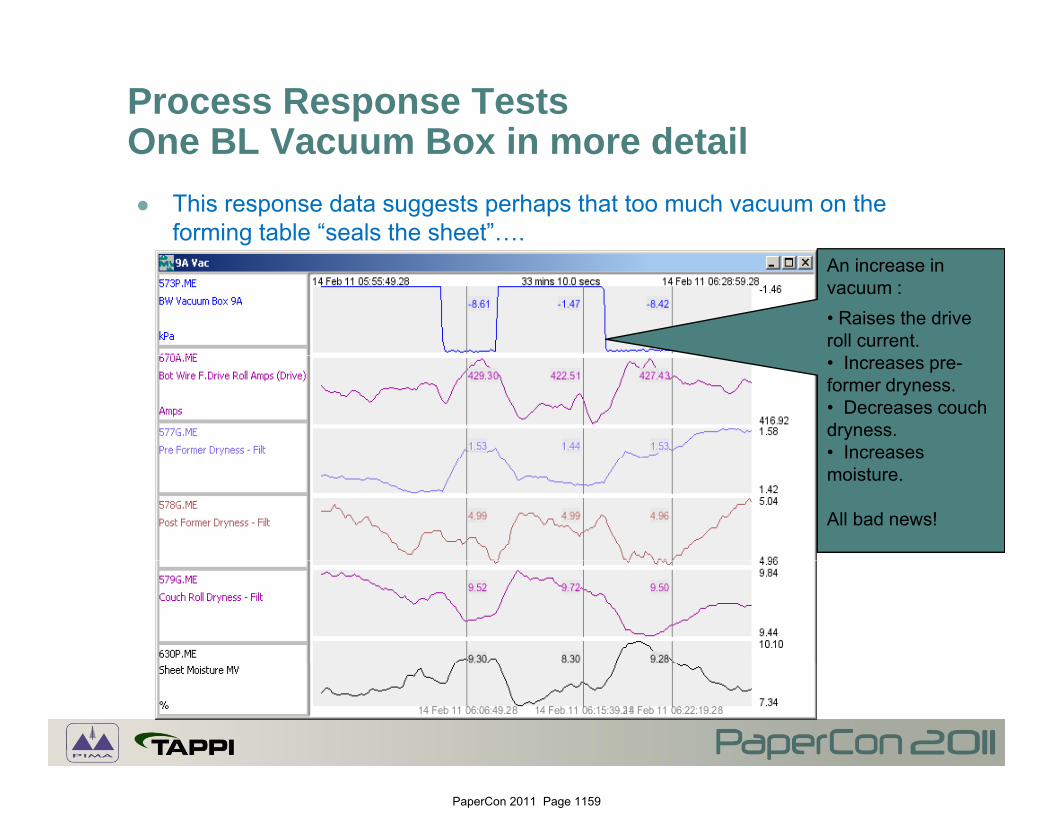
Process Response TestsOne BL Vacuum Box in more detailOne BL Vacuum Box in more detail This response data suggests perhaps that too much vacuum on the
forming table “seals the sheet”….An increase in vacuum :• Raises the drive roll current.• Increases pre-former dryness.• Decreases couch dryness.• IncreasesIncreases moisture.
All bad news!
PaperCon 2011 Page 1159
Process Response TestsA Particular TL BoxA Particular TL Box
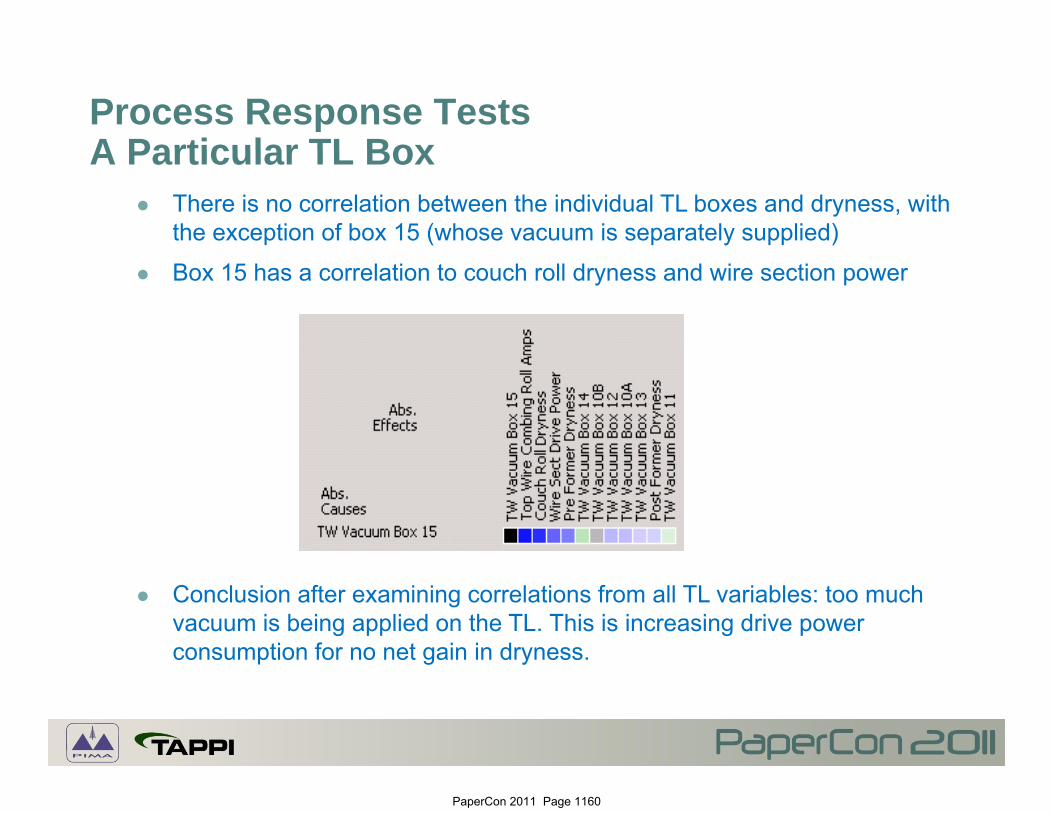
There is no correlation between the individual TL boxes and dryness, with the exception of box 15 (whose vacuum is separately supplied)
Box 15 has a correlation to couch roll dryness and wire section power
Conclusion after examining correlations from all TL variables: too much vacuum is being applied on the TL. This is increasing drive power consumption for no net gain in dryness. p g y
PaperCon 2011 Page 1160
Tests on Headbox Variables
Process response tests were applied to the following TL and BL headbox variables: Rush/Drag Rush/Drag Slice Opening
Both have a significant effect on pre-former dryness, wire section power, sheet moisture weight and former total flowsheet moisture, weight and former total flow.
In general, applying more drag: Increases pre-former dryness. Decreases sheet moisture and basis weight Decreases sheet moisture and basis weight. Decreases total former flow. Doesn’t change the wire section power significantly.
O i th li Opening the slice gap: Decreases pre-former dryness. Decreases sheet moisture and basis weight. Increases total former flow Increases total former flow. Increases wire section power.
PaperCon 2011 Page 1161
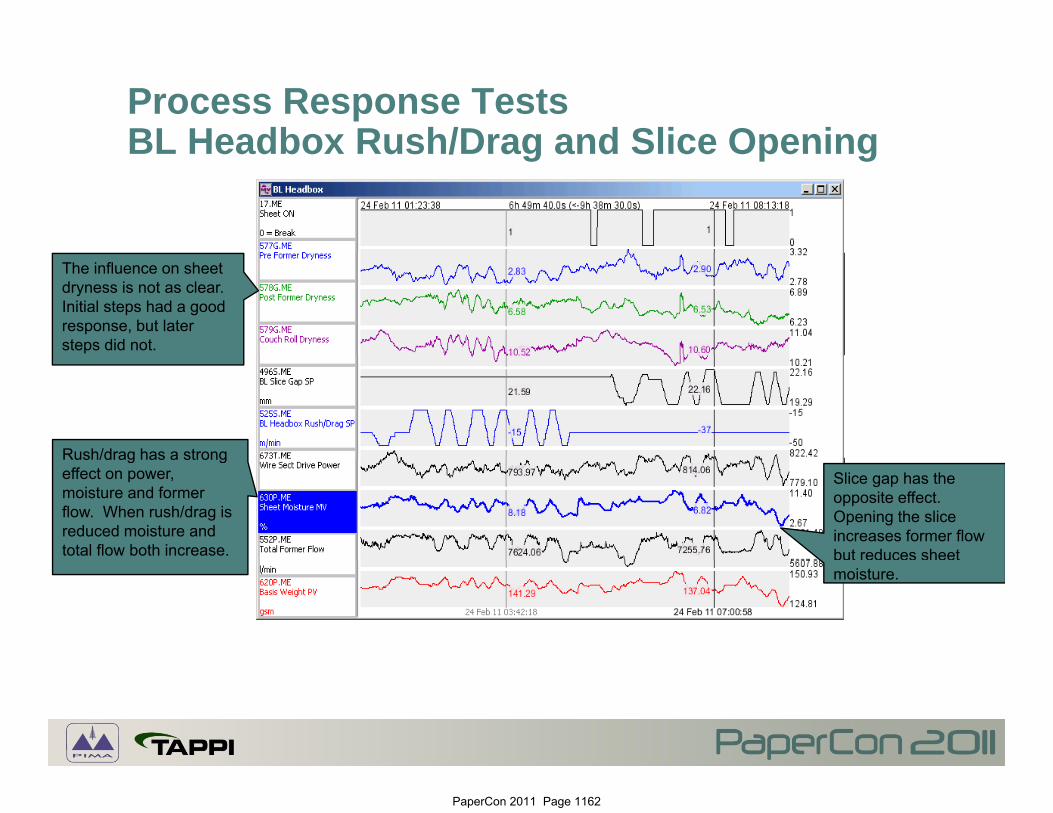
Process Response TestsBL Headbox Rush/Drag and Slice OpeningBL Headbox Rush/Drag and Slice Opening
The influence on sheet dryness is not as clear. Initial steps had a good response, but later steps did not.
Rush/drag has a strongRush/drag has a strong effect on power, moisture and former flow. When rush/drag is reduced moisture and total flow both increase.
Slice gap has the opposite effect. Opening the slice increases former flow but reduces sheet moisture.
PaperCon 2011 Page 1162
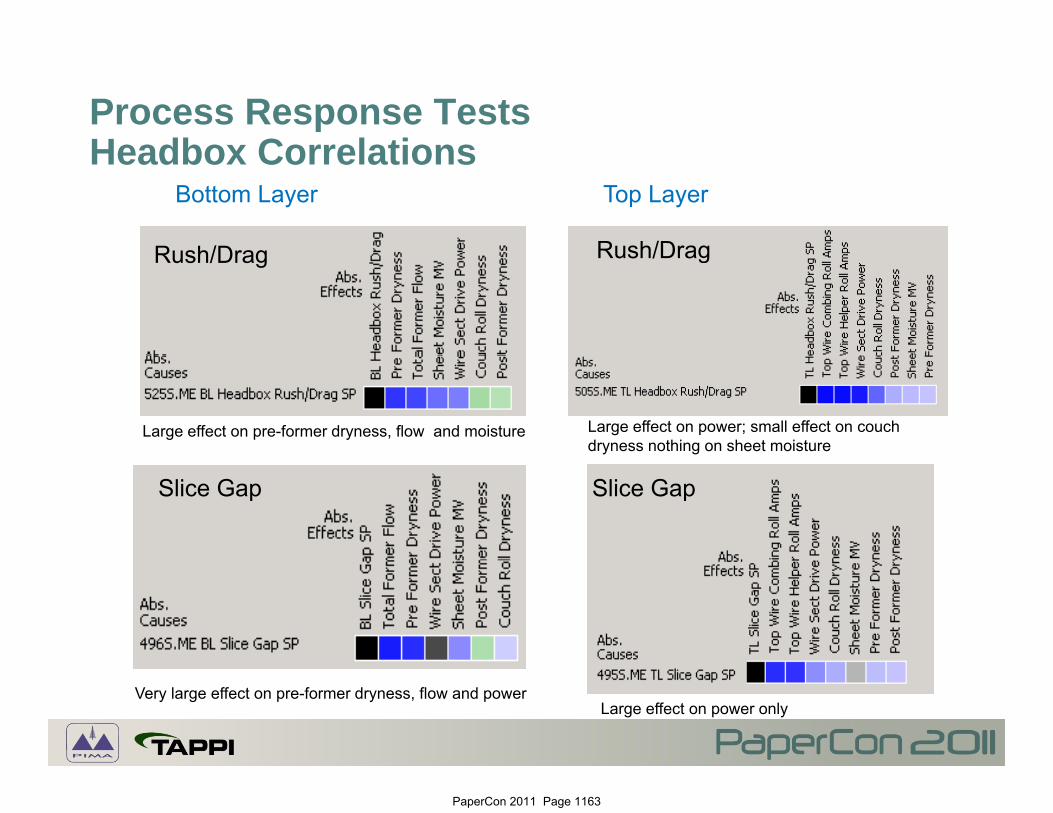
Process Response TestsHeadbox CorrelationsHeadbox Correlations
Bottom Layer Top Layer
Rush/Drag Rush/DragRush/Drag Rush/Drag
Large effect on pre-former dryness, flow and moisture Large effect on power; small effect on couch dryness nothing on sheet moisture
Slice Gap Slice Gap
Very large effect on pre-former dryness, flow and powerLarge effect on power only
PaperCon 2011 Page 1163
Process Modelling
The set of process response tests and selected running data has been used to build a preliminary process model.
Thi d l i li i i th t it d 't t k i t t h This model is preliminary in that it doesn't take into account changes in process gain due to grade and basis weight (further tests would be required).
As inputs the model uses all of the serviceable forming table vacuums As inputs, the model uses all of the serviceable forming table vacuums, headbox parameters, the bottom layer drainage rate transmitter and the measured steam flow to the machine.
It predicts changes in the online sheet dryness wire section power It predicts changes in the online sheet dryness, wire section power load and MD moisture.
The model was then used to:
Determine which vacuums and other variables have the strongest Determine which vacuums and other variables have the strongest influence on moisture.
Quantify the effect of freeness changes on drying.
Build a simulation to evaluate various optimisation strategies.
PaperCon 2011 Page 1164
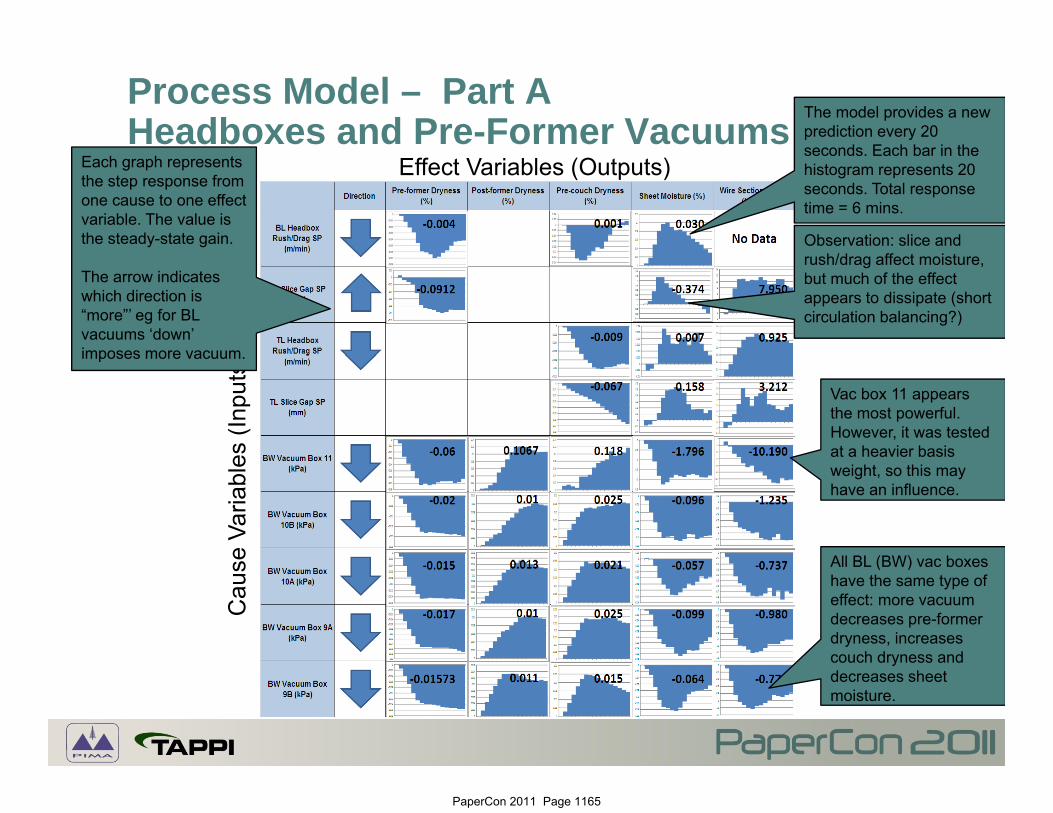
Process Model – Part AHeadboxes and Pre-Former Vacuums
The model provides a new prediction every 20 seconds Each bar in the
Effect Variables (Outputs)Each graph represents the step response from one cause to one effect variable. The value is the steady-state gain.
seconds. Each bar in the histogram represents 20 seconds. Total response time = 6 mins.
Observation: slice and
The arrow indicates which direction is “more”’ eg for BL vacuums ‘down’ imposes more vacuum
rush/drag affect moisture, but much of the effect appears to dissipate (short circulation balancing?)
es (I
nput
s)imposes more vacuum.
Vac box 11 appears the most powerful. However, it was tested at a heavier basis
e Va
riabl
e
All BL (BW) vac boxes
weight, so this may have an influence.
Cau
s All BL (BW) vac boxes have the same type of effect: more vacuum decreases pre-former dryness, increases couch dryness and ydecreases sheet moisture.
PaperCon 2011 Page 1165
Process Model – Part BFormer and TL Vacuums
Effect Variables (Outputs) The secondut
s)The second compartment has a pronounced effect on sheet moisture, but the third compartment has essentially no effect.
bles
(Inp
The TL/TW master valve has a small effect on sheet moisture and a fairly large effect on
use
Varia
Total steam use is
a fairly large effect on power as well.
Cau included for
optimisation purposes.Total Steam Flow
PaperCon 2011 Page 1166
Process Model Example Model Predictionsp
This trend presents the model predictions formodel predictions for the BL Rush/Drag tests.
Red = Prediction.Blue/Green = ProcessBlue/Green Process Variable.
PaperCon 2011 Page 1167
Process Optimisation Scenarios
A process simulator and Model Predictive Controller have been constructed from the model.
The simulator runs ten times faster than real-time. This allows different control and optimisation "scenarios" to be tested and evaluated quickly:
S i 1 El t i l E S i Scenario 1: Electrical Energy Saving
Maintain the same pre-couch dryness and steam consumption.
Save 10% in total electrical energy.
Maintain at least 8200 l/min former flow and control MD moisture to SP.
Scenario 2: Steam Energy Saving.
Allow pre couch dryness to move as required Allow pre-couch dryness to move as required.
Save 10 % in steam energy.
Maintain at least 8200 l/min former flow and control MD moisture to SP.
PaperCon 2011 Page 1168
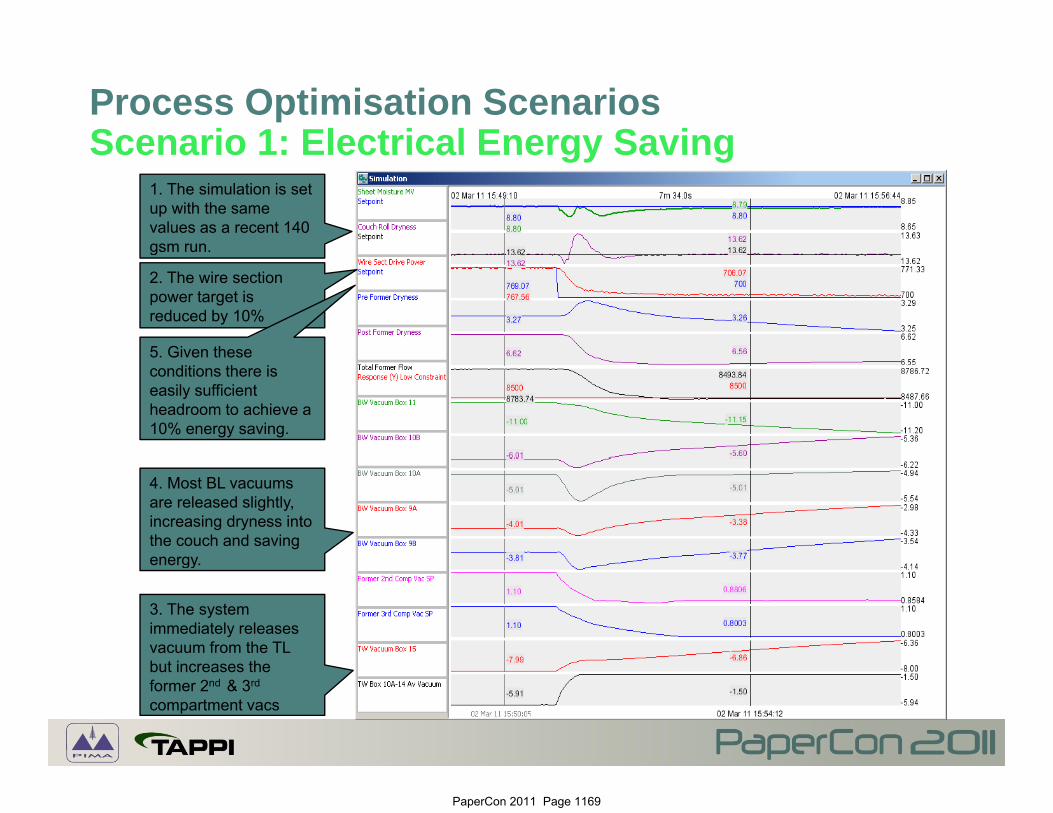
Process Optimisation ScenariosScenario 1: Electrical Energy SavingScenario 1: Electrical Energy Saving
1. The simulation is set up with the same values as a recent 140 gsm run.g
2. The wire section power target is reduced by 10%
5 Given these5. Given these conditions there is easily sufficient headroom to achieve a 10% energy saving.
4. Most BL vacuums are released slightly, increasing dryness into the couch and saving energy
3. The system immediately releases vacuum from the TL b t i th
energy.
but increases the former 2nd & 3rd
compartment vacs
PaperCon 2011 Page 1169
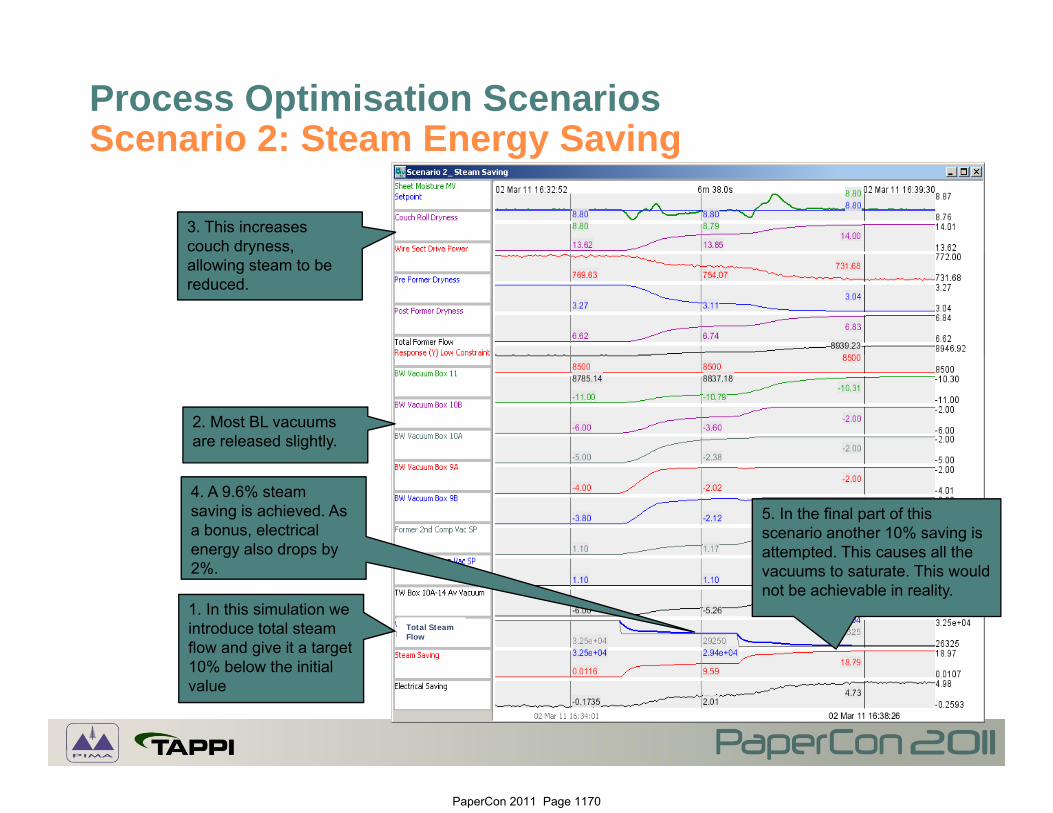
Process Optimisation ScenariosScenario 2: Steam Energy SavingScenario 2: Steam Energy Saving
3. This increases couch dryness, y ,allowing steam to be reduced.
2. Most BL vacuums are released slightly.
4. A 9.6% steam saving is achieved. As a bonus, electrical energy also drops by
5. In the final part of this scenario another 10% saving is attempted. This causes all the
1. In this simulation we introduce total steam flow and give it a target 10% b l th i iti l
2%. vacuums to saturate. This would not be achievable in reality.
Total Steam Flow
10% below the initial value
PaperCon 2011 Page 1170
Recommendations 1: Vacuums and Headbox Parameters that Affect DrainageParameters that Affect Drainage
The study has investigated which wet-end, headbox and wire-section variables have an influence on drainage and sheet moisture: All tested vacuums have an influence on drainage, but not all of them
have a corresponding influence on sheet moisture: Too much vacuum in the Bottom Layer (BL) forming table boxes has a
detrimental effect on drainage Early high vacuum increases pre formerdetrimental effect on drainage. Early high vacuum increases pre-former dryness but reduces pre-couch dryness and increases both sheet moisture and wire-section drive load.
Similarly on the Top Layer (TL) too much vacuum is presently being applied at the expense of electrical energy efficiency.
Vacuums after the former also have an effect on dryness but do not have an effect on sheet moisture. This suggests a buffering effect in the press-sectionsection.
As expected, each headbox's slice gap has a large impact on sheet moisture. This response tends to dampen out as the short-circulation system balances out. The TL rush/drag has a surprisingly strong effect y g p g y gon wire section power and pre-couch dryness.
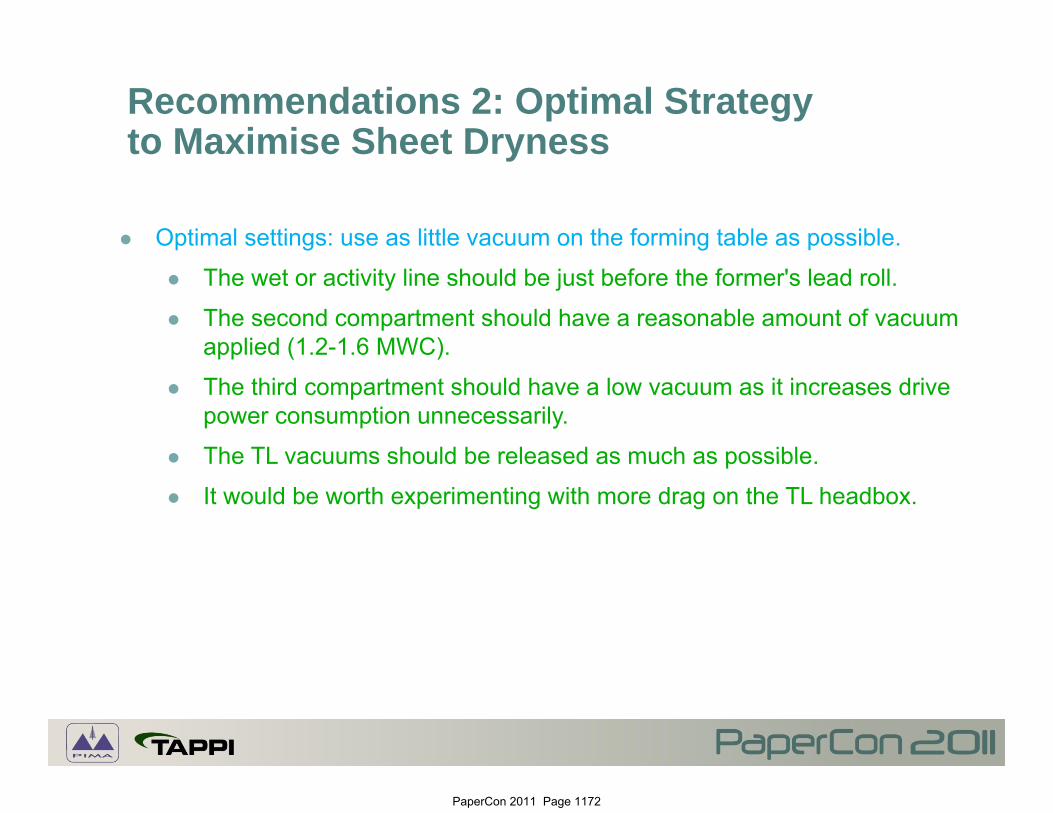
Optimal settings: use as little vacuum on the forming table as possible.
The wet or activity line should be just before the former's lead roll.
The second compartment should have a reasonable amount of vacuum applied (1.2-1.6 MWC). pp ( )
The third compartment should have a low vacuum as it increases drive power consumption unnecessarily.
The TL vacuums should be released as much as possible The TL vacuums should be released as much as possible.
It would be worth experimenting with more drag on the TL headbox.
PaperCon 2011 Page 1172
Towards Further Reduction of Energy Use in Paper Making: Better Control of the Dryer (1)
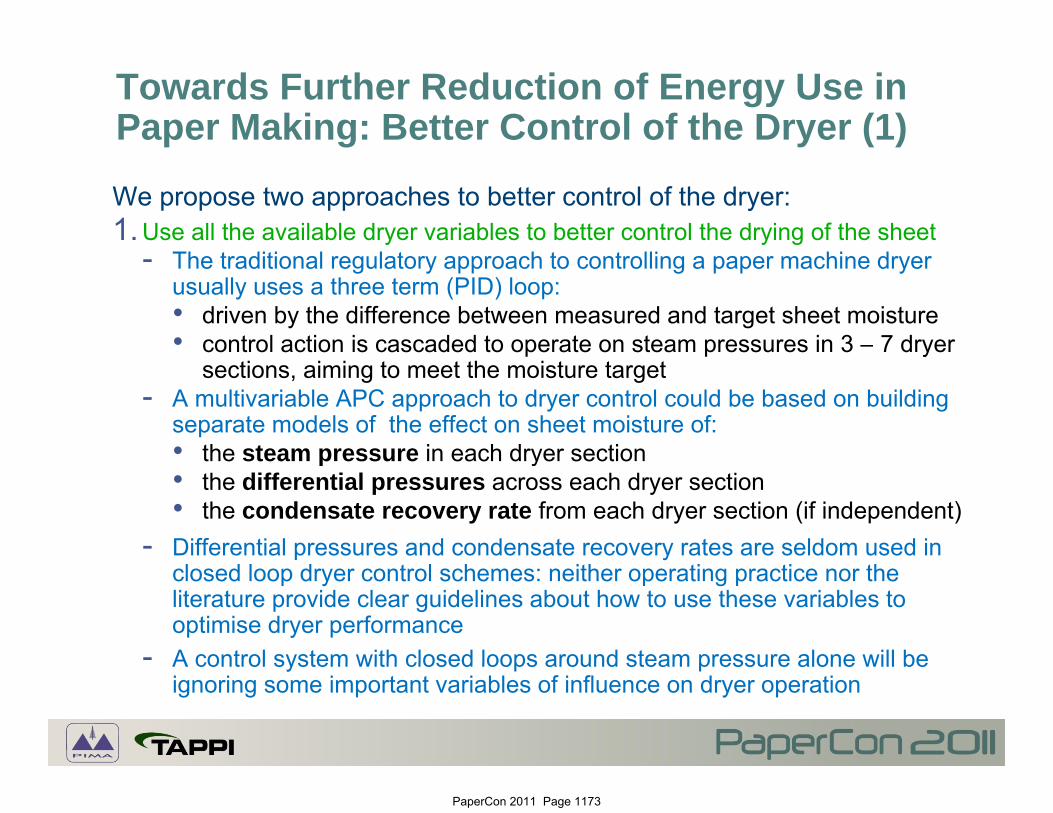
We propose two approaches to better control of the dryer:1.Use all the available dryer variables to better control the drying of the sheet
Th t diti l l t h t t lli hi d- The traditional regulatory approach to controlling a paper machine dryer usually uses a three term (PID) loop:• driven by the difference between measured and target sheet moisture• control action is cascaded to operate on steam pressures in 3 – 7 dryer p p y
sections, aiming to meet the moisture target- A multivariable APC approach to dryer control could be based on building
separate models of the effect on sheet moisture of:• the steam pressure in each dryer sectionthe steam pressure in each dryer section• the differential pressures across each dryer section• the condensate recovery rate from each dryer section (if independent)
- Differential pressures and condensate recovery rates are seldom used in closed loop dryer control schemes: neither operating practice nor the literature provide clear guidelines about how to use these variables to optimise dryer performance
- A control system with closed loops around steam pressure alone will beA control system with closed loops around steam pressure alone will be ignoring some important variables of influence on dryer operation
PaperCon 2011 Page 1173
Towards Further Reduction of Energy Use in Paper Making: Better Control of the Dryer (2)2. Optimise the operation of the dryer hood
- The traditional regulatory approach to control of the hood environment of a paper machine dryer also usually uses three term (PID) loopspaper machine dryer also usually uses three term (PID) loops
- Actually the hood is a multivariable system requiring real time optimisation to minimise energy use
- In a current project, we have found modellable effects on sheet moisture andIn a current project, we have found modellable effects on sheet moisture and dryer steam use of variables such as• Inlet air flowrates, on both the wet side and the dry side• Exhaust air temperature targets• Exhaust air humidity targets
- Some early analysis of these opportunities is reported in the paper
PaperCon 2011 Page 1174
Conclusion
• A significant reduction in the energy consumed in paper making is possible using Advanced Process Control (APC). Methodology:
- Model the machine as a multivariable process
- Use this model to design a multivariable model predictive controller
- Run the controller with powerful real time optimisation functionality- Run the controller with powerful real-time optimisation functionality
• Evidence to date shows there are good prospects of reducing the energy used in paper making by at least 20%:
- 10% reduction from better control of wet end stability
- Up to another 10% reduction by better control of sheet drainage
Th ti f th b fit t t tifi d i i f- There are prospective further benefits, not yet quantified, arising from:
• Better control of the dryer, using all available dryer variables
• Optimisation and better regulation of the dryer hoodp g y