Page 1
Improvement of Overall Equipment Efficiency (OEE) of Ring Frame Section of a
Spinning Mill – A Case Study
Jamal Hossen
MASTER OF ENGINEERING IN ADVANCED ENGINEERING MANAGEMENT
Department of Industrial and Production Engineering
BANGLADESH UNIVERSITY OF ENGINEERING AND TECHNOLOGY
December 2016
Page 2
Improvement of Overall Equipment Efficiency (OEE) of Ring Frame Section of a
Spinning Mill – A Case Study
by
Jamal Hossen
MASTER OF ENGINEERING IN ADVANCED ENGINEERING MANAGEMENT
Department of Industrial and Production Engineering
BANGLADESH UNIVERSITY OF ENGINEERING AND TECHNOLOGY
December 2016
Page 3
ii
CERTIFICATE OF APPROVAL
The thesis titled “Improvement of Overall Equipment Efficiency (OEE) of Ring Frame
Section of a Spinning Mill - A Case Study” submitted by JAMAL HOSSEN, Student No.
0411082117 F, Session April 2011, has been accepted as satisfactory in partial fulfillment
of the requirement for the degree of Master of Engineering in Advanced Engineering
Management on December 21, 2016.
BOARD OF EXAMINERS
1. Dr. Nafis Ahmad Chairman Professor and Head (Supervisor) Department of Industrial and Production Engineering BUET, Dhaka.
2. Dr. Shuva Ghosh (Member) Assistant Professor Department of Industrial and Production Engineering BUET, Dhaka.
3. Dr. Syed Mithun Ali (Member) Assistant Professor Department of Industrial and Production Engineering BUET, Dhaka.
Page 4
iii
DECLARATION
It is hereby declared that this thesis or any part of it has not been submitted elsewhere for
the award of any degree or diploma.
Jamal Hossen
Page 5
iv
Dedicated
To
My Loving Wife
Page 6
v
Acknowledgement
Firstly I would like to express my passionate gratitude to Almighty Allah the most
benevolent and the most merciful who enable me to complete this thesis.
I would like to express sincere respect and indebtedness to my thesis supervisor, Dr. Nafis
Ahmad, Professor, Department of Industrial and Production Engineering (IPE),
Bangladesh University of Engineering and Technology (BUET), for his assistance, ideas,
encouragement, helpful criticism, thoughtful suggestions and judicious guidance
throughout the progress of this thesis work.
It is my pleasure to express the heartiest gratitude to my respected teachers, Professor Dr.
A. K. M. Masud and Dr. Syed Mithun Ali, Assistant Professor, Department of Industrial
and Production Engineering (IPE), BUET, for their support, cooperation and generous help
in this thesis work.
I am very much thankful to Mr. SK Jamil Uddin, Director, Akij Textile Mills Ltd. (ATML)
and Mr. Raiyan Juwel, Assistant Manager, Maintenance (ATML), for their support and
constant effort during field work in industry. I would also like to acknowledge the workers
and staffs in the ring section for their help to complete the thesis work.
Finally, I would like to convey my sincere gratitude to my respective and loving parents
for their blessing and moral support and I am very thankful to my wife whose encourage
and inspiration helps me to complete the thesis successfully.
Page 7
vi
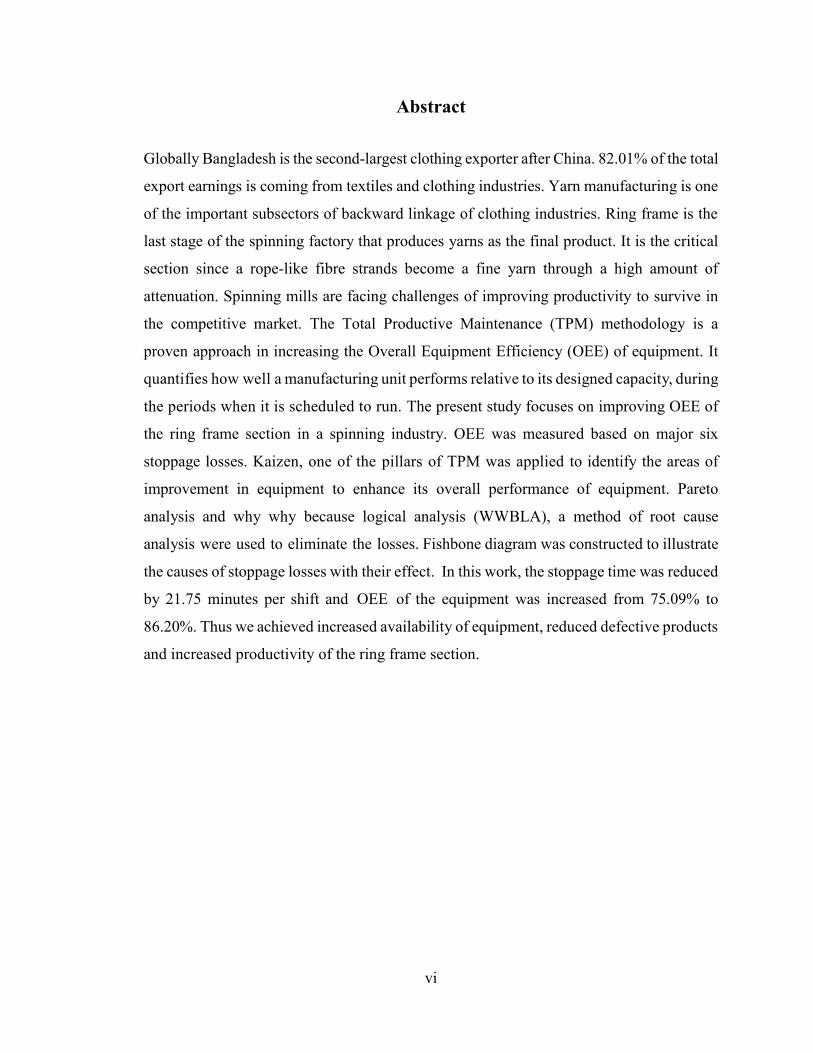
Abstract
Globally Bangladesh is the second-largest clothing exporter after China. 82.01% of the total
export earnings is coming from textiles and clothing industries. Yarn manufacturing is one
of the important subsectors of backward linkage of clothing industries. Ring frame is the
last stage of the spinning factory that produces yarns as the final product. It is the critical
section since a rope-like fibre strands become a fine yarn through a high amount of
attenuation. Spinning mills are facing challenges of improving productivity to survive in
the competitive market. The Total Productive Maintenance (TPM) methodology is a
proven approach in increasing the Overall Equipment Efficiency (OEE) of equipment. It
quantifies how well a manufacturing unit performs relative to its designed capacity, during
the periods when it is scheduled to run. The present study focuses on improving OEE of
the ring frame section in a spinning industry. OEE was measured based on major six
stoppage losses. Kaizen, one of the pillars of TPM was applied to identify the areas of
improvement in equipment to enhance its overall performance of equipment. Pareto
analysis and why why because logical analysis (WWBLA), a method of root cause
analysis were used to eliminate the losses. Fishbone diagram was constructed to illustrate
the causes of stoppage losses with their effect. In this work, the stoppage time was reduced
by 21.75 minutes per shift and OEE of the equipment was increased from 75.09% to
86.20%. Thus we achieved increased availability of equipment, reduced defective products
and increased productivity of the ring frame section.
Page 8
vii
Table of Contents
Acknowledgement ....................................................................................................... v
Abstract ....................................................................................................................... vi
Table of Contents…………………………………………………………………....vii
List of Tables ............................................................................................................. xii
List of Figures ........................................................................................................... xiii
CHAPTER 1: INTRODUCTION………………………………………………………1
1.1 Introduction ............................................................................................................... 1
1.2 Objectives of the Thesis ............................................................................................ 3
1.3 Organization of the Thesis ........................................................................................ 4
CHAPTER 2: LITERATURE REVIEW………………………………………………5
2.1 Total productive maintenance (TPM) ....................................................................... 5
2.1.1 Objectives of TPM.............................................................................................. 6
2.2 Types of maintenance................................................................................................ 6
2.2.1. Breakdown maintenance……………………………………………………….7
2.2.2 Preventive maintenance………………………………………………………...7
2.2.3 Corrective maintenance ...................................................................................... 7
2.2.4 Maintenance prevention ..................................................................................... 8
2.3 History of TPM ......................................................................................................... 8
2.4 Steps in introduction of TPM in an organization ...................................................... 9
2.5 Barriers to implementing TPM in spinning industry ................................................ 9
2.5.1 Unskilled labor ................................................................................................... 9
2.5.2 Inadequate training facilities .............................................................................. 9
2.5.3 Lack of commitment ......................................................................................... 10
2.5.4 Heterogeneous stock of inventory .................................................................... 10
Page 9
viii
2.5.5 Lack of coordination between production and maintenance departments ....... 10
2.6 Pillars of TPM ......................................................................................................... 10
2.6.1 Pillar I - 5S ........................................................................................................ 10
2.6.2 Pillar II - JISHU HOZEN (Autonomous Maintenance) ................................... 11
2.6.3 Pillar III - Kaizen .............................................................................................. 11
2.6.4 Pillar IV - Planned Maintenance ...................................................................... 12
2.6.5 Pillar V - Quality Maintenance ......................................................................... 12
2.6.6 Pillar VI - Training ........................................................................................... 13
2.6.7 Pillar VII - Office TPM .................................................................................... 13
2.6.8 Pillar VIII - Safety, Health and Environment ................................................... 13
2.7 Overall Equipment Efficiency (OEE) ..................................................................... 14
2.7.1 Calculation of OEE ........................................................................................... 15
2.7.1.1 Availability ................................................................................................ 16
2.7.1.2 Performance rate ........................................................................................ 16
2.7.1.3 Quality rate................................................................................................. 18
2.8 Analytical tools to improve the OEE of ring frame ............................................. 19
2.8.1. Pareto analysis ............................................................................................. 19
2.8.2 Why Why Because Logical Analysis (WWBLA) work sheet ...................... 19
2.8.3 Fishbone diagram ......................................................................................... 20
CHAPTER 3: OVERVIEW OF SPINNING PROCESS.........................................…21
3.1 Spinning .................................................................................................................. 21
3.1.1 Process flow chart of carded yarn production .................................................. 22
3.2 A brief introduction of yarn manufacturing process ............................................... 23
3.2.1 Blow Room ....................................................................................................... 23
3.2.2 Carding ............................................................................................................. 23
Page 10
ix
3.2.3 Draw Frame ...................................................................................................... 24
3.2.4 Speed Frame ..................................................................................................... 24
3.2.5 Ring Frame ....................................................................................................... 25
3.2.5.1 Some problems in ring sections ................................................................. 27
3.2.6 Winding ............................................................................................................ 28
3.3 Role of maintenance department in a spinning mill ................................................ 28
CHAPTER 4: TRAINING PROGRAM FOR OPERATORS……………….………31
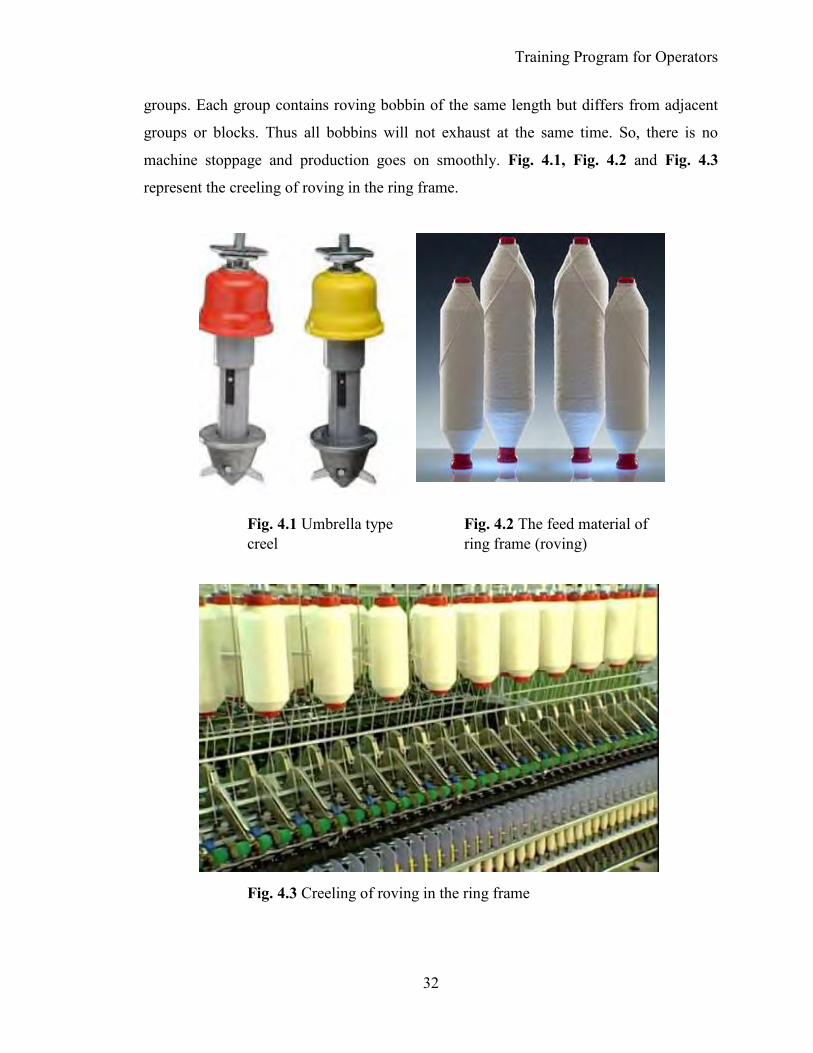
4.1 Introduction ............................................................................................................. 31
4.2 Ring Frame .............................................................................................................. 31
4.2.1 Operations involved in ring frame .................................................................... 31
4.2.2 Important machine parts and their functions .................................................... 35
4.2.3 Improvement of productivity of ring frame ...................................................... 41
4.2.4 Improvement of quality of yarn ........................................................................ 44
4.2.5 Basic maintenance activities that should be done by operators........................ 45
4.2.6 Responsibilities of an operator in the ring frame section ................................. 45
CHAPTER 5: DATA COLLECTION AND ANALYSIS............................................47
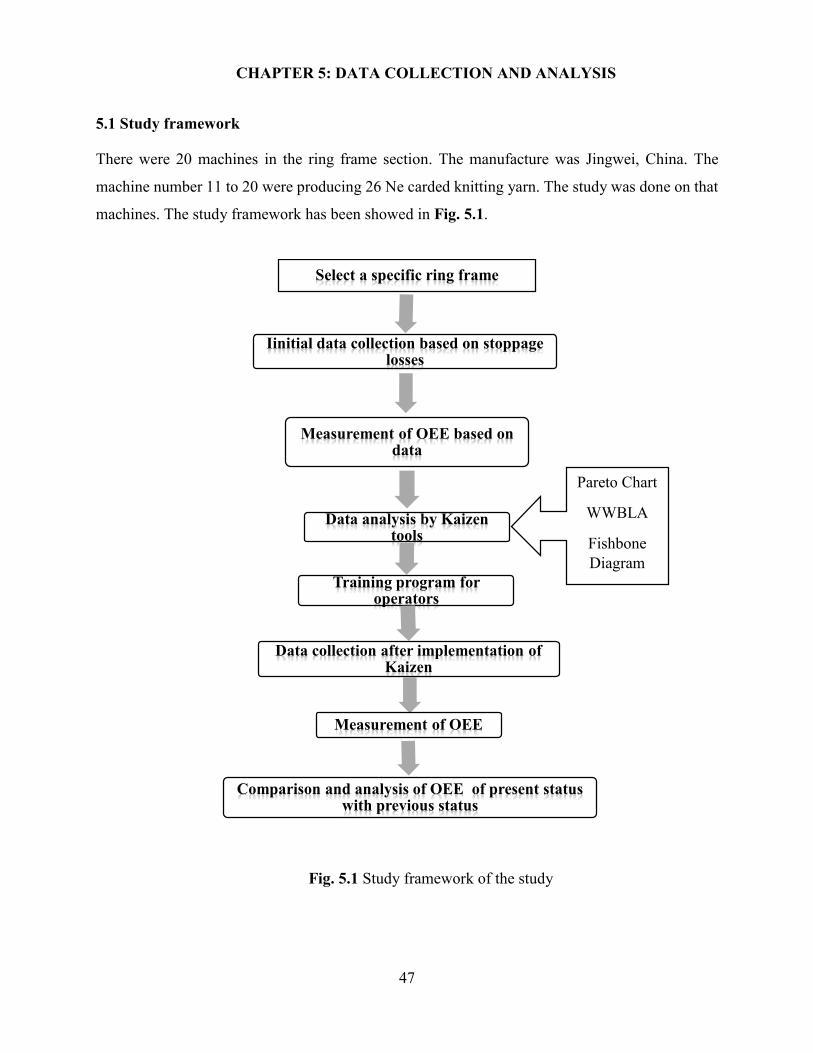
5.1 Study framework ..................................................................................................... 47
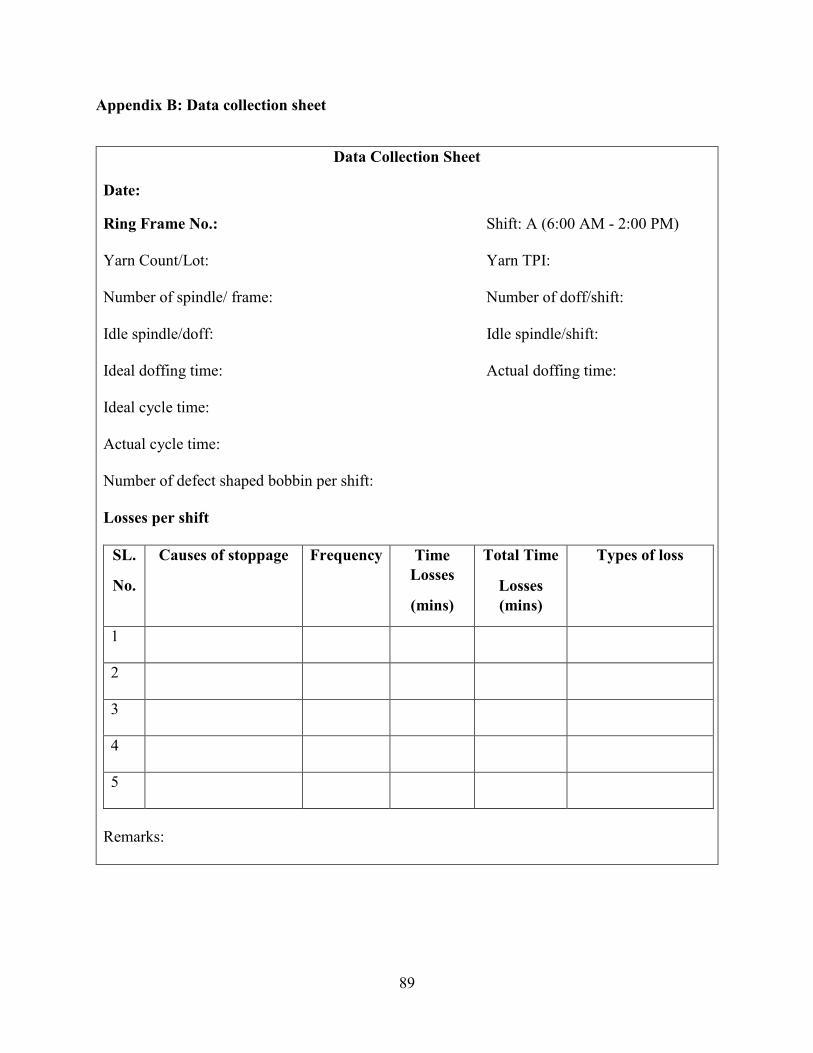
5.2 Data collection ..................................................................................................... 48
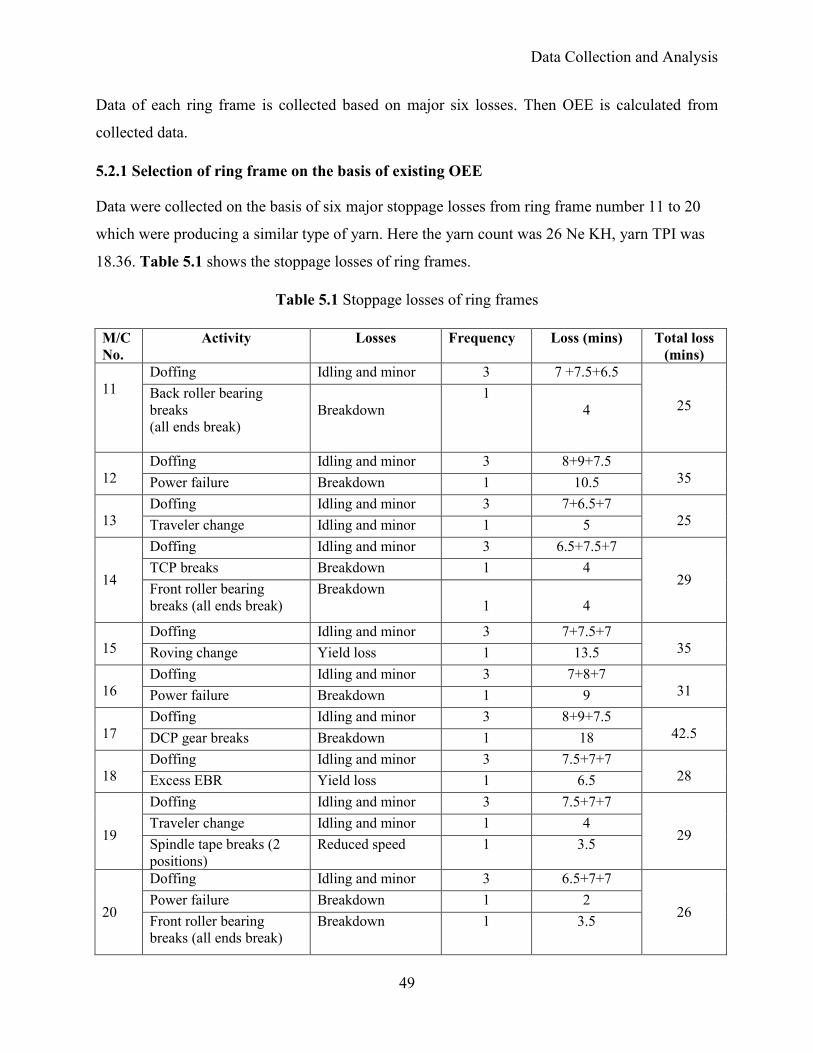
5.2.1 Selection of ring frame on the basis of existing OEE ....................................... 49
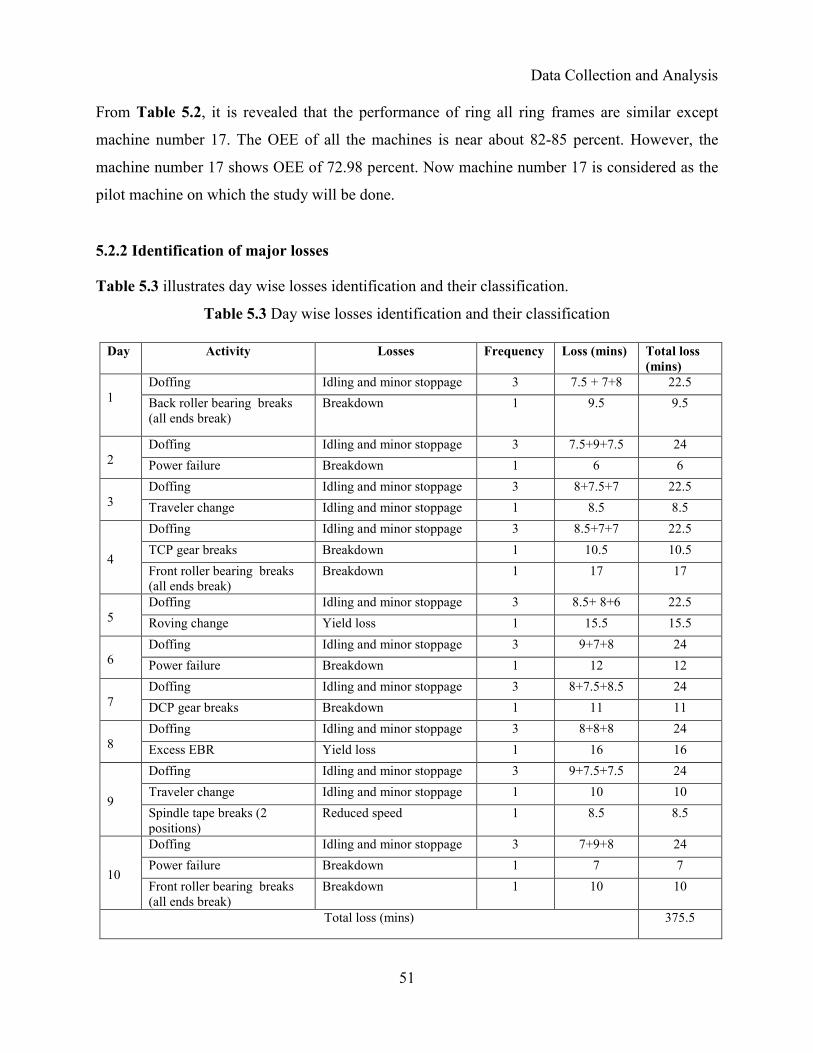
5.2.2 Identification of major losses ........................................................................... 51
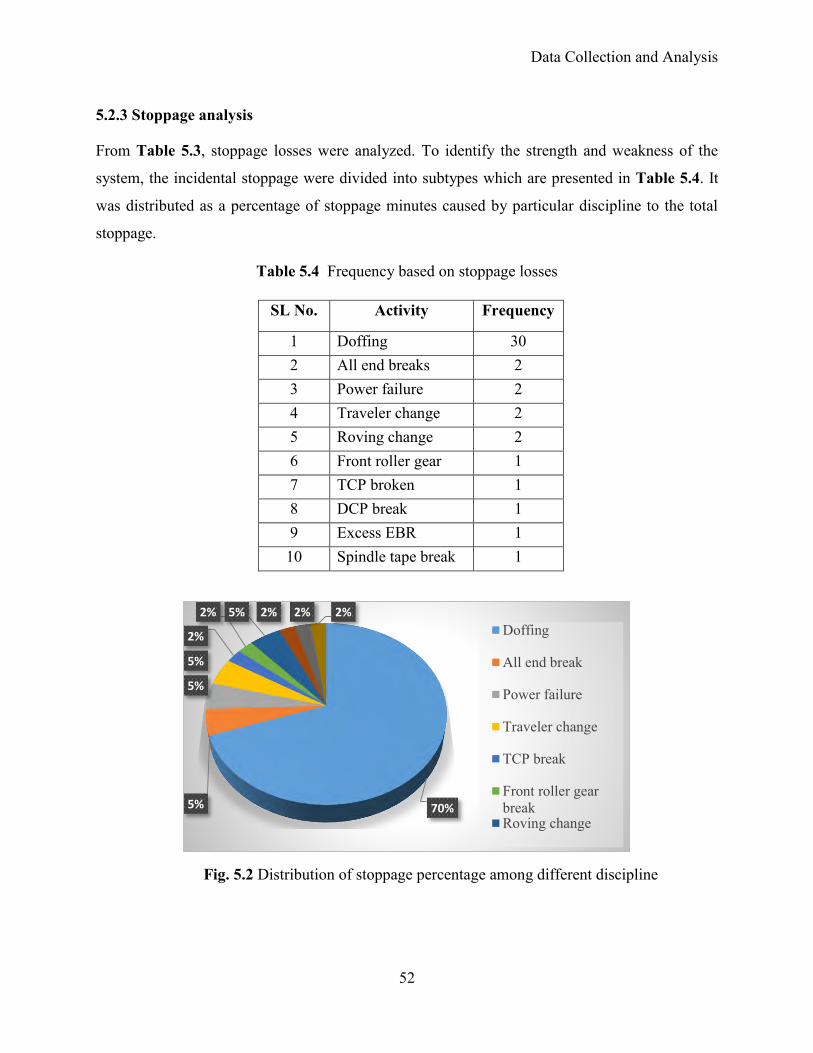
5.2.3 Stoppage analysis ............................................................................................. 52
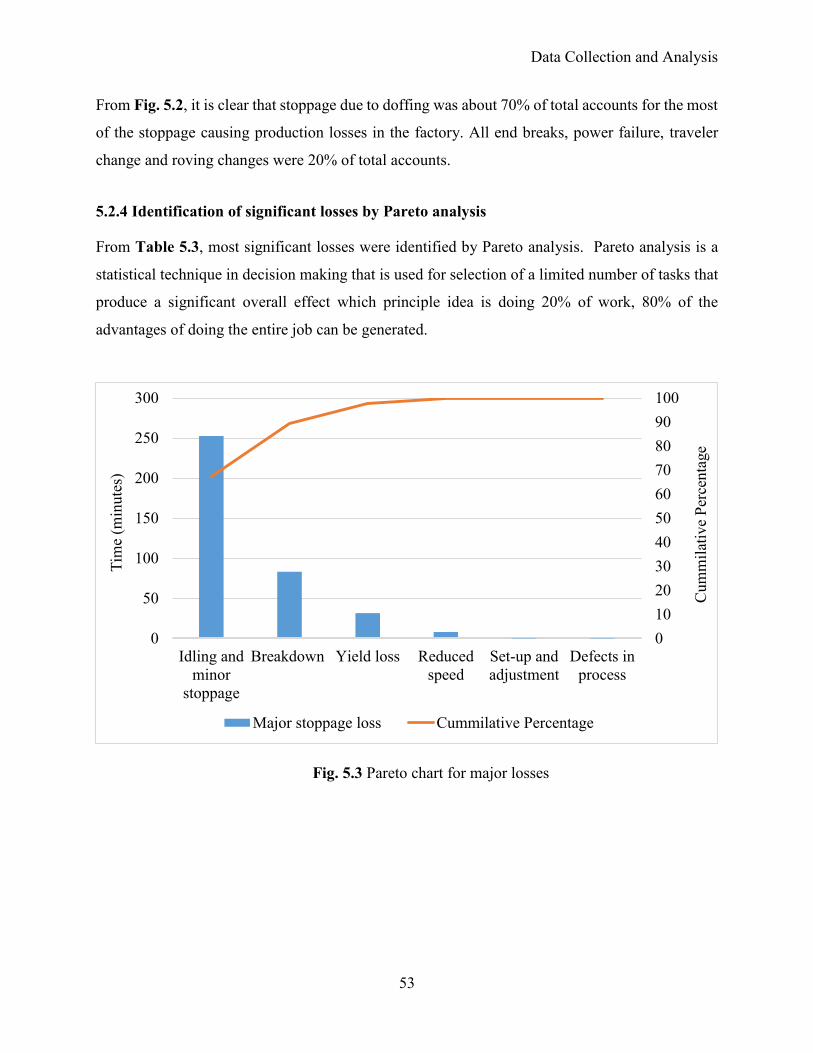
5.2.4 Identification of significant losses by Pareto analysis ...................................... 53
5.2.5 Calculation of OEE ........................................................................................... 55
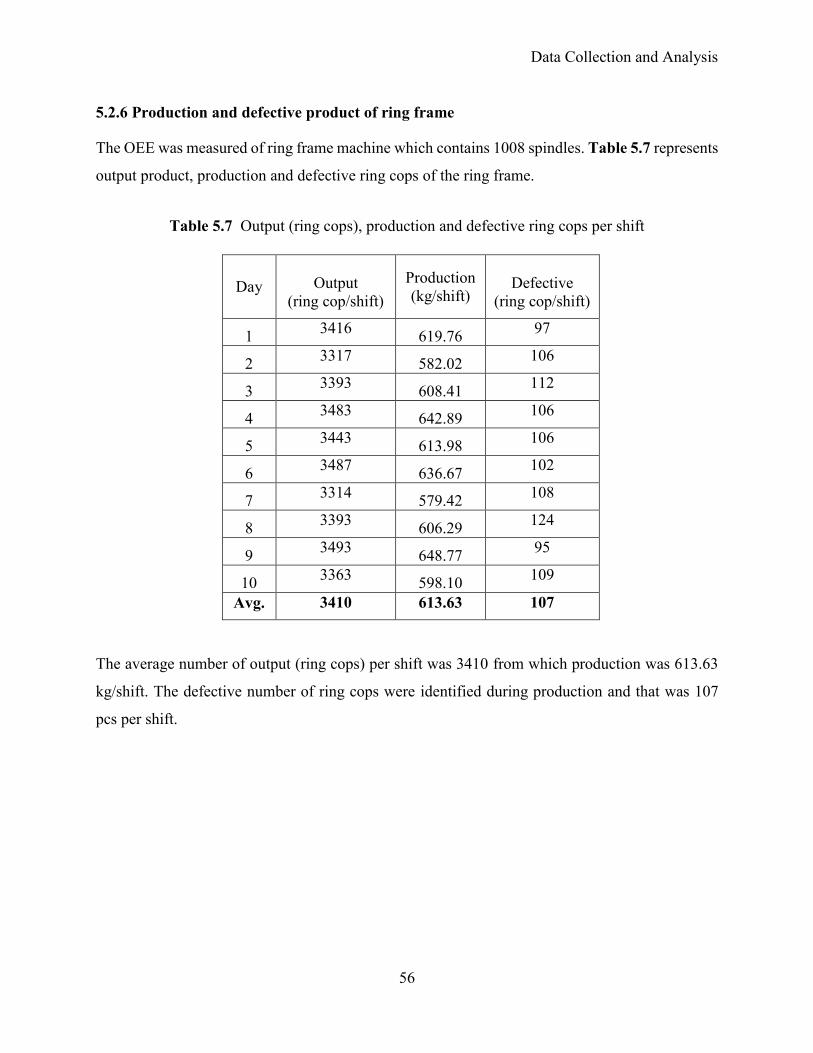
5.2.6 Production and defective product of ring frame ............................................... 56
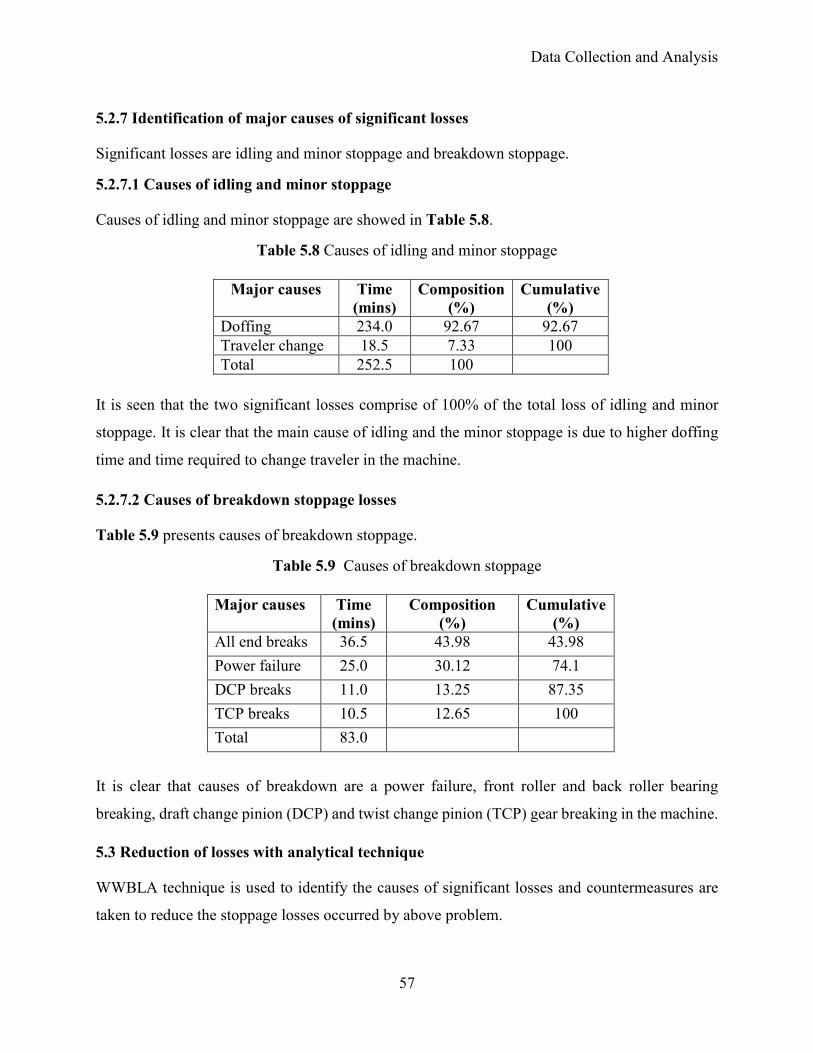
5.2.7 Identification of major causes of significant losses .......................................... 57
Page 11
x
5.2.7.1 Causes of idling and minor stoppage ......................................................... 57
5.2.7.2 Causes of breakdown stoppage losses ....................................................... 57
5.3 Reduction of losses with analytical technique ..................................................... 57
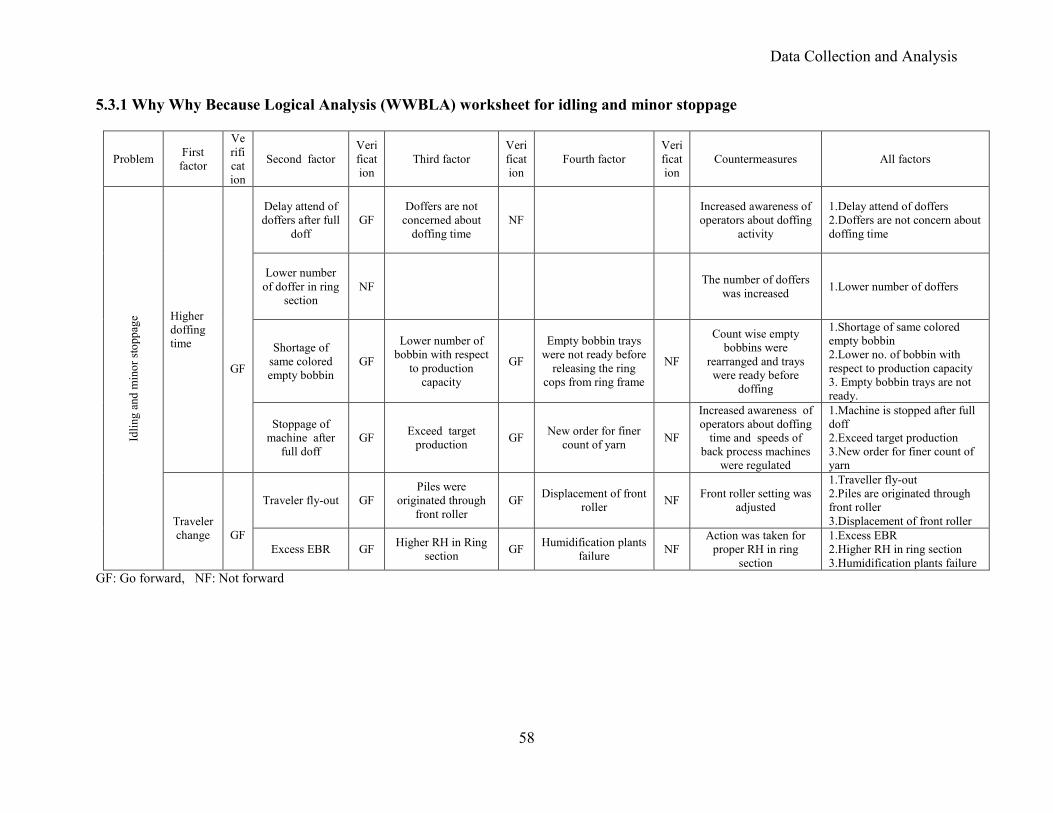
5.3.1 Why Why Because Logical Analysis (WWBLA) work sheet for idling and
minor stoppage ....................................................................................................... 58
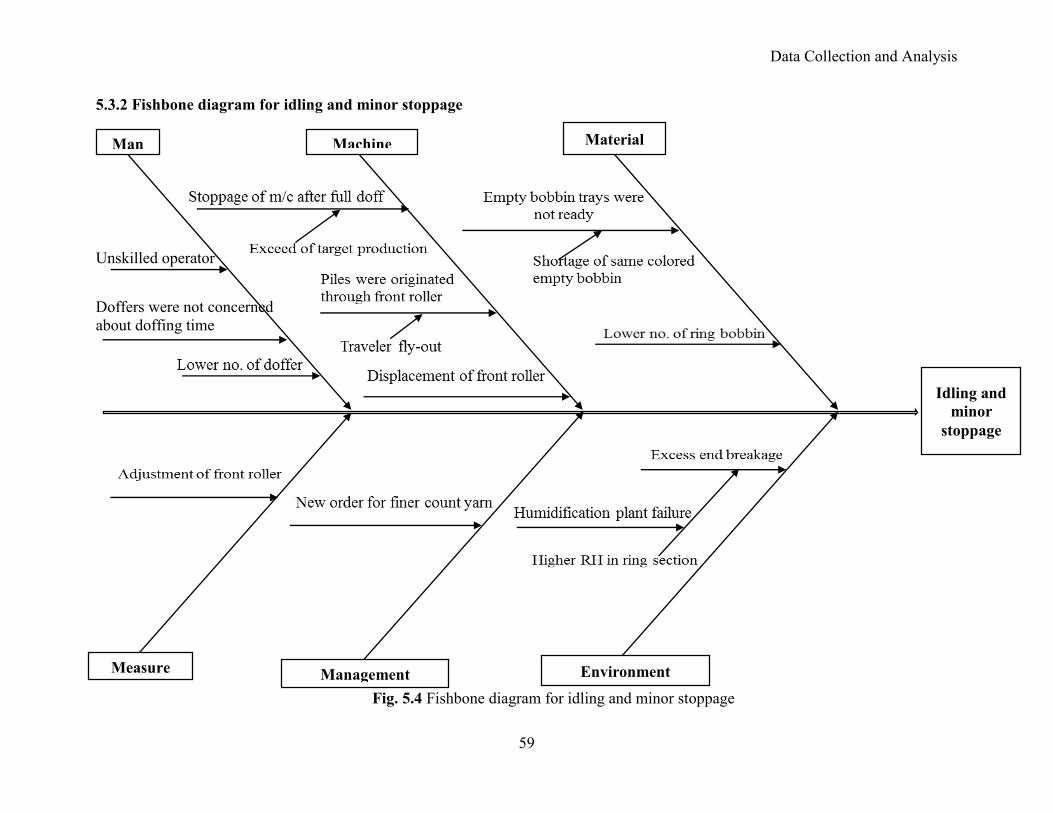
5.3.2 Fishbone diagram for idling and minor stoppage ......................................... 59
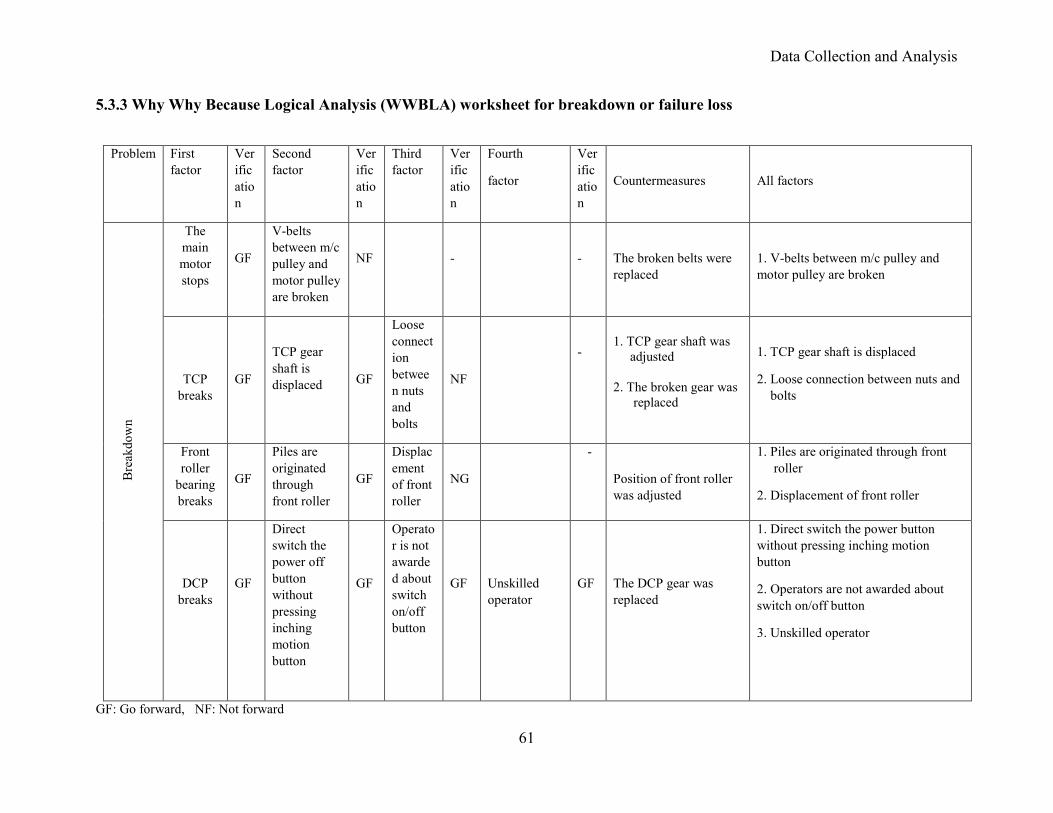
5.3.3 Why Why Because Logical Analysis (WWBLA) work sheet for breakdown
or failure loss.......................................................................................................... 61
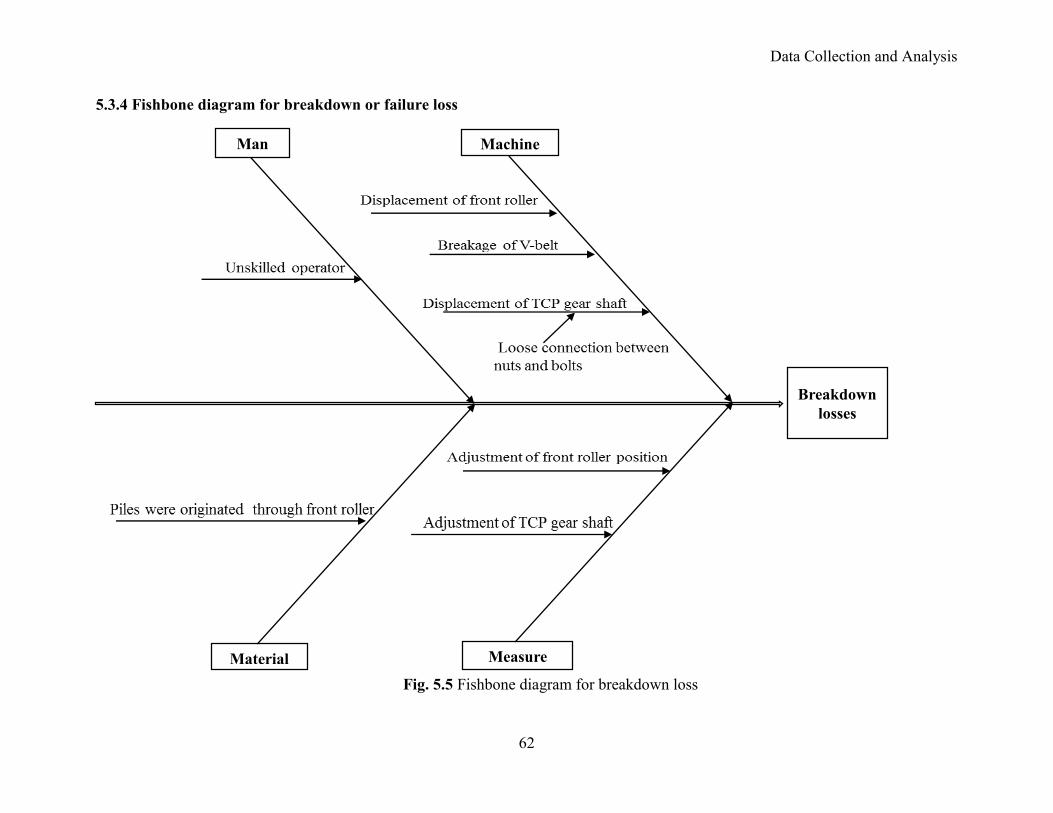
5.3.4 Fishbone diagram for breakdown or failure loss .......................................... 62
5.4 Important counter measures were taken and their impact ................................... 64
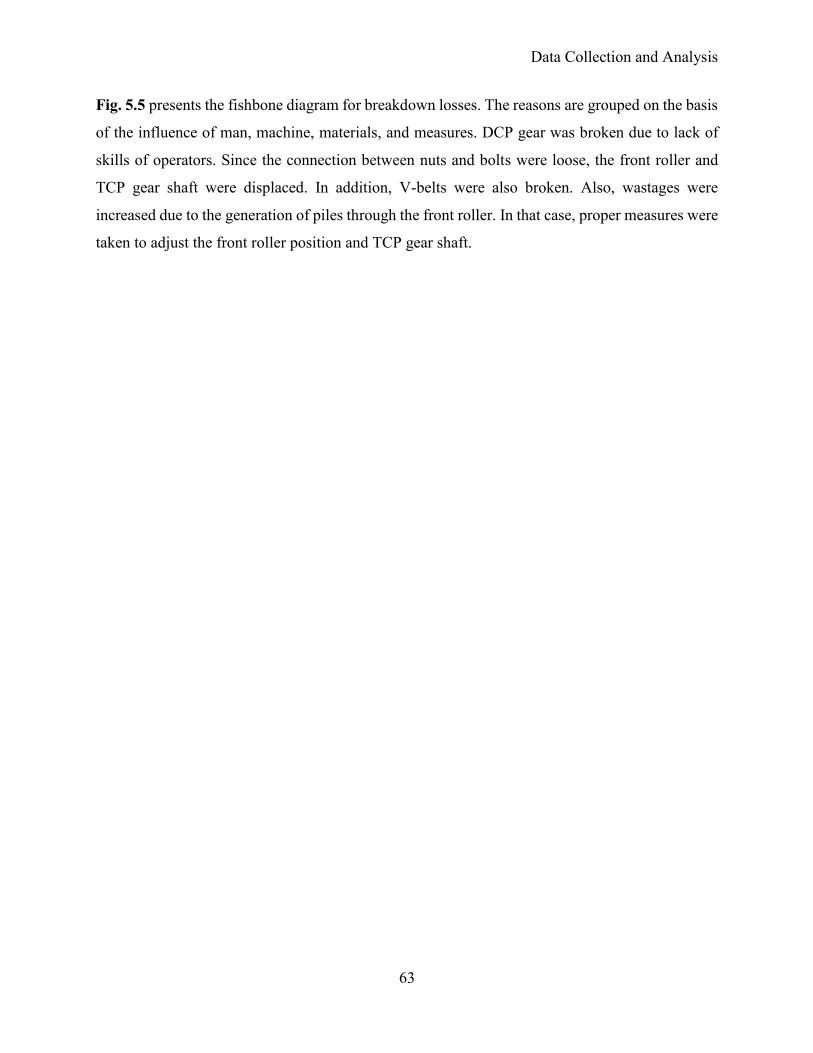
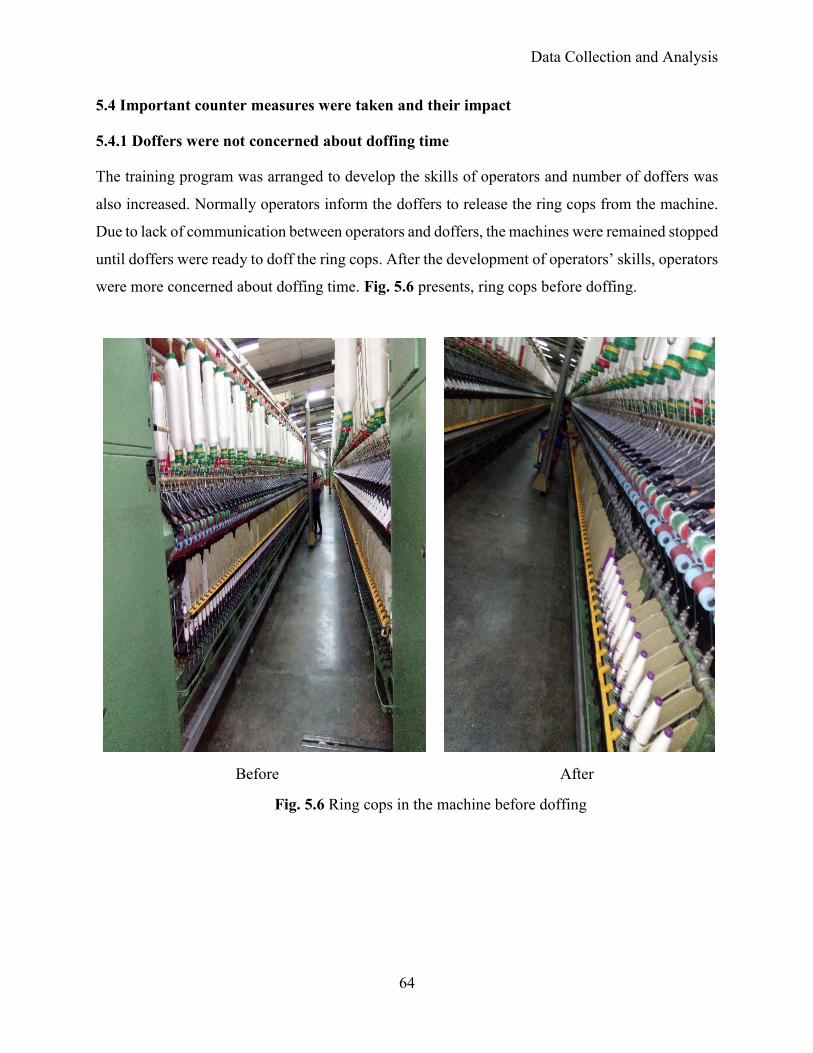
5.4.1 Doffers were not concerned about doffing time ........................................... 64
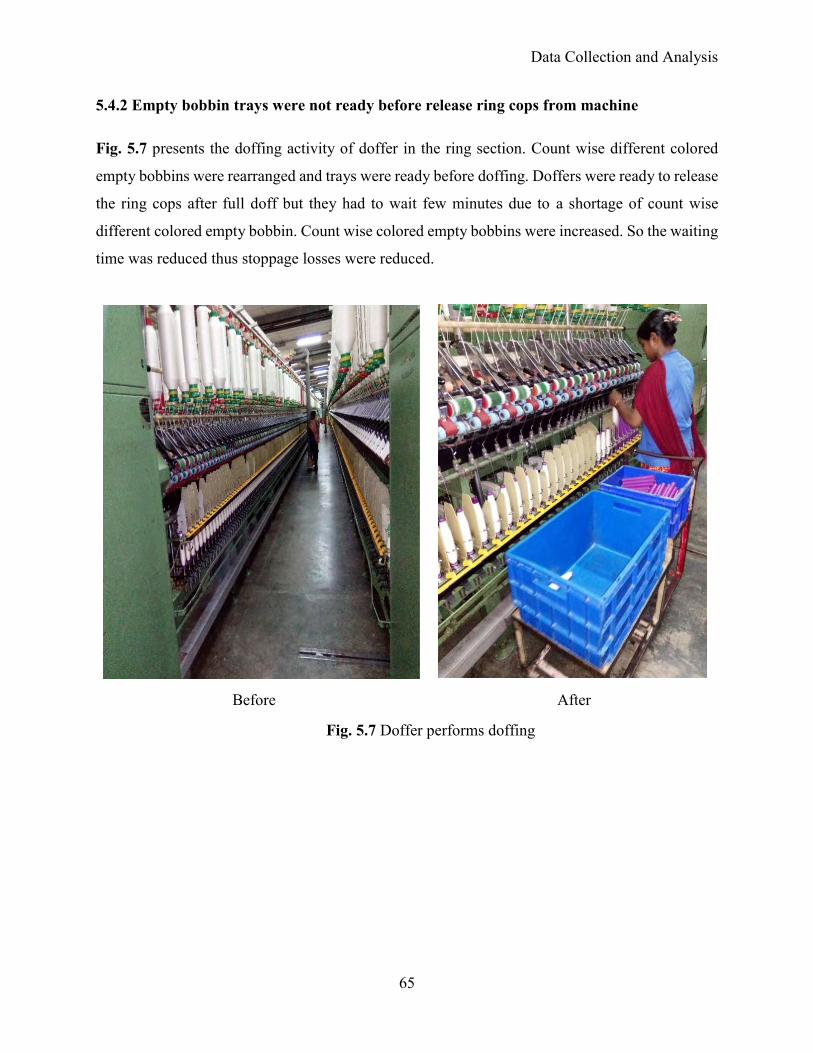
5.4.2 Empty bobbin trays were not ready before release ring cops from machine 65
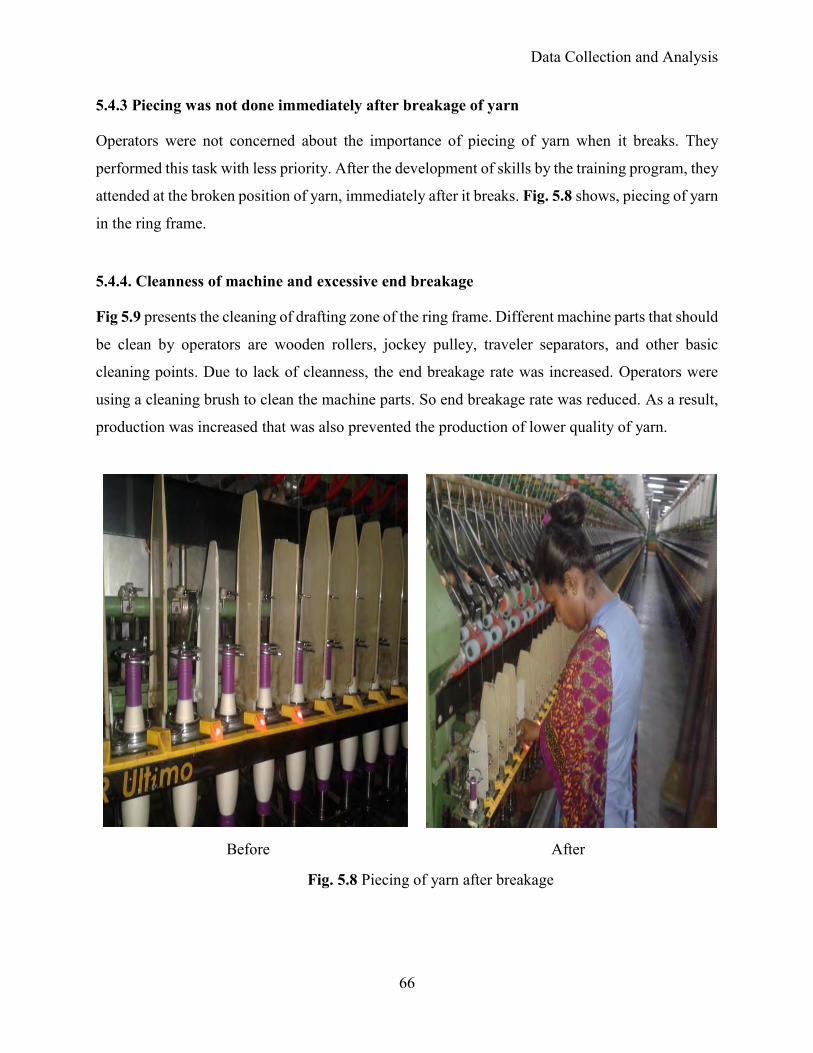
5.4.3 Piecing was not done immediately after breakage of yarn ........................... 66
5.4.4. Cleanness of machine and excessive end breakage ..................................... 66
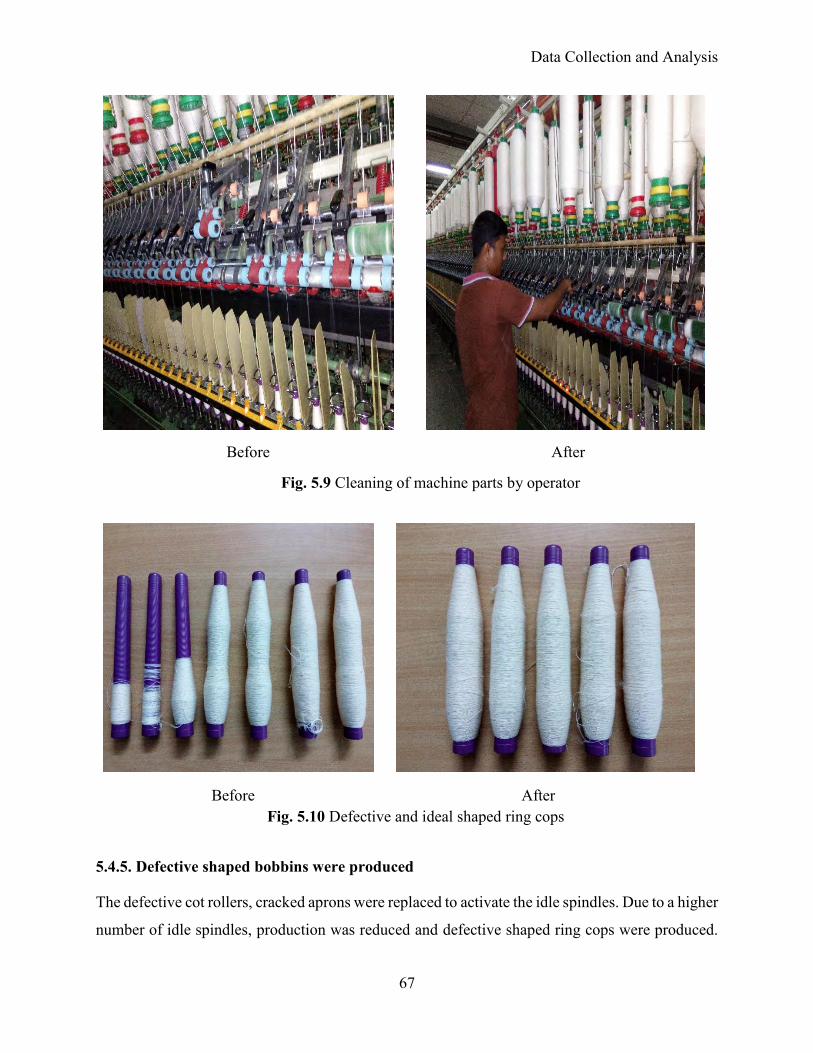
5.4.5. Defective shaped bobbins were produced .................................................... 67
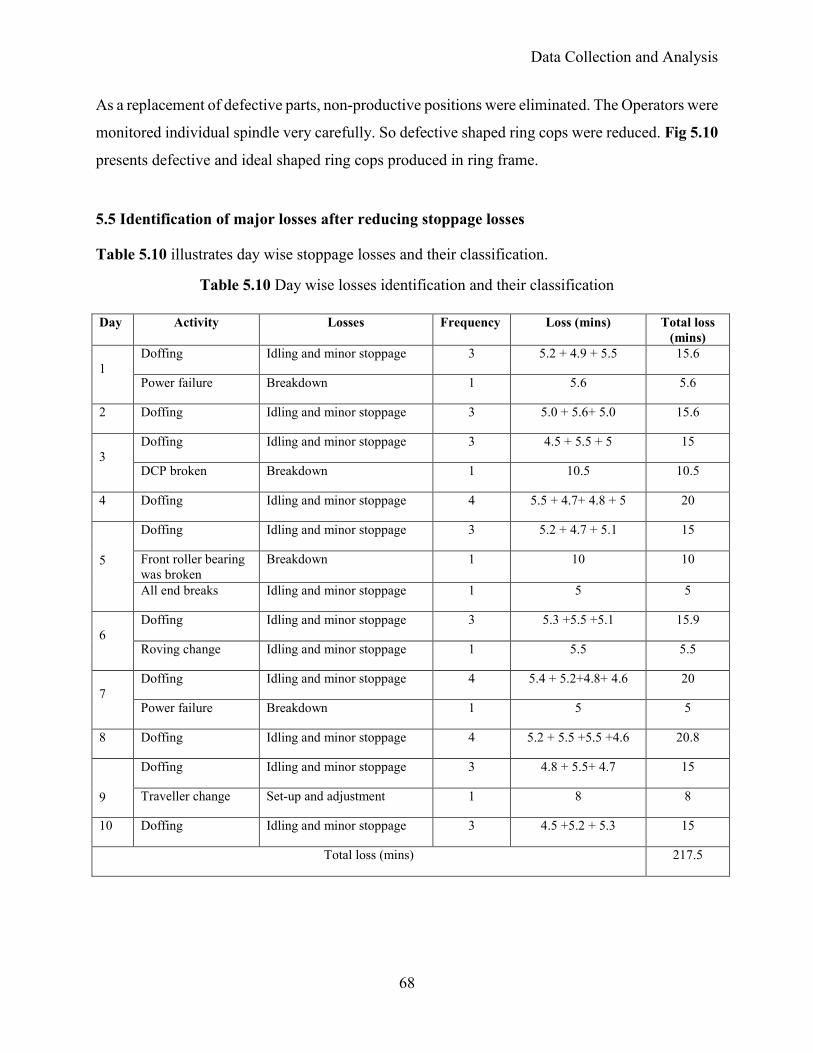
5.5 Identification of major losses after reducing stoppage losses ............................. 68
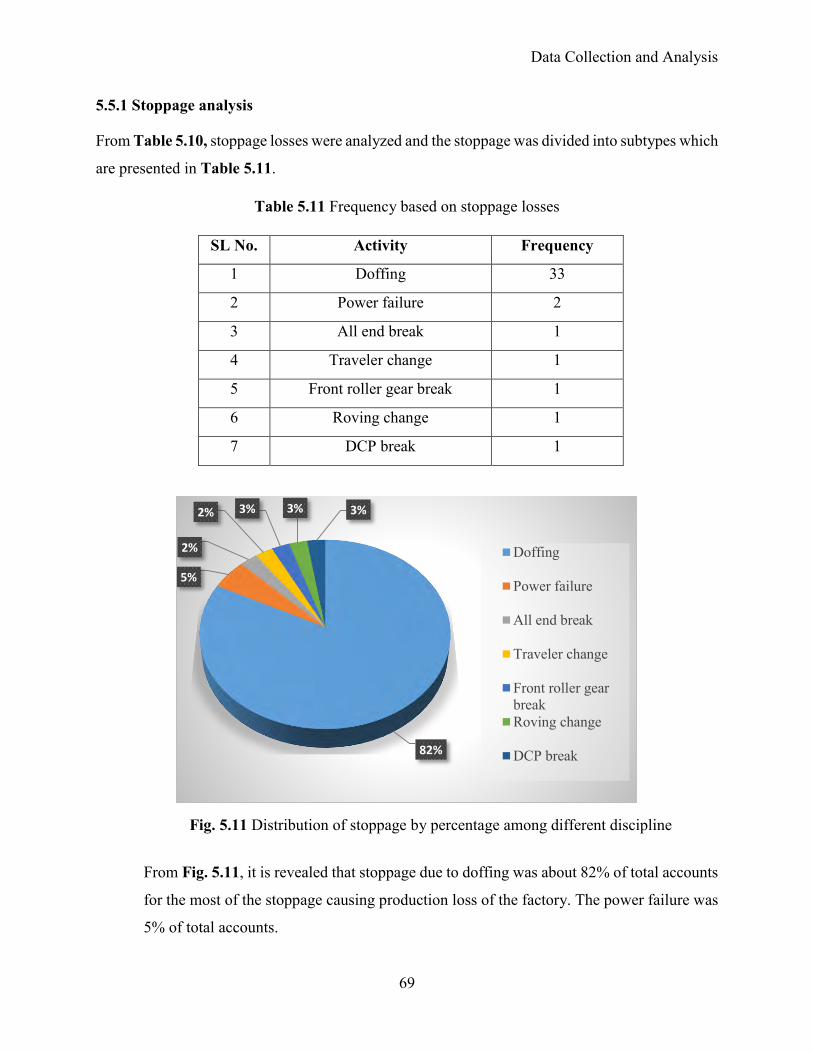
5.5.1 Stoppage analysis .......................................................................................... 69
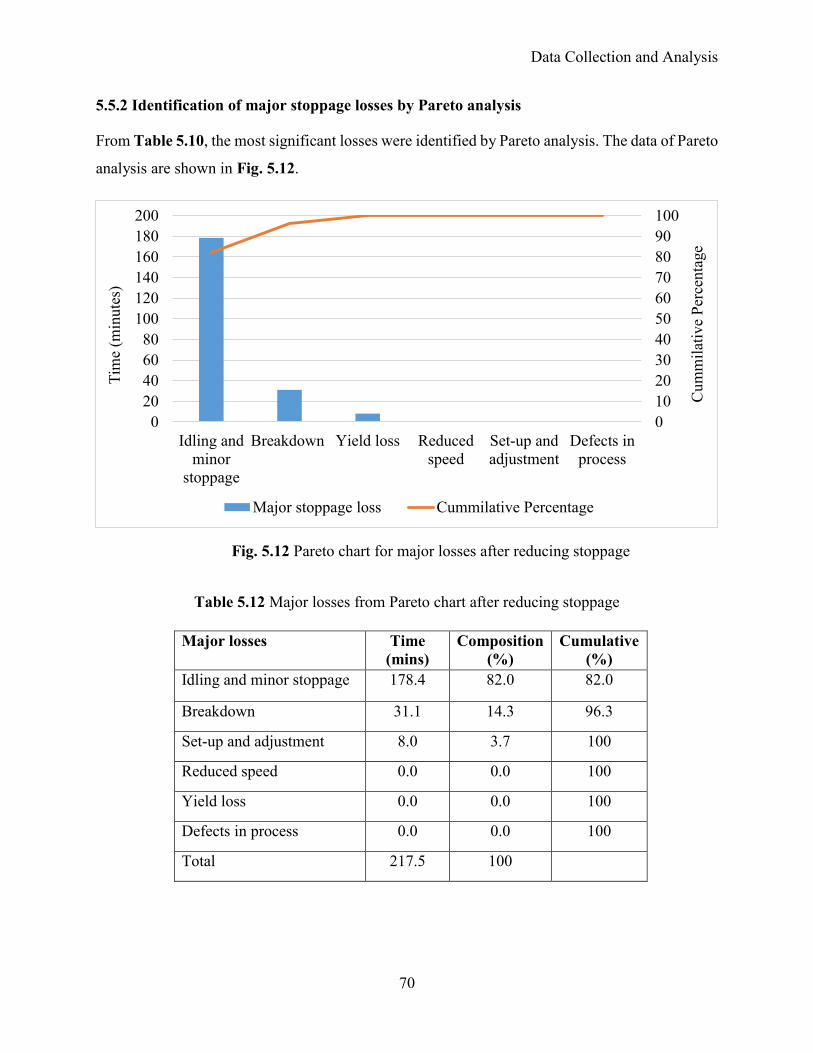
5.5.2 Identification of major stoppage losses by Pareto analysis .......................... 70
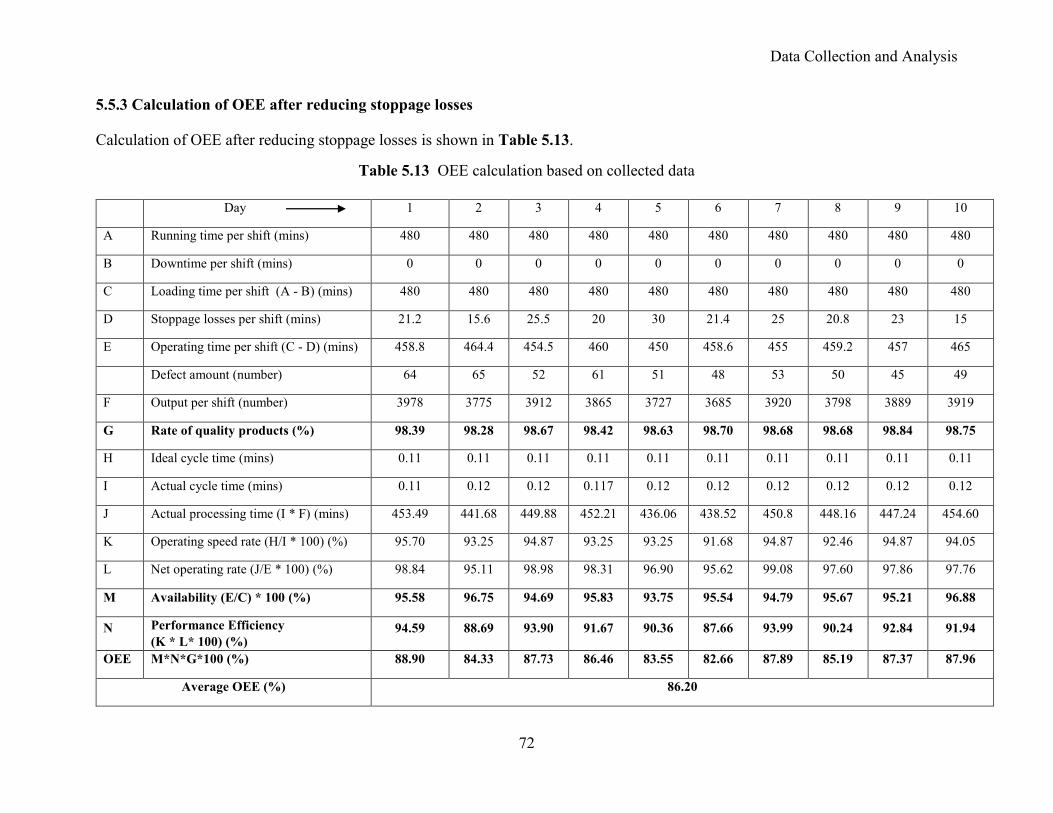
5.5.3 Calculation of OEE after reducing stoppage losses ...................................... 72
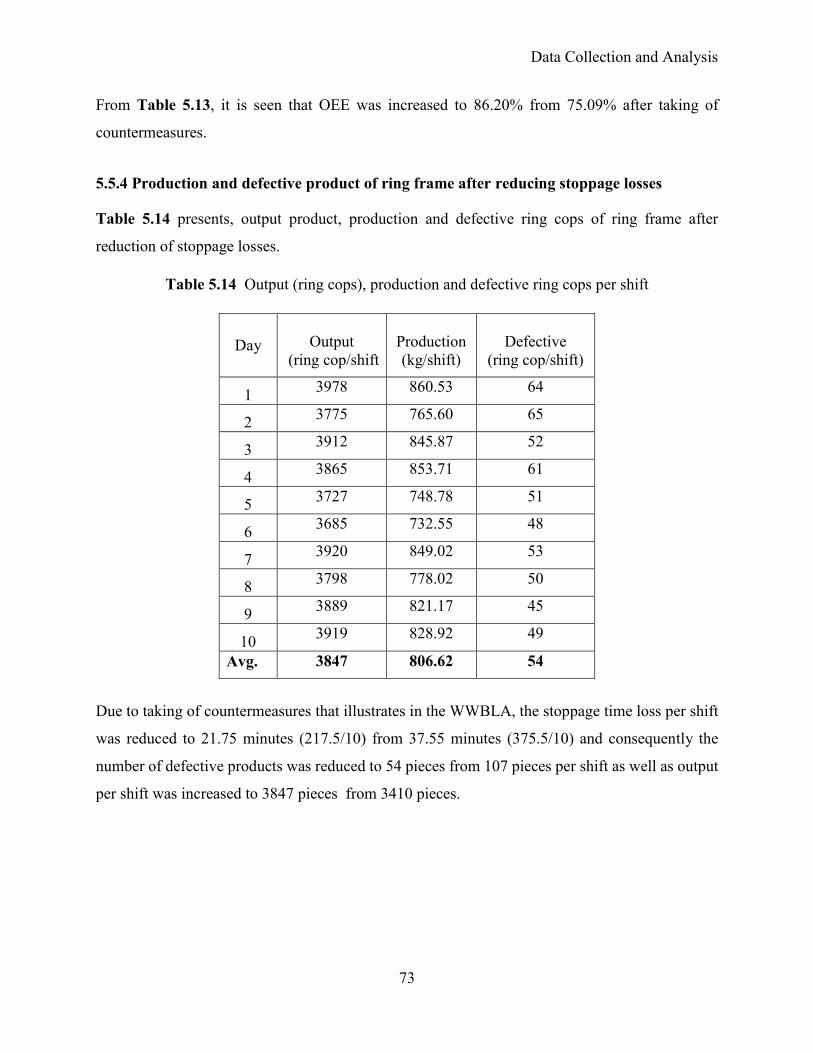
5.5.4 Production and defective product of ring frame after reducing stoppage
losses ...................................................................................................................... 73
CHAPTER 6: RESULTS AND DISCUSSION……………………………………….74
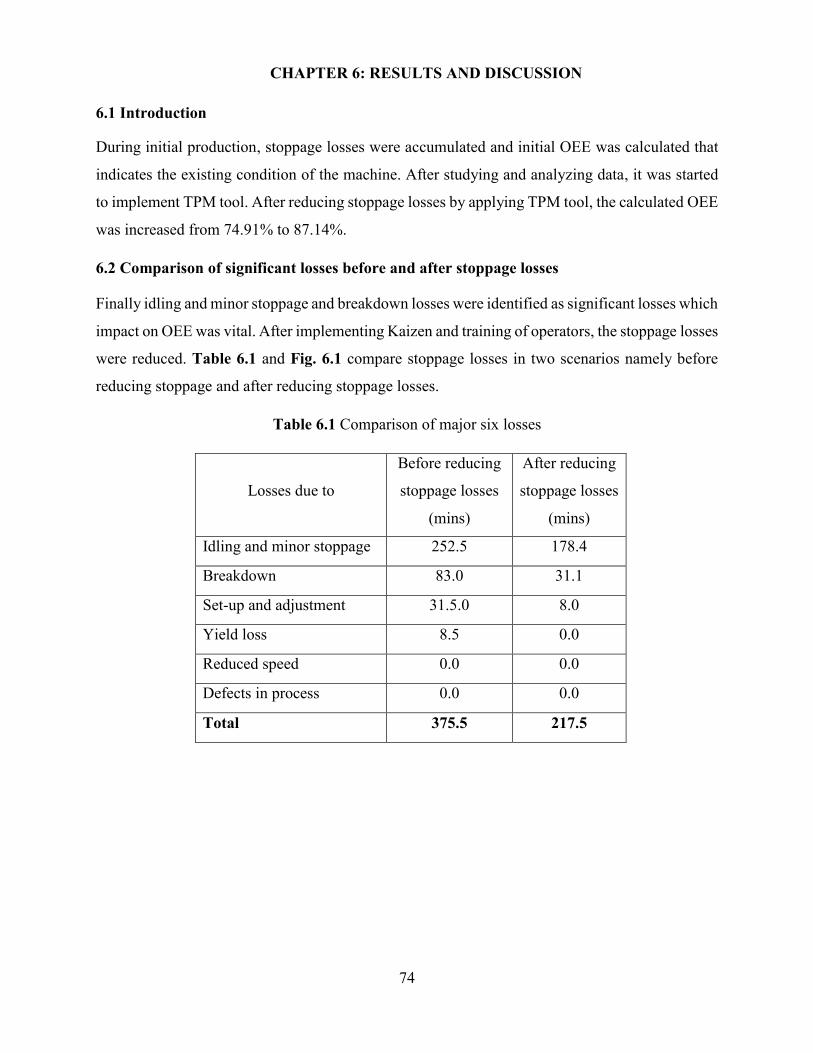
6.1 Introduction ......................................................................................................... 74
6.2 Comparison of significant losses before and after stoppage losses ..................... 74
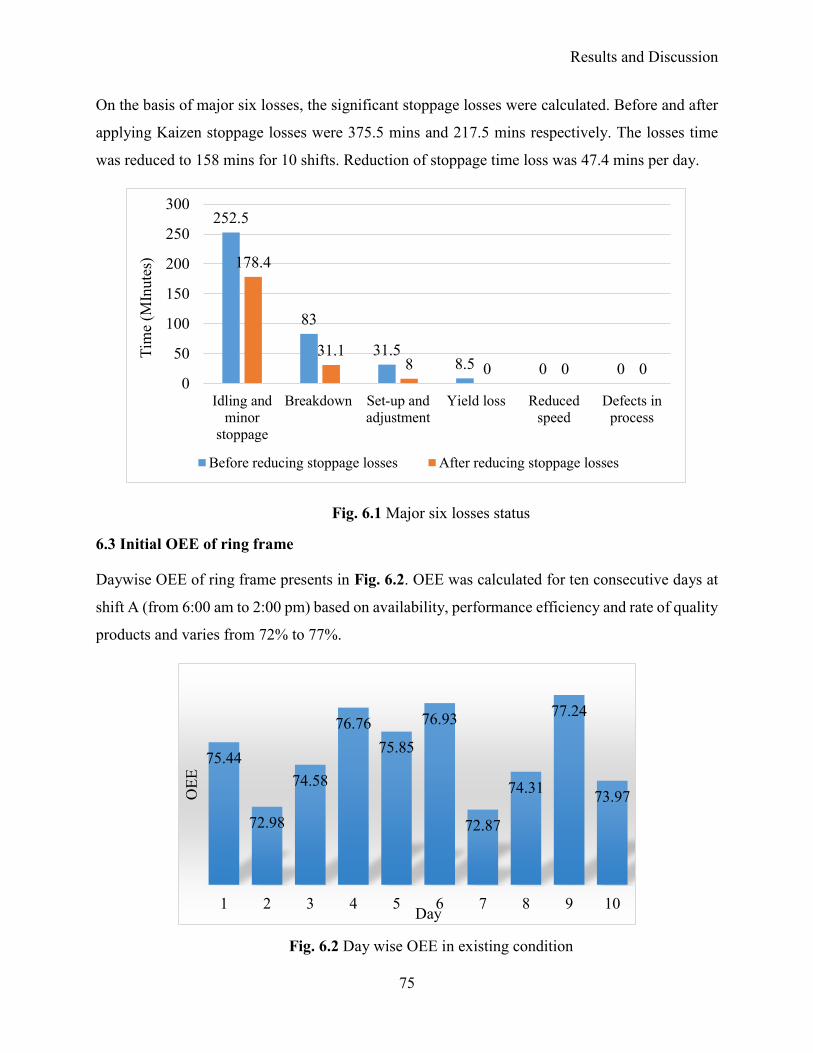
6.3 Initial OEE of ring frame ..................................................................................... 75
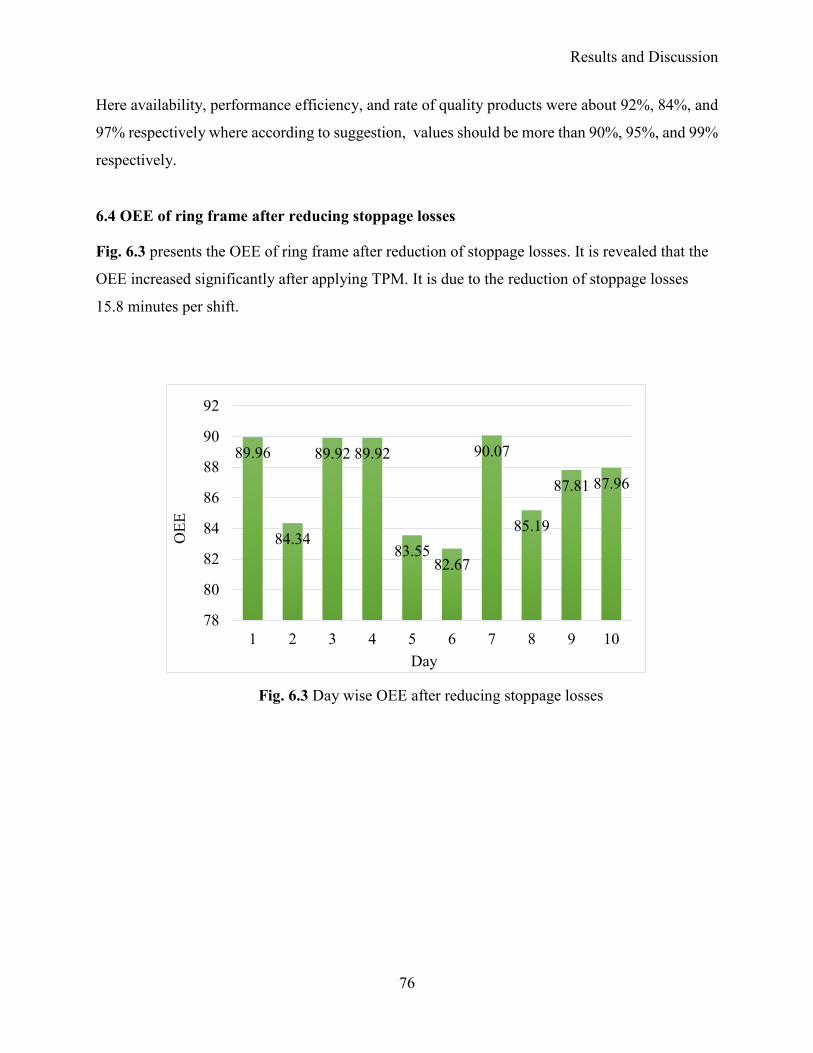
6.4 OEE of ring frame after reducing stoppage losses .............................................. 76
Page 12
xi
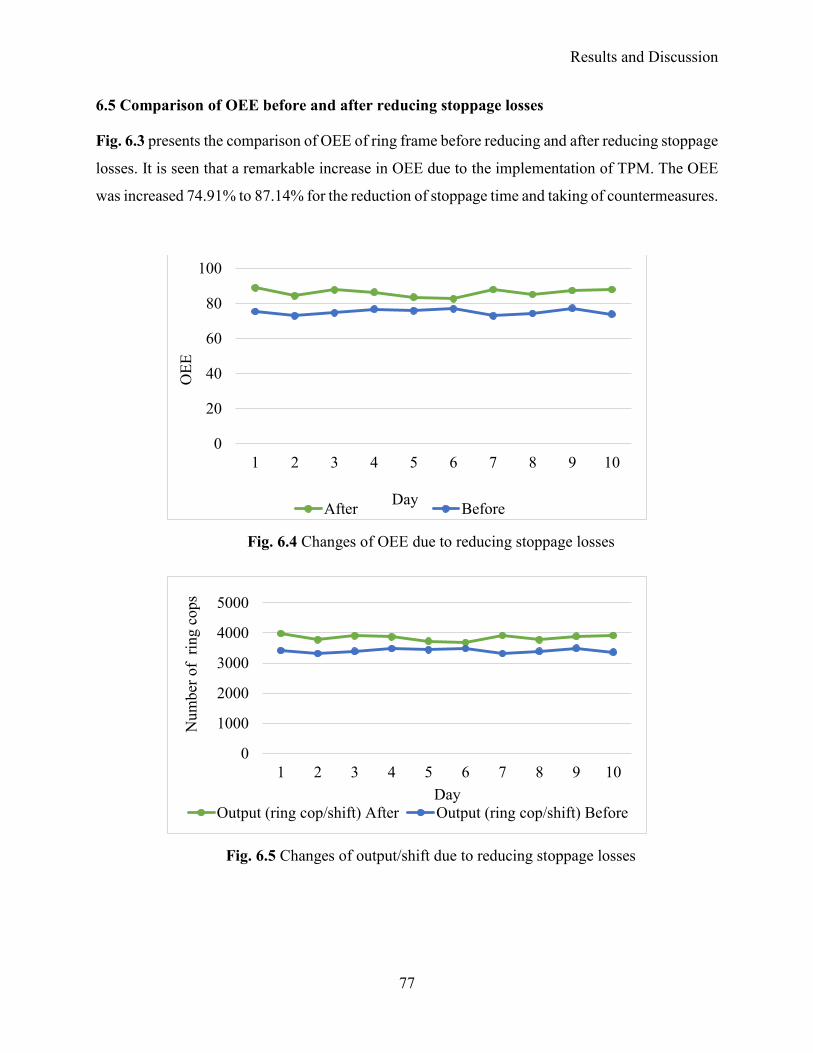
6.5 Comparison of OEE before and after reducing stoppage losses ......................... 77
6.6 Comparison of output product ............................................................................. 78
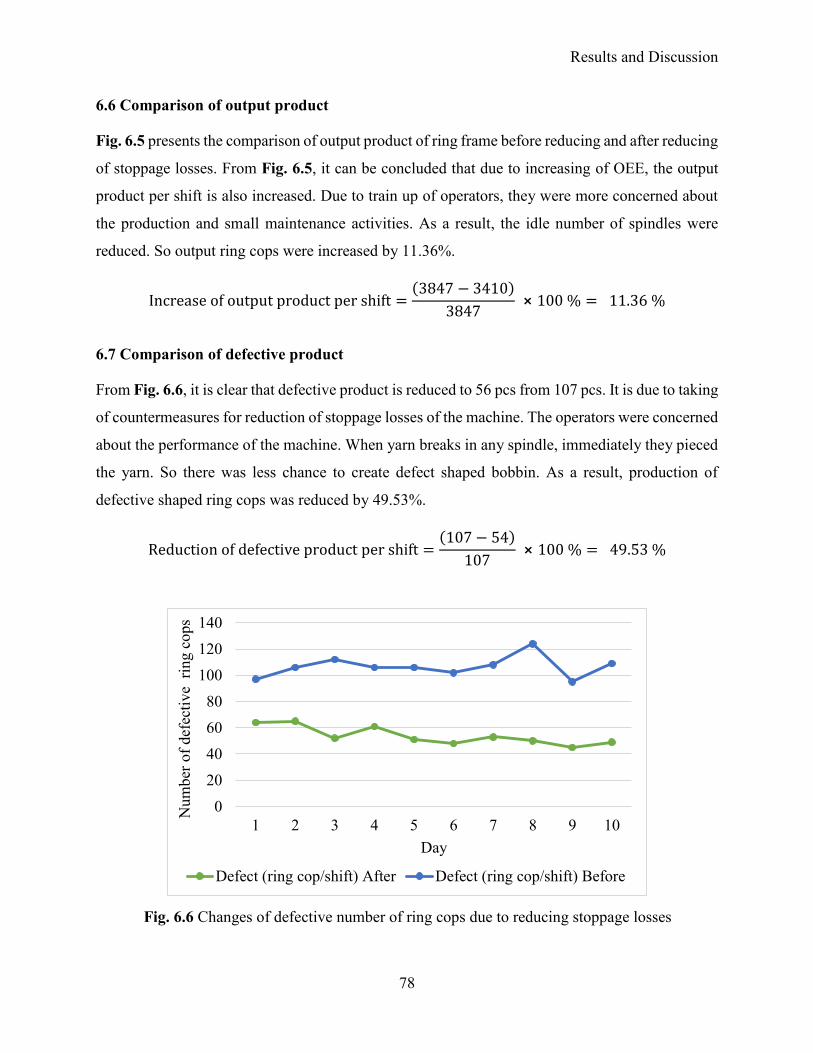
6.7 Comparison of defective product ........................................................................ 78
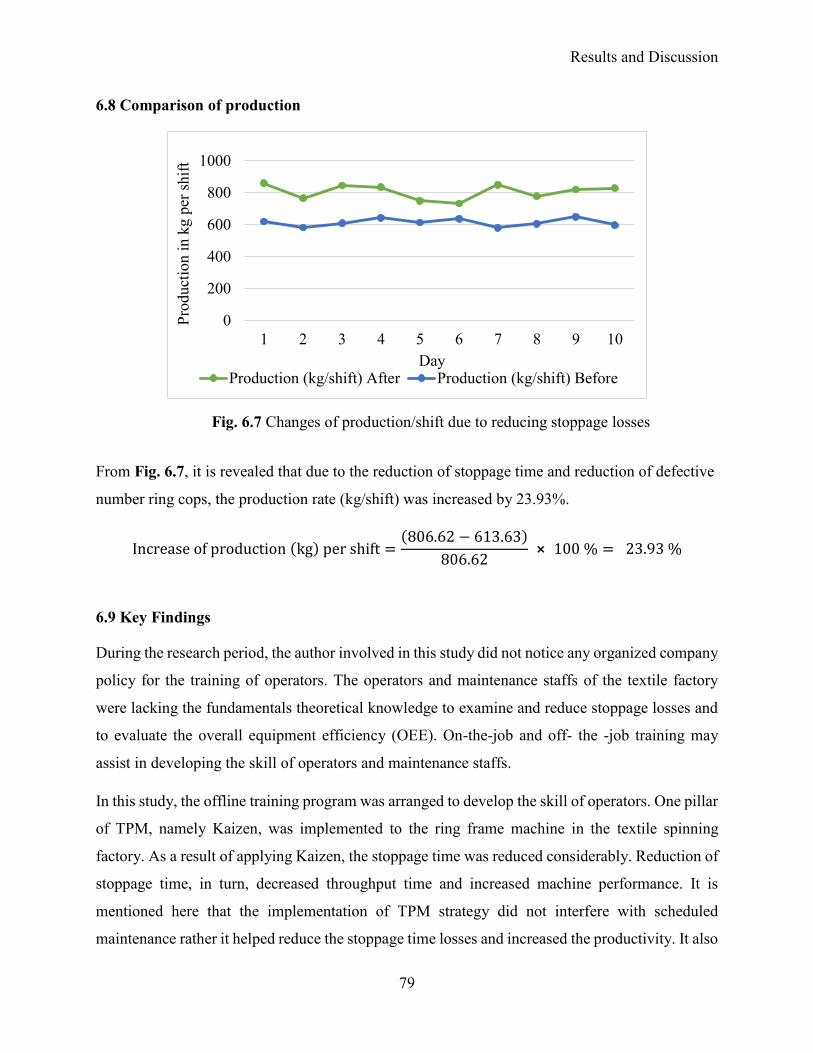
6.8 Comparison of production ................................................................................... 79
6.9 Discussion……………………………………………………………………….79
CHAPTER 7: CONCLUSION…………...……………………………………………81
7.1 Conclusion ........................................................................................................... 81
7.2 Recommendations ................................................................................................ 81
References ................................................................................................................. 83
Appendices ................................................................................................................ 88
Page 13
xii
List of Tables
Table 2.1 Differences between TQM and TPM ................................................................ 6
Table 2.2 Key activities for effective 5S implementation at workplace .......................... 11
Table 5.1 Stoppage losses of ring frames ......................................................................... 49
Table 5.2 Existing OEE of ring frame section .................................................................. 50
Table 5.3 Day wise losses identification and their classification ..................................... 51
Table 5.4 Frequency based on stoppage losses ................................................................ 52
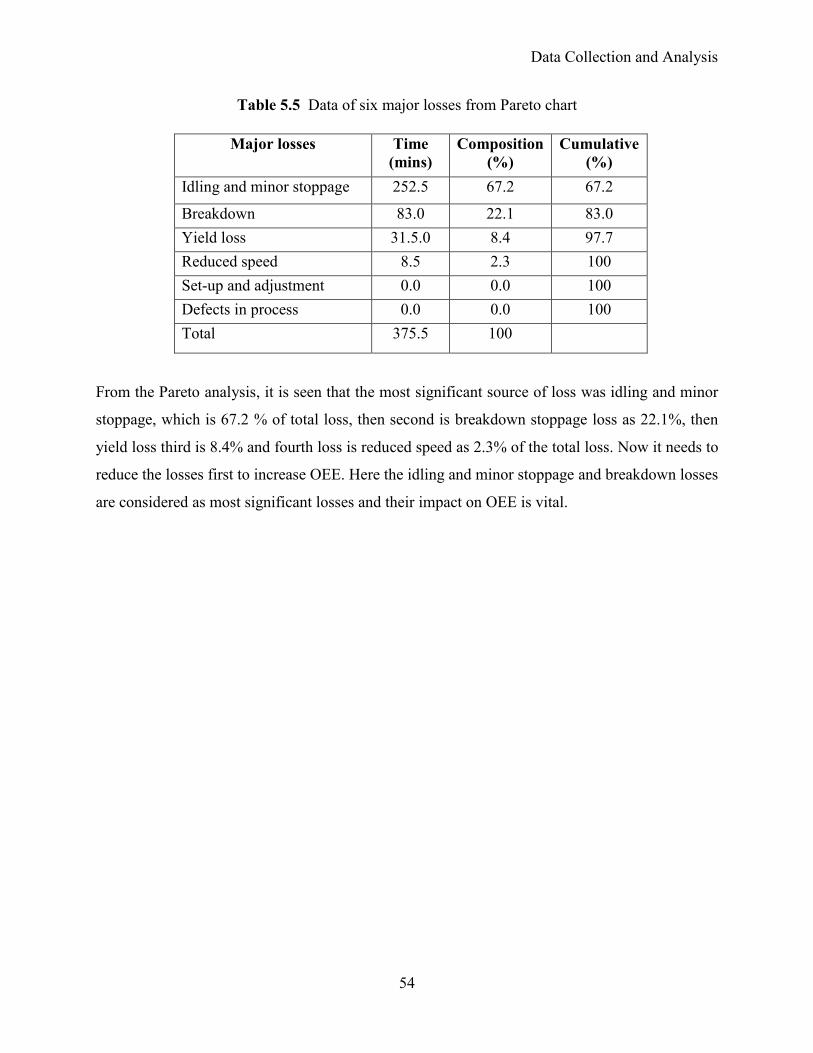
Table 5.5 Data of six major losses from Pareto chart ...................................................... 54
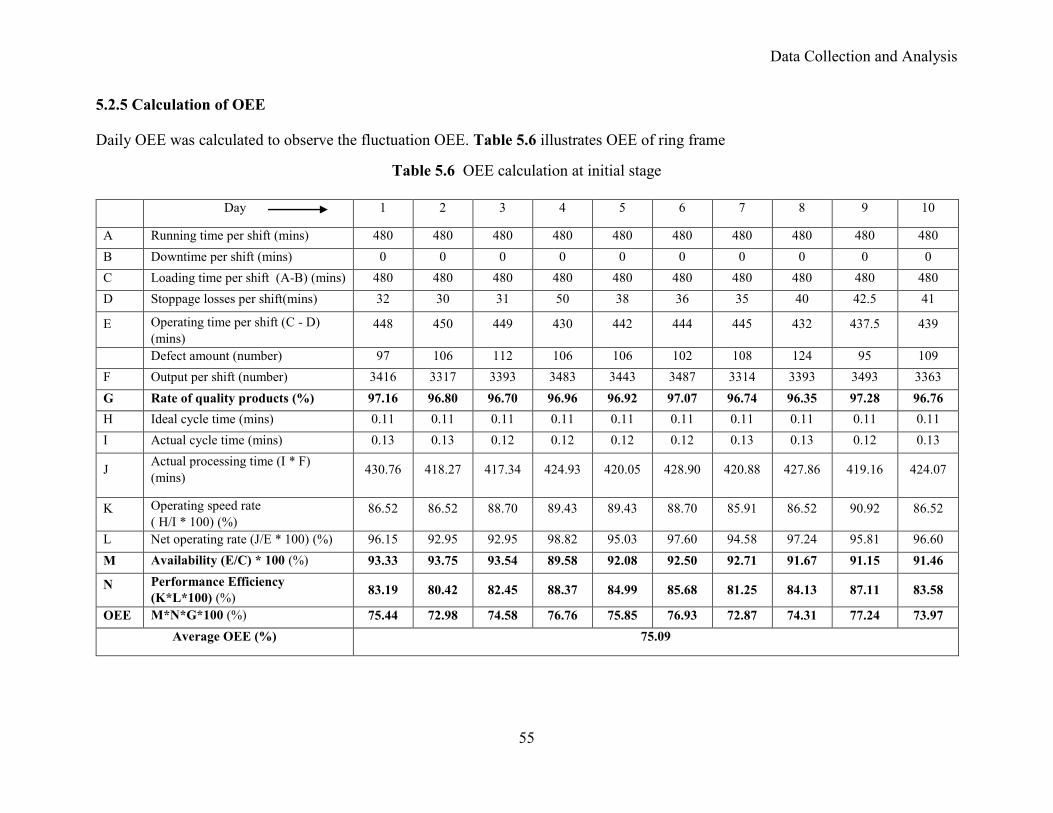
Table 5.6 OEE calculation at initial stage ........................................................................ 55
Table 5.7 Output (ring cops), production and defective ring cops per shift .................... 56
Table 5.8 Causes of idling and minor stoppage ................................................................ 57
Table 5.9 Causes of breakdown stoppage ........................................................................ 57
Table 5.10 Day wise losses identification and their classification ................................... 68
Table 5.11 Frequency based on stoppage losses ............................................................... 69
Table 5.12 Major losses from Pareto chart after reducing stoppage ................................. 70
Table 5.13 OEE calculation based on collected data ....................................................... 72
Table 5.14 Output (ring cops), production and defective ring cops per shift .................. 73
Table 6.1 Comparison of major six losses ........................................................................ 74
Page 14
xiii
List of Figures
Fig. 2.1 Calculation of OEE from major six stoppage losses .......................................... 18
Fig. 3.1 Process flow chart of carded yarn production ..................................................... 22
Fig. 3.2 Ring Frame ......................................................................................................... 26
Fig. 3.3 Yarn production in ring frame ............................................................................ 27
Fig. 4.1 Umbrella type creel ............................................................................................. 32
Fig. 4.2 The feed material of ring frame (roving) ............................................................. 32
Fig. 4.3 Creeling of roving in the ring frame .................................................................... 32
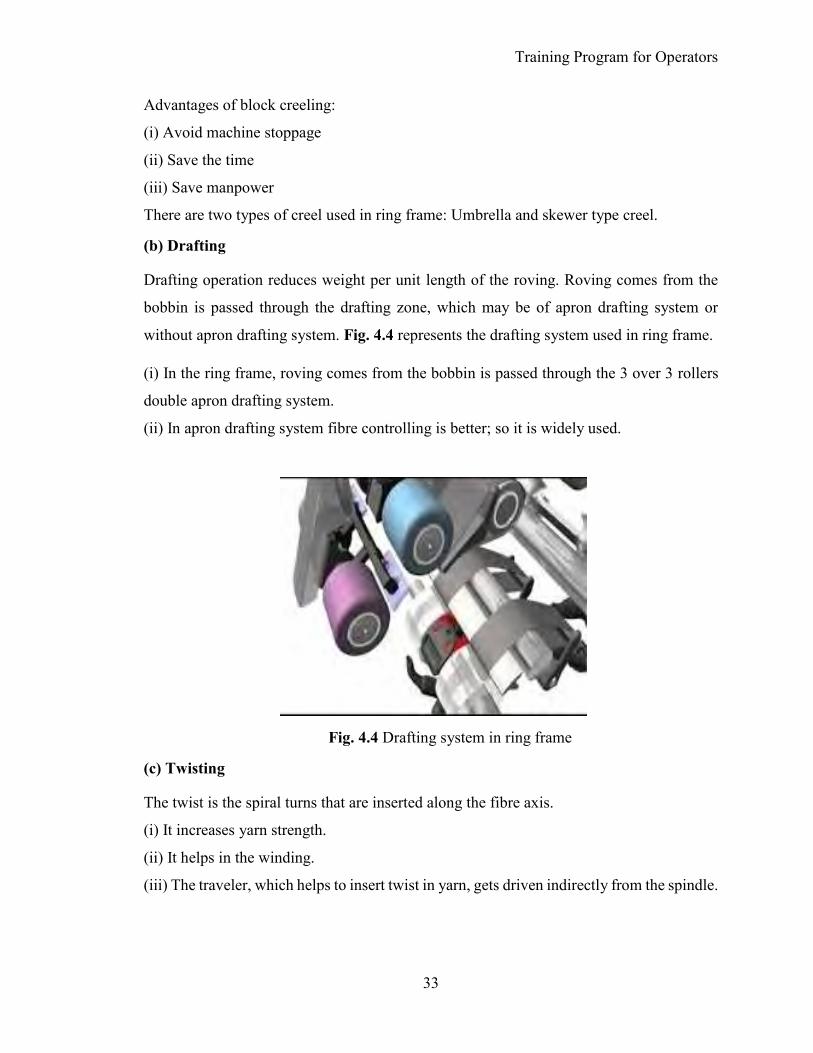
Fig. 4.4 Drafting system in ring frame .............................................................................. 33
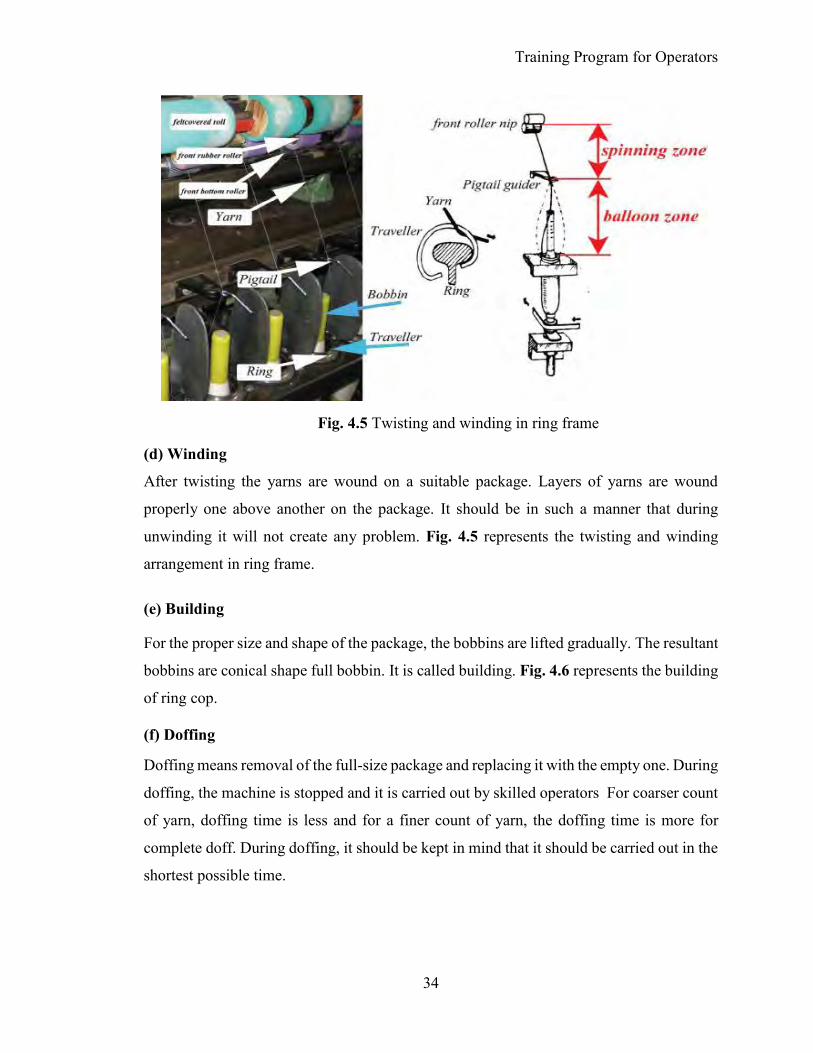
Fig. 4.5 Twisting and winding in ring frame .................................................................... 34
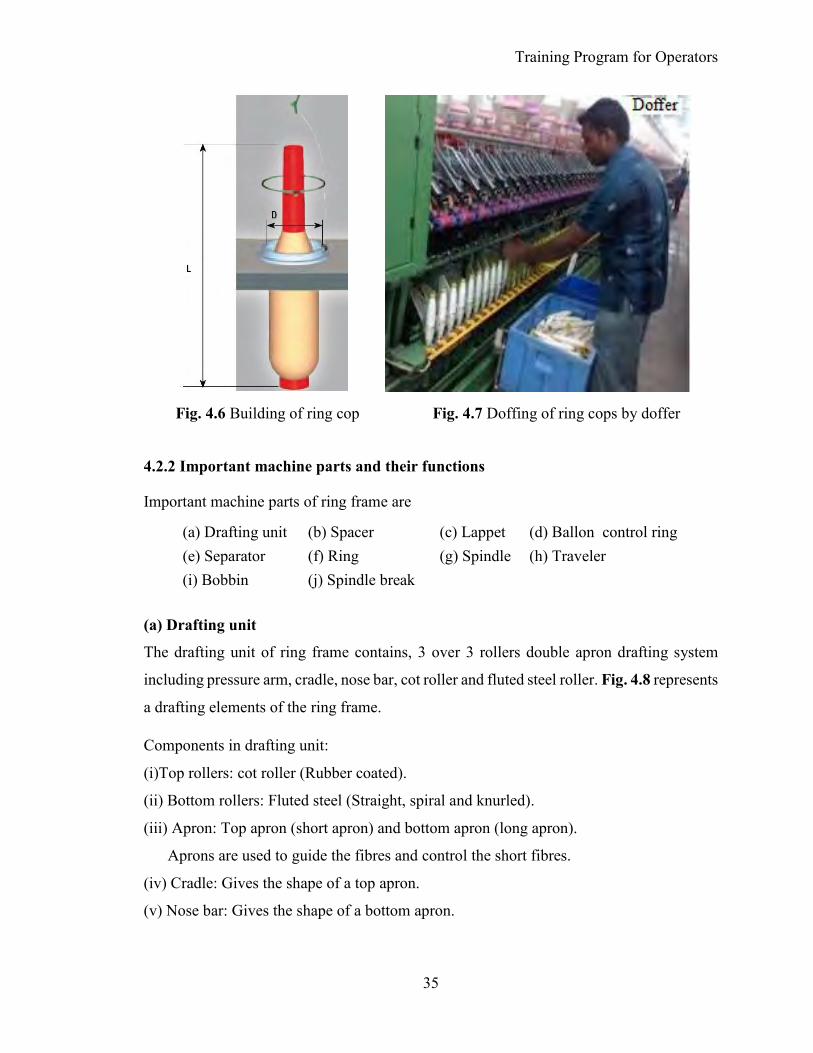
Fig. 4.6 Building of ring cop……………………………………………………………..35
Fig. 4.7 Doffing of ring cops by doffer ............................................................................. 35
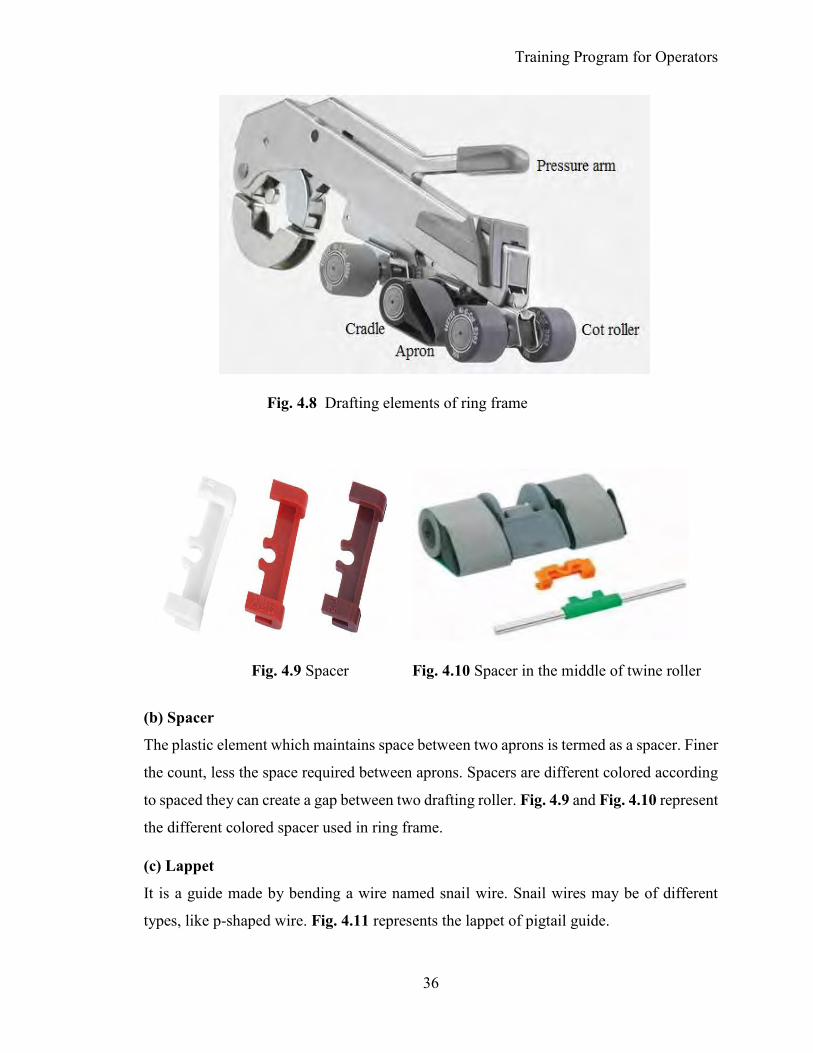
Fig. 4.8 Drafting elements of ring frame ......................................................................... 36
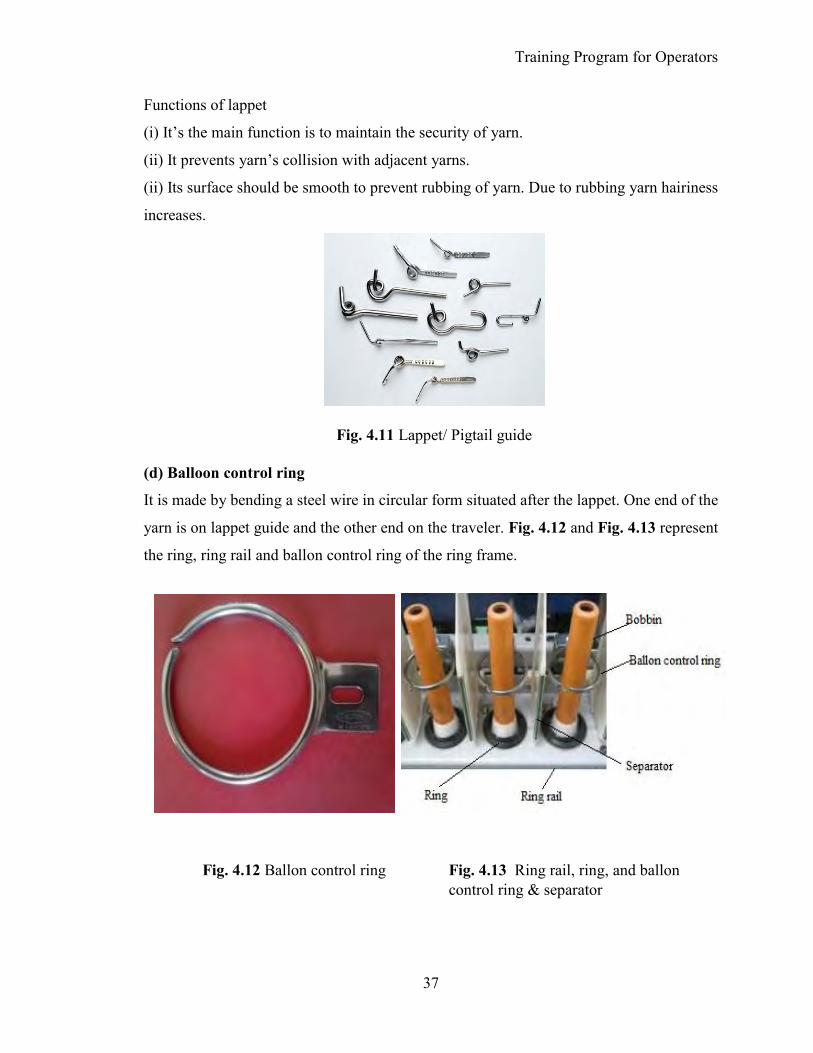
Fig. 4.9 Spacer .................................................................................................................. 36
Fig. 4.10 Spacer in the middle of twine roller…………………………………………...36
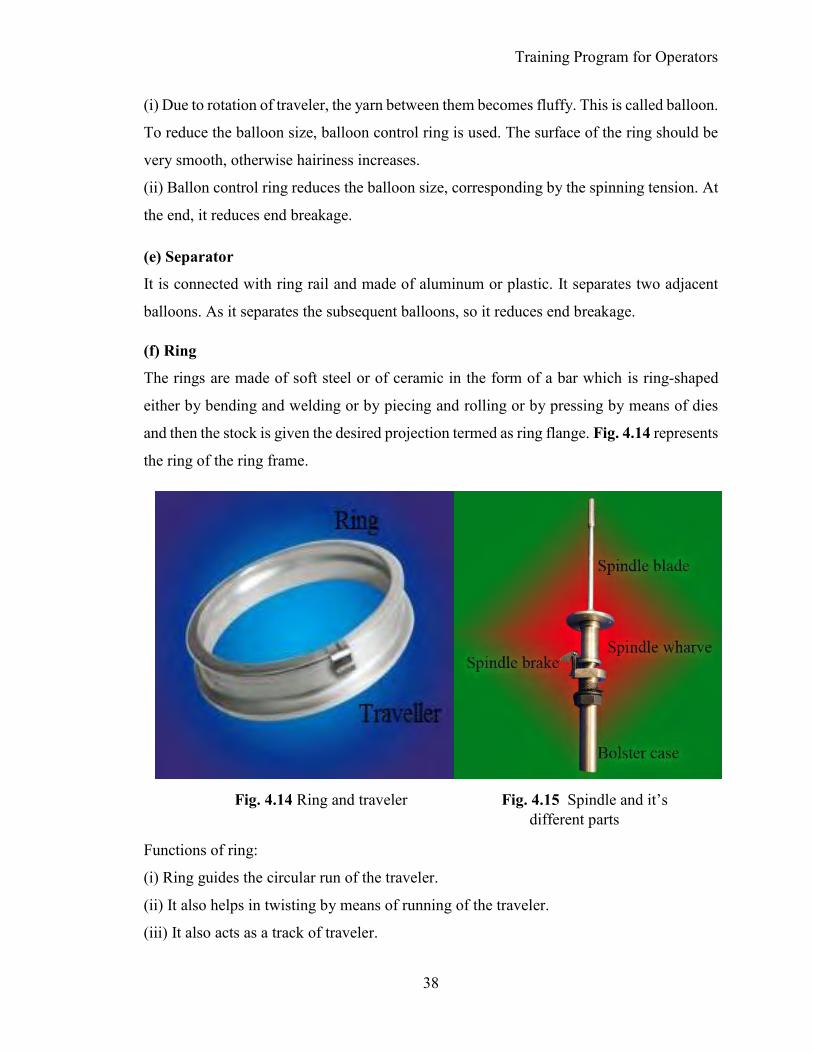
Fig. 4.11 Lappet/ Pigtail guide…………………………………………………………...37
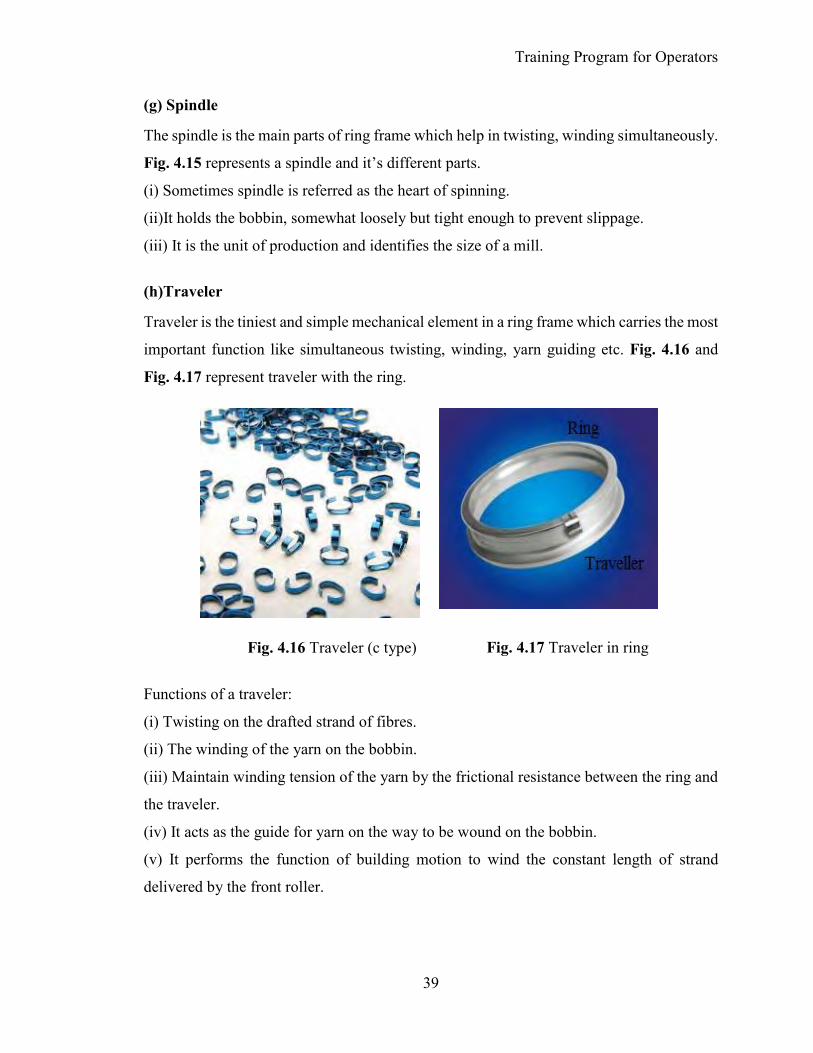
Fig. 4.12 Ballon control ring ............................................................................................. 37
Fig. 4.13 Ring rail, ring and ballon control ring & separator .......................................... 37
Fig. 4.14 Ring and traveler ............................................................................................... 38
Fig. 4.15 Spindle and it’s different parts.......................................................................... 38
Fig. 4.16 Traveler (c type) ................................................................................................ 39
Fig. 4.17 Traveler in ring .................................................................................................. 39
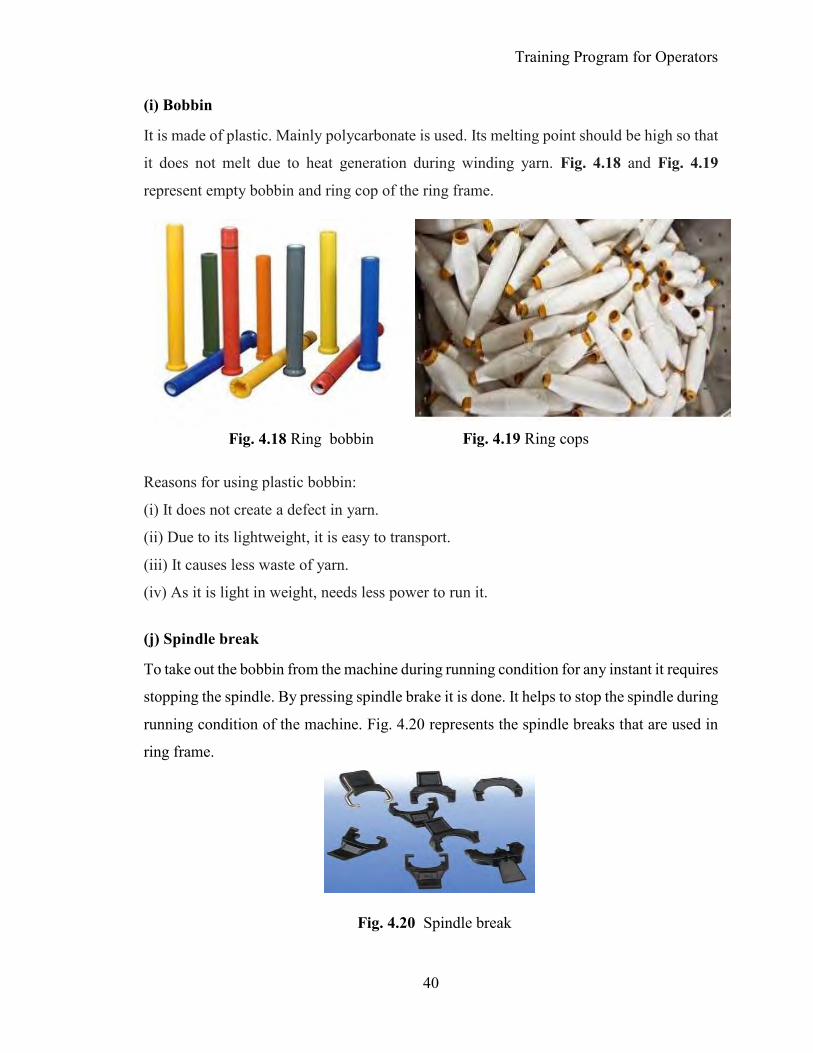
Fig. 4.18 Ring bobbin ...................................................................................................... 40
Fig. 4.19 Ring cops ........................................................................................................... 40
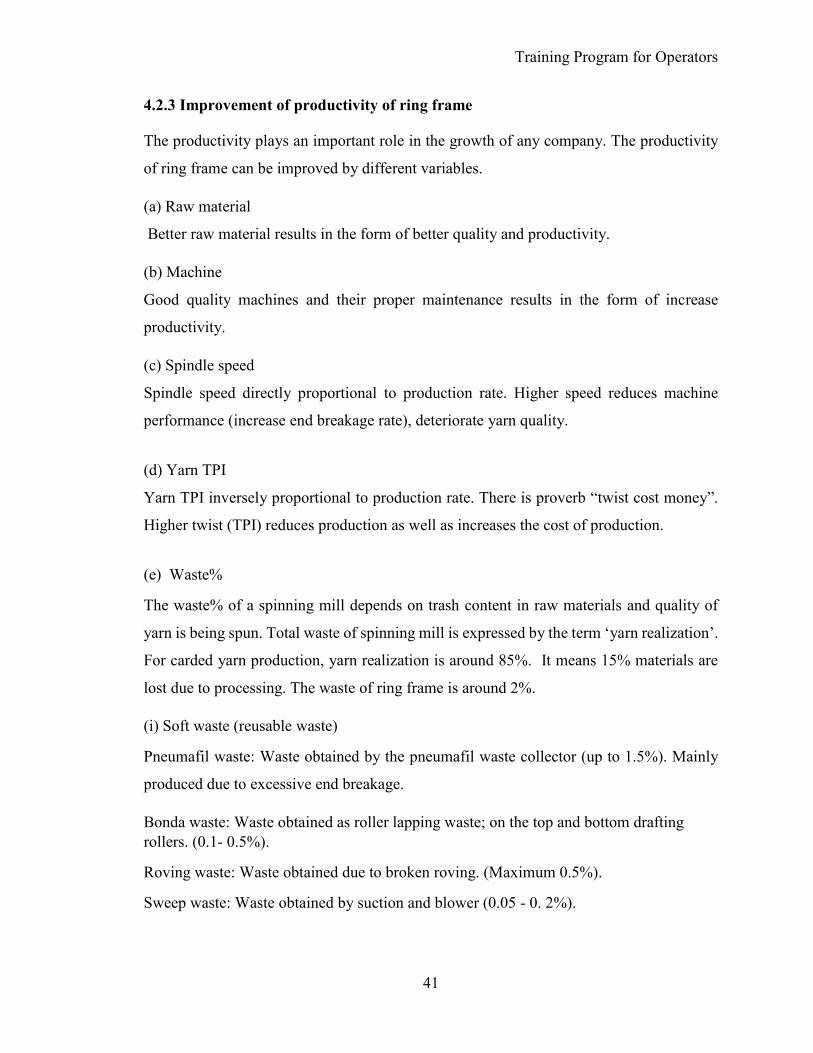
Fig. 4.20 Spindle break…………………………………………………………………..40
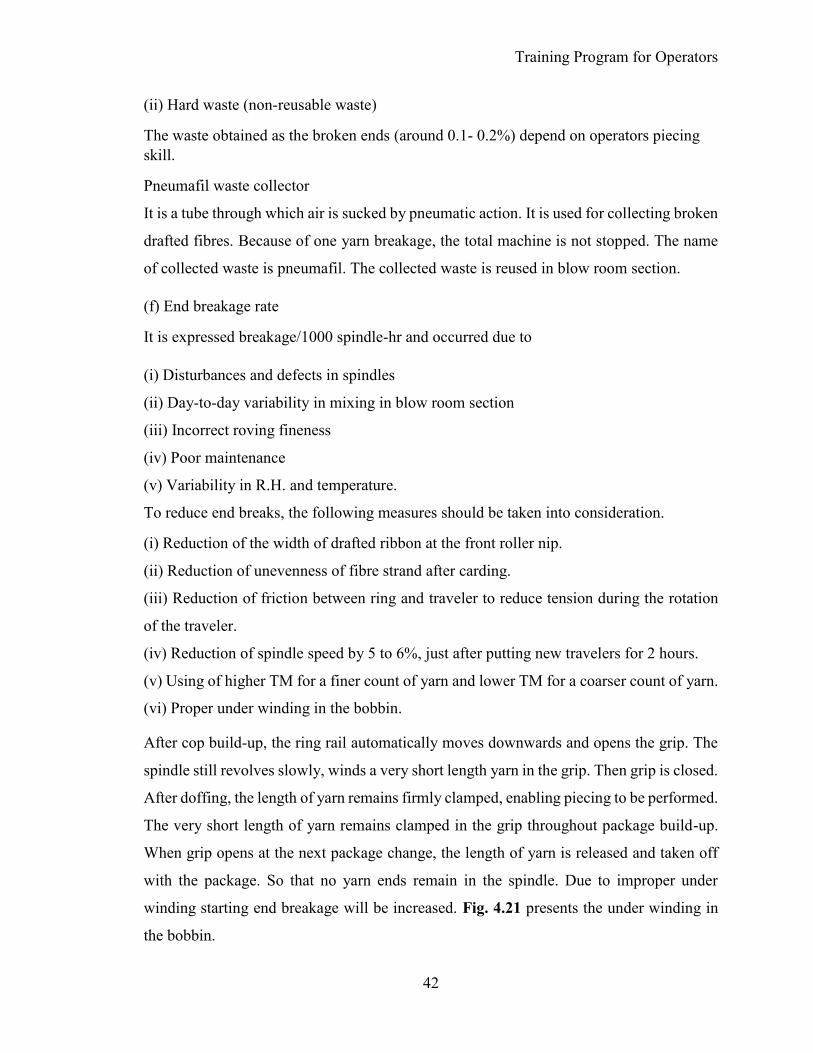
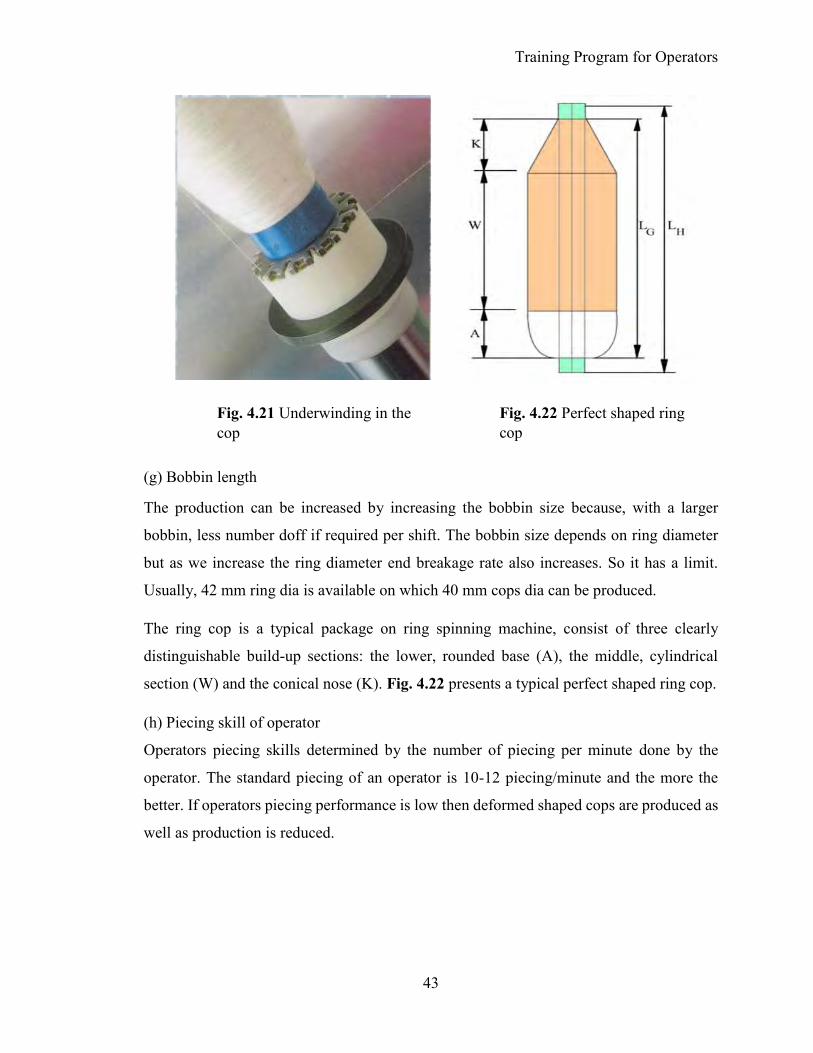
Fig. 4.21 Under winding in the cop .................................................................................. 43
Fig. 4.22 Perfect shaped ring cop ...................................................................................... 43
Fig. 5.1 Study framework of the study ............................................................................. 47
Fig. 5.2 Distribution of stoppage percentage among different discipline ......................... 52
Fig. 5.3 Pareto chart for major losses ............................................................................... 53
Page 15
xiv
Fig. 5.4 Fishbone diagram for idling and minor stoppage……………………………….59
Fig. 5.5 Fishbone diagram for breakdown loss…………………………………………..62
Fig. 5.6 Ring cops in the machine before doffing............................................................. 64
Fig. 5.7 Doffer performs doffing ...................................................................................... 65
Fig. 5.8 Piecing of yarn after breakage ............................................................................. 66
Fig. 5.9 Cleaning of machine parts by operator ................................................................ 67
Fig. 5.10 Defective and ideal shaped ring cops ................................................................ 67
Fig. 5.11 Distribution of stoppage by percentage among different discipline .................. 69
Fig. 5.12 Pareto chart for major losses after reducing stoppage ....................................... 70
Fig. 6.1 Major six losses status ......................................................................................... 75
Fig. 6.2 Day wise OEE in existing condition.................................................................... 75
Fig. 6.3 Day wise OEE after reducing stoppage losses .................................................... 76
Fig. 6.4 Changes of OEE due to reducing stoppage losses ............................................... 77
Fig. 6.5 Changes of output/shift due to reducing stoppage losses .................................... 77
Fig. 6.6 Changes of defective number of ring cops due to reducing stoppage losses ...... 79
Fig. 6.7 Changes of production/shift due to reducing stoppage losses ............................. 79
Page 16
CHAPTER 1: INTRODUCTION
1
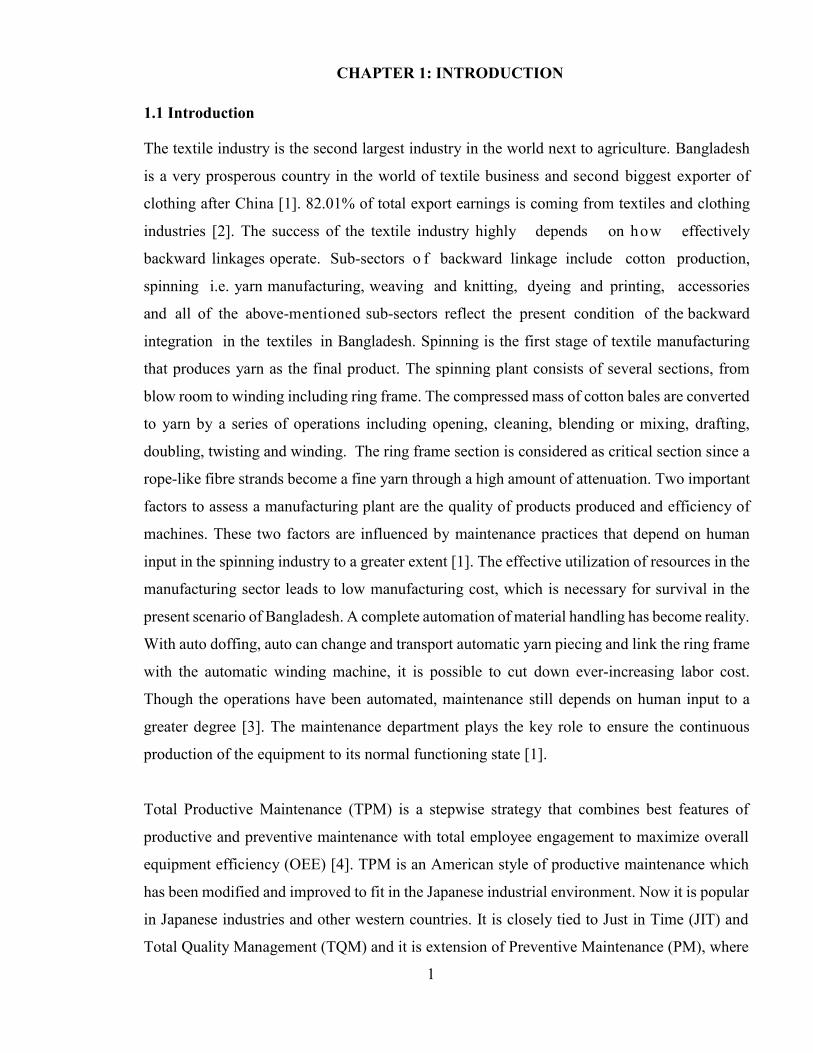
1.1 Introduction
The textile industry is the second largest industry in the world next to agriculture. Bangladesh
is a very prosperous country in the world of textile business and second biggest exporter of
clothing after China [1]. 82.01% of total export earnings is coming from textiles and clothing
industries [2]. The success of the textile industry highly depends on how effectively
backward linkages operate. Sub-sectors o f backward linkage include cotton production,
spinning i.e. yarn manufacturing, weaving and knitting, dyeing and printing, accessories
and all of the above-mentioned sub-sectors reflect the present condition of the backward
integration in the textiles in Bangladesh. Spinning is the first stage of textile manufacturing
that produces yarn as the final product. The spinning plant consists of several sections, from
blow room to winding including ring frame. The compressed mass of cotton bales are converted
to yarn by a series of operations including opening, cleaning, blending or mixing, drafting,
doubling, twisting and winding. The ring frame section is considered as critical section since a
rope-like fibre strands become a fine yarn through a high amount of attenuation. Two important
factors to assess a manufacturing plant are the quality of products produced and efficiency of
machines. These two factors are influenced by maintenance practices that depend on human
input in the spinning industry to a greater extent [1]. The effective utilization of resources in the
manufacturing sector leads to low manufacturing cost, which is necessary for survival in the
present scenario of Bangladesh. A complete automation of material handling has become reality.
With auto doffing, auto can change and transport automatic yarn piecing and link the ring frame
with the automatic winding machine, it is possible to cut down ever-increasing labor cost.
Though the operations have been automated, maintenance still depends on human input to a
greater degree [3]. The maintenance department plays the key role to ensure the continuous
production of the equipment to its normal functioning state [1].
Total Productive Maintenance (TPM) is a stepwise strategy that combines best features of
productive and preventive maintenance with total employee engagement to maximize overall
equipment efficiency (OEE) [4]. TPM is an American style of productive maintenance which
has been modified and improved to fit in the Japanese industrial environment. Now it is popular
in Japanese industries and other western countries. It is closely tied to Just in Time (JIT) and
Total Quality Management (TQM) and it is extension of Preventive Maintenance (PM), where
Page 17
Introduction
2
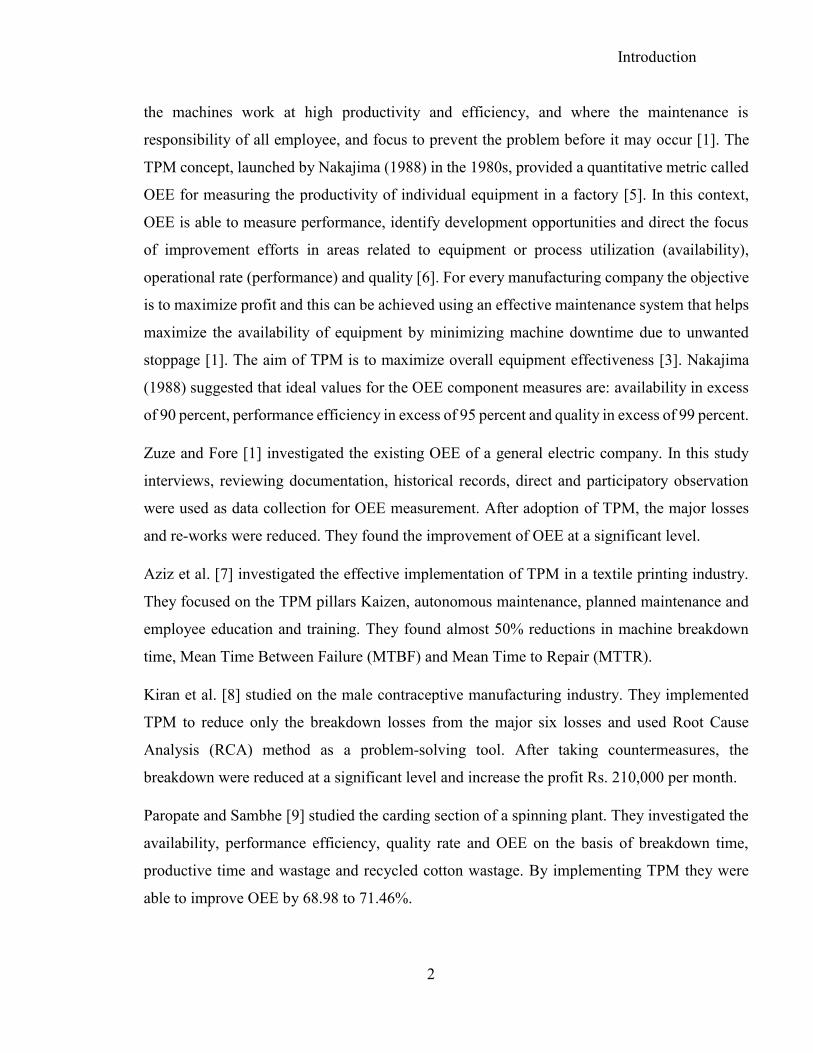
the machines work at high productivity and efficiency, and where the maintenance is
responsibility of all employee, and focus to prevent the problem before it may occur [1]. The
TPM concept, launched by Nakajima (1988) in the 1980s, provided a quantitative metric called
OEE for measuring the productivity of individual equipment in a factory [5]. In this context,
OEE is able to measure performance, identify development opportunities and direct the focus
of improvement efforts in areas related to equipment or process utilization (availability),
operational rate (performance) and quality [6]. For every manufacturing company the objective
is to maximize profit and this can be achieved using an effective maintenance system that helps
maximize the availability of equipment by minimizing machine downtime due to unwanted
stoppage [1]. The aim of TPM is to maximize overall equipment effectiveness [3]. Nakajima
(1988) suggested that ideal values for the OEE component measures are: availability in excess
of 90 percent, performance efficiency in excess of 95 percent and quality in excess of 99 percent.
Zuze and Fore [1] investigated the existing OEE of a general electric company. In this study
interviews, reviewing documentation, historical records, direct and participatory observation
were used as data collection for OEE measurement. After adoption of TPM, the major losses
and re-works were reduced. They found the improvement of OEE at a significant level.
Aziz et al. [7] investigated the effective implementation of TPM in a textile printing industry.
They focused on the TPM pillars Kaizen, autonomous maintenance, planned maintenance and
employee education and training. They found almost 50% reductions in machine breakdown
time, Mean Time Between Failure (MTBF) and Mean Time to Repair (MTTR).
Kiran et al. [8] studied on the male contraceptive manufacturing industry. They implemented
TPM to reduce only the breakdown losses from the major six losses and used Root Cause
Analysis (RCA) method as a problem-solving tool. After taking countermeasures, the
breakdown were reduced at a significant level and increase the profit Rs. 210,000 per month.
Paropate and Sambhe [9] studied the carding section of a spinning plant. They investigated the
availability, performance efficiency, quality rate and OEE on the basis of breakdown time,
productive time and wastage and recycled cotton wastage. By implementing TPM they were
able to improve OEE by 68.98 to 71.46%.
Page 18
Introduction
3
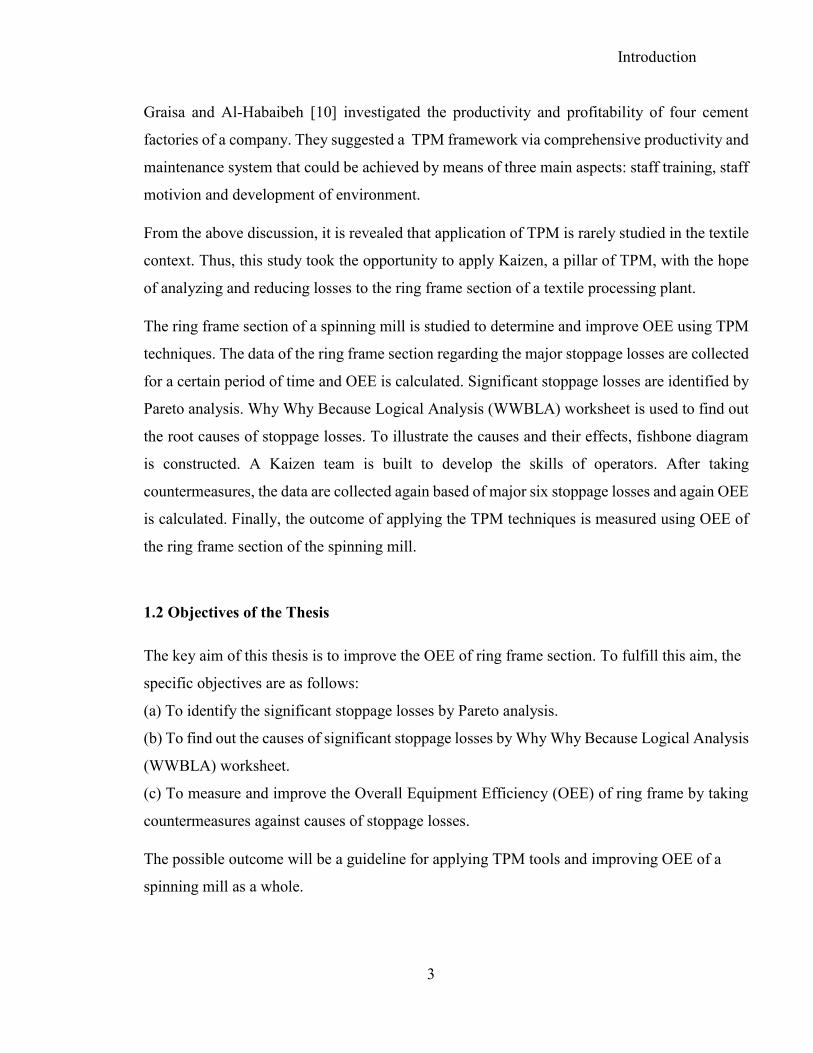
Graisa and Al-Habaibeh [10] investigated the productivity and profitability of four cement
factories of a company. They suggested a TPM framework via comprehensive productivity and
maintenance system that could be achieved by means of three main aspects: staff training, staff
motivion and development of environment.
From the above discussion, it is revealed that application of TPM is rarely studied in the textile
context. Thus, this study took the opportunity to apply Kaizen, a pillar of TPM, with the hope
of analyzing and reducing losses to the ring frame section of a textile processing plant.
The ring frame section of a spinning mill is studied to determine and improve OEE using TPM
techniques. The data of the ring frame section regarding the major stoppage losses are collected
for a certain period of time and OEE is calculated. Significant stoppage losses are identified by
Pareto analysis. Why Why Because Logical Analysis (WWBLA) worksheet is used to find out
the root causes of stoppage losses. To illustrate the causes and their effects, fishbone diagram
is constructed. A Kaizen team is built to develop the skills of operators. After taking
countermeasures, the data are collected again based of major six stoppage losses and again OEE
is calculated. Finally, the outcome of applying the TPM techniques is measured using OEE of
the ring frame section of the spinning mill.
1.2 Objectives of the Thesis
The key aim of this thesis is to improve the OEE of ring frame section. To fulfill this aim, the
specific objectives are as follows:
(a) To identify the significant stoppage losses by Pareto analysis.
(b) To find out the causes of significant stoppage losses by Why Why Because Logical Analysis
(WWBLA) worksheet.
(c) To measure and improve the Overall Equipment Efficiency (OEE) of ring frame by taking
countermeasures against causes of stoppage losses.
The possible outcome will be a guideline for applying TPM tools and improving OEE of a
spinning mill as a whole.
Page 19
Introduction
4
1.3 Organization of the Thesis
The thesis is composed of seven Chapters. The contents of each chapter are briefly described
below:
The current chapter discusses the background of the research and addresses the objectives of
the study. In Chapter 2, a literature summary of TPM tools with respect to the potentiality of
application in spinning industry, calculation of OEE including major six stoppage losses, and
discussion about Pareto analysis, WWBLA worksheet and fishbone diagram.
Chapter 3 discusses the different sections of yarn manufacturing process from blow room to
winding and detailed information of ring frame including some problems of ring frame sections
and role of maintenance department in a spinning mill.
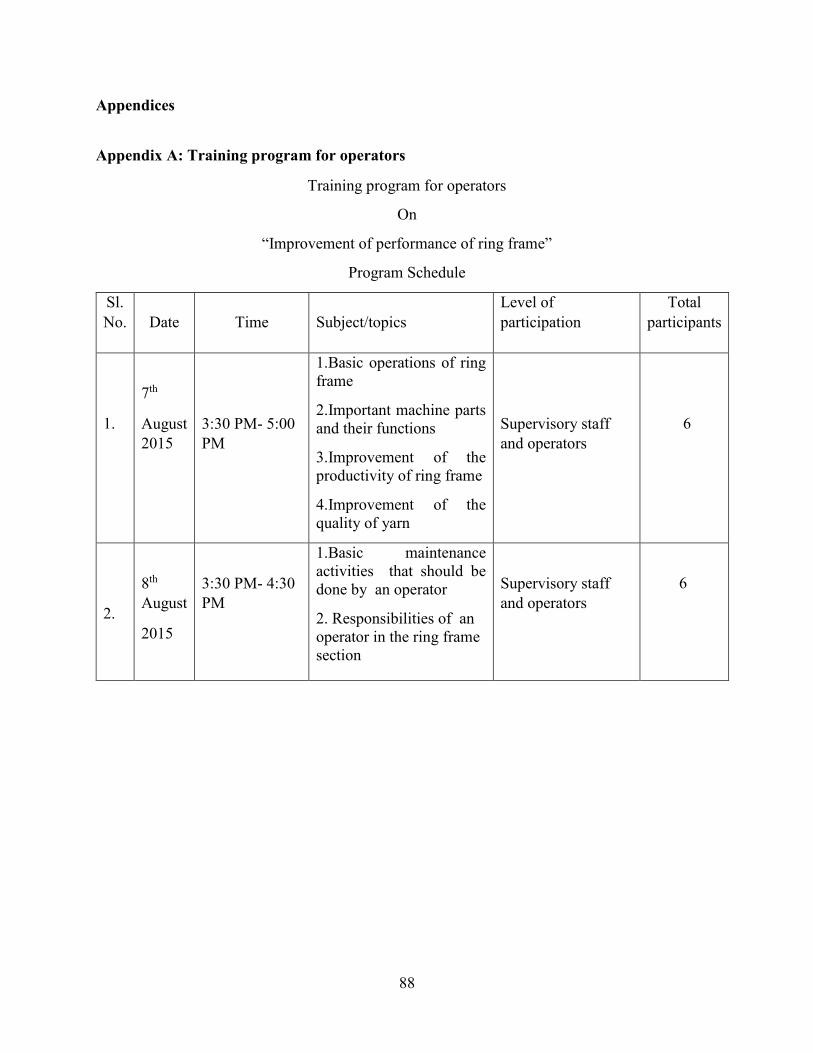
Chapter 4 is reported in detailed information about the training program that is arranged for
operators. The major concentrated areas are basic operations of the ring frame, important
machine parts, and their functions, way to improve the productivity of ring frame section and
quality of yarn, basic maintenance activities that are done by operators and responsibilities of
an operator in the ring frame section.
Chapter 5 is concerned with collection of data from ring frame based on major six stoppage
losses, calculation of OEE, availability, defective product and production of ring frame, analysis
of data by Pareto chart, fishbone diagram to find the causes of stoppage losses and WWBA
analysis worksheet to find out the root causes of stoppage losses. After taking counter action
again data are collected and similar analysis is done.
Chapter 6 is the results and discussion chapter. This chapter compares the significant stoppage
losses, output materials, production and OEE with the previous status. The key finding is also
illustrated in this section.
Finally, in Chapter 7, a summary of the total research work is discussed in the conclusion section
and recommendation is provided. The references used in this thesis paper are listed in
numbering order and appendices are written in the last section of the thesis.
Page 20
CHAPTER 2: LITERATURE REVIEW
5
2.1 Total Productive Maintenance (TPM)
TPM is a scientific and company-wide approach in which every employee at levels in the
organization is concerned about the maintenance, the quality, and efficiency of their
equipment [11]. Communication among operators, maintenance staffs and engineers is
very important [12]. Top management commitment and support are one of the key factors
that promote the morale and motivation of staff [13]. Training programs also enhance the
skills and technical capabilities of the production and maintenance staff [14]. Reduction
of whole life cost of equipment & major six losses and increase of OEE are the objectives
of TPM. It is an innovative approach to maintenance that used to optimize equipment
effectiveness, eliminate breakdowns and enhance autonomous maintenance [15].
Unscheduled maintenance keeps a minimum is the goal of TPM [16]. Total Productive
Maintenance (TPM) is a maintenance program which involves a newly defined concept
for maintaining plants and equipment. The goal of the TPM program is to markedly
increase production while, at the same time, increasing employee morale and job
satisfaction [17].
The TPM program closely resembles the popular Total Quality Management (TQM)
program in several aspects, such as (i) total commitment to the program by upper-level
management is required, (ii) employees must be empowered to initiate corrective action,
and (iii) a long range outlook must be accepted as TPM may take a year or more to
implement and is an on-going process. Changes in employee mindset toward their job
responsibilities must take place as well [18]. Many of the tools such as employee
empowerment, benchmarking, documentation, etc. used in TQM are used to implement
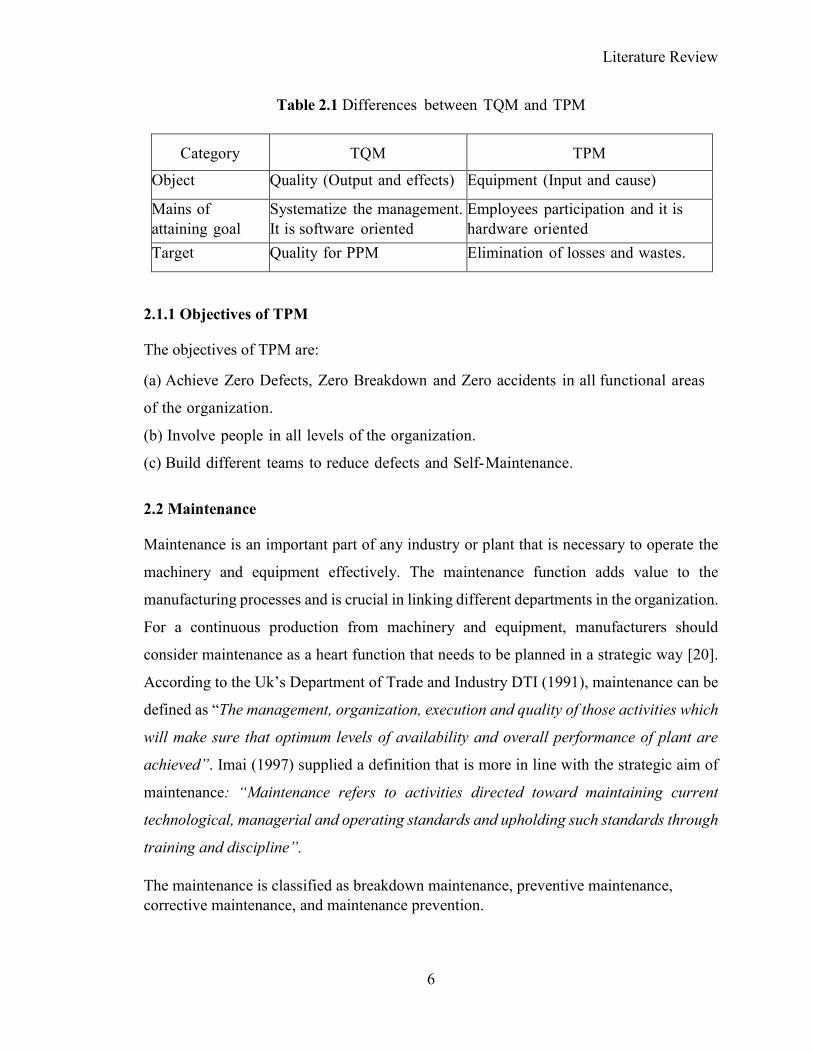
and optimize TPM. Table 2.1 shows the differences between TQM and TPM. TPM is
based on three interrelated concepts [19]:
(a) Maximizing equipment effectiveness;
(b) Autonomous maintenance b y operators; and
(c) Small group activities.
A well-conceived TPM implementation program not only improves the equipment
efficiency and effectiveness but also brings appreciable improvements in other areas
of the manufacturing enterprise.
Page 21
Literature Review
6
Table 2.1 Differences between TQM and TPM
Category
TQM
TPM
Object Quality (Output and effects) Equipment (Input and cause)
Mains of attaining goal
Systematize the management. It is software oriented
Employees participation and it is hardware oriented
Target Quality for PPM Elimination of losses and wastes.
2.1.1 Objectives of TPM
The objectives of TPM are:
(a) Achieve Zero Defects, Zero Breakdown and Zero accidents in all functional areas
of the organization.
(b) Involve people in all levels of the organization.
(c) Build different teams to reduce defects and Self-Maintenance.
2.2 Maintenance
Maintenance is an important part of any industry or plant that is necessary to operate the
machinery and equipment effectively. The maintenance function adds value to the
manufacturing processes and is crucial in linking different departments in the organization.
For a continuous production from machinery and equipment, manufacturers should
consider maintenance as a heart function that needs to be planned in a strategic way [20].
According to the Uk’s Department of Trade and Industry DTI (1991), maintenance can be
defined as “The management, organization, execution and quality of those activities which
will make sure that optimum levels of availability and overall performance of plant are
achieved”. Imai (1997) supplied a definition that is more in line with the strategic aim of
maintenance: “Maintenance refers to activities directed toward maintaining current
technological, managerial and operating standards and upholding such standards through
training and discipline”.
The maintenance is classified as breakdown maintenance, preventive maintenance, corrective maintenance, and maintenance prevention.
Page 22
Literature Review
7
2.2.1. Breakdown maintenance
In this strategy, repair is initiated after an equipment failure. It means that people wait
until equipment fails and repair it. Such a thing could be used when the equipment failure
does not significantly affect the operation or production or generate any significant loss
other than the repair cost.
2.2.2 Preventive maintenance
This concept introduced in 1951 is physical check-up of the equipment to prevent
breakdown [21]. It is a daily maintenance (cleaning, inspection, oiling and re-
tightening), design to retain the healthy condition of equipment and prevent failure
through the prevention of deterioration, periodic inspection or equipment condition
diagnosis, to measure deterioration. It is further divided into periodic maintenance and
predictive maintenance. Just like human life is extended by preventive medicine, the
equipment service life can be prolonged by doing preventive maintenance.
(a) Periodic maintenance (Time based maintenance - TBM)
Time-based maintenance consists of periodically inspecting, servicing and cleaning
equipment and replacing parts to prevent sudden failure and process problems.
(b) Predictive maintenance
This is a method in which the service life of an important part is predicted based on
inspection or diagnosis, in order to use the parts to the limit of their service life.
Compared to periodic maintenance, predictive maintenance is condition based
maintenance. It manages trend values, by measuring and analyzing data about
deterioration and employs a surveillance system, designed to monitor conditions through
an on-line system.
2.2.3 Corrective maintenance
This maintenance strategy introduced in 1957, in which equipment failure can be
eliminated and easily maintained [21]. It improves equipment and its components so that
preventive maintenance can be carried out reliably. Equipment with design weakness
must be redesigned to improve reliability or improving maintainability.
Page 23
Literature Review
8
2.2.4 Maintenance prevention
This is an activity wherein the piece of equipment are designed such that they are
maintenance free and an ultimate in ideal condition . This strategy introduced in
1960 [21]. The weakness of current machines is sufficiently studied (on site information
leading to failure prevention, easier maintenance and prevents of defects, safety, and
ease of manufacturing) and are incorporated before commissioning a new equipment.
2.3 History of TPM
TPM evolved from TQM, which evolved as a direct result of Dr. W. Edwards Deming's
influence on Japanese industry. Dr. Deming began his work in Japan shortly after World
War II. As a statistician, Dr. Deming initially began to show the Japanese how to use
statistical analysis in manufacturing and how to use the resulting data to control quality
during manufacturing. The initial statistical procedures and the resulting quality control
concepts fueled by the Japanese work ethic soon became a way of life for Japanese
industry. This new manufacturing concept eventually becomes known as Total Quality
Management or TQM.
The need to go further than just scheduling maintenance in accordance with manufacturer's
recommendations as a method of improving productivity and product quality was quickly
recognized by those companies who were committed to the TQM programs. To solve this
problem and still adhere to the TQM concepts, modifications were made to the original
TQM concepts. These modifications elevated maintenance to the status of being an integral
part of the overall quality program.
The origin of the term "Total Productive Maintenance" is disputed. Some say that it was
first coined by American manufacturers over forty years ago. Others contribute its origin
to a maintenance program used in the late 1960's by Nippondenso, a Japanese manufacturer
of automotive electrical parts. Seiichi Nakajima, an officer with the Institute of Plant
Maintenance in Japan is credited with defining the concepts of TPM and seeing it
implemented in hundreds of plants in Japan.
Books and articles on TPM by Mr. Nakajima and other Japanese as well as American
authors began appearing in the late 1980's. The first widely attended TPM conference held
Page 24
Literature Review
9
in the United States occurred in 1990. Today, several consulting companies routinely offer
TPM conferences as well as provide consulting and coordination services for companies
wishing to start a TPM program in their plants [18].
2.4 Steps in introduction of TPM in an organization
(a) Preparatory stage
Step 1 - Announcement by management to all about TPM introduction in the organization
Step 2 - Initial education and propaganda for TPM
Step 3 - Setting up TPM and departmental committees
Step 4 - Establishing the TPM working system and target
Step 5 - A master plan for institutionalizing
(b) Introduction stage
(c) Implementation stage
(d) Institutionalizing stage.
2.5 Barriers to implementing TPM in spinning industry
Though Total Productive Maintenance is successfully implemented in more professionally
managed engineering industries, the benefit of this concept is yet to be exploited in most
of the spinning industry there are some obvious barriers in this regard:
2.5.1 Unskilled labor
Most of the cases the workers in the spinning industry are unskilled. They may be efficient
in piecing, material handling, bobbin changing, but the majority of cases they lack requisite
aptitude and attitude to learning about the details of the working of the machines.
2.5.2 Inadequate training facilities
Most of the spinning mills do not have full-fledged human resource development
department. The role of training is not well appreciated in the textile industry. Though
training program is conducted for middle and upper-level management, there is hardly any
such program for the operators. Training conducted for the operators is inadequate and at
best sporadic in nature.
Page 25
Literature Review
10
2.5.3 Lack of commitment
Total Productive Maintenance starts with the commitment of the management. However,
barring a few cases the management in textile industry lack commitment to the extent
necessary. In some cases, management is committed but the lack of vision in this regard.
In such cases, TPM activities are initiated with a lot of fanfare but TPM movement often
dies away after the initial burst of enthusiasm.
2.5.4 Heterogeneous stock of inventory
Most of the spinning mills (especially those, which are older than decades) have machines
of different makes and models. They need to manage heterogeneous inventory.
Development of TPM program in these cases is really difficult if not impossible
2.5.5 Lack of coordination between production and maintenance departments
The spinning industry is a low profitable industry (though the situation has improved very
recently) as raw material alone contributes towards 50 - 55% of total production cost. They
more concentrate on productivity and opt for quick fix solution (correction) rather than to
implement long-term corrective action. Very often this leads to a dispute between
production and maintenance departments.
2.6 Pillars of TPM
The basic practices of TPM are often called the pillars or elements of TPM. The
entire edifice of TPM is built and s t a n d s , on eight pil lars [22]. The d e t a i l ed
maintenance and organizational improvement initiatives and activities associated
with the respective TPM pillars are as follows:
2.6.1 Pillar I - 5S
5S is a systematic process of housekeeping to achieve a serene environment i n the
workplace involving the employees with a commitment to sincerely implement and
practice housekeeping. Problems cannot be clearly seen when the workplace is
unorganized. Cleaning and organizing the w o r k p l ace helps the team to uncover
problems [22]. Table 2.2 shows the key activities for effective 5S implementation at the
workplace.
Page 26
Literature Review
11
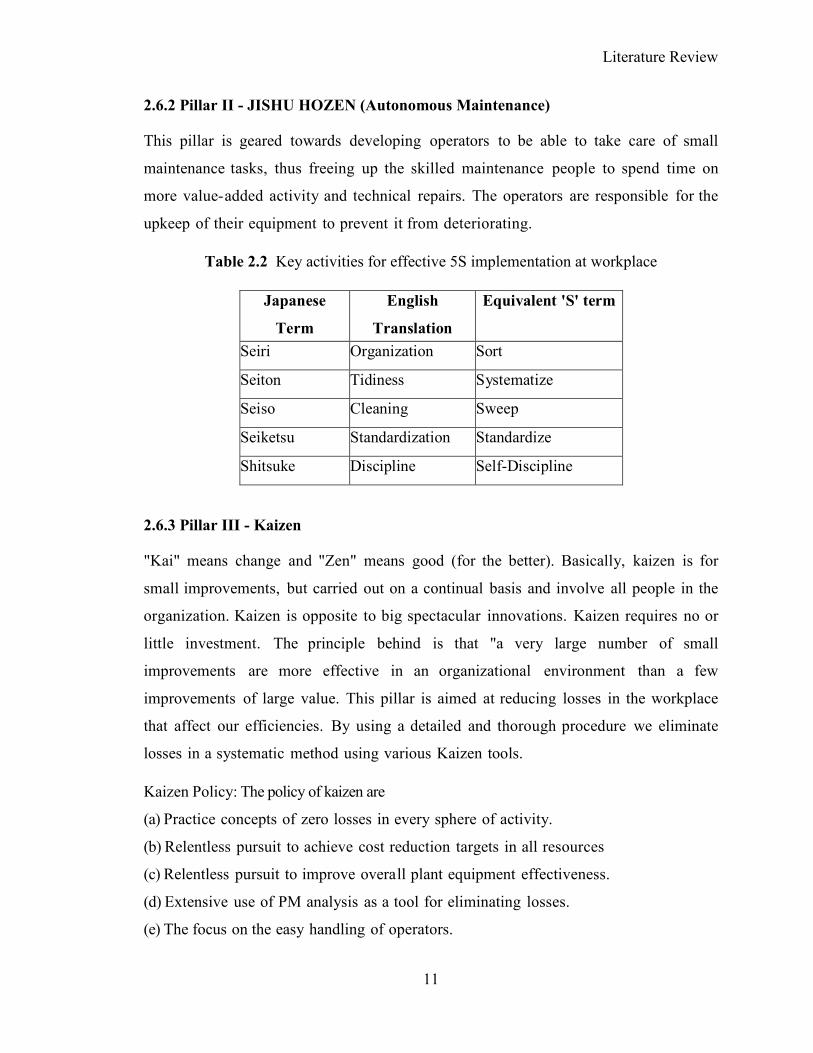
2.6.2 Pillar II - JISHU HOZEN (Autonomous Maintenance)
This pillar is geared towards developing operators to be able to take care of small
maintenance tasks, thus freeing up the skilled maintenance people to spend time on
more value-added activity and technical repairs. The operators are responsible for the
upkeep of their equipment to prevent it from deteriorating.
Table 2.2 Key activities for effective 5S implementation at workplace
Japanese
Term
English
Translation
Equivalent 'S' term
Seiri Organization Sort
Seiton Tidiness Systematize
Seiso Cleaning Sweep
Seiketsu Standardization Standardize
Shitsuke Discipline Self-Discipline
2.6.3 Pillar III - Kaizen
"Kai" means change and "Zen" means good (for the better). Basically, kaizen is for
small improvements, but carried out on a continual basis and involve all people in the
organization. Kaizen is opposite to big spectacular innovations. Kaizen requires no or
little investment. The principle behind is that "a very large number of small
improvements are more effective in an organizational environment than a few
improvements of large value. This pillar is aimed at reducing losses in the workplace
that affect our efficiencies. By using a detailed and thorough procedure we eliminate
losses in a systematic method using various Kaizen tools.
Kaizen Policy: The policy of kaizen are
(a) Practice concepts of zero losses in every sphere of activity.
(b) Relentless pursuit to achieve cost reduction targets in all resources
(c) Relentless pursuit to improve overall plant equipment effectiveness.
(d) Extensive use of PM analysis as a tool for eliminating losses.
(e) The focus on the easy handling of operators.
Page 27
Literature Review
12
Kaizen Target:
Kaizen program targets to achieve and sustain zero loss with respect to minor stops,
measurement and adjustments, defects and unavoidable downtimes. It also aims to
achieve 30% manufacturing cost reduction.
Tools used in Kaizen:
(a) Why Why Because Logical Analysis (WWBLA) worksheet
(b) Poka-Yoke (it is Japanese term, which English means ‘mistake proofing’ or ‘error
prevention’)
(c) PM analysis
(d) Summary of losses
(e) Kaizen register
(f) Kaizen summary sheet.
As one of the pillars of TPM activities, Kaizen pursues efficient equipment, operator
and material and energy utilization that is extremes of productivity and aims at achieving
substantial effects. Kaizen activities try to thoroughly eliminate 6 major losses.
2.6.4 Pillar IV - Planned Maintenance
It is aimed t o have a t rouble free machines and equipment producing defect
free products for total customer satisfaction. This breaks maintenance down
into four groups, e.g. preventive maintenance, breakdown maintenance,
corrective maintenance, and maintenance prevention [22]. With Planned
Maintenance, we evolve our efforts from a reactive to a proactive method and use
trained maintenance staff to help train the operators to better maintain their equipment.
2.6.5 Pillar V - Quality Maintenance
It is aimed towards eliminating non-conformances in a systematic manner. Quality
maintenance aims towards achieving zero defects, tracking and addressing equipment
problems and root causes as well as setting 3M (man/machine/material) conditions [23]. It
is also aimed towards customer delight through highest quality through defect free
manufacturing. The focus is on eliminating non-conformances in a systematic manner,
much like a focused improvement. We gain an understanding of what parts of the
equipment affect product quality and begin to eliminate current quality concerns, and
Page 28
Literature Review
13
then move to potential quality concerns. The transition is from reactive to proactive
(Quality Control to Quality Assurance).
2.6.6 Pillar VI - Training
It is aimed to have multi -skilled revitalized employees whose morale is high and who
has eager to come to work and perform all required functions effectively and
independently. Education is given to operators to upgrade their skill. It is not sufficient
to know only "Know-How" by they should also learn "Know -why". By experience, they
gain, "Know-How" to overcome a problem what to be done. This they do without
knowing the root cause of the problem and why they are doing so. Hence it becomes
necessary to train them on knowing "Know -why". The employees should be trained to
achieve the four phases of skill. The goal is to create a factory full of experts. The
different phase of skills are
Phase 1: Do not know.
Phase 2: Know the theory but cannot do.
Phase 3: Can do but cannot teach.
Phase 4: Can do and also teach.
2.6.7 Pillar VII - Office TPM
Office TPM should be started after activating four other pillars of TPM (JH, KK, QM,
and PM). Office TPM must be followed to improve productivity, efficiency in the
administrative functions and identify and eliminate losses. This includes analyzing
processes and procedures towards increased office automation.
2.6.8 Pillar VIII - Safety, Health, and Environment
The way maintenance is performed will influence the availability of plant as well as the
safety of its operation. These, in turn, will determine the profitability of the enterprise.
This pillar focus to ensure safe working environment; provide appropriate work
environment; eliminate incidents of injuries and accidents and provide standard
operating procedures [10] [23]. The pilot machine, on which A, P, Q factors are minimum.
To create awareness among employees various competitions like safety slogans, Quiz,
Drama, Posters, etc. related to safety can be organized at regular intervals.
Page 29
Literature Review
14
2.7 Overall Equipment Efficiency (OEE)
TPM philosophy requires the development of a preventative maintenance program for the
life-cycle of the equipment and the involvement of operators in maintaining the equipment
in order to maximize its overall efficiency and effectiveness [24].
OEE is used to determine how efficiently a machine is running. OEE highlights the
actually hidden capacity in an organization. It measures both ‘doing thing right’ and ‘doing
the right things’. The effective operation of individual pieces of production equipment,
assembly lines or whole factory is dependent on the three factors of OEE [25]. OEE is
o n e o f the most effective measures for driving plant improvement. It continuously
focuses the plant on the concept of zero breakdowns and zero waste [26]. Unless careful
monitoring occurs, the reduced capacity goes unnoticed or is accepted as normal. OEE can
be considered to combine the operation, maintenance, and management of manufacturing
equipment and resources [27]. The losses are divided into six major categories.
(a) Downtime Losses
It found if the output is zero and the system produces nothing, where the unused segments
of time, during the examined period, are downtime losses, and mainly it can be one of two:
(i) Breakdown loss: This loss is due to parts failure where they cannot work anymore and
they need either repair or replace. These losses are measured by how long it takes from
labor or parts for fixing the problem.
(ii) Setup and adjustment time: These losses are due to the changes in the operating
conditions, like the start of the production or the start of the different shifts, changes in
products and condition of the operation. The main examples of this kind of losses are
equipment’s changeovers, exchange of dies, jigs, and tools. These losses consist of setup,
start-up, and adjustment down times.
(b) Speed Losses
When the output is smaller than the output at references speed these are called speed losses.
When considering speed losses, one does not check if the output conforms to quality
specifications. This can be found in two forms:
Page 30
Literature Review
15
(i) Minor stoppage losses: these losses are due to the reason of machine halting, jamming,
and idling. Many companies are considering these minor stoppages as the breakdowns in
order to give importance to this problem.
(ii) Speed losses: these losses are due to the reduction in the speed of the equipment. In
other words, the machine is not working at the original or theoretical speed. If the quality
defect and minor stoppages occur regularly then the machine is run at low speed to cover
the problems. It is measured by comparing the theoretical to actual working load.
(c) Defective or quality losses
The produced output either does or does not conform to quality specifications. If it does
not comply, this is considered a quality loss.
(i) Rework and quality defects: these losses are due to the defective products during the
routine production. These products are not according to the specifications. So that rework
is done to remove the defects or make a scrap of these products. Labor is required to make
a rework which is the cost for the company and material become a scrap is also another
loss for the company. The amount of these losses is calculated by the ratio of the quality
products to the total production.
(ii) Yield losses: these losses are due to waste raw materials. The yield losses are split into
two groups. The first one is the raw materials losses which are due to the product design,
manufacturing method etc. The group is the adjustment losses due to the quality defects of
the products which are produced at the start of the production process, changeovers etc.
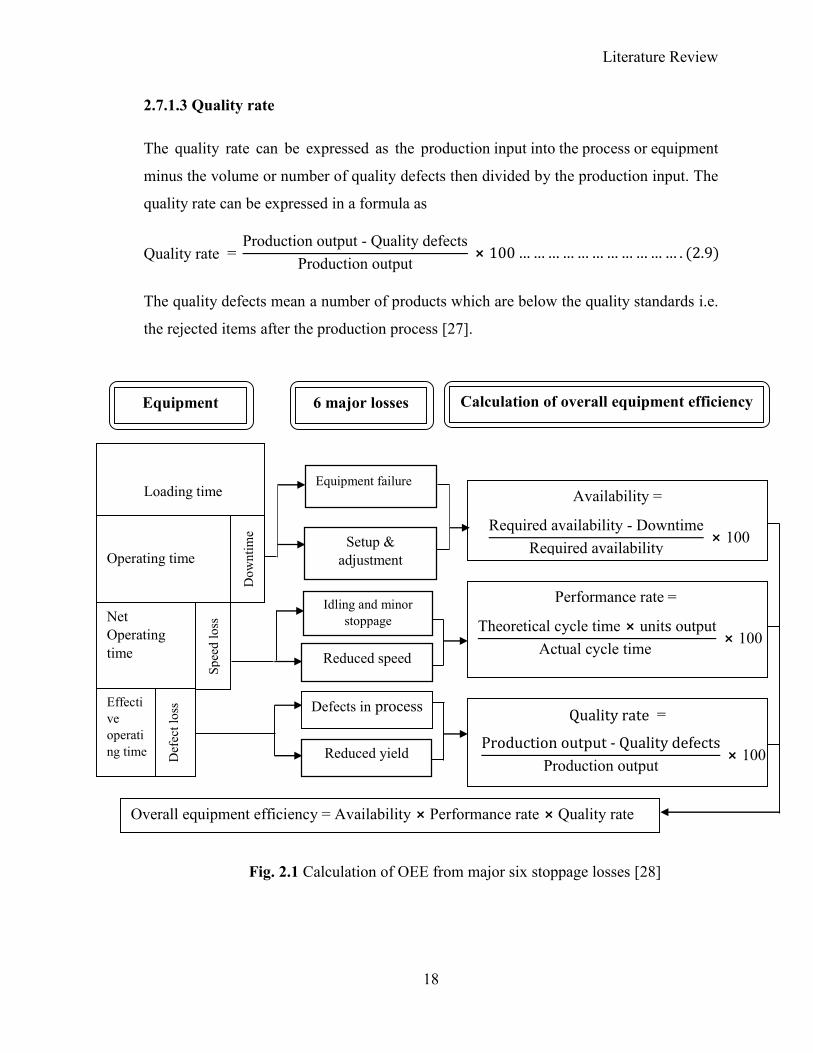
2.7.1 Calculation of OEE
The OEE calculation is quite general and can be applied any manufacturing organization
[30]. OEE is equal to the multiplication of the three factors of six major losses. Fig. 2.1
represents the calculation of OEE from major six stoppage losses.
(a) Availability indicates the problem which caused by downtime losses.
(b) Performance indicates the losses caused by speed losses and
(c) Quality indicates the scrap and rework losses.
Page 31
Literature Review
16
2.7.1.1 Availability
The availability is a comparison between the amount of time the machine is actually
producing and the amount of time it was scheduled to produce. This can be written in the
form of formula as
Availability = Required availability - Downtime
Required availability ⨯ 100……………………………...(2.1)
= Actual operating time
Planned operating time ⨯ 100
So, Actual operating time = Required availability - downtime
Actual operating time = Planned operating time - Unplanned downtime
The downtime can be defined as the actual time for which the equipment is down for
repairs or changeovers. This time is also sometimes known as the breakdown time. The
output of this formula gives the true availability of the equipment.
2.7.1.2 Performance rate
The performance rate can be defined as the ideal or design cycle time to produce the item
multiplied by the output of the equipment and then divided by actual cycle time. This will
give the performance rate of the equipment. The formula to calculate the performance rate
can be expressed as
Performance rate = Total number produced
Expected production ⨯ 100 …………………………………...(2.2)
Total number produced = Units produced in the total shift time
Expected production = Number of expected units to be produced
It can be calculated as follows:
Expected production = Actual operating timeTheoretical cycle time
…………………………………….…(2.3)
So,
Page 32
Literature Review
17
Performance rate = Theoretical cycle time ⨯ units output
Actual cycle time ⨯ 100 …………………... (2.4)
The theoretical cycle time or the production output will be in the unit of production, like
parts per hour and the output will be the total output in the given time period interval.
The operating time will be the availability value of the availability formula. The result of
this formula will be in the percentage of the performance of the equipment.
Calculation of cycle time:
Number spindle per frame : 1008 (for long frame, Jingwei)
Doffing time for 26’s Ne carded yarn : 110 minutes
So, Ideal cycle time = Ideal doffing time
Number of spindles… … … … … … … … … … … … … … … … … … (2.5)
= 110 minutes
1008 (no. of spindle)= 0.109 minutes
Actual cycle time = Actual doffing time
Number of running spindle… … … … … … … … … … … … … … … . . (2.6)
Actual doffing time = Ideal doffing time + Stoppage time lossesNumber of doffing
… … … … … … … . . (2.7)
Number of running spindle = Total number of spindle - Number of idle spindles ….(2.8)
Page 33
Literature Review
18
2.7.1.3 Quality rate
The quality rate can be expressed as the production input into the process or equipment
minus the volume or number of quality defects then divided by the production input. The
quality rate can be expressed in a formula as
Quality rate = Production output - Quality defects
Production output ⨯ 100 … … … … … … … … … … … . (2.9)
The quality defects mean a number of products which are below the quality standards i.e.
the rejected items after the production process [27].
Fig. 2.1 Calculation of OEE from major six stoppage losses [28]
Equipment 6 major losses Calculation of overall equipment efficiency
Net Operating time
Spee
d lo
ss
Loading time
Operating time
Dow
ntim
e lo
ss
Effective operating time D
efec
t los
s
Availability =
Required availability - Downtime
Required availability ⨯ 100
Performance rate =
Theoretical cycle time ⨯ units outputActual cycle time
⨯ 100
Defects in process Quality rate =
Production output - Quality defects
Production output ⨯ 100
Overall equipment efficiency = Availability ⨯ Performance rate ⨯ Quality rate
Reduced speed
Reduced yield
Idling and minor stoppage
Equipment failure
Setup & adjustment
Page 34
Literature Review
19
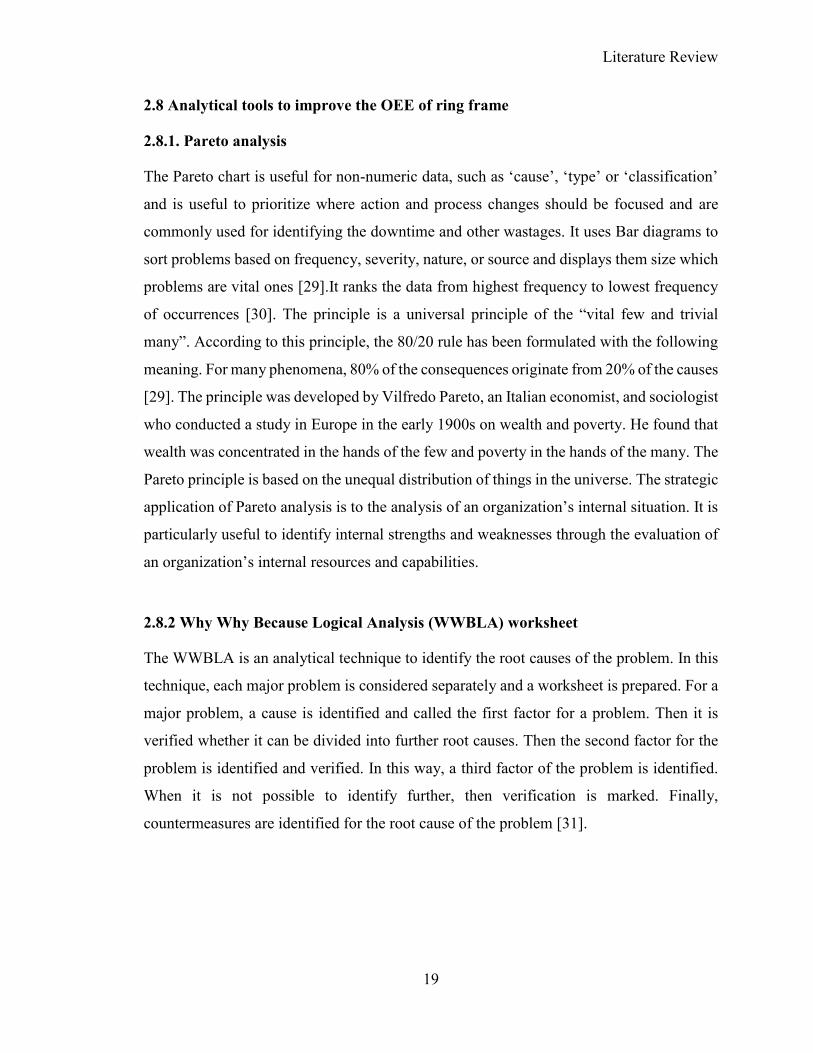
2.8 Analytical tools to improve the OEE of ring frame
2.8.1. Pareto analysis
The Pareto chart is useful for non-numeric data, such as ‘cause’, ‘type’ or ‘classification’
and is useful to prioritize where action and process changes should be focused and are
commonly used for identifying the downtime and other wastages. It uses Bar diagrams to
sort problems based on frequency, severity, nature, or source and displays them size which
problems are vital ones [29].It ranks the data from highest frequency to lowest frequency
of occurrences [30]. The principle is a universal principle of the “vital few and trivial
many”. According to this principle, the 80/20 rule has been formulated with the following
meaning. For many phenomena, 80% of the consequences originate from 20% of the causes
[29]. The principle was developed by Vilfredo Pareto, an Italian economist, and sociologist
who conducted a study in Europe in the early 1900s on wealth and poverty. He found that
wealth was concentrated in the hands of the few and poverty in the hands of the many. The
Pareto principle is based on the unequal distribution of things in the universe. The strategic
application of Pareto analysis is to the analysis of an organization’s internal situation. It is
particularly useful to identify internal strengths and weaknesses through the evaluation of
an organization’s internal resources and capabilities.
2.8.2 Why Why Because Logical Analysis (WWBLA) worksheet
The WWBLA is an analytical technique to identify the root causes of the problem. In this
technique, each major problem is considered separately and a worksheet is prepared. For a
major problem, a cause is identified and called the first factor for a problem. Then it is
verified whether it can be divided into further root causes. Then the second factor for the
problem is identified and verified. In this way, a third factor of the problem is identified.
When it is not possible to identify further, then verification is marked. Finally,
countermeasures are identified for the root cause of the problem [31].
Page 35
Literature Review
20
2.8.3 Fishbone diagram
Cause-and-effect diagrams are causal diagrams introduced by Ishikawa in 1968. Cause-
and-effect diagrams show the causes of a specific event. A cause-and-effect diagram often
called a “fishbone” diagram can help in brainstorming to identify possible causes of a
problem and in sorting ideas into useful categories. It is a visual way to look at cause and
effect. It is more structured approach than some other tools available for brainstorming
causes of a problem. The problem or effect is displayed at the head or mouth of the fish.
Possible contributing causes are listed on the smaller “bones” under various cause
categories. A fishbone diagram can be helpful in determining to identify possible causes
for a problem but it cannot identify root causes.
It is used to associate multiple possible causes with a single effect. In a cause-effect
diagram, causes are frequently arranged in six major categories for manufacturing plant.
They are Manpower, machinery, materials, measures, management, and the environment.
Ishikawa advocated the cause-effect diagram as a tool for breaking down potential causes
into more detailed categories so that can be organized and related to factors that help in
identifying the root causes [32].
Page 36
CHAPTER 3: OVERVIEW OF SPINNING PROCESS
21
3.1 Spinning
Spinning is the system by which the filaments or fibres are converted to the yarn by
twisting. In the spun yarn technology there are two types of spinning named short staple
and long staple spinning. In the short staple spinning, carded and combed yarns are
produced by ring spinning frame from roving or drawn sliver. Besides these slub yarn, core
spun yarn, siro-spun, multi-twisted, multi-count yarns also be produced.
The conventional ring spinning technique is currently the most widely used, accounting for
an estimated 85% of the world market for spinning machines. The remaining systems are
often referred to as unconventional spinning processes and, of these, rotor spinning has the
largest market share [36]. Important aspects of any spinning system are the fibre types
that can be spun, the count range, the economics of the process, and very importantly
the suitability of the resulting yarn structure to a wide range of end uses. Because of
processing difficulties and/or economic factors, the commercial spun off 100% cotton yarns
is mainly performed in ring and rotor spinning. With regard to process economics, the
number of stages required to prepare the raw material for spinning, the production speed,
the package size, and the degree of automation is key factors in determining the cost per
kilogram of yarn, i.e., the unit cost.
Page 37
Overview of Spinning Process
22
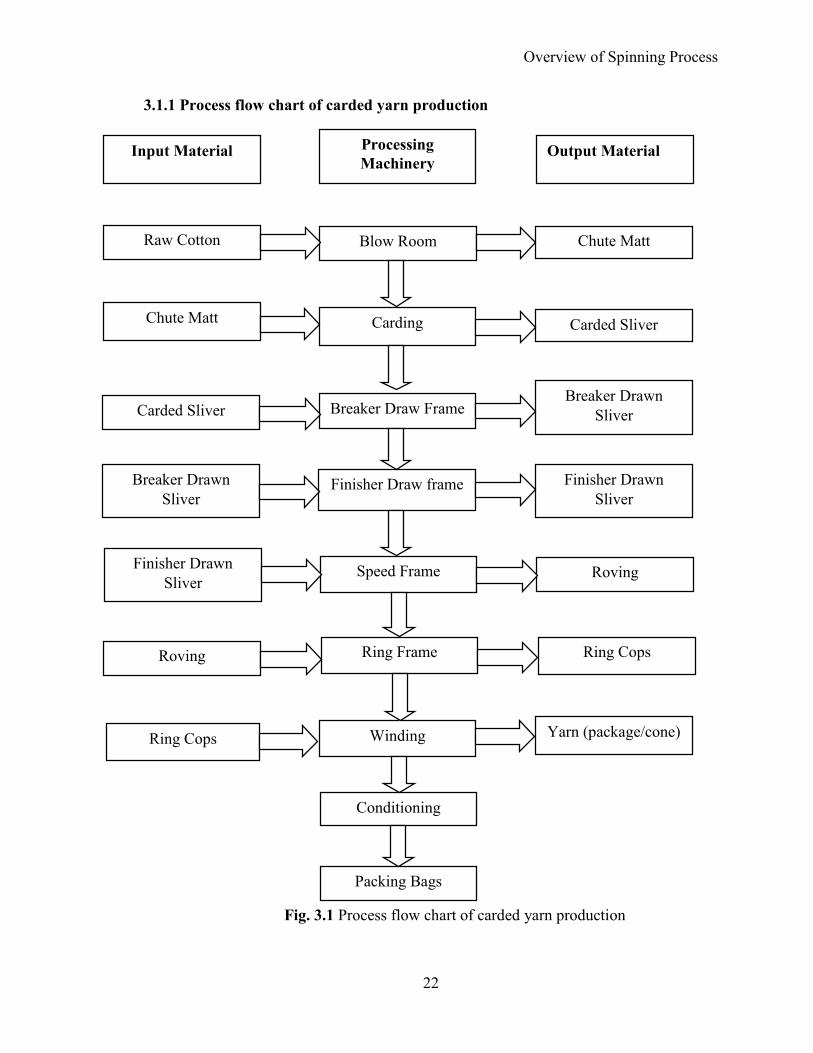
3.1.1 Process flow chart of carded yarn production
Card
Fig. 3.1 Process flow chart of carded yarn production
Input Material Processing Machinery
Output Material
Raw Cotton Blow Room
Carde
Chute Matt
Chute Matt Carded Sliver
Ring Cops
Carded Sliver
Speed Frame
Finisher Draw frame
Breaker Draw Frame
Carding
Ring Cops
Roving
Finisher Drawn Sliver
Breaker Drawn Sliver
Roving
Finisher Drawn Sliver
Breaker Drawn Sliver
Yarn (package/cone) Winding
Ring Frame
Conditioning
Packing Bags
Page 38
Overview of Spinning Process
23
3.2 A brief introduction of yarn manufacturing process
3.2.1 Blow Room
Blow room is the initial stage in the spinning process. The name blow room is given
because of the “airflow”. And all process is done in blow room because of air flow. In
blow room, the tuft size of cotton becomes smaller and smaller. Mixing of cotton is done
separately as well as in blow room. A compressed layer of the bale is also open in blow
room with the help of machine [34].
A section in which the supplied compressed bales are opened, cleaned and blended or
mixed to form uniform lap of a specific length is called blow room section. Blow room
consists of a number of machines used in succession to open and clean the cotton fibre to
the required degree [35]. Depending upon the requirement values of cleaning intensity and
the relative amount of waste to be extracted are selected and entered directly into the
machine through control panel even in running condition. This reduces downtime. This
device is particularly suitable when lot change is frequent.
3.2.2 Carding
Carding process is very important in a spinning mill. It helps us both way to open the
tuft into a single fiber and to remove the impurities and neps. Textile experts are convinced
for the accuracy of the following statement. “The card is the heart of spinning mill” and
“well carded is well spun” [36].
Card feeding is done by two ways. One is manually and other is through chute feed system.
In manual case, the lap which is produced in blow room and it is feed to the card. In chute
feed, the material is fed through air flow system to card machine. It is important to say
that lower the feed variation better is the carding quality. Lower the feed variation then
draft variation will also be less. Then yarn quality will be consistent. If the card is having
auto leveler then nominal draft should be selected properly. In some circumstances, the
card also acts as a cleaner and remove a certain amount of short fibre. Approximately 90%
cleaning efficiency is achieved with the help of carding machine.
Page 39
Overview of Spinning Process
24
3.2.3 Draw Frame
Draw frame is a simple and cheap machine and plays a vital role in spinning. If
it’s setting is not done properly then it affects yarn strength and elongation. For improving
quality, draw frame is the final process in the spinning mill. It effects on quality especially
on evenness of sliver. In the spinning process, there are chances of elimination of errors
in draw frame machine. Draw frame plays a very important role for the quality of yarn.
Without it, participation quality can never be improved [37]. Drafting arrangement is the
heart of the draw frame. Drafting arrangement should be simple, the stable design should
have the ability to produce a high-quality product. It should have high fiber control. Auto
leveler is also used to adjust and to improve the linear density of the sliver. Without auto
leveler, it is very difficult to improve the quality of the drawn sliver.
3.2.4 Speed Frame
It is an intermediate process in which fibres are converted into low twist called roving.
The sliver which is taken from draw frame is thicker so it is not suitable for manufacturing
of yarn. Its purpose is to prepare input package for next process. This package is to
prepare a small compact package called bobbins. The roving machine is complicated,
liable to a fault, causes defect adds to the production costs and deliver the product. In this
winding operation that makes us roving frame complex. There are two main basic
reasons for using the roving frame.
The sliver is thick and untwisted. So the draft is needed to reduce the linear density of
sliver. The ring drafting arrangement is not capable of impar t ing a h igh amount
of dra f t to make yarn. Draw frame can represent the worst conceivable mode of transport
and presentation of feed material to the ring spinning frame.
All-important process parameters are entered directly to the panel through the touch screen.
The panel can store up to 20 different settings. This ensures consistent quality and
simplifies technician's job especially when lot changing is more frequent. A simple
operation through consistent, clear and self-explaining user-friendly menu structures,
which consists of pictures and symbols. The troublesome differential gear system has been
replaced by the multi-motor driving system. The Spindles and flyer are driven directly by
Page 40
Overview of Spinning Process
25
an individual servo motor. The control system ensures synchronized running throughout
build up. The improved driving system reduces energy consumption and frequency of
maintenance activities and at the same time enhances speed limit to 1,500 rpm.
3.2.5 Ring Frame
Ring spinning machine is used in textile industry to insert twist the staple fibres into a
yarn and the wind on a bobbin for storage and also an input for the winding section for
more precise the yarn to minimize the defects of end yarn. Ring machine is very important
due to yarn quality. Ring Spinning is the most costly step to convert fibres into yarn and
approximately 85% yarn produced in ring spinning frame all over the world. It is made to
draft the roving into the desired count and impart the desired twist to produce the strength
in the yarn. If the twist is increased, yarn strength is also increased at the optimum limit.
A ring-spinning machine is an uncomplicated, flexible, low-cost device that is well
established with a wide range of applications. For the present purpose, we may define
‘short staple’ as covering the range of fibre l e n g t h s up to, say, 2 inches (≈ 50 mm).
Short-staple spinning machines may process a variety of fibres, the most important of
which are cotton, polyester, and blends thereof. Roving is an intermediate product made
from sliver and it is normally used as a precursor for yarn. A problem that requires attention
is end-breakage in spinning, roughly half of which arise from faulty roving preparation.
This is mentioned to underline the need to consider the whole production line;
concentrating on individual machines is not sufficient [38]. Fig. 3 .2 represents the
r ing frame machine . The ring and traveler spinning method is a process that utilizes
roller drafting for fibre mass attenuation and the motion of a guide, called a traveler, freely
circulating around a ring to insert twist and simultaneously wind the formed yarn onto a
bobbin [42]. The ring frame consists of a large number of spindles. One traveler and spindle
co-operate with a bobbin, to twist and wind the yarn from a drafting system. There are
now some very long frames of about 1000 spindles/machine, and articulation is necessary
to prevent trouble from changes in floor height that might distort the whole frame and
cause bearing problems. The spindles are driven by one or more tapes (thin flat belts),
which engage the whorls (pulleys) that project from the bottom of the spindle. The ring
frame is normally fed with roving from a large bobbin and delivers yarn to a smaller one.
Page 41
Overview of Spinning Process
26
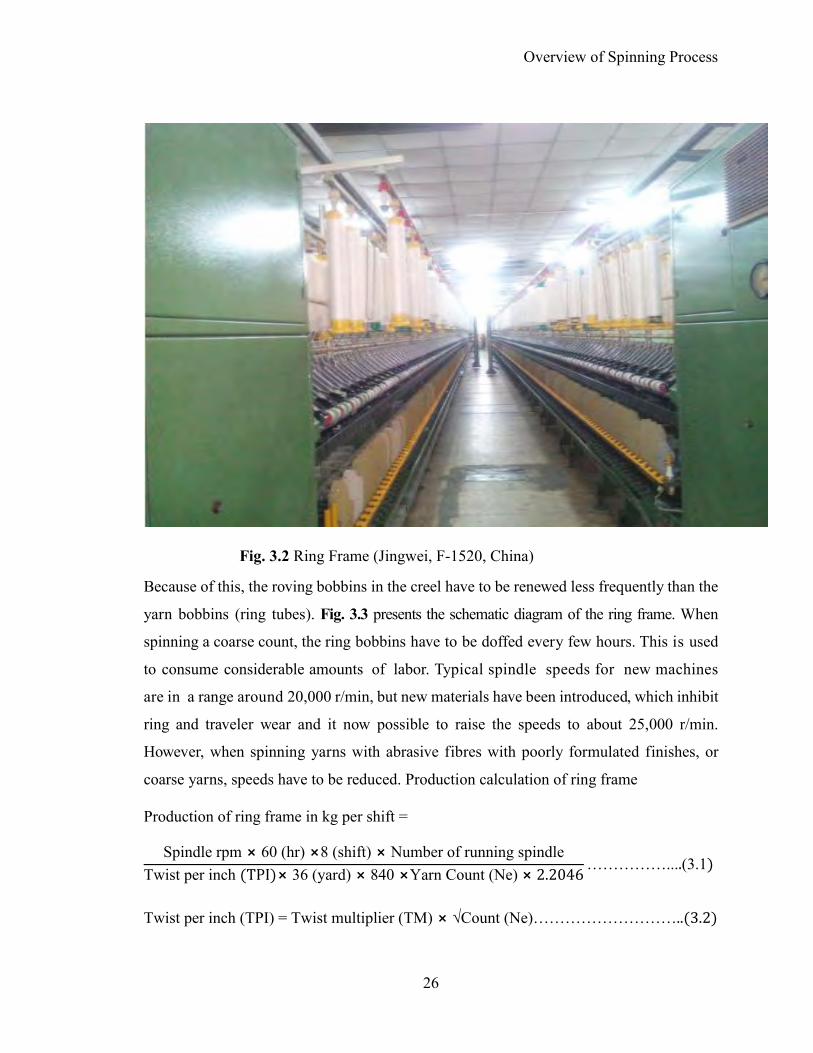
Fig. 3.2 Ring Frame (Jingwei, F-1520, China)
Because of this, the roving bobbins in the creel have to be renewed less frequently than the
yarn bobbins (ring tubes). Fig. 3.3 presents the schematic diagram of the ring frame. When
spinning a coarse count, the ring bobbins have to be doffed every few hours. This is used
to consume considerable amounts of labor. Typical spindle speeds for new machines
are in a range around 20,000 r/min, but new materials have been introduced, which inhibit
ring and traveler wear and it now possible to raise the speeds to about 25,000 r/min.
However, when spinning yarns with abrasive fibres with poorly formulated finishes, or
coarse yarns, speeds have to be reduced. Production calculation of ring frame
Production of ring frame in kg per shift =
Spindle rpm ⨯ 60 (hr) ⨯8 (shift) ⨯ Number of running spindleTwist per inch (TPI)⨯ 36 (yard) ⨯ 840 ⨯Yarn Count (Ne) ⨯ 2.2046
……………....(3.1)
Twist per inch (TPI) = Twist multiplier (TM) ⨯ √Count (Ne)………………………..(3.2)
Page 42
Overview of Spinning Process
27
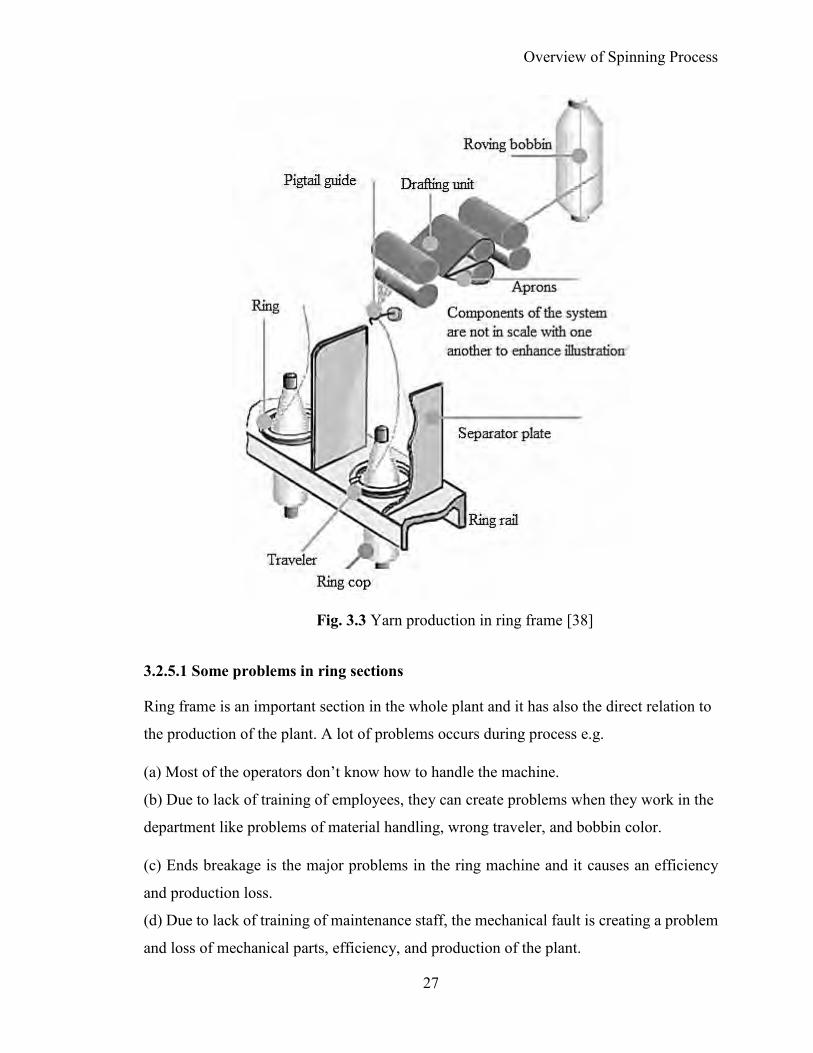
Fig. 3.3 Yarn production in ring frame [38]
3.2.5.1 Some problems in ring sections
Ring frame is an important section in the whole plant and it has also the direct relation to
the production of the plant. A lot of problems occurs during process e.g.
(a) Most of the operators don’t know how to handle the machine.
(b) Due to lack of training of employees, they can create problems when they work in the
department like problems of material handling, wrong traveler, and bobbin color.
(c) Ends breakage is the major problems in the ring machine and it causes an efficiency
and production loss.
(d) Due to lack of training of maintenance staff, the mechanical fault is creating a problem
and loss of mechanical parts, efficiency, and production of the plant.
Page 43
Overview of Spinning Process
28
(e) Improper maintenance is also creating problems related to maintenance and electric
fault during the running of the machine.
(f) Electric problems also occur due to lack of electric staff and they are unable to
take corrective and preventive action against any fault.
(g) Some faults are occurred due to the manufacturer of a machine like a software problem,
communication problem, and load capacity problems.
3.2.6 Winding
It is the section of yarn manufacturing process where auto cone machines are installed and
take an input material from ring spinning section as a yarn bobbin and give a yarn on paper
cone after passing detecting instrument as an output. In the winding section, there are a lot
of heads in auto cone machines use to wound the yarn from ring cops to paper cone yarn.
The winding department plays an important role in the production and quality of yarn and
causes a direct effect on them. The yarn which made in ring section is not finished yarn
and can’t sell to the customer. After making the yarn in ring process, auto cone section
made it more even yarn by passing through the optical sensor which is installed in different
heads of the machine. The yarn which is obtained from winding section is able to sell the
customers.
3.3 Role of maintenance department in a spinning mill
In every spinning mill, the performance of the plant depends on the reliability,
availability, and maintainability of the plant, all of which are of primary importance for
ensuring an excellent and affordable product. The concept of maintenance has changed
substantially over the years; its main function now is to prevent mechanical and quality
breakdowns. The quality breakdown does not mean that the quality of whole lot is low, but
it means the lot is rejected due to the poor quality of yarn on few ring cops or cones. Hence
to maintain excellent quality, one must be capable of judging spindle to spindle variations
in ring frames, speed frames, and winding, and machine to machine variations in
preparatory. Thus, maintenance department plays the following roles in the spinning mill
[39]:
Page 44
Overview of Spinning Process
29
(a)To prepare a policy statement for the maintenance department, which would explain the
basic objectives based on the organizational objectives, and to write standard
maintenance procedures, maintenance schedules, lubrication charts, etc.
(b)To prepare maintenance charts for individual equipment and to train the maintenance
personnel in the implementation of these.
(c) To coordinate with the production people to ensure that a regular maintenance will
be implemented without affecting important production schedules.
(d) Carry out the scheduled preventive maintenance programs and ensure that plant is
available for production for the maximum duration.
(e) Carry out the overhaul of the machinery at the scheduled time without fail.
(f) Calibrate various instruments put at various points in the plants.
(g) Record all the work systematically in the record books, with details of work done, the
material used, workforce applied, time taken to complete the job and expenses made.
(h) Maintenance records should be reviewed from time to time so that any corrective
actions to be taken and be implemented in the future.
(i)Try to standardize equipment, purchased items, tools, fixtures based on the prior
experiences.
(j) Always keep a close watch on the inventory of spare parts and maintenance
materials. Coordinate with stored and procurement department to initiate new demands
in time.
(k) Start energy-saving programs in the plant and also teach the operator sand
maintenance staff about various energy-saving techniques.
(l) Recruit and train new maintenance staff and workers in place of skilled personnel
who have retired or left.
(m) At the start of the financial year, prepare a budget for maintenance. Include all
major or minor repair replacement jobs in it.
Page 45
Overview of Spinning Process
30
(n) Ensure that the provisions in the budget are being utilized as per schedule and keep
a close watch on the expenses.
(o) Start the cost-reduction and cost-control projects in the plants.
(p)Develop a management information system giving all the relevant details about the
maintenance and replacement techniques.
(q) To adjust the different machines in the process according to the fibre processed.
Page 46
CHAPTER 4: TRAINING PROGRAM FOR OPERATORS
31
4.1 Introduction
Training is crucial for organizational development and its success which is indeed fruitful
to both employers and employees of an organization. Training and development can be
described as "an educational process which involves the sharpening of skills, concepts,
changing of attitude and gaining more knowledge to enhance the performance of
employees [40]. Training is a program that helps employees learn specific knowledge or
skills to improve performance in their current roles. A training program was arranged to
develop the skills of operators regarding basic operation of the ring frame, basic
maintenance activities, quality of produced yarn, and productivity of machine and
responsibilities of an operator in ring frame section.
4.2 Ring Frame
The ring frame was invented by an American named Thorp in 1828 and Jenk another
American, added the traveler rotating around the ring in 1830. In the intervening period of
more than 170 years, the ring spinning machine has undergone considerable modification
in detail, but the basic concept has remained the same. For many years any noteworthy
further development hardly seemed possible, yet a significant process of evolution took
place during this time. The productivity of the ring spinning machine has increased by 40%
since the late nineteen-seventies.
4.2.1 Operations involved in ring frame
The basic operations of ring frame are creeling, drafting, twisting, winding, building and doffing.
(a) Creeling
(i) Creeling of the roving bobbin when it is empty and to replace it by a new full roving
bobbin is called creeling. Creeling time should be as small as possible.
(ii)The number of spindles of a ring frame is 1008 and the number of creels must be 2-3%.
If all roving bobbins fitted on the creel are the same size, the bobbin will be exhausted at
the same time, which will cause machine stoppage and production will become low. In
block creeling arrangement, the total number of creel is divided into several numbers of
Page 47
Training Program for Operators
32
groups. Each group contains roving bobbin of the same length but differs from adjacent
groups or blocks. Thus all bobbins will not exhaust at the same time. So, there is no
machine stoppage and production goes on smoothly. Fig. 4.1, Fig. 4.2 and Fig. 4.3
represent the creeling of roving in the ring frame.
Fig. 4.1 Umbrella type creel
Fig. 4.2 The feed material of ring frame (roving)
Fig. 4.3 Creeling of roving in the ring frame
Page 48
Training Program for Operators
33
Advantages of block creeling:
(i) Avoid machine stoppage
(ii) Save the time
(iii) Save manpower
There are two types of creel used in ring frame: Umbrella and skewer type creel.
(b) Drafting
Drafting operation reduces weight per unit length of the roving. Roving comes from the
bobbin is passed through the drafting zone, which may be of apron drafting system or
without apron drafting system. Fig. 4.4 represents the drafting system used in ring frame.
(i) In the ring frame, roving comes from the bobbin is passed through the 3 over 3 rollers
double apron drafting system.
(ii) In apron drafting system fibre controlling is better; so it is widely used.
Fig. 4.4 Drafting system in ring frame
(c) Twisting
The twist is the spiral turns that are inserted along the fibre axis.
(i) It increases yarn strength.
(ii) It helps in the winding.
(iii) The traveler, which helps to insert twist in yarn, gets driven indirectly from the spindle.
Page 49
Training Program for Operators
34
Fig. 4.5 Twisting and winding in ring frame
(d) Winding
After twisting the yarns are wound on a suitable package. Layers of yarns are wound
properly one above another on the package. It should be in such a manner that during
unwinding it will not create any problem. Fig. 4.5 represents the twisting and winding
arrangement in ring frame.
(e) Building
For the proper size and shape of the package, the bobbins are lifted gradually. The resultant
bobbins are conical shape full bobbin. It is called building. Fig. 4.6 represents the building
of ring cop.
(f) Doffing
Doffing means removal of the full-size package and replacing it with the empty one. During
doffing, the machine is stopped and it is carried out by skilled operators For coarser count
of yarn, doffing time is less and for a finer count of yarn, the doffing time is more for
complete doff. During doffing, it should be kept in mind that it should be carried out in the
shortest possible time.
Page 50
Training Program for Operators
35
Fig. 4.6 Building of ring cop Fig. 4.7 Doffing of ring cops by doffer
4.2.2 Important machine parts and their functions
Important machine parts of ring frame are
(a) Drafting unit (b) Spacer (c) Lappet (d) Ballon control ring (e) Separator (f) Ring (g) Spindle (h) Traveler (i) Bobbin (j) Spindle break
(a) Drafting unit
The drafting unit of ring frame contains, 3 over 3 rollers double apron drafting system
including pressure arm, cradle, nose bar, cot roller and fluted steel roller. Fig. 4.8 represents
a drafting elements of the ring frame.
Components in drafting unit:
(i)Top rollers: cot roller (Rubber coated).
(ii) Bottom rollers: Fluted steel (Straight, spiral and knurled).
(iii) Apron: Top apron (short apron) and bottom apron (long apron).
Aprons are used to guide the fibres and control the short fibres.
(iv) Cradle: Gives the shape of a top apron.
(v) Nose bar: Gives the shape of a bottom apron.
Page 51
Training Program for Operators
36
Fig. 4.8 Drafting elements of ring frame
Fig. 4.9 Spacer Fig. 4.10 Spacer in the middle of twine roller
(b) Spacer
The plastic element which maintains space between two aprons is termed as a spacer. Finer
the count, less the space required between aprons. Spacers are different colored according
to spaced they can create a gap between two drafting roller. Fig. 4.9 and Fig. 4.10 represent
the different colored spacer used in ring frame.
(c) Lappet
It is a guide made by bending a wire named snail wire. Snail wires may be of different
types, like p-shaped wire. Fig. 4.11 represents the lappet of pigtail guide.
Page 52
Training Program for Operators
37
Functions of lappet
(i) It’s the main function is to maintain the security of yarn.
(ii) It prevents yarn’s collision with adjacent yarns.
(ii) Its surface should be smooth to prevent rubbing of yarn. Due to rubbing yarn hairiness
increases.
Fig. 4.11 Lappet/ Pigtail guide
(d) Balloon control ring
It is made by bending a steel wire in circular form situated after the lappet. One end of the
yarn is on lappet guide and the other end on the traveler. Fig. 4.12 and Fig. 4.13 represent
the ring, ring rail and ballon control ring of the ring frame.
Fig. 4.12 Ballon control ring Fig. 4.13 Ring rail, ring, and ballon control ring & separator
Page 53
Training Program for Operators
38
(i) Due to rotation of traveler, the yarn between them becomes fluffy. This is called balloon.
To reduce the balloon size, balloon control ring is used. The surface of the ring should be
very smooth, otherwise hairiness increases.
(ii) Ballon control ring reduces the balloon size, corresponding by the spinning tension. At
the end, it reduces end breakage.
(e) Separator
It is connected with ring rail and made of aluminum or plastic. It separates two adjacent
balloons. As it separates the subsequent balloons, so it reduces end breakage.
(f) Ring
The rings are made of soft steel or of ceramic in the form of a bar which is ring-shaped
either by bending and welding or by piecing and rolling or by pressing by means of dies
and then the stock is given the desired projection termed as ring flange. Fig. 4.14 represents
the ring of the ring frame.
Fig. 4.14 Ring and traveler Fig. 4.15 Spindle and it’s different parts
Functions of ring:
(i) Ring guides the circular run of the traveler.
(ii) It also helps in twisting by means of running of the traveler.
(iii) It also acts as a track of traveler.
Page 54
Training Program for Operators
39
(g) Spindle
The spindle is the main parts of ring frame which help in twisting, winding simultaneously.
Fig. 4.15 represents a spindle and it’s different parts.
(i) Sometimes spindle is referred as the heart of spinning.
(ii)It holds the bobbin, somewhat loosely but tight enough to prevent slippage.
(iii) It is the unit of production and identifies the size of a mill.
(h)Traveler
Traveler is the tiniest and simple mechanical element in a ring frame which carries the most
important function like simultaneous twisting, winding, yarn guiding etc. Fig. 4.16 and
Fig. 4.17 represent traveler with the ring.
Fig. 4.16 Traveler (c type) Fig. 4.17 Traveler in ring
Functions of a traveler:
(i) Twisting on the drafted strand of fibres.
(ii) The winding of the yarn on the bobbin.
(iii) Maintain winding tension of the yarn by the frictional resistance between the ring and
the traveler.
(iv) It acts as the guide for yarn on the way to be wound on the bobbin.
(v) It performs the function of building motion to wind the constant length of strand
delivered by the front roller.
Page 55
Training Program for Operators
40
(i) Bobbin
It is made of plastic. Mainly polycarbonate is used. Its melting point should be high so that
it does not melt due to heat generation during winding yarn. Fig. 4.18 and Fig. 4.19
represent empty bobbin and ring cop of the ring frame.
Fig. 4.18 Ring bobbin Fig. 4.19 Ring cops
Reasons for using plastic bobbin:
(i) It does not create a defect in yarn.
(ii) Due to its lightweight, it is easy to transport.
(iii) It causes less waste of yarn.
(iv) As it is light in weight, needs less power to run it.
(j) Spindle break
To take out the bobbin from the machine during running condition for any instant it requires
stopping the spindle. By pressing spindle brake it is done. It helps to stop the spindle during
running condition of the machine. Fig. 4.20 represents the spindle breaks that are used in
ring frame.
Fig. 4.20 Spindle break
Page 56
Training Program for Operators
41
4.2.3 Improvement of productivity of ring frame
The productivity plays an important role in the growth of any company. The productivity
of ring frame can be improved by different variables.
(a) Raw material
Better raw material results in the form of better quality and productivity.
(b) Machine
Good quality machines and their proper maintenance results in the form of increase
productivity.
(c) Spindle speed
Spindle speed directly proportional to production rate. Higher speed reduces machine
performance (increase end breakage rate), deteriorate yarn quality.
(d) Yarn TPI
Yarn TPI inversely proportional to production rate. There is proverb “twist cost money”.
Higher twist (TPI) reduces production as well as increases the cost of production.
(e) Waste%
The waste% of a spinning mill depends on trash content in raw materials and quality of
yarn is being spun. Total waste of spinning mill is expressed by the term ‘yarn realization’.
For carded yarn production, yarn realization is around 85%. It means 15% materials are
lost due to processing. The waste of ring frame is around 2%.
(i) Soft waste (reusable waste)
Pneumafil waste: Waste obtained by the pneumafil waste collector (up to 1.5%). Mainly
produced due to excessive end breakage.
Bonda waste: Waste obtained as roller lapping waste; on the top and bottom drafting rollers. (0.1- 0.5%).
Roving waste: Waste obtained due to broken roving. (Maximum 0.5%).
Sweep waste: Waste obtained by suction and blower (0.05 - 0. 2%).
Page 57
Training Program for Operators
42
(ii) Hard waste (non-reusable waste)
The waste obtained as the broken ends (around 0.1- 0.2%) depend on operators piecing skill.
Pneumafil waste collector
It is a tube through which air is sucked by pneumatic action. It is used for collecting broken
drafted fibres. Because of one yarn breakage, the total machine is not stopped. The name
of collected waste is pneumafil. The collected waste is reused in blow room section.
(f) End breakage rate
It is expressed breakage/1000 spindle-hr and occurred due to
(i) Disturbances and defects in spindles
(ii) Day-to-day variability in mixing in blow room section
(iii) Incorrect roving fineness
(iv) Poor maintenance
(v) Variability in R.H. and temperature.
To reduce end breaks, the following measures should be taken into consideration.
(i) Reduction of the width of drafted ribbon at the front roller nip.
(ii) Reduction of unevenness of fibre strand after carding.
(iii) Reduction of friction between ring and traveler to reduce tension during the rotation
of the traveler.
(iv) Reduction of spindle speed by 5 to 6%, just after putting new travelers for 2 hours.
(v) Using of higher TM for a finer count of yarn and lower TM for a coarser count of yarn.
(vi) Proper under winding in the bobbin.
After cop build-up, the ring rail automatically moves downwards and opens the grip. The
spindle still revolves slowly, winds a very short length yarn in the grip. Then grip is closed.
After doffing, the length of yarn remains firmly clamped, enabling piecing to be performed.
The very short length of yarn remains clamped in the grip throughout package build-up.
When grip opens at the next package change, the length of yarn is released and taken off
with the package. So that no yarn ends remain in the spindle. Due to improper under
winding starting end breakage will be increased. Fig. 4.21 presents the under winding in
the bobbin.
Page 58
Training Program for Operators
43
Fig. 4.21 Underwinding in the cop
Fig. 4.22 Perfect shaped ring cop
(g) Bobbin length
The production can be increased by increasing the bobbin size because, with a larger
bobbin, less number doff if required per shift. The bobbin size depends on ring diameter
but as we increase the ring diameter end breakage rate also increases. So it has a limit.
Usually, 42 mm ring dia is available on which 40 mm cops dia can be produced.
The ring cop is a typical package on ring spinning machine, consist of three clearly
distinguishable build-up sections: the lower, rounded base (A), the middle, cylindrical
section (W) and the conical nose (K). Fig. 4.22 presents a typical perfect shaped ring cop.
(h) Piecing skill of operator
Operators piecing skills determined by the number of piecing per minute done by the
operator. The standard piecing of an operator is 10-12 piecing/minute and the more the
better. If operators piecing performance is low then deformed shaped cops are produced as
well as production is reduced.
Page 59
Training Program for Operators
44
(i) Cleanness of machine
The performance of ring frame and quality of yarn also depend on the cleanliness of
machine parts, especially in the drafting zone, jockey pulley, roving in the creel.
(j) Movement of operator
Ring frame machines are two sided. An operator performs his/her duty two sides of two
machines at the same time. During higher breakage in one machine, his/her movement
should be straight during piecing the yarn. On the other hand, in a normal state of the
machine, his/her movement will be zig-zag during piecing the yarn.
4.2.4 Improvement of quality of yarn
There is a slogan in textile spinning industry “Production is a must but the quality is
first”. Without desired quality of yarn, the production may go in vein. The quality of
yarns are deteriorated due to
(a)Technological causes
(i) Excessive twist in roving: Improper selection of TPI in roving
(ii) Defective drafting unit: A drafting unit is defective when it contains bad quality apron,
improper spacer, spacer missing and unclean wooden roller.
(iii) Excessive end breakage: Due to yarn breakage, piecing should be done. Piecing itself
a fault which creates thick places in the yarn.
(iv) Improper relative humidity (RH): 55% relative humidity is standard for ring frame.
Cotton fibres absorb moisture due to increasing of RH. After absorbing of moisture, yarn
count becomes coarser. As a result, travelers are not suited for that yarn. So yarn breakage
increases.
(b) Mechanical causes
Mechanical causes are as follows
(i) Faulty drafting system
(ii) Worn out ring, traveler
(iii) Wrong selection of spacer
(iv) Faulty gear and wheel
Page 60
Training Program for Operators
45
(v) Worn out top roller coat
(vi) Faulty apron
(vii) Spindle vibration.
4.2.5 Basic maintenance activities that should be done by operators
Guidelines for basic troubleshooting by the operators
(a) Fly accumulation at traveler
(b)Wrong selection of spacer
(c) Cracked spacer
(d) Cracked apron
(e) Spindle vibration
(f) Roving stretched
(g) Deformed ring cops
(h) Less compact cops or loose cops
(i) Jerky motion of ring rail
(j) Eccentric top roller
(k) Cracked cot roller
(l) Top roller contaminated by grease
(m) Poor condition of spindle tape
(n) Fly accumulated in jockey pulley
(o) Defective cradle
(p) Top roller lapping by fibre
(q) Bottom roller lapping by fibre
(r) Defective spindle break/knee break/finger break.
4.2.6 Responsibilities of an operator in the ring frame section
A ring frame operator should have good eyesight, hand-eye-leg coordination, motor skills
and vision. He/she should have good interpersonal skills.
(a) Creel the roving bobbin in the ring frame following block creeling procedure.
(b) Quickly joining (piecing) the yarn when it breaks.
Page 61
Training Program for Operators
46
(c) Monitor end breakage rate visually per 1000 spindle hour and inform to production
officer when breakage rate increases.
(d) Carry out routine cleaning and preventive maintenance activities to produce defect free
yarn and ensure quality produced ring cops.
(e) Monitor the spindle vibration.
(f) Observe and check the cot roller, apron, spacer, cradle, and nose bar to remove the
cracked parts from the machine.
(g) Carefully monitor the individual spindle, idle spindle and also identify the causes of
their idling.
(h) Monitor the starting end breakage which may occur due to imperfect under winding.
(i) Remove pneumafil waste from waste collector chamber at the one-hour interval.
(j) Operators should have perfect knowledge about the produced yarn fineness (count) and
count wise bobbin color to avoid count mix and lot mix in the ring frame section.
(k) Operators should have knowledge about roving bobbin color according to different
process e.g. carded, combed, blended yarn.
(l) Proper knowledge about draft change pinion (DCP) and twist change pinion (TCP)
which should be changed during the changeover of yarn fineness.
Page 62
CHAPTER 5: DATA COLLECTION AND ANALYSIS
47
5.1 Study framework
There were 20 machines in the ring frame section. The manufacture was Jingwei, China. The
machine number 11 to 20 were producing 26 Ne carded knitting yarn. The study was done on that
machines. The study framework has been showed in Fig. 5.1.
Fig. 5.1 Study framework of the study
Select a specific ring frame
Iinitial data collection based on stoppage losses
Measurement of OEE based on data
Data analysis by Kaizen tools
Training program for operators
Data collection after implementation of Kaizen
Measurement of OEE
Comparison and analysis of OEE of present status with previous status
Pareto Chart
WWBLA
Fishbone Diagram
Page 63
Data Collection and Analysis
48
The study was done in Akij Textile Mills Limited (ATML), incorporated as a private limited
company in 1999 stands Charkhanda, Golora, Manikganj. ATML is a concern of AKIJ group. The
company is now producing rotor spun yarn by installing rotor frame. At present, the production
capacity of ring and rotor spinning system is 25 ton and 12 ton per day respectively. Currently,
employs around 1200 people whilst the factory has an installed capacity 45,000 spindles in ring
spinning system. The industry is designed to produce carded, combed, compact, siro, Cotton-
Polyester (PC) and Chief Valued Cotton (CVC) yarns. Akij group have apparel manufacturing
facilities with very strong backward integrated industries of spinning, weaving, dyeing, finishing
and packaging. They are supplying quality knitted and woven fabrics across the world to the best
retailers in the fashion industry. Some famous clothing retailers like HnM, Tema, BF Asia etc. are
buying finished fabric from Akiz group.
The main goal this research was to improve the OEE through TPM technique. The measures of
this study were based on major six stoppage losses. Initially, the ring frame with the lowest OEE
was identified. Significant losses were identified for further work using Pareto analysis. The
WWBLA worksheets were constructed along with their countermeasures to find out the reasons
behind the significant losses and the fishbone diagrams are fabricated to illustrate the causes of the
problem in a structured way. After that, a Kaizen team was built and trained the operators to
amplify their skills, and also to ensure the basic maintenance works such as basic cleaning of
machine parts, oiling, tightening, inspection, and basis routine works. After completing the above
steps, data were collected again to measure the improvement in OEE of the ring frame machine.
5.2 Data collection
It is essential to get appropriate data on stoppage losses to implement TPM. Often organization
maintenance systems record the repair time in the log book which is not the same as stoppage time.
This data collection does not give an actual scenario of stoppage losses in most cases. Moreover,
it is quite difficult to get accurate data in the process industry. Manual data collection can be given
an accurate information of production floor relating stoppage losses. In this study, data were
collected for ten days at shift A (from 6:00 am to 2:00 pm) on the basis of six major stoppage
losses from selected ring frame that was producing yarn count of 26 Ne KH and TPI of 18.36.
Table 1 shows the stoppage losses of ring frames.
Page 64
Data Collection and Analysis
49
Data of each ring frame is collected based on major six losses. Then OEE is calculated from
collected data.
5.2.1 Selection of ring frame on the basis of existing OEE
Data were collected on the basis of six major stoppage losses from ring frame number 11 to 20
which were producing a similar type of yarn. Here the yarn count was 26 Ne KH, yarn TPI was
18.36. Table 5.1 shows the stoppage losses of ring frames.
Table 5.1 Stoppage losses of ring frames
M/C No.
Activity Losses Frequency Loss (mins) Total loss (mins)
11
Doffing Idling and minor stoppage
3 7 +7.5+6.5
25 Back roller bearing breaks (all ends break)
Breakdown
1 4
12
Doffing Idling and minor stoppage
3 8+9+7.5 35 Power failure Breakdown 1 10.5
13
Doffing Idling and minor stoppage
3 7+6.5+7 25 Traveler change Idling and minor
stoppage 1 5
14
Doffing Idling and minor stoppage
3 6.5+7.5+7
29 TCP breaks Breakdown 1 4 Front roller bearing breaks (all ends break)
Breakdown 1
4
15
Doffing Idling and minor stoppage
3 7+7.5+7 35 Roving change Yield loss 1 13.5
16
Doffing Idling and minor stoppage
3 7+8+7 31 Power failure Breakdown 1 9
17
Doffing Idling and minor stoppage
3 8+9+7.5 42.5 DCP gear breaks Breakdown 1 18
18
Doffing Idling and minor stoppage
3 7.5+7+7 28 Excess EBR Yield loss 1 6.5
19
Doffing Idling and minor stoppage
3 7.5+7+7
29 Traveler change Idling and minor
stoppage 1 4
Spindle tape breaks (2 positions)
Reduced speed 1 3.5
20
Doffing Idling and minor stoppage
3 6.5+7+7
26 Power failure Breakdown 1 2 Front roller bearing breaks (all ends break)
Breakdown 1 3.5
Page 65
Data Collection and Analysis
50
Table 5.2 Existing OEE of ring frame section
M/C Number 11 12 13 14 15 16 17 18 19 20
A Running time per shift (mins) 480 480 480 480 480 480 480 480 480 480
B Downtime per shift (mins) 0 0 0 0 0 0 0 0 0 0
C Loading time per shift (A-B) (mins) 480 480 480 480 480 480 480 480 480 480
D Stoppage losses per shift(mins) 25 35 25 29 35 31 42.5 28 29 26
E Operating time per shift (C - D) (mins)
432 421 413 436 435 438 413 442 426 429
Defect amount (number) 82 77 53 65 72 68 106 76 59 74
F Output per shift (number) 3720 3760 3781 3672 3605 3722 3317 3727 3829 3682
G Rate of quality products (%) 97.80 97.95 98.60 98.23 98.28 98.17 96.80 97.96 98.20 98.04
H Ideal cycle time (mins) 0.11 0.11 0.11 0.11 0.11 0.11 0.11 0.11 0.11 0.11
I Actual cycle time (mins) 0.12 0.11 0.12 0.12 0.12 0.12 0.12 0.12 0.12 0.12
J Actual processing time (I * F) (mins) 446.40 413.98 438.60 434.40 431.52 434.36 418.27 446.77 449.52 446.63
K Operating speed rate ( H/I * 100) (%)
91.67 99.09 94.05 92.22 91.14 93.49 86.52 90.99 92.93 89.94
L Net operating rate (J/E * 100) (%) 98.11 93.09 96.39 96.32 99.66 96.74 95.61 98.86 99.67 98.38
M Availability (E/C) * 100 (%) 94.79 92.71 94.79 93.96 92.71 93.54 91.15 94.17 93.96 94.58
N Performance Efficiency (K*L*100) (%) 89.94 92.18 90.65 88.83 90.83 90.44 82.72 89.95 92.62 88.48
OEE M*N*G*100 (%) 83.38 83.71 84.72 81.99 82.57 83.05 72.98 82.98 85.46 82.04
Page 66
Data Collection and Analysis
51
From Table 5.2, it is revealed that the performance of ring all ring frames are similar except
machine number 17. The OEE of all the machines is near about 82-85 percent. However, the
machine number 17 shows OEE of 72.98 percent. Now machine number 17 is considered as the
pilot machine on which the study will be done.
5.2.2 Identification of major losses
Table 5.3 illustrates day wise losses identification and their classification.
Table 5.3 Day wise losses identification and their classification
Day Activity Losses Frequency Loss (mins) Total loss (mins)
1
Doffing Idling and minor stoppage 3 7.5 + 7+8 22.5 Back roller bearing breaks (all ends break)
Breakdown 1 9.5 9.5
2
Doffing Idling and minor stoppage 3 7.5+9+7.5 24 Power failure Breakdown 1 6 6
3
Doffing Idling and minor stoppage 3 8+7.5+7 22.5 Traveler change Idling and minor stoppage 1 8.5 8.5
4
Doffing Idling and minor stoppage 3 8.5+7+7 22.5 TCP gear breaks Breakdown 1 10.5 10.5 Front roller bearing breaks (all ends break)
Breakdown 1 17 17
5
Doffing Idling and minor stoppage 3 8.5+ 8+6 22.5 Roving change Yield loss 1 15.5 15.5
6
Doffing Idling and minor stoppage 3 9+7+8 24 Power failure Breakdown 1 12 12
7
Doffing Idling and minor stoppage 3 8+7.5+8.5 24 DCP gear breaks Breakdown 1 11 11
8
Doffing Idling and minor stoppage 3 8+8+8 24 Excess EBR Yield loss 1 16 16
9
Doffing Idling and minor stoppage 3 9+7.5+7.5 24 Traveler change Idling and minor stoppage 1 10 10 Spindle tape breaks (2 positions)
Reduced speed 1 8.5 8.5
10
Doffing Idling and minor stoppage 3 7+9+8 24 Power failure Breakdown 1 7 7 Front roller bearing breaks (all ends break)
Breakdown 1 10 10
Total loss (mins) 375.5
Page 67
Data Collection and Analysis
52
5.2.3 Stoppage analysis
From Table 5.3, stoppage losses were analyzed. To identify the strength and weakness of the
system, the incidental stoppage were divided into subtypes which are presented in Table 5.4. It
was distributed as a percentage of stoppage minutes caused by particular discipline to the total
stoppage.
Table 5.4 Frequency based on stoppage losses
SL No. Activity Frequency
1 Doffing 30 2 All end breaks 2 3 Power failure 2 4 Traveler change 2 5 Roving change 2 6 Front roller gear
break 1
7 TCP broken 1 8 DCP break 1 9 Excess EBR 1 10 Spindle tape break 1
Fig. 5.2 Distribution of stoppage percentage among different discipline
70%5%
5%
5%
2%
2% 5% 2% 2% 2%
Doffing
All end break
Power failure
Traveler change
TCP break
Front roller gearbreakRoving change
Page 68
Data Collection and Analysis
53
From Fig. 5.2, it is clear that stoppage due to doffing was about 70% of total accounts for the most
of the stoppage causing production losses in the factory. All end breaks, power failure, traveler
change and roving changes were 20% of total accounts.
5.2.4 Identification of significant losses by Pareto analysis
From Table 5.3, most significant losses were identified by Pareto analysis. Pareto analysis is a
statistical technique in decision making that is used for selection of a limited number of tasks that
produce a significant overall effect which principle idea is doing 20% of work, 80% of the
advantages of doing the entire job can be generated.
Fig. 5.3 Pareto chart for major losses
0102030405060708090100
0
50
100
150
200
250
300
Idling andminor
stoppage
Breakdown Yield loss Reducedspeed
Set-up andadjustment
Defects inprocess
Cum
mila
tive
Perc
enta
ge
Tim
e (m
inut
es)
Major stoppage loss Cummilative Percentage
Page 69
Data Collection and Analysis
54
Table 5.5 Data of six major losses from Pareto chart
Major losses Time (mins)
Composition (%)
Cumulative (%)
Idling and minor stoppage 252.5 67.2 67.2
Breakdown 83.0 22.1 83.0 Yield loss 31.5.0 8.4 97.7 Reduced speed 8.5 2.3 100 Set-up and adjustment 0.0 0.0 100 Defects in process 0.0 0.0 100 Total 375.5 100
From the Pareto analysis, it is seen that the most significant source of loss was idling and minor
stoppage, which is 67.2 % of total loss, then second is breakdown stoppage loss as 22.1%, then
yield loss third is 8.4% and fourth loss is reduced speed as 2.3% of the total loss. Now it needs to
reduce the losses first to increase OEE. Here the idling and minor stoppage and breakdown losses
are considered as most significant losses and their impact on OEE is vital.
Page 70
Data Collection and Analysis
55
5.2.5 Calculation of OEE
Daily OEE was calculated to observe the fluctuation OEE. Table 5.6 illustrates OEE of ring frame
Table 5.6 OEE calculation at initial stage
Day 1 2 3 4 5 6 7 8 9 10
A Running time per shift (mins) 480 480 480 480 480 480 480 480 480 480 B Downtime per shift (mins) 0 0 0 0 0 0 0 0 0 0 C Loading time per shift (A-B) (mins) 480 480 480 480 480 480 480 480 480 480 D Stoppage losses per shift(mins) 32 30 31 50 38 36 35 40 42.5 41
E Operating time per shift (C - D) (mins)
448 450 449 430 442 444 445 432 437.5 439
Defect amount (number) 97 106 112 106 106 102 108 124 95 109 F Output per shift (number) 3416 3317 3393 3483 3443 3487 3314 3393 3493 3363 G Rate of quality products (%) 97.16 96.80 96.70 96.96 96.92 97.07 96.74 96.35 97.28 96.76 H Ideal cycle time (mins) 0.11 0.11 0.11 0.11 0.11 0.11 0.11 0.11 0.11 0.11 I Actual cycle time (mins) 0.13 0.13 0.12 0.12 0.12 0.12 0.13 0.13 0.12 0.13
J Actual processing time (I * F) (mins) 430.76 418.27 417.34 424.93 420.05 428.90 420.88 427.86 419.16 424.07
K Operating speed rate ( H/I * 100) (%)
86.52 86.52 88.70 89.43 89.43 88.70 85.91 86.52 90.92 86.52
L Net operating rate (J/E * 100) (%) 96.15 92.95 92.95 98.82 95.03 97.60 94.58 97.24 95.81 96.60 M Availability (E/C) * 100 (%) 93.33 93.75 93.54 89.58 92.08 92.50 92.71 91.67 91.15 91.46
N Performance Efficiency (K*L*100) (%) 83.19 80.42 82.45 88.37 84.99 85.68 81.25 84.13 87.11 83.58
OEE M*N*G*100 (%) 75.44 72.98 74.58 76.76 75.85 76.93 72.87 74.31 77.24 73.97 Average OEE (%) 75.09
Page 71
Data Collection and Analysis
56
5.2.6 Production and defective product of ring frame
The OEE was measured of ring frame machine which contains 1008 spindles. Table 5.7 represents
output product, production and defective ring cops of the ring frame.
Table 5.7 Output (ring cops), production and defective ring cops per shift
Day
Output (ring cop/shift)
Production (kg/shift)
Defective
(ring cop/shift)
1 3416 619.76 97
2 3317 582.02 106
3 3393 608.41 112
4 3483 642.89 106
5 3443 613.98 106
6 3487 636.67 102
7 3314 579.42 108
8 3393 606.29 124
9 3493 648.77 95
10 3363 598.10 109
Avg. 3410 613.63 107
The average number of output (ring cops) per shift was 3410 from which production was 613.63
kg/shift. The defective number of ring cops were identified during production and that was 107
pcs per shift.
Page 72
Data Collection and Analysis
57
5.2.7 Identification of major causes of significant losses
Significant losses are idling and minor stoppage and breakdown stoppage.
5.2.7.1 Causes of idling and minor stoppage
Causes of idling and minor stoppage are showed in Table 5.8.
Table 5.8 Causes of idling and minor stoppage
Major causes Time (mins)
Composition (%)
Cumulative (%)
Doffing 234.0 92.67 92.67 Traveler change 18.5 7.33 100 Total 252.5 100
It is seen that the two significant losses comprise of 100% of the total loss of idling and minor
stoppage. It is clear that the main cause of idling and the minor stoppage is due to higher doffing
time and time required to change traveler in the machine.
5.2.7.2 Causes of breakdown stoppage losses
Table 5.9 presents causes of breakdown stoppage.
Table 5.9 Causes of breakdown stoppage
Major causes Time (mins)
Composition (%)
Cumulative (%)
All end breaks 36.5 43.98 43.98 Power failure 25.0 30.12 74.1 DCP breaks 11.0 13.25 87.35 TCP breaks 10.5 12.65 100 Total 83.0
It is clear that causes of breakdown are a power failure, front roller and back roller bearing
breaking, draft change pinion (DCP) and twist change pinion (TCP) gear breaking in the machine.
5.3 Reduction of losses with analytical technique
WWBLA technique is used to identify the causes of significant losses and countermeasures are
taken to reduce the stoppage losses occurred by above problem.
Page 73
Data Collection and Analysis
58
5.3.1 Why Why Because Logical Analysis (WWBLA) worksheet for idling and minor stoppage
Problem First factor
Verification
Second factor Verification
Third factor Verification
Fourth factor Verification
Countermeasures All factors
Idlin
g an
d m
inor
stop
page
Higher doffing time
GF
Delay attend of doffers after full
doff GF
Doffers are not concerned about
doffing time NF
Increased awareness of operators about doffing
activity
1.Delay attend of doffers 2.Doffers are not concern about doffing time
Lower number of doffer in ring
section NF The number of doffers
was increased 1.Lower number of doffers
Shortage of same colored empty bobbin
GF
Lower number of bobbin with respect
to production capacity
GF
Empty bobbin trays were not ready before
releasing the ring cops from ring frame
NF
Count wise empty bobbins were
rearranged and trays were ready before
doffing
1.Shortage of same colored empty bobbin 2.Lower no. of bobbin with respect to production capacity 3. Empty bobbin trays are not ready.
Stoppage of machine after
full doff GF Exceed target
production GF New order for finer count of yarn NF
Increased awareness of operators about doffing
time and speeds of back process machines
were regulated
1.Machine is stopped after full doff 2.Exceed target production 3.New order for finer count of yarn
Traveler change
GF
Traveler fly-out GF Piles were
originated through front roller
GF Displacement of front roller NF Front roller setting was
adjusted
1.Traveller fly-out 2.Piles are originated through front roller 3.Displacement of front roller
Excess EBR GF Higher RH in Ring section GF Humidification plants
failure NF Action was taken for
proper RH in ring section
1.Excess EBR 2.Higher RH in ring section 3.Humidification plants failure
GF: Go forward, NF: Not forward
Page 74
Data Collection and Analysis
59
5.3.2 Fishbone diagram for idling and minor stoppage
Unskilled operator
Doffers were not concerned about doffing time
Fig. 5.4 Fishbone diagram for idling and minor stoppage
Man
Environment Management
Material Machine
Idling and minor
stoppage
Measure
Page 75
Data Collection and Analysis
60
The fishbone diagram for idling and minor stoppage loss is displayed in Fig. 5.4. Based on the
influence of man, machine, materials, measures, management and environment, the reasons for
idling and minor stoppage were categorized. Operators were not concerned about the time required
to release the ring cops from the machine. Front roller was displaced and bearing was broken due
to overloading of the machine. Due to the generation of piles through the front roller, travelers
have flown away. To avoid count and lot mix, count wise bobbins color should be fixed. Therefore,
sufficient amount of count wise colored empty bobbins should be stored before changeover of
count or lot. Draft Change Pinion (DCP) and Twist Change Pinion (TCP) gears were changed due
to the new order of higher count, which was a managerial decision. The productivity of machinery,
process waste %, and the quality of yarn were also dependent on end breakage rate of the ring
frame. As noticed, higher RH enhanced the end breakage rate. Thus, proper control of RH was in
place to reduce the end breakage rate in ring frame section.
Page 76
Data Collection and Analysis
61
5.3.3 Why Why Because Logical Analysis (WWBLA) worksheet for breakdown or failure loss
Problem First factor
Verification
Second factor
Verification
Third factor
Verification
Fourth
factor
Verification
Countermeasures
All factors
Bre
akdo
wn
The main motor stops
GF
V-belts between m/c pulley and motor pulley are broken
NF
-
-
The broken belts were replaced
1. V-belts between m/c pulley and motor pulley are broken
TCP breaks
GF
TCP gear shaft is displaced
GF
Loose connection between nuts and bolts
NF
-
1. TCP gear shaft was adjusted 2. The broken gear was replaced
1. TCP gear shaft is displaced
2. Loose connection between nuts and bolts
Front roller
bearing breaks
GF
Piles are originated through front roller
GF
Displacement of front roller
NG
-
Position of front roller was adjusted
1. Piles are originated through front roller
2. Displacement of front roller
DCP breaks
GF
Direct switch the power off button without pressing inching motion button
GF
Operator is not awarded about switch on/off button
GF
Unskilled operator
GF
The DCP gear was replaced
1. Direct switch the power button without pressing inching motion button
2. Operators are not awarded about switch on/off button
3. Unskilled operator
GF: Go forward, NF: Not forward
Page 77
Data Collection and Analysis
62
5.3.4 Fishbone diagram for breakdown or failure loss
Fig. 5.5 Fishbone diagram for breakdown loss
Measure Material
Machine Man
Breakdown losses
Page 78
Data Collection and Analysis
63
Fig. 5.5 presents the fishbone diagram for breakdown losses. The reasons are grouped on the basis
of the influence of man, machine, materials, and measures. DCP gear was broken due to lack of
skills of operators. Since the connection between nuts and bolts were loose, the front roller and
TCP gear shaft were displaced. In addition, V-belts were also broken. Also, wastages were
increased due to the generation of piles through the front roller. In that case, proper measures were
taken to adjust the front roller position and TCP gear shaft.
Page 79
Data Collection and Analysis
64
5.4 Important counter measures were taken and their impact
5.4.1 Doffers were not concerned about doffing time
The training program was arranged to develop the skills of operators and number of doffers was
also increased. Normally operators inform the doffers to release the ring cops from the machine.
Due to lack of communication between operators and doffers, the machines were remained stopped
until doffers were ready to doff the ring cops. After the development of operators’ skills, operators
were more concerned about doffing time. Fig. 5.6 presents, ring cops before doffing.
Before After
Fig. 5.6 Ring cops in the machine before doffing
Page 80
Data Collection and Analysis
65
5.4.2 Empty bobbin trays were not ready before release ring cops from machine
Fig. 5.7 presents the doffing activity of doffer in the ring section. Count wise different colored
empty bobbins were rearranged and trays were ready before doffing. Doffers were ready to release
the ring cops after full doff but they had to wait few minutes due to a shortage of count wise
different colored empty bobbin. Count wise colored empty bobbins were increased. So the waiting
time was reduced thus stoppage losses were reduced.
Before After
Fig. 5.7 Doffer performs doffing
Page 81
Data Collection and Analysis
66
5.4.3 Piecing was not done immediately after breakage of yarn
Operators were not concerned about the importance of piecing of yarn when it breaks. They
performed this task with less priority. After the development of skills by the training program, they
attended at the broken position of yarn, immediately after it breaks. Fig. 5.8 shows, piecing of yarn
in the ring frame.
5.4.4. Cleanness of machine and excessive end breakage
Fig 5.9 presents the cleaning of drafting zone of the ring frame. Different machine parts that should
be clean by operators are wooden rollers, jockey pulley, traveler separators, and other basic
cleaning points. Due to lack of cleanness, the end breakage rate was increased. Operators were
using a cleaning brush to clean the machine parts. So end breakage rate was reduced. As a result,
production was increased that was also prevented the production of lower quality of yarn.
Before After
Fig. 5.8 Piecing of yarn after breakage
Page 82
Data Collection and Analysis
67
Before After
Fig. 5.9 Cleaning of machine parts by operator
Before After Fig. 5.10 Defective and ideal shaped ring cops
5.4.5. Defective shaped bobbins were produced
The defective cot rollers, cracked aprons were replaced to activate the idle spindles. Due to a higher
number of idle spindles, production was reduced and defective shaped ring cops were produced.
Page 83
Data Collection and Analysis
68
As a replacement of defective parts, non-productive positions were eliminated. The Operators were
monitored individual spindle very carefully. So defective shaped ring cops were reduced. Fig 5.10
presents defective and ideal shaped ring cops produced in ring frame.
5.5 Identification of major losses after reducing stoppage losses
Table 5.10 illustrates day wise stoppage losses and their classification.
Table 5.10 Day wise losses identification and their classification
Day Activity Losses Frequency Loss (mins) Total loss (mins)
1
Doffing Idling and minor stoppage 3 5.2 + 4.9 + 5.5 15.6
Power failure Breakdown 1 5.6 5.6
2 Doffing Idling and minor stoppage 3 5.0 + 5.6+ 5.0 15.6
3
Doffing Idling and minor stoppage 3 4.5 + 5.5 + 5 15
DCP broken Breakdown 1 10.5 10.5
4 Doffing Idling and minor stoppage 4 5.5 + 4.7+ 4.8 + 5 20
5
Doffing Idling and minor stoppage 3 5.2 + 4.7 + 5.1 15
Front roller bearing was broken
Breakdown 1 10 10
All end breaks Idling and minor stoppage 1 5 5
6
Doffing Idling and minor stoppage 3 5.3 +5.5 +5.1 15.9
Roving change Idling and minor stoppage 1 5.5 5.5
7
Doffing Idling and minor stoppage 4 5.4 + 5.2+4.8+ 4.6 20
Power failure Breakdown 1 5 5
8 Doffing Idling and minor stoppage 4 5.2 + 5.5 +5.5 +4.6 20.8
9
Doffing Idling and minor stoppage 3 4.8 + 5.5+ 4.7 15
Traveller change Set-up and adjustment 1 8 8
10 Doffing Idling and minor stoppage 3 4.5 +5.2 + 5.3 15
Total loss (mins) 217.5
Page 84
Data Collection and Analysis
69
5.5.1 Stoppage analysis
From Table 5.10, stoppage losses were analyzed and the stoppage was divided into subtypes which
are presented in Table 5.11.
Table 5.11 Frequency based on stoppage losses
SL No. Activity Frequency
1 Doffing 33
2 Power failure 2
3 All end break 1
4 Traveler change 1
5 Front roller gear break 1
6 Roving change 1
7 DCP break 1
Fig. 5.11 Distribution of stoppage by percentage among different discipline
From Fig. 5.11, it is revealed that stoppage due to doffing was about 82% of total accounts
for the most of the stoppage causing production loss of the factory. The power failure was
5% of total accounts.
82%
5%
2%
2% 3% 3% 3%
Doffing
Power failure
All end break
Traveler change
Front roller gearbreakRoving change
DCP break
Page 85
Data Collection and Analysis
70
5.5.2 Identification of major stoppage losses by Pareto analysis
From Table 5.10, the most significant losses were identified by Pareto analysis. The data of Pareto
analysis are shown in Fig. 5.12.
Fig. 5.12 Pareto chart for major losses after reducing stoppage
Table 5.12 Major losses from Pareto chart after reducing stoppage
Major losses Time (mins)
Composition (%)
Cumulative (%)
Idling and minor stoppage 178.4 82.0 82.0
Breakdown 31.1 14.3 96.3
Set-up and adjustment 8.0 3.7 100
Reduced speed 0.0 0.0 100
Yield loss 0.0 0.0 100
Defects in process 0.0 0.0 100
Total 217.5 100
0102030405060708090100
020406080
100120140160180200
Idling andminor
stoppage
Breakdown Yield loss Reducedspeed
Set-up andadjustment
Defects inprocess
Cum
mila
tive
Perc
enta
ge
Tim
e (m
inut
es)
Major stoppage loss Cummilative Percentage
Page 86
Data Collection and Analysis
71
From Table 5.12, it is seen that the most significant source of loss was idling and minor stoppage,
which is 82 % of the total loss. The second significant loss was breakdown stoppage. Here, though
the percentage of idling and the minor stoppage was increased from 71.6% to 82%, the stoppage
loss was reduced by 42.13% (from 375.5 minutes to 217.5 minutes) per 80 hours.
Page 87
Data Collection and Analysis
72
5.5.3 Calculation of OEE after reducing stoppage losses
Calculation of OEE after reducing stoppage losses is shown in Table 5.13.
Table 5.13 OEE calculation based on collected data
Day 1 2 3 4 5 6 7 8 9 10
A Running time per shift (mins) 480 480 480 480 480 480 480 480 480 480
B Downtime per shift (mins) 0 0 0 0 0 0 0 0 0 0
C Loading time per shift (A - B) (mins) 480 480 480 480 480 480 480 480 480 480
D Stoppage losses per shift (mins) 21.2 15.6 25.5 20 30 21.4 25 20.8 23 15
E Operating time per shift (C - D) (mins) 458.8 464.4 454.5 460 450 458.6 455 459.2 457 465
Defect amount (number) 64 65 52 61 51 48 53 50 45 49
F Output per shift (number) 3978 3775 3912 3865 3727 3685 3920 3798 3889 3919
G Rate of quality products (%) 98.39 98.28 98.67 98.42 98.63 98.70 98.68 98.68 98.84 98.75
H Ideal cycle time (mins) 0.11 0.11 0.11 0.11 0.11 0.11 0.11 0.11 0.11 0.11
I Actual cycle time (mins) 0.11 0.12 0.12 0.117 0.12 0.12 0.12 0.12 0.12 0.12
J Actual processing time (I * F) (mins) 453.49 441.68 449.88 452.21 436.06 438.52 450.8 448.16 447.24 454.60
K Operating speed rate (H/I * 100) (%) 95.70 93.25 94.87 93.25 93.25 91.68 94.87 92.46 94.87 94.05
L Net operating rate (J/E * 100) (%) 98.84 95.11 98.98 98.31 96.90 95.62 99.08 97.60 97.86 97.76
M Availability (E/C) * 100 (%) 95.58 96.75 94.69 95.83 93.75 95.54 94.79 95.67 95.21 96.88
N Performance Efficiency (K * L* 100) (%)
94.59 88.69 93.90 91.67 90.36 87.66 93.99 90.24 92.84 91.94
OEE M*N*G*100 (%) 88.90 84.33 87.73 86.46 83.55 82.66 87.89 85.19 87.37 87.96
Average OEE (%) 86.20
Page 88
Data Collection and Analysis
73
From Table 5.13, it is seen that OEE was increased to 86.20% from 75.09% after taking of
countermeasures.
5.5.4 Production and defective product of ring frame after reducing stoppage losses
Table 5.14 presents, output product, production and defective ring cops of ring frame after
reduction of stoppage losses.
Table 5.14 Output (ring cops), production and defective ring cops per shift
Due to taking of countermeasures that illustrates in the WWBLA, the stoppage time loss per shift
was reduced to 21.75 minutes (217.5/10) from 37.55 minutes (375.5/10) and consequently the
number of defective products was reduced to 54 pieces from 107 pieces per shift as well as output
per shift was increased to 3847 pieces from 3410 pieces.
Day
Output (ring cop/shift
Production (kg/shift)
Defective
(ring cop/shift)
1 3978 860.53 64
2 3775 765.60 65
3 3912 845.87 52
4 3865 853.71 61
5 3727 748.78 51
6 3685 732.55 48
7 3920 849.02 53
8 3798 778.02 50
9 3889 821.17 45
10 3919 828.92 49
Avg. 3847 806.62 54
Page 89
CHAPTER 6: RESULTS AND DISCUSSION
74
6.1 Introduction
During initial production, stoppage losses were accumulated and initial OEE was calculated that
indicates the existing condition of the machine. After studying and analyzing data, it was started
to implement TPM tool. After reducing stoppage losses by applying TPM tool, the calculated OEE
was increased from 74.91% to 87.14%.
6.2 Comparison of significant losses before and after stoppage losses
Finally idling and minor stoppage and breakdown losses were identified as significant losses which
impact on OEE was vital. After implementing Kaizen and training of operators, the stoppage losses
were reduced. Table 6.1 and Fig. 6.1 compare stoppage losses in two scenarios namely before
reducing stoppage and after reducing stoppage losses.
Table 6.1 Comparison of major six losses
Losses due to
Before reducing
stoppage losses
(mins)
After reducing
stoppage losses
(mins)
Idling and minor stoppage 252.5 178.4
Breakdown 83.0 31.1
Set-up and adjustment 31.5.0 8.0
Yield loss 8.5 0.0
Reduced speed 0.0 0.0
Defects in process 0.0 0.0
Total 375.5 217.5
Page 90
Results and Discussion
75
On the basis of major six losses, the significant stoppage losses were calculated. Before and after
applying Kaizen stoppage losses were 375.5 mins and 217.5 mins respectively. The losses time
was reduced to 158 mins for 10 shifts. Reduction of stoppage time loss was 47.4 mins per day.
Fig. 6.1 Major six losses status
6.3 Initial OEE of ring frame
Daywise OEE of ring frame presents in Fig. 6.2. OEE was calculated for ten consecutive days at
shift A (from 6:00 am to 2:00 pm) based on availability, performance efficiency and rate of quality
products and varies from 72% to 77%.
Fig. 6.2 Day wise OEE in existing condition
252.5
83
31.58.5 0 0
178.4
31.18 0 0 0
0
50
100
150
200
250
300
Idling andminor
stoppage
Breakdown Set-up andadjustment
Yield loss Reducedspeed
Defects inprocess
Tim
e (M
Inut
es)
Before reducing stoppage losses After reducing stoppage losses
75.44
72.98
74.58
76.7675.85
76.93
72.87
74.31
77.24
73.97
1 2 3 4 5 6 7 8 9 10
OEE
Day
Page 91
Results and Discussion
76
Here availability, performance efficiency, and rate of quality products were about 92%, 84%, and
97% respectively where according to suggestion, values should be more than 90%, 95%, and 99%
respectively.
6.4 OEE of ring frame after reducing stoppage losses
Fig. 6.3 presents the OEE of ring frame after reduction of stoppage losses. It is revealed that the
OEE increased significantly after applying TPM. It is due to the reduction of stoppage losses
15.8 minutes per shift.
Fig. 6.3 Day wise OEE after reducing stoppage losses
89.96
84.34
89.92 89.92
83.5582.67
90.07
85.19
87.81 87.96
78
80
82
84
86
88
90
92
1 2 3 4 5 6 7 8 9 10
OEE
Day
Page 92
Results and Discussion
77
6.5 Comparison of OEE before and after reducing stoppage losses
Fig. 6.3 presents the comparison of OEE of ring frame before reducing and after reducing stoppage
losses. It is seen that a remarkable increase in OEE due to the implementation of TPM. The OEE
was increased 74.91% to 87.14% for the reduction of stoppage time and taking of countermeasures.
Fig. 6.4 Changes of OEE due to reducing stoppage losses
Fig. 6.5 Changes of output/shift due to reducing stoppage losses
0
20
40
60
80
100
1 2 3 4 5 6 7 8 9 10
OEE
DayAfter Before
0
1000
2000
3000
4000
5000
1 2 3 4 5 6 7 8 9 10
Num
ber o
f rin
g co
ps
DayOutput (ring cop/shift) After Output (ring cop/shift) Before
Page 93
Results and Discussion
78
6.6 Comparison of output product
Fig. 6.5 presents the comparison of output product of ring frame before reducing and after reducing
of stoppage losses. From Fig. 6.5, it can be concluded that due to increasing of OEE, the output
product per shift is also increased. Due to train up of operators, they were more concerned about
the production and small maintenance activities. As a result, the idle number of spindles were
reduced. So output ring cops were increased by 11.36%.
Increase of output product per shift =(3847 − 3410)
3847 ⨯ 100 % = 11.36 %
6.7 Comparison of defective product
From Fig. 6.6, it is clear that defective product is reduced to 56 pcs from 107 pcs. It is due to taking
of countermeasures for reduction of stoppage losses of the machine. The operators were concerned
about the performance of the machine. When yarn breaks in any spindle, immediately they pieced
the yarn. So there was less chance to create defect shaped bobbin. As a result, production of
defective shaped ring cops was reduced by 49.53%.
Reduction of defective product per shift =(107 − 54)
107 ⨯ 100 % = 49.53 %
Fig. 6.6 Changes of defective number of ring cops due to reducing stoppage losses
0
20
40
60
80
100
120
140
1 2 3 4 5 6 7 8 9 10
Num
ber o
f def
ectiv
e ri
ng c
ops
Day
Defect (ring cop/shift) After Defect (ring cop/shift) Before
Page 94
Results and Discussion
79
6.8 Comparison of production
Fig. 6.7 Changes of production/shift due to reducing stoppage losses
From Fig. 6.7, it is revealed that due to the reduction of stoppage time and reduction of defective
number ring cops, the production rate (kg/shift) was increased by 23.93%.
Increase of production (kg) per shift =(806.62 − 613.63)
806.62 ⨯ 100 % = 23.93 %
6.9 Key Findings
During the research period, the author involved in this study did not notice any organized company
policy for the training of operators. The operators and maintenance staffs of the textile factory
were lacking the fundamentals theoretical knowledge to examine and reduce stoppage losses and
to evaluate the overall equipment efficiency (OEE). On-the-job and off- the -job training may
assist in developing the skill of operators and maintenance staffs.
In this study, the offline training program was arranged to develop the skill of operators. One pillar
of TPM, namely Kaizen, was implemented to the ring frame machine in the textile spinning
factory. As a result of applying Kaizen, the stoppage time was reduced considerably. Reduction of
stoppage time, in turn, decreased throughput time and increased machine performance. It is
mentioned here that the implementation of TPM strategy did not interfere with scheduled
maintenance rather it helped reduce the stoppage time losses and increased the productivity. It also
0
200
400
600
800
1000
1 2 3 4 5 6 7 8 9 10
Prod
uctio
n in
kg
per s
hift
DayProduction (kg/shift) After Production (kg/shift) Before
Page 95
Results and Discussion
80
gave the operators the opportunity to raise their skills on fundamentals background on maintenance
operations relevant to the application of total productive maintenance.
The stoppage time loss in the initial stage was 37.5 minutes per shift whereas, after implementation
of TPM, it was reduced to 21.75 minutes per shift. After analyzing the causes of the stoppage by
WWBLA worksheets, the root causes were identified and corrective actions were taken. Then
fishbone diagrams (Fig. 5.4 and Fig. 5.5) were constructed based on root causes and
countermeasures. The reduction of stoppage losses enhanced in decreasing the idle number of
spindles, in reducing of the defective shaped bobbin and an increase of production. The key results
of the application of Kaizen were as follows.
The reduction of defective shaped ring cops was 49.50%.
The increase of output ring cops was 11.36%.
The production was increased by 23.93%.
The Overall Equipment Efficiency (OEE) was increased from 75.09% to 86.20%.
Page 96
CHAPTER 7: CONCLUSION
81
7.1 Conclusion
Continuous improvement is an essential requirement for sustaining and gaining a competitive
advantage for manufacturing plant. As the textile spinning plant is a continuous processing unit,
the OEE depends on process stability as well as equipment performance. The objective of this
study was to examine the OEE by identifying the related losses in the ring frame. A pillar of TPM,
namely Kaizen, was applied to improve the OEE of the ring frame. The major six stoppage losses
of OEE that are responsible for efficiency loss in manufacturing plant are breakdown or equipment
failure, setup and adjustment, idling and minor stoppage, reduced speed, defects in process, and
reduced yield. The study revealed that Kaizen enhanced the productivity and improved the quality
of ring cop shaped. Before applying the TPM pillar, the initial OEE of the ring frame was 75.09%.
After applying the TPM pillar, the OEE was raised to 86.02%. Thus, this study justified the
application of Kaizen to improve the OEE of the ring frame.
7.2 Recommendations
As the textile spinning plant is a continuous processing unit, the OEE depends on process stability
as well as equipment performance. In this study, it is proven that TPM tool can be implemented to
improve OEE of ring frame section of any spinning industry within shortest possible time. The
study can further be extended in the following direction to shed more light on total productive
maintenance (TPM) from the viewpoint of textile and clothing industry.
Methodological extension: We only focused on the ring frame section of the spinning
factory. Kaizen could also be implemented in the winding, speed frame, draw frame and
carding section to improve the OEE of these sections.
Possible implementation of rest of the TPM pillars: Apart from implementing Kaizen,
other TPM pillars such as autonomous maintenance, planned maintenance and safety,
health and environment could possibly be implemented in the factory in question.
Possible implementation of green maintenance strategy: At present, implementing
green practices across all operations of an organization is gaining increased attention
among academics and practitioners. In this connection, greening the maintenance practices
Page 97
82
could benefit the enterprise to gain stakeholder's confidence and to sustain the competitive
edge.
Realization of Risk-sensitive total productive maintenance: An interesting extension
may be to include a risk-sensitive approach to total productive maintenance.
The research undertaken in this study could be applied to a variety of textile industry. Moreover,
apart from textile context, we hope the study would provide other categories of manufacturing
industries with background foundations and ideas, as well as practical and managerial insights for
applying TPM approach to improving the productivity in a real-world manufacturing setting.
Page 98
83
References
[1]. Fore, S., and Zuze, L., "Improvement of Overall Equipment Effectiveness through Total
Productive Maintenance," International Science Index of Science, Engineering and
Technology, Vol. 4 (1), pp. 320–328, 2010.
[2]. Trade Information of BGMEA, 2015-2016. Data Source Export Promotion
Bureau, Compiled by BGMEA. Retrieved from
http://www.bgmea.com.bd/home/pages/TradeInformation on 03 June 2016.
[3]. Chatterjee, K., Bhattacharyya, S., and Gangopadhyay, R., “Total productive maintenance in
spinning industry,” Retrieved from
http://www.indiantextilejournal.com/articles/FAdetails.asp?id=4594 on 12th May 2016.
[4]. Tsarouhas, P. H., "Evaluation of overall equipment effectiveness in the beverage industry: a
case study," International Journal of Production Research, Vol. 51(2), pp. 515–523, 2013.
[5]. Muchiri, P., and Pintelon, L., "Performance measurement using overall equipment
effectiveness (OEE): literature review and practical application discussion," International
Journal of Production Research, Vol. 46(13), pp. 3517–3535, 2008.
[6]. Arturo Garza‐Reyes, J., Eldridge, S., Barber, K. D., and Soriano‐Meier, H.,"Overall
equipment effectiveness (OEE) and process capability (PC) measures," International Journal
of Quality & Reliability Management, Vol. 27(1), pp. 48–62, 2010.
[9]. Aziz, I., Karim, S., and Hossain, M., "Effective Implementation of Total Productive
Maintenance and Impacts on Breakdown Time and Repair & Maintenance – A Case Study
Of A Printing Industry In Bangladesh. Proceedings of the Global Engineering, Science and
Technology Conference 2012, pp. 1–9.
[8]. Kiran, M., Mathew, C., and Kuriakose, J., "Root Cause Analysis for Reducing Breakdowns in
a Manufacturing Industry," International Journal of Emerging Technology and Advanced
Engineering, Vol. 3 (1), pp. 211–216, 2013.
Page 99
84
[9]. Paropate, R., and Sambhe, R., "The Implementation and Evaluation of Total Productive
Maintenance–A Case Study of Mid-sized Indian Enterprise," International Journal of
Application or Innovation in Engineering and Management, Vol. 2(10), pp. 120–125, 2013.
[10]. Graisa, M. & Al-Habaibeh, A. “An Investigation into current production challenges facing
the Libyan cement industry and the need for innovative total productive maintenance (TPM)
strategy,” Science and Technology Journal, Vol. 22(4), pp. 541-558, 2011.
[11] Hasin A. A. (2011). Quality Control Management. Bangladesh Business Solutions, Dhaka.
[12]. Chand, G., and Shirvani, B., “Implementation of TPM in cellular manufacture,” Journal
of Materials Processing Technology, Vol. 103(1), 149–154, 2000.
[13]. Lazim, H. M., and Ramayah, T., “Maintenance strategy in Malaysian manufacturing
companies: a total productive maintenance (TPM) approach,” Business Strategy Series, Vol.
11(6), pp. 387–396, 2010.
[14]. Lazim, H. M., Salleh, M. N., Subramaniam, C., and Othman, S. N., “Total productive
maintenance and manufacturing performance: Does technical complexity in the production
process matter?” International Journal of Trade, Economics and Finance, Vol. 4(6), pp. 380–
383, 2013.
[15]. Jonsson, P., and Lesshammar, M., “Evaluation and Improvement of manufacturing
performance measurement systems - the role of OEE,” International Journal of Operations
& Production Management, Vol. 19(1), pp. 55–78, 1999.
[16]. Patel, V. B., and Thakkar, H. R., “Review Study on Improvement of Overall Equipment
Effectiveness through Total Productive Maintenance,” Journal of Emerging Technologies
and Innovative Research, Vol. 1(7), pp. 720–726, 2014.
[17]. Venkatesh, J., "An Introduction to Total Productive Maintenance ( TPM )," The Plant
Maintenance Resource Center, pp. 3–20, 2007.
Page 100
85
[18]. Roberts, J., “Total productive maintenance (TPM),” The Technology Interface, The
Electrical Journal of Engineering and Technology Fall 1997, Vol. 10(2), 1997. [19]. Costa, S. E. G. Da, and Lima, E. P. De., "Uses and misuses of the “overall equipment
effectiveness” for production management," IEEE International Engineering Management
Conference, 2002, pp. 816–820.
[20]. Lalkiya, M. R., "Optimizing and analyzing overall equipment effectiveness through TPM
approach: A case study in cement industry," Master in Engineering (Production) Thesis,
Department of Mechanical Engineering, Gujarat Technological University, India, 2015.
[21]. Ben-Daya, M., Duffuaa, S., Raouf, A., Knezevic, J. and Ait-Kadi, D., O. (2009). Handbook
of Maintenance Management and Engineering. Springer Dordrecht Heidelberg, London.
[22]. Wakjira, M. W., and Singh, A. P., "Total Productive Maintenance A Case Study," Global
Journal of Researches in Engineering, Vol. 12(1), pp. 25–23, 2012.
[23]. Ahuja, I. P. S., and Khamba, J. S., "Total productive maintenance: literature review and
directions," International Journal of Quality & Reliability Management, Vol. 25(7), pp. 709–
756, 2008.
[24]. Katkamwar, S. G., Wadatkar, S. K., and Paropate, R. V., "Study of Total Productive
Maintenance & Its Implementing Approach in Spinning Industries," International Journal of
Engineering Trends and Technology, Vol. 4(5), pp. 1750–1754, 2013.
[25]. Nakajima, S. (1989). Introduction to TPM: Total Productive Maintenance. Productivity
Press, Cambridge MA, UK. [26]. Lungberg, O., “Measurement of overall equipment effectiveness as a basis for TPM
Activities,” International Journal of Operation & production Management, Vol. 18 (5), pp.
495-507, 1998.
Page 101
86
[27]. Rajput, H. S., and Jayaswal, P., "A Total Productive Maintenance ( TPM ) Approach To
Improve Overall Equipment Efficiency," International Journal of Modern Engineering
Research (IJMER), Vol. 2(6), pp. 4383–4386, 2012.
[28]. Mâinea, M., Dutǎ, L., Patic, P. C., and Cǎciulǎ, I., "A method to optimize the Overall
Equipment Effectiveness," IFAC Proceedings Volumes (IFAC-PapersOnline) 2010, pp.
237–241.
[29]. Benjamin, S. J., Marathamuthu, M. S. and Murugaiah, U., "The use of 5-WHYs
technique to eliminate OEE’s speed loss in a manufacturing firm," Journal of Quality in
Maintenance Engineering, Vol. 21(4), pp. 29–39, 2009.
[30]. Karuppusami, G., and Gandhinathan, R., "Pareto analysis of critical success factors of
total quality management: A literature review and analysis," The TQM Magazine, Vol. 18(4),
pp. 372–385, 2006.
[31]. Masud, A.K.M., Khaled, A-A., Jannat, S., Khan, A.K.M. and Sajedul, A., "Total
productive maintenance in RMG sector," Journal of Mechanical Engineering, Vol. 37,
pp. 62–66, 2007.
[32]. Mahto, D., and Kumar, A., "Application of root cause analysis in improvement of
product quality and productivity," Journal of Industrial Engineering and Management, Vol.
1(2), pp. 16–53, 2008.
[33]. Lawrence, C. A. (2003). Fundamentals of Spun Yarn Technology. CRC Press, Boca Raton
London New York Washington D.C.
[34]. Gupta, N., "An Application of DMAIC Methodology for Increasing the Yarn Quality in Textile
Industry," IOSR Journal of Mechanical and Civil Engineering (IOSR-JMCE), Vol. 6(1), pp. 50–65,
2013.
[35]. Klein, W. (2012). The Technology of Short Staple Spinning. The Textile Institute,
Manchester, UK.
Page 102
87
[36]. Vijay Kumar, T. (2007). Report on experience with Rieter C 60 Card Link. 19, pp. 3-6. [37]. Cheng, Y. H. (2005). The improvement of assembly efficiency of military product by six
Sigma. NCUT Thesis Archive, Taiwan.
[38]. Lord, P. R. (2003). Hand Book on Yarn Production. The Textile Institute, Cambridge UK. [39]. Niijjaawan, N. and Niijjaawan, R. (2010). Modern Approach to Maintenance in Spinning.
Woodhead Publishing Ltd., India.
[40]. Benefits of Training & Development in an Organization". Kashmir Observer.
Retrieved on 31-03-2016.
Page 103
88
Appendices
Appendix A: Training program for operators
Training program for operators
On
“Improvement of performance of ring frame”
Program Schedule
Sl. No.
Date
Time
Subject/topics
Level of participation
Total participants
1.
7th
August 2015
3:30 PM- 5:00 PM
1.Basic operations of ring frame
2.Important machine parts and their functions
3.Improvement of the productivity of ring frame
4.Improvement of the quality of yarn
Supervisory staff and operators
6
2.
8th August
2015
3:30 PM- 4:30 PM
1.Basic maintenance activities that should be done by an operator
2. Responsibilities of an operator in the ring frame section
Supervisory staff and operators
6
Page 104
89
Appendix B: Data collection sheet
Data Collection Sheet
Date: Ring Frame No.: Shift: A (6:00 AM - 2:00 PM) Yarn Count/Lot: Yarn TPI: Number of spindle/ frame: Number of doff/shift: Idle spindle/doff: Idle spindle/shift: Ideal doffing time: Actual doffing time: Ideal cycle time: Actual cycle time: Number of defect shaped bobbin per shift: Losses per shift
SL.
No.
Causes of stoppage Frequency Time Losses
(mins)
Total Time
Losses (mins)
Types of loss
1
2
3
4
5
Remarks: