160
1 IMPROVING AGRONOMIC MANAGEMENT FOR SEEDLESS WATERMELONS Horticulture Australia Project Number: VX02026 Final Report
| Date post: | 07-Jun-2018 |
| Category: |
Documents |
| Upload: | truongnguyet |
| View: | 222 times |
| Download: | 0 times |

1
IMPROVING AGRONOMIC MANAGEMENT FOR SEEDLESS WATERMELONS
Horticulture Australia Project Number: VX02026
Final Report

2
Horticulture Australia Project Number: VX02026
Project Leader
Dr. Gordon S. Rogers AHR CropScience
Po Box 3114 BUNDEENA NSW 2230
Key Personnel
Funding Sources
This project is jointly funded by the Select Melon Association, OneHarvest and Horticulture Australia Limited.
Funding by both the Industry and HAL is gratefully acknowledged by
AHR CropScience. Date: June 2007 Disclaimer: Any recommendations contained in this publication do not necessarily represent current HAL Limited policy. No person should act on the basis of the contents of this publication, whether as to matters of fact or opinion or other content, without first obtaining specific, independent professional advice in respect of the matters set out in this publication.
Gordon Rogers – AHR Brad Giggins – AHR
Lynn Christie - AHR
Darryl O’Leary –SMA Emily Martyn - SMA
Henrik Christensen – OneHarvest Robert Gray – OneHarvest
IMPROVING AGRONOMIC MANAGEMENT FOR SEEDLESS WATERMELONS

3
IMPROVING AGRONOMIC MANAGEMENT FOR SEEDLESS WATERMELONS ...... 1 Final Report ........................................................................................ 1 Horticulture Australia .......................................................................... 2 Media Summary ................................................................................. 5
Water Management...........................................................................................5 Plant Density and Pollination.............................................................................5 Variety Assessment...........................................................................................6
Technical Summary............................................................................ 7 Water Management...........................................................................................7 Plant Density and Pollination.............................................................................7 Variety Assessment...........................................................................................9
Introduction....................................................................................... 10 Yield ................................................................................................................10 Pollination and Density....................................................................................11
Growth Regulators .................................................................................................. 13 Fruit Quality .....................................................................................................14
1. Variety Assessment...................................................................... 16 1.1 Smaller scale screening trials (1 row x 10m x 4 reps) ...............................16
Douglas Daly, NT - June (2003).............................................................................. 16 Bowen, Qld - Spring 2003 ....................................................................................... 22 Chinchilla - November/December 2003 .................................................................. 27 Victoria – Summer 2003-2004................................................................................. 30
1.2 Larger trials that came out of initial smaller trials 8 rows x 1 bay x 20m or more ................................................................................................................34
Mataranka – Winter 2005........................................................................................ 34 Chinchilla – Summer 2005 ...................................................................................... 37 Condoblin – 2005 .................................................................................................... 41 Condoblin – 2006 .................................................................................................... 44 Discussion - Variety................................................................................................. 45
2. Nutrition Trials .............................................................................. 46 2.1 NPK & calcium trials at various locations ..................................................46
Douglas Daly, NT - June (2003).............................................................................. 46 Bowen, Qld - Autumn 2003 ..................................................................................... 50 Chinchilla - November/December 2003 .................................................................. 55 Victoria – Summer 2003-2004................................................................................. 59 Mataranka 2004 ...................................................................................................... 63 Chinchilla – Summer 2005 ...................................................................................... 66 Condoblin - 2005..................................................................................................... 69
3. Foliar Trials................................................................................... 74 3.1 CPPU – growth regulator...........................................................................74
Chinchilla - November/December 2003 .................................................................. 74 3.2 GA3 – Bowen and Chinchilla....................................................................76
Bowen, Qld - Autumn 2003 ..................................................................................... 76

4
Chinchilla - November/December 2003 .................................................................. 80 3.3 Potassium & NBX......................................................................................83
Victoria – Summer 2003-2004................................................................................. 83 4. Irrigation ....................................................................................... 86
4.1 Irrigation Trials...........................................................................................86 Bowen, Qld - Autumn 2003 ..................................................................................... 86 Bowen, Qld - Spring 2003 ....................................................................................... 90 Chinchilla - November/December 2003 .................................................................. 94 Victoria – Summer 2003-2004................................................................................. 98 Condoblin – 2005 .................................................................................................. 102 Condoblin – 2006 .................................................................................................. 108
4.2 Irrigation Monitoring................................................................................113 Douglas Daly, NT - June (2003)............................................................................ 113
Irrigation Discussion ....................................................................... 121 5. Pollination................................................................................... 122
5.1 Pollinator ratios........................................................................................122 Douglas Daly, NT - June (2003)............................................................................ 122 Robinvale, Victoria – Summer 2003-2004............................................................. 127
5.2 Direct seeded and transplanted pollinators ............................................131 Chinchilla - November/December 2003 ................................................................ 131
Conclusion.....................................................................................................134 5.3 Summary of key density and pollinator trials ..........................................135
Introduction............................................................................................................ 135 Trial 1. Density and Pollinator ratios - Bowen (Autumn)...................................... 135 Trial 2. Density trials at Chinchilla over three seasons: 2003, 2004, 2005........... 137 Trial 3. Chinchilla – 2004...................................................................................... 139 Trial 4. Chinchilla – 2005...................................................................................... 141 Trial 5. Mataranka 2005 ....................................................................................... 143 Trial 6. Emerald 2005........................................................................................... 145 Trial 7. Condoblin – 2006 ..................................................................................... 147 Discussion – Plant density and Pollination............................................................ 149
Discussion and Recommendations ................................................ 151 Water Management.......................................................................................151 Plant Density and Pollination.........................................................................152 Variety Assessment.......................................................................................154 References ....................................................................................................156
Technology Transfer....................................................................... 159 Articles and Conference Presentations ................................................................. 159 Regular project updates and brief articles............................................................. 160 Contributions to the SMA newsletter: .................................................................... 160 Review Meetings................................................................................................... 160

5
Media Summary A project was conducted over 4 years with the main objective of maximizing the yield of seedless watermelons while maintaining adequate quality. This objective was achieved by: 1. Formulating a water management strategy that would deliver maximum yields over the range of environment where seedless watermelons are grown in Australia. 2. Gaining a clear understanding of how use plant density and pollinator ratio to maximize yield in the main growing regions. 3. Determining the best varieties for each of the major growing regions in Australia.
Water Management The highest yields and quality were achieved by maintaining the plants free of water stress from establishment to final harvest. A number of guiding principles were developed that could be used as the basis of an irrigation management strategy. These were:
1. Fully wet the soil profile in the plant row at or before establishment,. 2. After planting, allow roots to grow out into the moist soil profile,
encouraging a large root system. During this time, water only when required to stop the plant going into water stress, and then irrigate to fully rewet the soil profile.
3. Avoid frequent short irrigations. 4. After flowering, irrigate when soil approache the refill point and irrigate to
field capacity. 5. Continue this strategy until the end of harvest.
Plant Density and Pollination It was discovered that the yield of seedless watermelon crops were limited by either pollination or by the number fruiting sites per ha, and that this depended on the region, time of year and levels of crop inputs (water and fertilizer).

6
Where the crops were limited by pollination (e.g. Chinchilla (Qld), Mataranka (NT), Douglas Daly, NT and Bowen, Qld) the best yield were achieved by:
• Changing seedless:pollinator: plant ratio from 3:1 to 2:1 • Arranging pollinators in their own row rather than scattering the pollinators
through the planting • Using a pollinating variety that produces more flowers than the standard
Red Tiger • Fine-tuning the timing of pollinators with seedless watermelon plants. • Increasing bee populations • Using bee attractants
Where yield was limited by fruiting sites per ha: (e.g. Emerald (Qld) and Condoblin (NSW) practices which increased the number of seedless watermelon plants and reduced competition from pollinator plants increased yield, i.e:
• Reducing the number of pollinators from 3:1 to 4:1 • Increasing plant density provided the level of inputs (water and nutrient)
was increased to match • Direct seeding the pollinators rather than establishing them via transplants
The other important finding was that establishing pollinators by direct seeding increased yield significantly compared to establishing seedlings by transplanting. Seedling at transplanting or 4 days after transplanting the seedless plants gave the highest yield. In Mataranka, the grower practice is to direct seed 4-7 days before transplanting their seedless watermelon plants, but the optimal timing may change during the year.
Variety Assessment The most promising new varieties (compared to Shadow) were: Variety Seed company Nightshade Jarit Storm SPS 601-2 SPS Classic Jarit Royal armada Abbott and Cobb JTWM 755 very large fruit with good shelf life: processing?
Jarit
Most varieties firmer than Shadow: Classic, RM1290 and Royal Armada the firmest.

7
Technical Summary The main focus of the project was to maximize yield while maintaining adequate quality (i.e. within the One Harvest specification for seedless watermelon). The most promising strategies for achieving this objective were:
o Water Management: Formulating a water management strategy and testing this against the current best practice
o Plant Density and Pollination: Gaining a clear understanding of
how use plant density and pollinator ratios to maximize yield in the main growing regions
o Varieties: Determining the best variety(ies) for each of the major
growing regions in Australia
Water Management It was not possible to demonstrate that imposing a water stress resulted in either an increase in yield, fruit size or fruit quality at any stage of the crop cycle therefore, the following recommendations were developed:
• Fully wet the soil profile in the plant row at or before establishment,. • After planting, allow roots to grow out into the moist soil profile,
encouraging a large root system. During this time, water only when required to stop the plant going into water stress, and then irrigate to fully rewet the soil profile.
• Avoid frequent short irrigations. • After flowering, irrigate when soil approaches the refill point and irrigate to
field capacity. • Continue this strategy until the end of harvest.
Plant Density and Pollination This work resulted in the identification of two types of sites:
1. Yield limited by pollination 2. Yield limited by fruiting sites per ha.

8
Yield limited by pollination: There were 4 sites where yield was consistently limited by pollination. These were Chinchilla (Qld), Mataranka (NT), Douglas Daly, NT and Bowen, Qld. Treatments which improved pollination resulted in increases in yield:
• Changing seedless:pollinator plant ratio from 3:1 to 2:1 • Arranging pollinators in their own row rather than scattering the pollinators
through the planting • Using a pollinating variety that produces more flowers than the standard
Red Tiger (e.g. Blooming Brilliant [Jarit seeds]; Taki seed pollinator) • Fine-tuning the timing of pollinators with seedless watermelon plants
Strategies which are likely to increases yields in these areas include:
• Increasing bee populations • Using bee attractants • Increasing pollinator ratio and grouping pollinators in rows
Yield limited by fruiting sites per ha: Yield from certain sites did not respond to increasing pollination but rather to increasing the number of seedless watermelon plants: this was interpreted as responding to more fruiting sites. The two sites that responded in this way were Emerald (Qld) and Condoblin (NSW). Both had high level of fertilizer inputs, including supplemental calcium, plants grown with adequate water, summer production and high temperatures and an adequate population of bees which were actively foraging in the crop. Treatments which increased the number of seedless watermelon plants and reduced competition from pollinator plants increased yield: These treatments were:
• Reducing the number of pollinators from 3:1 to 4:1 • Increasing plant density provided the level of inputs (water and nutrient)
was increased to match • Direct seeding the pollinators rather than establishing them via
transplants.
Direct Seeding Pollinators: In all the summer trials, where establishing pollinators by direct seeding was tested, it increased yield significantly compared to establishing seedlings by transplanting. Seeding at transplanting or 4 days after transplanting the seedless plants gave the highest yield but the optimal timing may change during the year.
9
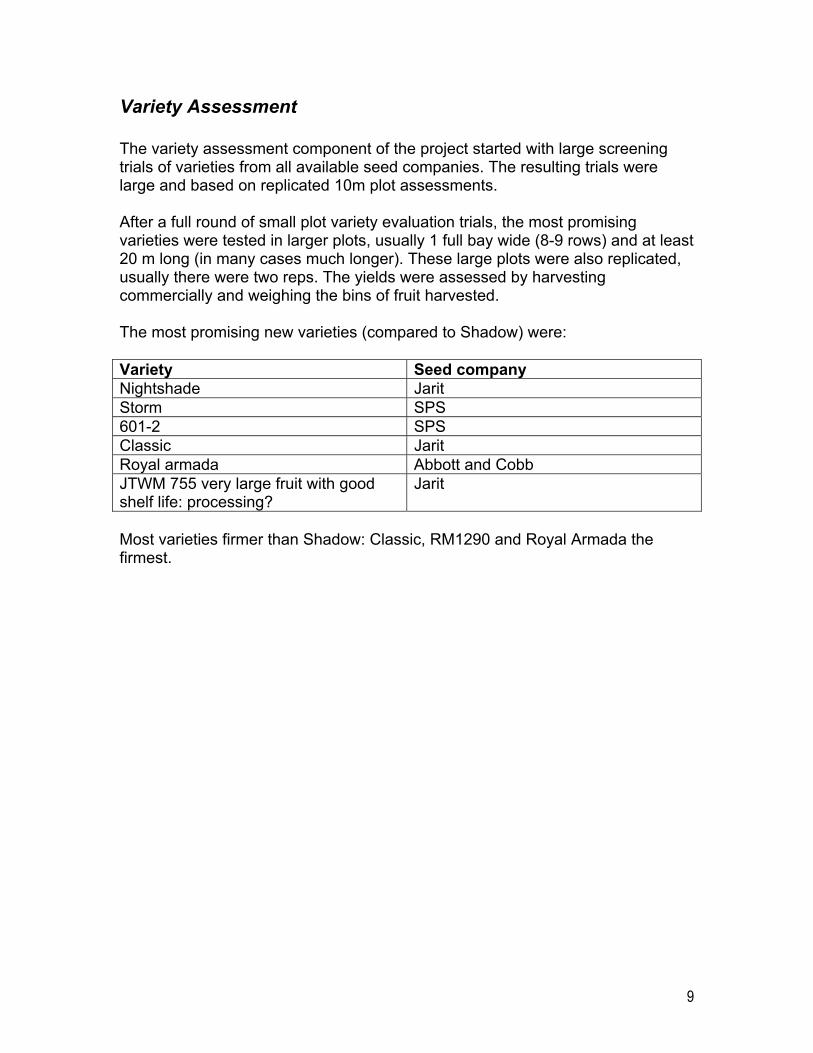
Variety Assessment The variety assessment component of the project started with large screening trials of varieties from all available seed companies. The resulting trials were large and based on replicated 10m plot assessments. After a full round of small plot variety evaluation trials, the most promising varieties were tested in larger plots, usually 1 full bay wide (8-9 rows) and at least 20 m long (in many cases much longer). These large plots were also replicated, usually there were two reps. The yields were assessed by harvesting commercially and weighing the bins of fruit harvested. The most promising new varieties (compared to Shadow) were: Variety Seed company Nightshade Jarit Storm SPS 601-2 SPS Classic Jarit Royal armada Abbott and Cobb JTWM 755 very large fruit with good shelf life: processing?
Jarit
Most varieties firmer than Shadow: Classic, RM1290 and Royal Armada the firmest.

10
Introduction Seedless watermelon production is rapidly expanding in Australia in response to strong consumer demand for the product. The growing of this specialised commodity presents the industry with some challenges to which they have not been exposed in the production conventional seeded watermelon. The production of seedless watermelonshas increased markedly over the past several years, and as a consequence there are many new growers in the industry trying to produce quality melons for a discerning market. Consumers pay a premium for seedless melons, and expect high quality. Growers, market agents, retailers and consumers are experiencing problems in the following areas:
• Low yields of around 30 tonnes/ha • The need to plant 25-33% of watermelons in a field as seeded melons to
pollinate the triploid seedless watermelon plants • Internal cracking and hollowness • Poor internal flesh colour including light red flesh and yellow centres; • Black seeds in fruit
Yield The main objective in relation to yield was to increase yields from 30t/ha which was the average at the start of the project. Some of the key research in relation to yield maximisation include the following:
• Fruit yield can reportedly be maximised by minimising water stress e.g. by irrigating when cumulative pan evaporation reaches 20mm provided adequate nitrogen and potassium are supplied (Khade et al, 1995). In addition, vegetative growth and early and total yields can be maximised by growing plants on polyethylene mulch in combination with trickle irrigation. (Bhella, 1988).
• Irrigation intensity can affect watermelon yield. High levels of available
water for the first 10 days after flowering followed by irrigation at 8-day intervals promotes a high yield of quality watermelon fruits (MyeongWhoon et al, 1997).
• Excessive nitrogen appears to stimulate vegetative growth whereas
insufficient nitrogen reduces potential yields. Newer varieties may be more
11
efficient at extracting and using available soil nitrogen than older varieties. Optimum nitrogen application rates need to be determined locally.
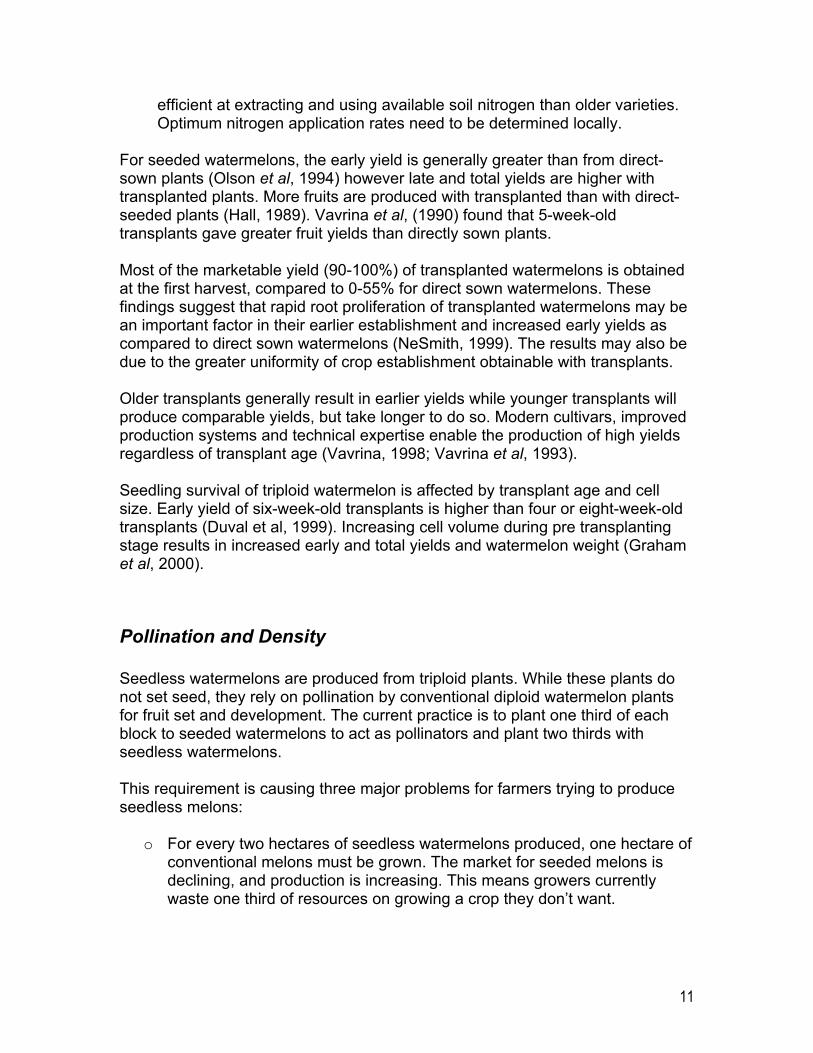
For seeded watermelons, the early yield is generally greater than from direct-sown plants (Olson et al, 1994) however late and total yields are higher with transplanted plants. More fruits are produced with transplanted than with direct-seeded plants (Hall, 1989). Vavrina et al, (1990) found that 5-week-old transplants gave greater fruit yields than directly sown plants. Most of the marketable yield (90-100%) of transplanted watermelons is obtained at the first harvest, compared to 0-55% for direct sown watermelons. These findings suggest that rapid root proliferation of transplanted watermelons may be an important factor in their earlier establishment and increased early yields as compared to direct sown watermelons (NeSmith, 1999). The results may also be due to the greater uniformity of crop establishment obtainable with transplants. Older transplants generally result in earlier yields while younger transplants will produce comparable yields, but take longer to do so. Modern cultivars, improved production systems and technical expertise enable the production of high yields regardless of transplant age (Vavrina, 1998; Vavrina et al, 1993). Seedling survival of triploid watermelon is affected by transplant age and cell size. Early yield of six-week-old transplants is higher than four or eight-week-old transplants (Duval et al, 1999). Increasing cell volume during pre transplanting stage results in increased early and total yields and watermelon weight (Graham et al, 2000).
Pollination and Density Seedless watermelons are produced from triploid plants. While these plants do not set seed, they rely on pollination by conventional diploid watermelon plants for fruit set and development. The current practice is to plant one third of each block to seeded watermelons to act as pollinators and plant two thirds with seedless watermelons. This requirement is causing three major problems for farmers trying to produce seedless melons:
o For every two hectares of seedless watermelons produced, one hectare of conventional melons must be grown. The market for seeded melons is declining, and production is increasing. This means growers currently waste one third of resources on growing a crop they don’t want.

12
o The agronomic requirements and phenology of seeded and seedless watermelons are different, resulting in problems synchronising the availability of pollen from the pollinators with receptive female flowers in the seedless plants.
o The correct environmental conditions for pollination must prevail and
pollinating insects must be available during pollination for adequate fruit set of seedless melons. Effective pollination is critical in melon production and is directly related to yield, fruit size, fruit shape and sweetness (% Brix) and probably internal flesh colour. If the pollination of seedless melons by seeded types is not optimal, then further reductions in yield and quality compound the losses already caused by needing devoting one third of the production area to a pollinating variety in the first place.
Planting Density Planting density affects overall yield but only has a minor effect on individual fruit weight. In general, decreasing plant density increases fruit weight and fruit set. As planting density is increased, the number of watermelon fruit per plant decline, but individual fruit size is mostly unaffected (Duthie et al, 1999). Nerson et al, (1994) found that increasing the plant population from 3000 to 12 000 plants/ha significantly increased fruit number per unit area and only slightly decreased mean fruit weight. Sanders et al, (1999) found highest yields of marketable fruits were obtained using a planting density of one plant per 0.4 – 0.9 m2 and polyethylene mulch and optimum planting density without polyethylene mulch was 1 plant per 1 m2. Lee et al, (1993) investigated a range of planting densities and found the highest yield and best fruit quality (size, colour, etc.) was obtained at a spacing of 200 x 40 cm compared to 100 x 400, 100 x 60, 200 x 60 or 300 x 50 cm spacings. NeSmith, (1993) found marketable fruit yields increased by 29-34% as plant spacing decreased from 2.2 to 0.9 m. Average fruit weight responded only slightly to decreased plant spacing. There is also a relationship between fruit quality and planting density. Fruit colour, flesh quality and fruit soluble solids improve as planting density is decreased (SoonGi et al, 1997).

13
Pollination The use of bee attractants have been evaluated for watermelons. Bee-Scent® and Beeline® do not appear to improve bee visitations and do not improve watermelon yield (Schultheis et al, 1994, Manyard et al, 1994). Bee-Here® however may increase early yield and average fruit weight over the whole season (Manyard et al, 1992). Storing watermelon pollen prior to hand pollination can result in higher fruit soluble solids content compared to pollinating with fresh pollen (Kim, 1991). Watermelons derived from pollination of the first flower are smaller than those from the second flower, but there is no difference between flowers in total soluble solid content (Ohkubo et al, 1997).
Growth Regulators Inducing Parthenocarpic Fruits In the case of seedless watermelons, pollination is needed to trigger the production of hormones in the watermelon plant which in turn regulate development of the fruit. It is possible to supply the necessary hormones directly to the plant, thereby removing the requirement for triploid seedless watermelon plants to be pollinated. There is significant international research where is has been proven that excellent quality seedless watermelons can be produced without pollination (Loy and Allen, 1996; Hayata et. al., 1994; Hayata et. al., 1995; Hayata et.al., 2001; XinXian et. al., 2000; Hayata et.al., 2000a; Hayata et.al., 2000b). Sugar content of parthenocarpic fruits produced by CPPU (forchlorfenuron) treatment is similar to that of pollinated fruits, but fruit set is significantly increased (Hayata et al, 1995). Growth of CPPU-treated, pollinated, and non-pollinated fruits increased significantly compared with control fruits during the first 10 days after treatment, but growth slowed after this period, resulting in fruits equal in size to the controls by harvest. CPPU application did not affect the soluble solids content of pollinated fruits (Hayata (2) et al, 1995). No differences in fruit weight, sugar content and outer flesh thickness were observed between CPPU-treated fruits and fruits obtained after pollination (Um et al, 1995).

14
Other Plant Growth Regulators There is data to suggest that currently registered plant growth regulators such as GA, BA (GA+BA), auxins (IBA, IAA) have beneficial effects on fruit set, especially when pollination has been sub-optimal. Tomatotone (50%) combined with BA (1000 or 2000 ppm) and/or GA3 (1000 ppm) can improve fruit set (Pak, 1993). Yield of watermelon cultivars can be increased by treatment with uniconazole. Seedlings however remain stunted and fail to fully recover from the dwarfing treatment (Dunlap et al, 1991).
Fruit Quality There appears to be a relationship between the calcium level in the leaf, and Brix or sucrose content in watermelon fruit (Hakerlerer et al, 1999). Increasing the calcium supplied to hydroponically-grown watermelons in the nutrient solution can increase the soluble solids in fruit at calcium concentrations up to 200 mg/L (SoonGi et al, 1999). The question of how to supply calcium effectively is less clear. Calcium applied directly to the soil has been shown to increase the leaf calcium content, but may not affect fruit soluble solids concentration (Scott et al, 1993). Calcium applied as gypsum to the soil does not affect flesh redness (Scott et al, 1993) however this may be due to the calcium added in this way not being readily available to the plant. Watermelons have a high potassium requirement. Increases in yield can be shown with application rates of potassium up to 180 kg/ha. There is some suggestion that highest yields are obtained when the crop requirement is applied in the base, whereas split applications may increase fruit sugar levels (HongXun et al, 1995). Fruit cracking of watermelons occurs most frequently when a continuous supply of irrigation is applied after flowering. Irrigating every eight days starting ten days after flowering resulted in the lowest fruit cracking and the highest yields. (MyeongWhoon et al, 1997).
15
The project was designed to develop techniques that would maximise yield of seedless watermelons over a range of climatic regions while maintaining high fruit quality. This was achieved by a range of experimenters based around:
o Irrigation management o Variety evaluations o Crop nutrition o Evaluation of growth regulators o Optimising planting density and pollinator ratios o Evaluation of direct seeding v’s transplant establishment of pollinators

16
1. Variety Assessment The variety assessment component of the project started with large screening trials of varieties from all available seed companies. The resulting trials were large and based on replicated 10m plot assessments. This approach was effective at identifying new genetics with potential for further evaluation, based mainly on qualitative fruit quality and qualitative plant attributes.
1.1 Smaller scale screening trials (1 row x 10m x 4 reps)
Douglas Daly, NT - June (2003) Aim Current Seedless watermelon production for the SMA is based around an exclusive variety “Shadow”. Variety assessments concentrated on comparing flavour, Brix levels, lycopene concentration, aesthetics, flesh characteristics etc, of “Shadow” with other varieties. Method A total of 36 varieties of seedless watermelon were direct seeded into 7m plots (consisting of eight 0.85m spaced holes). Pollinators were planted in each plot throughout the trial at a ratio of 3:1. Two replicates of each variety were planted. Table 1: Varieties planted at Gavin Hopkins 2003 AHR Code Variety Supplier AHR Code Variety Supplier W3 1228 Syngenta W21 1246 Syngenta W4 1229 Syngenta W22 1247 Syngenta W5 1230 Syngenta W23 1248 Syngenta W6 1231 Syngenta W24 1249 Syngenta W7 1232 Syngenta W25 1250 Syngenta W8 1233 Syngenta W26 1251 Syngenta W9 1234 Syngenta W27 1252 Syngenta W10 1235 Syngenta W28 1253 Syngenta W11 1236 Syngenta W29 1254 Syngenta W12 1237 Syngenta W30 RZ2003 Rjik Zwaan W13 1238 Syngenta W31 LX-606-1 SPS W14 1239 Syngenta W32 2580 SPS

17
W15 1240 Syngenta W33 JEWEL SPS W16 1241 Syngenta W34 033-2 SPS W17 1242 Syngenta W35 548-1 SPS W18 1243 Syngenta W36 003-3 SPS W19 1244 Syngenta W37 601-2 SPS W20 1245 Syngenta W38 602-2 SPS Measurements: vine vigour, disease resistance, yield, fruit size and number, flesh quality (Brix, colour, flavour, texture); internal characteristics (black seeds, cracking) etc. Results Individual fruit weights of all varieties sown were equivalent to, or significantly lower than “Shadow”.
Variety Trial - Fruit Weight
0.00
1.00
2.00
3.00
4.00
5.00
6.00
7.00
8.00
9.00
1228
1229
1230
1231
1232
1233
1234
1235
1236
1237
1238
1239
1240
1241
1242
1243
1244
1245
1246
1247
1248
1249
1250
1251
1252
1253
1254
RZ2
003
LX-6
06-1
2580
JEW
EL
033-
254
8-1
003-
360
1-2
602-
2S
hado
w
Variety
Frui
t Wei
ght
(kg)
Fig 1. Douglas Daly fruit weight.

18
Total yield of most varieties was also significantly lower than “Shadow”, however some varieties did produce higher yields, most notably 1232, 1239, 1241, 1242, 1246 and “Jewel” Varieties with unacceptably low yields were 1231, 1236, 1244 and LX 601-1.
Variety Trial - Yield
0.00
5.00
10.00
15.00
20.00
25.00
30.00
35.00
40.00
45.00
50.00
55.00
1228
1229
1230
1231
1232
1233
1234
1235
1236
1237
1238
1239
1240
1241
1242
1243
1244
1245
1246
1247
1248
1249
1250
1251
1252
1253
1254
RZ2
003
LX-6
06-1
2580
JEW
EL
033-
254
8-1
003-
360
1-2
602-
2S
hado
w
Variety
Yiel
d (t/
ha)
Fig 2. Douglas Daly watermelon yield.

19
Fruit Brix data is highly variable in this trial; however there were significantly sweeter varieties than “Shadow”. Significantly sweeter varieties were: 1238, 1239, 1245, 1246, RZ 2003, and Jewel. Only variety 1243 had significantly lower Brix than “Shadow”
Variety Trial -Average Brix %
10.00
10.50
11.00
11.50
12.00
12.50
13.00
13.50
14.00
14.50
15.00
1228
1229
1230
1231
1232
1233
1234
1235
1236
1237
1238
1239
1240
1241
1242
1243
1244
1245
1246
1247
1248
1249
1250
1251
1252
1253
1254
RZ2
003
LX-6
06-1
2580
JEW
EL
033-
254
8-1
003-
360
1-2
602-
2S
hado
w
Variety
% B
rix
Fig 3. Douglas Daly watermelon fruit Brix. Varieties showing potential: • 1238 – High Brix, round shape; OK yield and fruit weight. • 1239 – High yield and high Brix, round shape; tendency to crack. • 1241 – High yield; OK Brix and fruit weight; 1-2 black seeds per fruit. • 1242 – High yield and number of fruit; low fruit weight and Brix. • 1245 – High Brix, OK weight and yield. • 1246 – High yield and Brix; 1-2 black seeds per fruit • Jewel – High Brix and high yield; tendency to crack.

20
Photo 1. Varieties Showing Potential 1238 1239
1241 1242

21
Photo 2. Varieties Showing Potential 1245 1246
Jewel Shadow
Picture Not Available
22
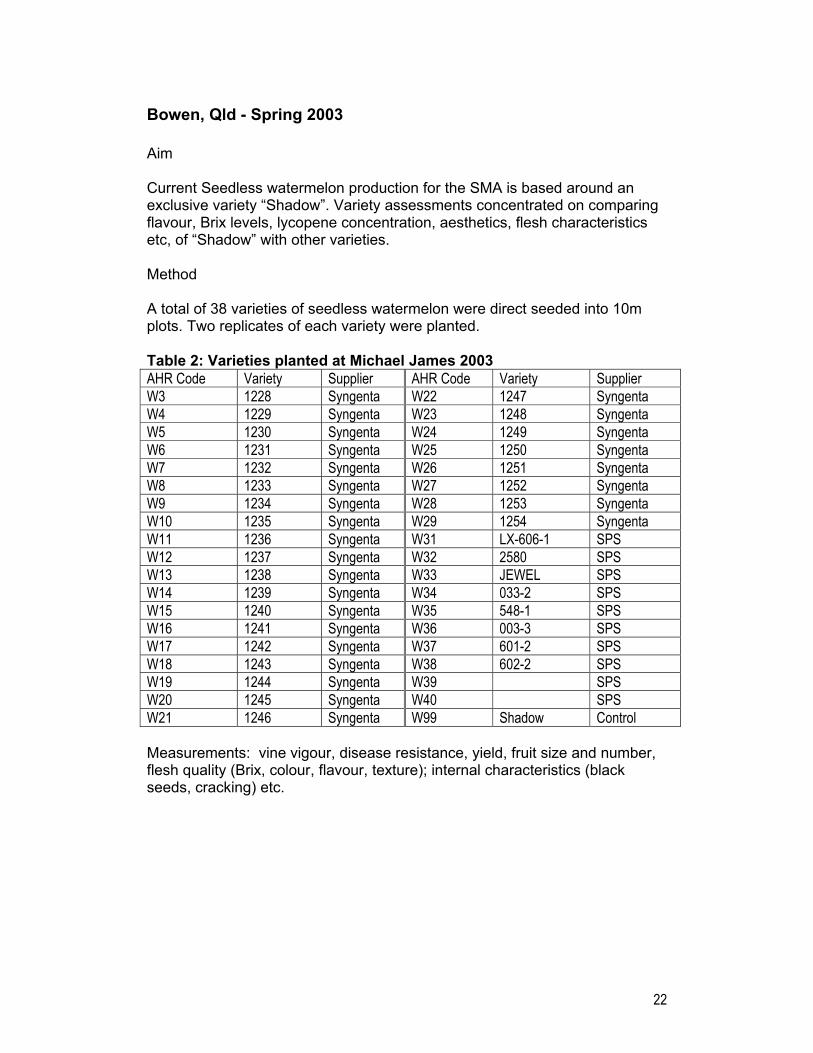
Bowen, Qld - Spring 2003 Aim Current Seedless watermelon production for the SMA is based around an exclusive variety “Shadow”. Variety assessments concentrated on comparing flavour, Brix levels, lycopene concentration, aesthetics, flesh characteristics etc, of “Shadow” with other varieties. Method A total of 38 varieties of seedless watermelon were direct seeded into 10m plots. Two replicates of each variety were planted. Table 2: Varieties planted at Michael James 2003 AHR Code Variety Supplier AHR Code Variety Supplier W3 1228 Syngenta W22 1247 Syngenta W4 1229 Syngenta W23 1248 Syngenta W5 1230 Syngenta W24 1249 Syngenta W6 1231 Syngenta W25 1250 Syngenta W7 1232 Syngenta W26 1251 Syngenta W8 1233 Syngenta W27 1252 Syngenta W9 1234 Syngenta W28 1253 Syngenta W10 1235 Syngenta W29 1254 Syngenta W11 1236 Syngenta W31 LX-606-1 SPS W12 1237 Syngenta W32 2580 SPS W13 1238 Syngenta W33 JEWEL SPS W14 1239 Syngenta W34 033-2 SPS W15 1240 Syngenta W35 548-1 SPS W16 1241 Syngenta W36 003-3 SPS W17 1242 Syngenta W37 601-2 SPS W18 1243 Syngenta W38 602-2 SPS W19 1244 Syngenta W39 SPS W20 1245 Syngenta W40 SPS W21 1246 Syngenta W99 Shadow Control Measurements: vine vigour, disease resistance, yield, fruit size and number, flesh quality (Brix, colour, flavour, texture); internal characteristics (black seeds, cracking) etc.

23
Results: Fruit Weight Individual fruit weights of most varieties sown were equivalent to “Shadow”. Fruit weight of LX606-1 and SPS2580 were around 1-1.5kg lower than shadow, whilst fruit from Jewel and SPS506-1 were approximately 1-1.5kg heavier.
Average Fruit Weight
0.00
1000.00
2000.00
3000.00
4000.00
5000.00
6000.00
7000.00
8000.00
9000.00
10000.0012
28
1229
1230
1231
1232
1233
1234
1235
1236
1237
1238
1239
1240
1241
1242
1243
1244
1245
1246
1247
1248
1249
1250
1251
1252
1253
1254
LX-6
06-1
2580
JEW
EL
033-
2
548-
1
003-
3
601-
2
602-
2
505-
1
506-
1
Shad
ow
Variety
Wei
ght (
g)
Fig 4. Bowen watermelon fruit weight

24
Results: Total Yield Total yield of most varieties was statistically similar or slightly lower than “Shadow”, however some varieties did produce unacceptably low yields such as 1229, 1233, 1234, 1240, 1251, LX606-1, 033-2 and 003-3.
Average Yield /ha
0.00
5.00
10.00
15.00
20.00
25.00
30.00
35.00
40.00
45.00
1228
1229
1230
1231
1232
1233
1234
1235
1236
1237
1238
1239
1240
1241
1242
1243
1244
1245
1246
1247
1248
1249
1250
1251
1252
1253
1254
LX-60
6-1 2580
JEWEL03
3-254
8-100
3-360
1-260
2-250
5-150
6-1Sha
dow
Variety
Yiel
d t/h
a
Fig 5. Bowen watermelon yield

25
Results: Fruit Brix A number of varieties investigated had statistically higher Brix levels than “Shadow”. Varieties 0.4-0.7 Brix units higher were 1228, 1233, 1240, 1248, 1251, 602-2, and 506-1. Varieties 0.8-1.1 Brix units higher than “Shadow” were: 1234, 1238, and 1254. Only variety 033-2 had significantly lower Brix than “Shadow”
Average Fruit Brix
8.00
9.00
10.00
11.00
12.00
13.00
14.00
1228
1229
1230
1231
1232
1233
1234
1235
1236
1237
1238
1239
1240
1241
1242
1243
1244
1245
1246
1247
1248
1249
1250
1251
1252
1253
1254
LX-6
06-1
2580
JEW
EL
033-
2
548-
1
003-
3
601-
2
602-
2
505-
1
506-
1
Shad
ow
Variety
% b
rix
Fig 6. Bowen watermelon fruit Brix

26
There were no varieties that showed a consistent tendency to produce black seeds. The occurrence of fruit cracking in the trial was very low, however varieties 1229 and 601-2 showed a consistent tendency to crack. Varieties showing potential: • 1238 – High Brix, OK yield and fruit weight. • 1254 – High Brix, OK yield and fruit weight. Photo 3. Varieties Showing Potential 1238
1254
Conclusions There were two varieties that showed potential due to higher fruit Brix, 1238 and 1253. Varieties showing consistent potential will be assessed at other sites next season. Based on these results and the previous trial at Gavin Hopkins’, variety 1238 may be carried over to the next stage.

27
Assessments on fruit colour using digital imaging are yet to be conducted.
Chinchilla - November/December 2003 Aim Current Seedless watermelon production for the SMA is based around an exclusive variety “Shadow”. Variety assessments concentrated on comparing flavour, Brix levels, aesthetics, flesh characteristics etc, of “Shadow” with other varieties. Method A total of 9 Seedless watermelon varieties were transplanted into 10m plots and grown to maturity. Two replicates of each variety were planted. Table 3: Varieties Planted at Daryl O’Leary’s 2003
Variety Supplier RZ 2003 Rjik Zwaan Shadow SPS Silhouette SPS 531-3 SPS 564-1 SPS 430-1 SPS Amber SPS 2580 SPS 1201 Syngenta
Measurements: Yield, fruit size and number, flesh quality (Brix, colour, cracking)
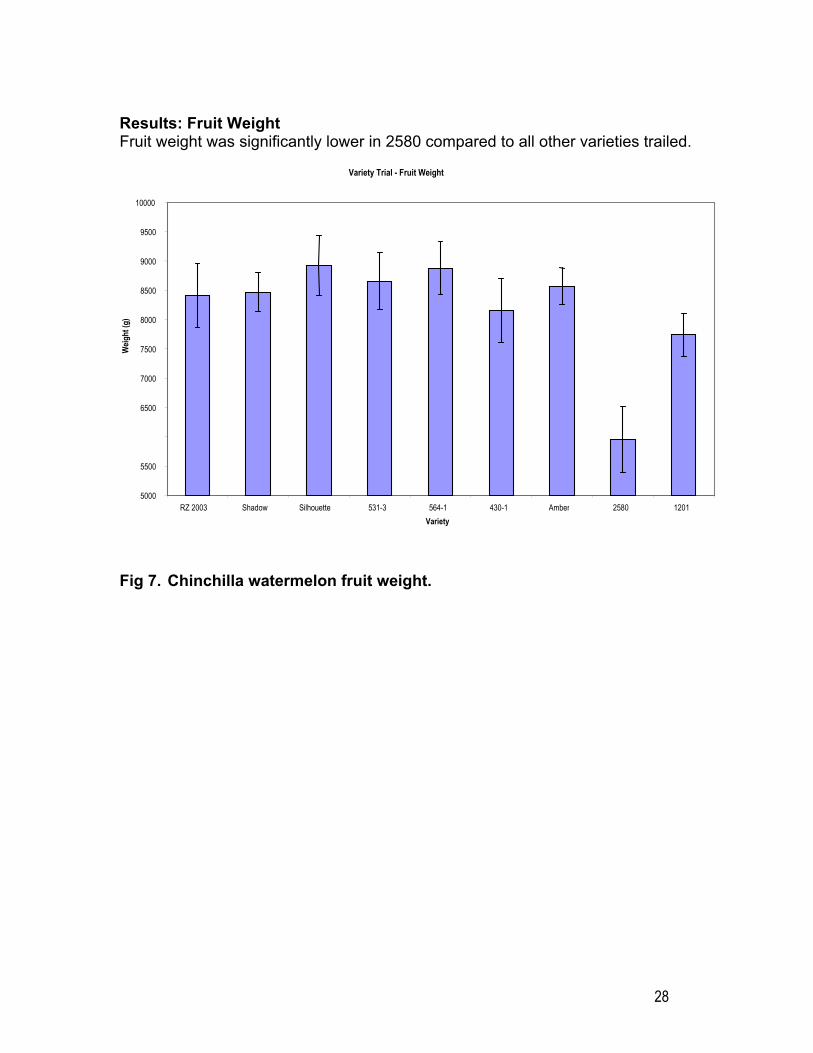
28
Results: Fruit Weight Fruit weight was significantly lower in 2580 compared to all other varieties trailed.
Fig 7. Chinchilla watermelon fruit weight.
Variety Trial - Fruit Weight
5000
5500
6500
7000
7500
8000
8500
9000
9500
10000
RZ 2003 Shadow Silhouette 531-3 564-1 430-1 Amber 2580 1201Variety
Weig
ht (g
)

29
Results: Fruit Yield Silhouette, 531-3, 564-1, 430-1, and 1201 all produced significantly greater yields than shadow. The fruit yield for 2580 was significantly lower than for shadow.
Fig 8. Chinchilla watermelon yield Conclusion This trial identified three varieties that show potential. All varieties in this trial produced similar or worse quality fruit than Shadow. Varieties 531-3, 430-1 and 1201 all produced fruit of similar quality to Shadow but with significantly greater yields.
Variety Trial - Fruit Yield
0
10
20
30
40
50
60
70
RZ 2003 Shadow Silhouette 531-3 564-1 430-1 Amber 2580 1201
Variety
Yield
(t/h
a)

30
Victoria – Summer 2003-2004 Aims Current Seedless watermelon production for the SMA is based around an exclusive variety “Shadow”. Variety assessments will concentrate on comparing flavour, Brix levels, lycopene concentration, aesthetics, flesh characteristics etc, of “Shadow” with other varieties. Method A total of 12 Seedless watermelon varieties were transplanted into 10 m plots and grown to maturity. Plots consisted of 6 seedless plants and 3 pollinators making a total of 9 plants per plot. Two replicates of each variety were planted. Table 4: Varieties Planted at Andrew Young’s 2003
AHR Code Variety Supplier
W30 RZ2003 Rjik Zwaan
W32 SPS 2580 SPS
W33 JEWEL SPS
W34 033-2 SPS
W35 548-1 SPS
W36 033-3 SPS
W37 601-2 SPS
W38 602-2 SPS
W42 Cutwell Jarit
W43 Classic Jarit
W44 Nightshade Jarit
W99 Shadow Control Measurements: Crop vigour, yield and fruit characteristics were thoroughly assessed and compared to the current industry standard, Shadow.

31
Results Most varieties produced a similar or lower fruit weight than “Shadow”, however 548-1, 601-2, and “JEWEL” showed a significantly higher fruit weight than “Shadow”.
Variety Trial - Fruit Weight
0
2
4
6
8
10
12
033-2 033-3 548-1 601-2 602-2 Classic Cutwell JEWEL Nightshade RZ2003 Shadow SPS 2580
Variety
Frui
t Wei
ght (
kg)
Fig 9. Robinvale watermelon fruit weight

32
Only three varieties produced yields lower than “Shadow”. 033-3, 548-1, 601-2, 602-2, “Classic”, “Cutwell”, “JEWEL”, and “Nightshade” all produced yields equivalent to or greater than ‘Shadow”.
Variety Trial - Fruit Yield
0
5
10
15
20
25
30
35
40
45
50
033-2 033-3 548-1 601-2 602-2 Classic Cutwell JEWEL Nightshade RZ2003 Shadow SPS 2580
Variety
Yiel
d (t/
ha)
Fig 10. Robinvale watermelon yield.
33
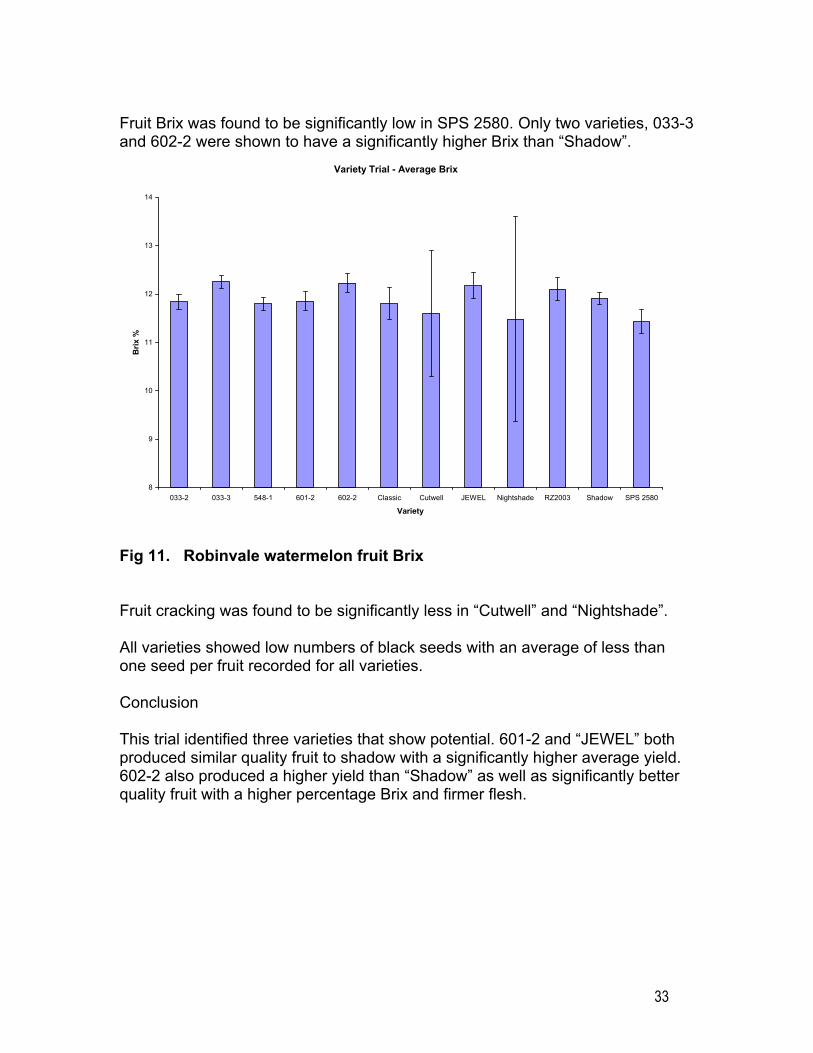
Fruit Brix was found to be significantly low in SPS 2580. Only two varieties, 033-3 and 602-2 were shown to have a significantly higher Brix than “Shadow”.
Variety Trial - Average Brix
8
9
10
11
12
13
14
033-2 033-3 548-1 601-2 602-2 Classic Cutwell JEWEL Nightshade RZ2003 Shadow SPS 2580
Variety
Brix
%
Fig 11. Robinvale watermelon fruit Brix Fruit cracking was found to be significantly less in “Cutwell” and “Nightshade”. All varieties showed low numbers of black seeds with an average of less than one seed per fruit recorded for all varieties. Conclusion This trial identified three varieties that show potential. 601-2 and “JEWEL” both produced similar quality fruit to shadow with a significantly higher average yield. 602-2 also produced a higher yield than “Shadow” as well as significantly better quality fruit with a higher percentage Brix and firmer flesh.

34
1.2 Larger trials that came out of initial smaller trials 8 rows x 1 bay x 20m or more
Mataranka – Winter 2005 Varieties – 2m row x 1.5 plant spacing and 25m plots, 1 bay wide 200 seeds (1 tray) per variety. Target transplanting 4th August #11 31/7 - seed sowing Mon 27/6 Table 5. Varieties – Mataranka 2005
Name/Code Source Shadow Syngenta Royal Amada Lefroy Valley Cutwell Jarit Classic Jarit Nightshade Jarit 601-2 SPS 033-3 SPS Storm SPS
Fruit were harvested from 7/12/05 to 15/10/05 and yield, Brix, flesh firmness and fruit size were measured. Yield was assessed by weighing all fruit harvested commercially from the 25m long + 1 bay wide plots. Quality was assessed on a sample.
35
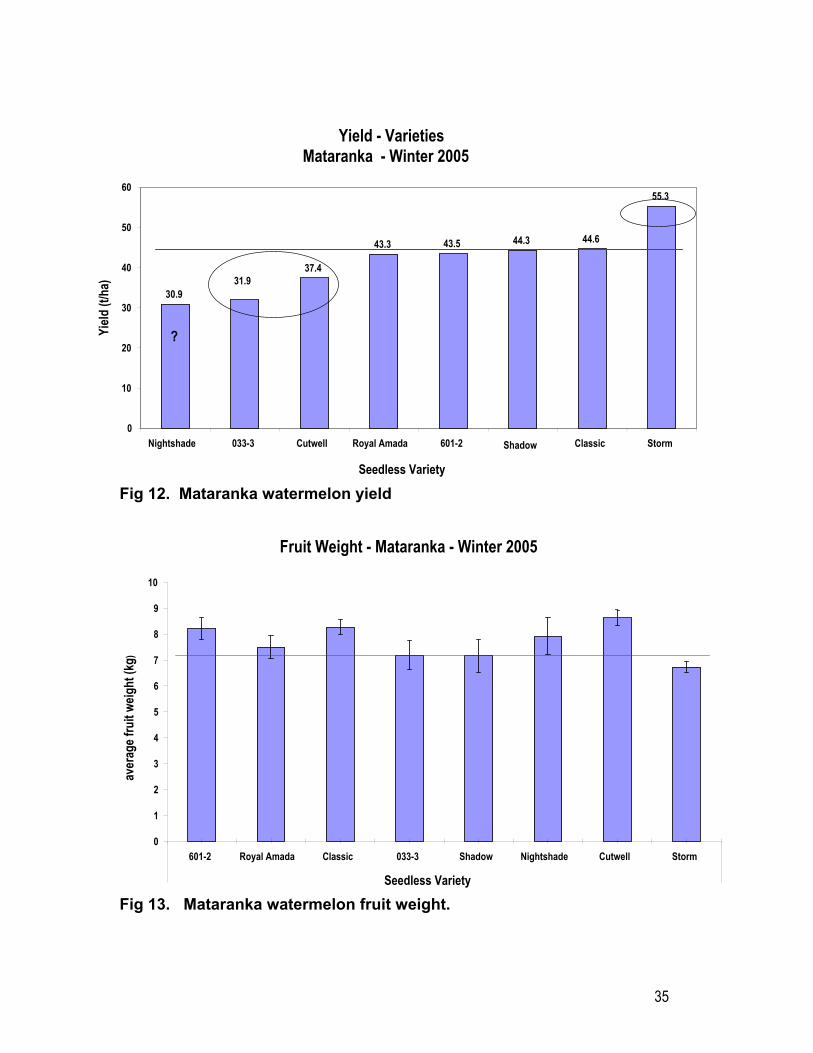
Fig 12. Mataranka watermelon yield
Fig 13. Mataranka watermelon fruit weight.
Fruit Weight - Mataranka - Winter 2005
0
1
2
3
4
5
6
7
8
9
10
601-2 Royal Amada Classic 033-3 Shadow Nightshade Cutwell Storm
Seedless Variety
aver
age f
ruit
weig
ht (k
g)
Yield - VarietiesMataranka - Winter 2005
30.9
37.4
43.3 43.5 44.3 44.6
55.3
31.9
0
10
20
30
40
50
60
Nightshade 033-3 Cutwell Royal Amada 601-2 Shadow Classic Storm
Seedless Variety
?Yield
(t/h
a)

36
Fig 14. Mataranka watermelon fruit Brix Conclusion The highest yielding variety was storm. Continue to trial all varieties. Nightshade has performed well in other trials.
Fruit Brix – Mataranka - Winter 2005
0
2
4
6
8
10
12
14
601-2 Royal Amada Classic 033-3 Shadow Nightshade Cutwell Storm
Seedless Variety
aver
age B
rix %
37
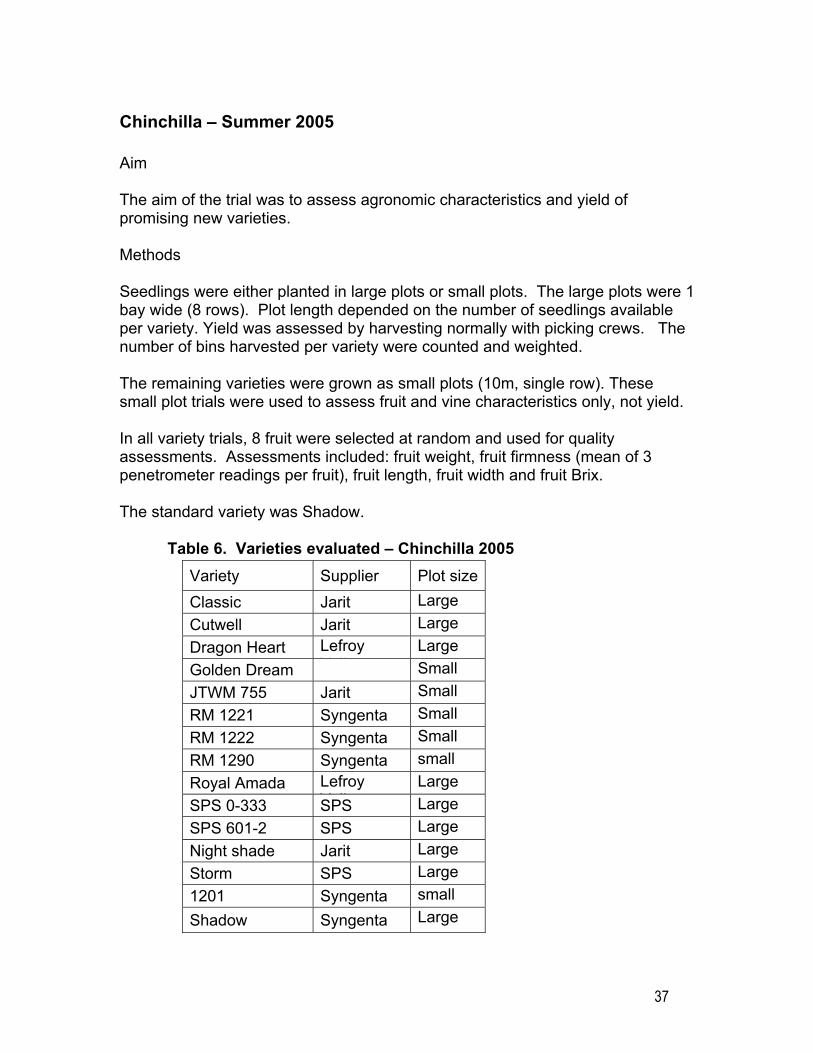
Chinchilla – Summer 2005 Aim The aim of the trial was to assess agronomic characteristics and yield of promising new varieties. Methods Seedlings were either planted in large plots or small plots. The large plots were 1 bay wide (8 rows). Plot length depended on the number of seedlings available per variety. Yield was assessed by harvesting normally with picking crews. The number of bins harvested per variety were counted and weighted. The remaining varieties were grown as small plots (10m, single row). These small plot trials were used to assess fruit and vine characteristics only, not yield. In all variety trials, 8 fruit were selected at random and used for quality assessments. Assessments included: fruit weight, fruit firmness (mean of 3 penetrometer readings per fruit), fruit length, fruit width and fruit Brix. The standard variety was Shadow. Table 6. Varieties evaluated – Chinchilla 2005
Variety Supplier Plot sizeClassic Jarit Large Cutwell Jarit Large Dragon Heart Lefroy
V llLarge
Golden Dream Small JTWM 755 Jarit Small RM 1221 Syngenta Small RM 1222 Syngenta Small RM 1290 Syngenta small Royal Amada Lefroy
V llLarge
SPS 0-333 SPS Large SPS 601-2 SPS Large Night shade Jarit Large Storm SPS Large 1201 Syngenta small Shadow Syngenta Large

38
Results Yield • Four varieties produced higher yields than the standard Shadow
o Nightshade + 45% yield o SPS 601-2 + 40% yield o Storm + 31% yield o Classic + 23% yield
Agronomic characteristics • JTWM 755 produced very large fruit with good shelf life. • Most of the varieties trialed were firmer that Shadow. Classic, RM1290 and
Royal Armada were the firmest. • Royal Armada was also promising in trials.
Fig 15. Seedless watermelon yield – Chinchilla.
Yield (Varieties)
5146
43
31
22
49
35 35 33
0
10
20
30
40
50
60
NightShade
SPS601-2
Storm Classic Shadow RoyalAmada
DragonHeart
Cuttwell SPS 0-333
Yeild
(t/h
a)

39
Chinchilla Seedless Watermelon Trials 2004-2005 Large Scale Vsriety Trial - Fruit Quality Assessment -
Average Fruit Weight
4000
5000
6000
7000
8000
9000
10000
11000
12000
13000
Classic Cuttwell DragonHeart
GoldenDream
Jtwm755
RM 1221 RM 1222 RM 1290 RoyalAmada
SPS 0-333
SPS 601 Nightshade
Strom SYN1201
Standard
Variety
Ave
rage
Fru
it W
eigh
t
Fig 16. Seedless watermelon fruit weight 0 Chinchilla.

40
Chinchilla Seedless Watermelon Trials 2004-2005 Large Scale Vsriety Trial - Fruit Quality Assessment -
Average Fruit Brix
10
10.5
11
11.5
12
12.5
13
13.5
Classic Cuttwell DragonHeart
GoldenDream
Jtwm755
RM 1221 RM 1222 RM 1290 RoyalAmada
SPS 0-333
SPS 601 Nightshade
Strom SYN1201
Standard
Variety
Brix
%
Fig 17. Seedless watermelon fruit Brix – Chinchilla.

41
Condoblin – 2005 Aim The aim is to assess the characteristics of the following varieties:
• Storm • Nightshade • 601-2 SPS • 033-3 SPS • Cutwell • Classic • Syngenta 1201
Method All varieties were planted as seedlings in 3-row wide plots ranging in length form 390m (Storm) to 5m (Syngenta 1201). Plot lengths are outlined in the table below. Pollinators were Red Tiger planted as transplants in a 3:1 ratio. A map of where the varieties go, and approximate lengths down the row where varieties change, has been outlined below. Also, each plot has been marked with labelled tags. Table 7. Variety Trial Design
Shadow - standard
Syngenta1201 Cutwell Classic 601-2 SPS 033-3 SPS N’shade 5m 20m 30m 70m 100m 120m Storm N’shade --→
Road
way
390m 110m --→ The trial was implemented in block C8, bay 4. Also, other mixed varieties of watermelons have been planted in the area located between the Syngenta-1201 variety and the roadway, which are not part of this trial.

42
Results Cutwell had the highest yield of 74 tonnes/ha. Nightshade and SPS 033-3 were next with marketable yields of 56 and 58 tonnes/ha. Storm and Classic also performed well with yields of 50 tonnes/ha. Yields of SPS 601-2 were low, but this variety has yielded well in trials in Chinchilla. Syngenta 1201 yields are not reliable due to small plot size. All fruit were larger or equivalent to Shadow. JTRM 755 is a very large and long fruited variety; it may have a special place possible as a processing variety.
Marketable yields
49.9
56.2 57.9
38.0
49.7
73.9
47.345.0
55
0.0
10.0
20.0
30.0
40.0
50.0
60.0
70.0
80.0
Storm
Nightsha
de
SPS 0333
SPS 6012
Classic
Cutwell
Syngen
ta1201
Shado
w
JTRM 755
tonn
es/h
a
Fig 18. Seedless watermelon yield - Condoblin

43
Fruit Weight
6
7
8
9
10
11
12
13
14
Nightsha
deStorm
SPS 0333
SPS 6012
Cutwell
Classics
Syngen
ta 12
01
JTRM 755
Shado
w
Frui
t wei
ght (
kg/fr
uit)
Fig 19. Seedless watermelon fruit weight - Condoblin
Brix
8
9
10
11
12
13
14
Nightshad
eStorm
SPS 0333
SPS 6012
Cutwell
Classics
Syngenta 1201
JTRM 755
Shadow
Brix
%
Fig 20. Seedless Watermelon fruit Brix - Condoblin
44
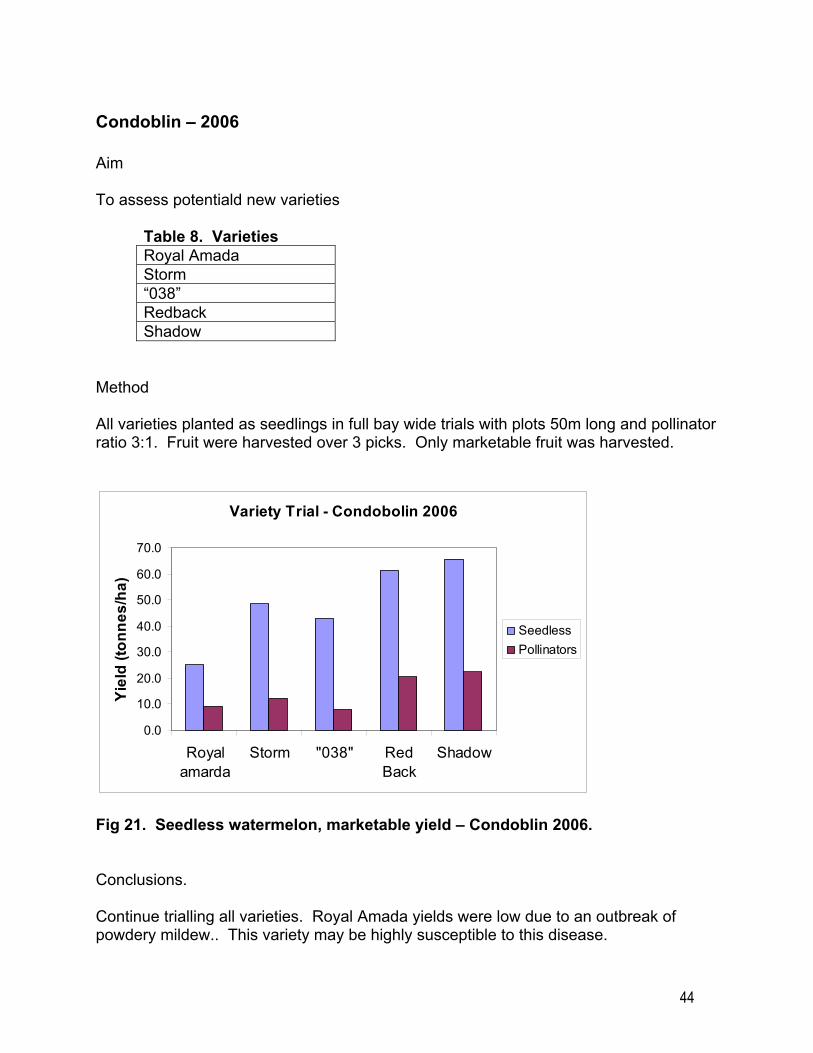
Condoblin – 2006 Aim To assess potentiald new varieties
Table 8. Varieties Royal Amada Storm “038” Redback Shadow
Method All varieties planted as seedlings in full bay wide trials with plots 50m long and pollinator ratio 3:1. Fruit were harvested over 3 picks. Only marketable fruit was harvested.
Fig 21. Seedless watermelon, marketable yield – Condoblin 2006. Conclusions. Continue trialling all varieties. Royal Amada yields were low due to an outbreak of powdery mildew.. This variety may be highly susceptible to this disease.
Variety Trial - Condobolin 2006
0.0
10.0
20.0
30.0
40.0
50.0
60.0
70.0
Royalamarda
Storm "038" RedBack
Shadow
Yiel
d (to
nnes
/ha)
SeedlessPollinators
45
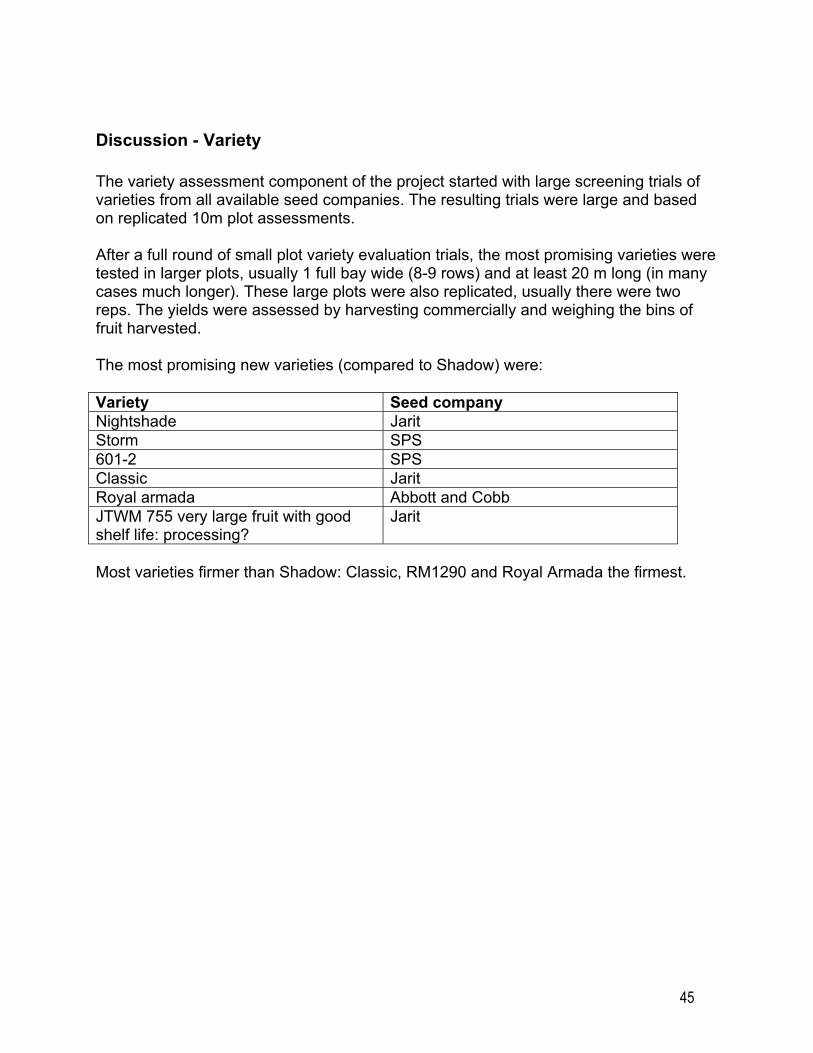
Discussion - Variety The variety assessment component of the project started with large screening trials of varieties from all available seed companies. The resulting trials were large and based on replicated 10m plot assessments. After a full round of small plot variety evaluation trials, the most promising varieties were tested in larger plots, usually 1 full bay wide (8-9 rows) and at least 20 m long (in many cases much longer). These large plots were also replicated, usually there were two reps. The yields were assessed by harvesting commercially and weighing the bins of fruit harvested. The most promising new varieties (compared to Shadow) were: Variety Seed company Nightshade Jarit Storm SPS 601-2 SPS Classic Jarit Royal armada Abbott and Cobb JTWM 755 very large fruit with good shelf life: processing?
Jarit
Most varieties firmer than Shadow: Classic, RM1290 and Royal Armada the firmest.

46
2. Nutrition Trials
2.1 NPK & calcium trials at various locations
Douglas Daly, NT - June (2003) Aim There appears to be a relationship between calcium level in the leaf and fruit, and fruit Brix and sucrose content. The optimum level of calcium in the soil solution appears to be in the region of 200 mg/L. The research is unclear on which is the best method of applying calcium to plants in the field. Nitrogen and potassium are key nutrients in obtaining the optimal level of vegetative growth. Potassium is important for export of sugars from the source leaves to the fruit and is likely to be critical in the Lycopene (hence flesh colour). High levels of phosphorus are used in the US, and there are indications that these may improve sugars. The trial aimed to: (i) confirm the hypothesis that fruit Brix can be affected by potassium and or phosphorus supply; and, (ii) establish optimum levels of Nitrogen, Phosphorus, Potassium and Calcium supply for maximising yield and fruit quality. Method The trial evaluated 10 combinations of nutrients, replicated four times, applied as a basal application to an area consisting of 40 ten-metre plots, prior to plastic laying. Treatments consisted of three levels of nitrogen (25, 100, 150 kg/ha); two levels of potassium (100, 200 kg/ha); two levels of phosphorus (100, 200 kg/ha); and two levels of calcium (150, 215 kg/ha). These treatments were compared to a control treatment of 50:50:50 N:P:K and to the base fertiliser applied by the grower. Treatments were replicated 3 times in a randomised complete block design consisting of 10m plots.
47
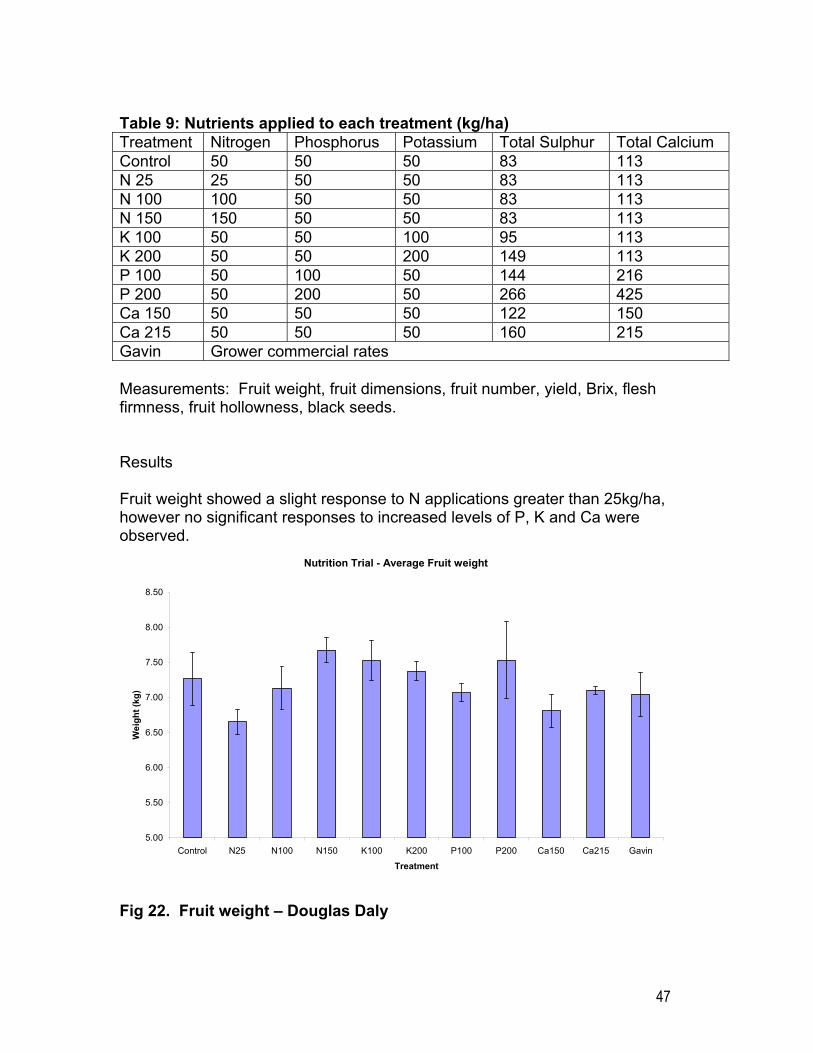
Table 9: Nutrients applied to each treatment (kg/ha) Treatment Nitrogen Phosphorus Potassium Total Sulphur Total Calcium Control 50 50 50 83 113 N 25 25 50 50 83 113 N 100 100 50 50 83 113 N 150 150 50 50 83 113 K 100 50 50 100 95 113 K 200 50 50 200 149 113 P 100 50 100 50 144 216 P 200 50 200 50 266 425 Ca 150 50 50 50 122 150 Ca 215 50 50 50 160 215 Gavin Grower commercial rates Measurements: Fruit weight, fruit dimensions, fruit number, yield, Brix, flesh firmness, fruit hollowness, black seeds. Results Fruit weight showed a slight response to N applications greater than 25kg/ha, however no significant responses to increased levels of P, K and Ca were observed.
Nutrition Trial - Average Fruit weight
5.00
5.50
6.00
6.50
7.00
7.50
8.00
8.50
Control N25 N100 N150 K100 K200 P100 P200 Ca150 Ca215 Gavin
Treatment
Wei
ght (
kg)
Fig 22. Fruit weight – Douglas Daly

48
Fruit Brix showed no significant response to any increase in N, P, K or Ca.
Nutrition Trial - Brix %
10.00
10.50
11.00
11.50
12.00
12.50
13.00
13.50
Control N25 N100 N150 K100 K200 P100 P200 Ca150 Ca215 Gavin
Treatment
% B
rix
Fig 23. Fruit Brix – Douglas Daly Increased levels of N, P, K and Ca did not produce significant increases in crop yield above a 50:50:50 N:P:K mix.
Nutrition Trial - Yield
0.00
5.00
10.00
15.00
20.00
25.00
30.00
35.00
40.00
45.00
50.00
Control N25 N100 N150 K100 K200 P100 P200 Ca150 Ca215 Gavin
Treatment
Yiel
d t/h
a
Fig 24. Yield – Douglas Daly

49
No significant differences were observed in fruit hollowness or the presence of black seeds (data not shown). Increased Nitrogen did not increase the occurrence or extent of cracking, nor did increased calcium reduce fruit cracking. Conclusion No changes to agronomic practice can be drawn from the results of this trial. The lack of significant results may have been due to the site being only recently cleared of native vegetation and this being the first watermelon crop grown at the site. The absence of increased fruit hollowness and reduced flesh firmness in the high nitrogen treatments is encouraging for future work. Trials using high rates of Nitrogen will continue as the potential benefits of high Nitrogen applications (such as increased capacity for sugar and lycopene production) may not be at the cost of fruit firmness as previously thought. Further work at other locations and at this location next season should provide clearer responses to changes in base fertiliser.

50
Bowen, Qld - Autumn 2003 Base Fertiliser Trial Aims To test the hypothesis that fruit Brix levels can be affected by potassium and or phosphorus supply. Establish optimum levels of Nitrogen, Phosphorus, Potassium and Calcium supply for maximising yield and fruit quality. Table 10. Treatments Treatment Name N K P S Ca Control N,P&K @ 50kg/ha 50 kg/ha 50 kg/ha 50 kg/ha 83 kg/ha 113 kg/ha Nitrogen 25kg/ha 25 kg/ha 50 kg/ha 50 kg/ha 83 kg/ha 113 kg/ha Nitrogen 100kg/ha 100 kg/ha 50 kg/ha 50 kg/ha 83 kg/ha 113 kg/ha Nitrogen 150kg/ha 150 kg/ha 50 kg/ha 50 kg/ha 83 kg/ha 113 kg/ha Nitrogen 200kg/ha 200 kg/ha 50 kg/ha 50 kg/ha 83 kg/ha 113 kg/ha Potassium 25kg/ha 50 kg/ha 25 kg/ha 50 kg/ha 72 kg/ha 113 kg/ha Potassium 100kg/ha 50 kg/ha 100kg/ha 50 kg/ha 95 kg/ha 113 kg/ha Potassium 200kg/ha 50 kg/ha 200kg/ha 50 kg/ha 149 kg/ha 113 kg/ha Phosphorus 25kg/ha 50 kg/ha 50 kg/ha 25 kg/ha 50 kg/ha 57 kg/ha Phosphorus 100kg/ha 50 kg/ha 50 kg/ha 100 kg/ha 144 kg/ha 216 kg/ha Phosphorus 200kg/ha 50 kg/ha 50 kg/ha 200 kg/ha 266 kg/ha 425 kg/ha Calcium 25kg/ha 50 kg/ha 50 kg/ha 50 kg/ha 103 kg/ha 138 kg/ha Calcium 50kg/ha 50 kg/ha 50 kg/ha 50 kg/ha 122kg/ha 153 kg/ha Calcium 100kg/ha 50 kg/ha 50 kg/ha 50 kg/ha 160kg/ha 213 kg/ha
Early observations suggest that additional Calcium applied as Micro-gyp increased plant vigour over all other treatments. High rates of soluble Nitrogen may have had a detrimental effect on early plant growth. However some areas within this trial may also have been compromised by patches of poor soil. Further investigation is also necessary in regards to the sources of Calcium used in the trial. Future trials will aim to standardise treatments for Sulphur so as to account for any effects of differing levels of this element.
51
Fruit Number
0
5
10
15
20
25
Contro
l N,P&K @
50kg
/ha
Nitroge
n 25k
g/ha
Nitroge
n 100
kg/ha
Nitroge
n 150
kg/ha
Nitroge
n 200
kg/ha
Potass
ium 25
kg/ha
Potass
ium 10
0kg/h
a
Potass
ium 20
0kg/h
a
Phosp
horus
25kg
/ha
Phosp
horus
100k
g/ha
Phosp
horus
200k
g/ha
Calcium
25kg
/ha
Calcium
50kg
/ha
Calcium
100k
g/ha
Frui
t No.
per
10m
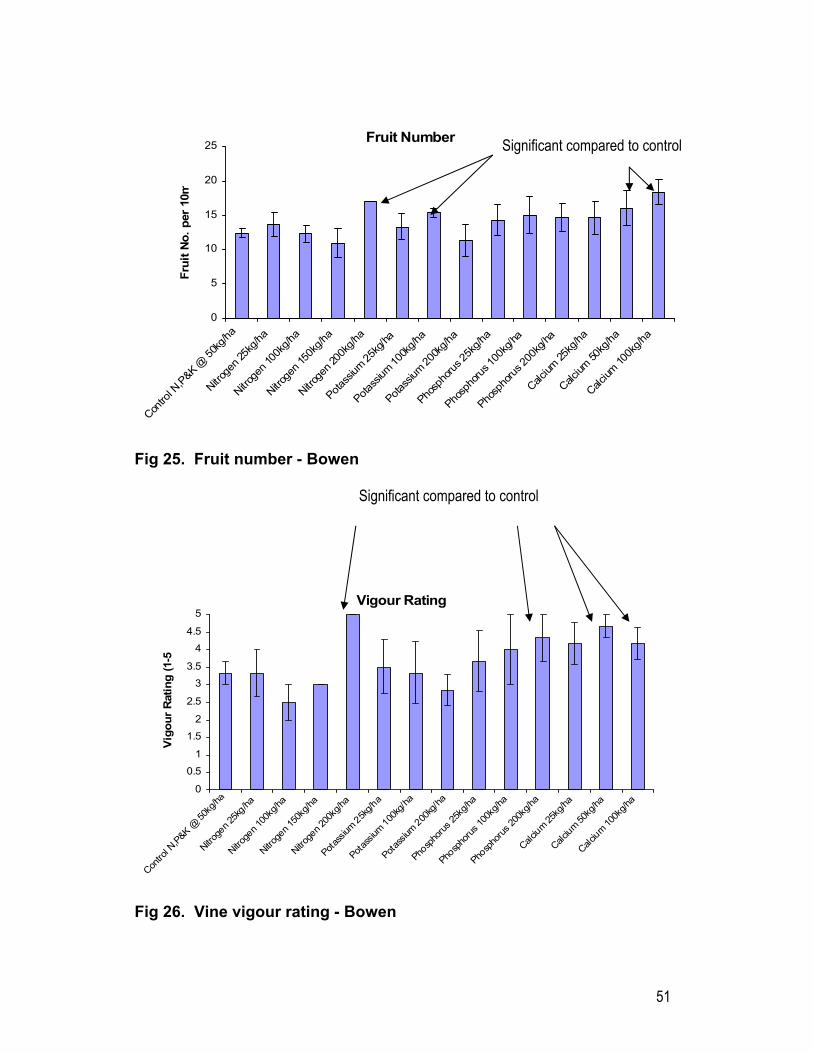
Fig 25. Fruit number - Bowen Significant compared to control
Vigour Rating
0
0.5
1
1.5
2
2.5
33.5
4
4.5
5
Contro
l N,P&
K @ 50
kg/ha
Nitroge
n 25k
g/ha
Nitroge
n 100
kg/ha
Nitroge
n 150
kg/ha
Nitroge
n 200
kg/ha
Potass
ium 25k
g/ha
Potass
ium 10
0kg/h
a
Potass
ium 200
kg/ha
Phosp
horus
25kg
/ha
Phosp
horus
100k
g/ha
Phosp
horus
200k
g/ha
Calcium 25
kg/ha
Calcium 50
kg/ha
Calcium 10
0kg/h
a
Vigo
ur R
atin
g (1
-5
Fig 26. Vine vigour rating - Bowen
Significant compared to control
52
Significant compared to control
Cracking Resistance Rating
0
1
2
3
4
5
Contro
l N,P&K
@ 50
kg/ha
Nitroge
n 25k
g/ha
Nitroge
n 100
kg/ha
Nitroge
n 150
kg/ha
Nitroge
n 200
kg/ha
Potass
ium 25k
g/ha
Potass
ium 100
kg/ha
Potass
ium 200
kg/ha
Phosp
horus
25kg
/ha
Phosp
horus
100k
g/ha
Phosp
horus
200k
g/ha
Calcium 25
kg/ha
Calcium
50kg
/ha
Calcium 10
0kg/h
a
Crac
king
Res
ista
nce
(1-5
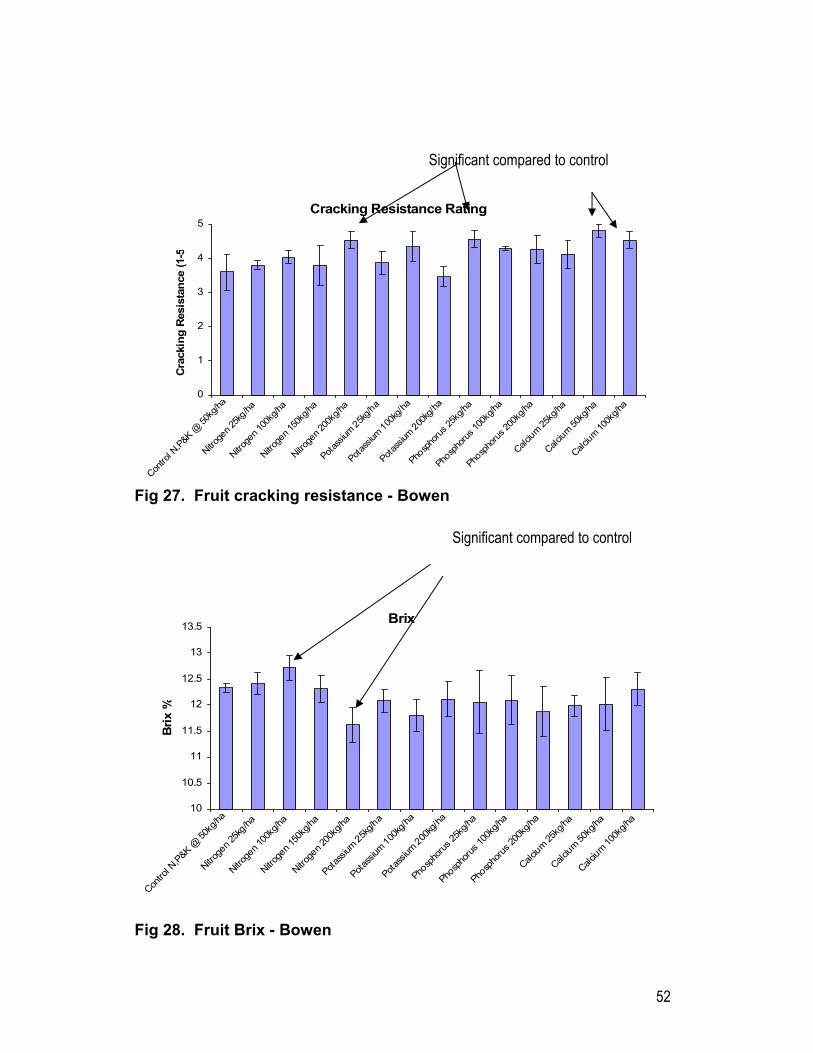
Fig 27. Fruit cracking resistance - Bowen
Brix
10
10.5
11
11.5
12
12.5
13
13.5
Contro
l N,P&K @
50kg
/ha
Nitroge
n 25k
g/ha
Nitroge
n 100
kg/ha
Nitroge
n 150
kg/ha
Nitroge
n 200
kg/ha
Potass
ium 25k
g/ha
Potass
ium 100
kg/ha
Potass
ium 200
kg/ha
Phosp
horus
25kg
/ha
Phosp
horus
100k
g/ha
Phosp
horus
200k
g/ha
Calcium 25
kg/ha
Calcium 50
kg/ha
Calcium
100k
g/ha
Brix
%
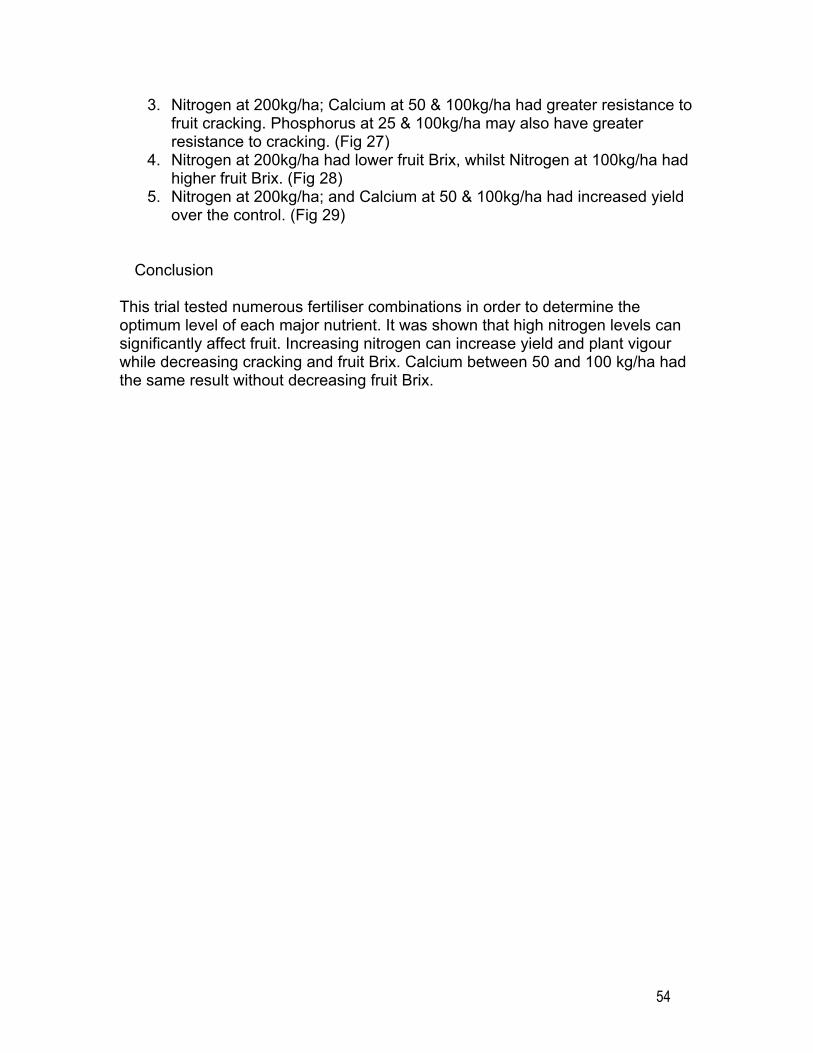
Fig 28. Fruit Brix - Bowen
Significant compared to control

53
Yield
0.0
10.0
20.0
30.0
40.0
50.0
60.0
70.0
Contro
l N,P&K @
50kg
/ha
Nitroge
n 25k
g/ha
Nitroge
n 100
kg/ha
Nitroge
n 150
kg/ha
Nitroge
n 200
kg/ha
Potass
ium 25k
g/ha
Potass
ium 100
kg/ha
Potass
ium 200
kg/ha
Phosp
horus
25kg
/ha
Phosp
horus
100k
g/ha
Phosp
horus
200k
g/ha
Calcium 25
kg/ha
Calcium 50
kg/ha
Calcium
100k
g/ha
Yiel
d t/h
a
Fig 29. Fruit Yield - Bowen
Yield and Fruit Quality Results Summary No Differences were observed between treatments in:
1. Number of seeded melons 2. Mean Fruit weight, length or diameter 3. Fruit Flavour Rating 4. Fruit Firmness Rating 5. Presence/Absence of Black Seeds 6. Presence/Absence of Light coloured areas of flesh
Relative to the Control (N50, K50, P50):
1. Calcium at 50 & 100 kg/ha, Nitrogen at 200 kg/ha and Potassium at 100 kg/ha had increased number of seedless melons. (Fig 25)
2. Calcium at 50&100kg/ha; Nitrogen at 200kg/ha; and Phosphorus at 200kg/ha showed increased plant vigour prior to harvest. (Fig 26)
Significant compared to control
54
3. Nitrogen at 200kg/ha; Calcium at 50 & 100kg/ha had greater resistance to fruit cracking. Phosphorus at 25 & 100kg/ha may also have greater resistance to cracking. (Fig 27)
4. Nitrogen at 200kg/ha had lower fruit Brix, whilst Nitrogen at 100kg/ha had higher fruit Brix. (Fig 28)
5. Nitrogen at 200kg/ha; and Calcium at 50 & 100kg/ha had increased yield over the control. (Fig 29)
Conclusion
This trial tested numerous fertiliser combinations in order to determine the optimum level of each major nutrient. It was shown that high nitrogen levels can significantly affect fruit. Increasing nitrogen can increase yield and plant vigour while decreasing cracking and fruit Brix. Calcium between 50 and 100 kg/ha had the same result without decreasing fruit Brix.

55
Chinchilla - November/December 2003 There appears to be a relationship between calcium level in the leaf and fruit, and fruit Brix and sucrose content. The optimum level of calcium in the soil solution appears to be in the region of 200 mg/L. The research is unclear on which is the best method of applying calcium to plants in the field. Nitrogen and potassium are key nutrients in obtaining the optimal level of vegetative growth. Potassium is important for export of sugars from the source leaves to the fruit and is likely to be critical in the production of Lycopene (hence flesh colour). High levels of phosphorus are used in the US, and there are indications that this may improve sugars. Aim Establish optimum levels of Nitrogen, Phosphorus, Potassium, Calcium and Sulphur supply for maximising yield and fruit quality. Method This trial tested five levels of nitrogen (25, 50, 75, 150, 200 kg/ha). Four levels of potassium (25, 50, 100, 200 kg/ha) supplied as base fertilizer. Four levels of phosphorus (25, 50, 100, 200 kg/ha) supplied as base fertilizer. Three levels of calcium supplied at rates of (25, 50, 100 kg/ha).Three Sulphur levels were also evaluated (25, 50, 80 kg/ha). All other nutrients were supplied at optimal levels based on soil and foliage analysis. A randomised complete block design was used with treatments replicated three times in 10 metre long plots. Measurements: Yield, fruit size and number, flesh quality (Brix, Colour, Cracking)

56
Results: Fruit Weight Fruit weight was significantly reduced by calcium at 25 and 50 kg/ha, Potassium at 25 kg/ha, and Nitrogen at 150 kg/ha when compared to the grower standard.
Fig 30. Fruit weight - Chinchilla
Nutrition Trial - Fruit Weight
5000
5500
6000
6500
7000
7500
8000
8500
9000
9500
Contr
ol
Nitro
gen 2
5
Nitro
gen 5
0
Nitro
gen 1
50
Nitro
gen 2
00
Phos
phor
ous 2
5
Phos
phor
ous 1
00
Phos
phor
ous 1
50
Potas
sium
25
Potas
sium
100
Potas
sium
200
Calci
um 25
Calci
um 50
Calci
um 10
0
Sulph
ur 25
Sulph
ur 50
Sulph
ur 80 AH
R
Nutrition
Weig
ht (g
)

57
Results: Fruit Brix A significantly higher Brix was produced when phosphorous was applied at the high rate of 150 kg/ha.
Fig 31. Fruit Brix – Chinchilla
Nutrition Trial - Fruit Brix
9.5
10
10.5
11
11.5
12
12.5Co
ntrol
Nitro
gen 2
5
Nitro
gen 5
0
Nitro
gen 1
50
Nitro
gen 2
00
Phos
phor
ous 2
5
Phos
phor
ous 1
00
Phos
phor
ous 1
50
Potas
sium
25
Potas
sium
100
Potas
sium
200
Calci
um 25
Calci
um 50
Calci
um 10
0
Sulph
ur 25
Sulph
ur 50
Sulph
ur 80 AH
R
Nutrition
% B
rix

58
Results: Fruit Yield Fruit yield was significantly reduced by applying Nitrogen at 150 kg/ha. Applying Phosphorous at 150 kg/ha significantly increased the fruit yield compared to the grower standard.
Fig 32. Yield – Chinchilla Conclusion These results clearly show that fruit Brix can be affected by the phosphorous supply. Percentage fruit Brix can be significantly increased by applying phosphorous at high rates. In this trial phosphorous applied at 150 kg/ha produced fruit with the highest percentage Brix. In this trial phosphorous not only effected fruit Brix, it also had a significant effect on yield. When phosphorous was applied at the high rate of 150 kg/ha fruit yield significantly increased. Yield was also significantly affected by nitrogen supply. When nitrogen was applied at the high rate of 150 kg/ha the yield was significantly decreased. The results of this trial show that the growers’ standard produces good quality fruit with high yields. However the quality of the fruit could be significantly increased by applying a higher rate of phosphorous. Thus it is recommended that an increased rate of phosphorous be applied to future watermelon crops.
Nutrition Trial - Fruit Yield
0
10
20
30
40
50
60
70
Contr
ol
Nitro
gen 2
5
Nitro
gen 5
0
Nitro
gen 1
50
Nitro
gen 2
00
Phos
phor
ous 2
5
Phos
phor
ous 1
00
Phos
phor
ous 1
50
Potas
sium
25
Potas
sium
100
Potas
sium
200
Calci
um 25
Calci
um 50
Calci
um 10
0
Sulph
ur 25
Sulph
ur 50
Sulph
ur 80 AH
R
Nutrition
Yield
(t/h
a)
59
Victoria – Summer 2003-2004 Base fertiliser trial There appears to be a relationship between calcium level in the leaf and fruit, and fruit Brix and sucrose content. The optimum level of calcium in the soil solution appears to be in the region of 200 mg/L. The research is unclear on which is the best method of applying calcium to plants in the field. Nitrogen and potassium are key nutrients in obtaining the optimal level of vegetative growth. Potassium is important for export of sugars from the source leaves to the fruit and is likely to be critical in the Lycopene (hence flesh colour). High levels of phosphorus are used in the US, and there are indications that these may improve sugars. Aims
1. To test the hypothesis that fruit Brix and Lycopene levels can be affected by potassium and or phosphorus supply; and,
2. Establish optimum levels of Nitrogen, Phosphorus, Potassium and
Calcium supply for maximising yield and fruit quality. Method Trials will test five levels of nitrogen (25, 50, 75, 150, 200 kg/ha). Four levels of potassium (25, 50, 100, 200 kg/ha) supplied as base fertilizer. Four levels of phosphorus (25, 50, 100, 150 kg/ha) supplied as base fertilizer. Calcium will be supplied at rates of (25, 50, 100 kg/ha). All other nutrients will be supplied at optimal levels based on soil and foliage analysis. A randomised complete block design was used with treatments replicated three times in 10 metre long plots. Measurements: Yield, fruit size and number, Flesh quality (Brix, colour, cracking).

60
Results: Fruit Weight Fruit weight was significantly reduced by the Phosphorous levels of 25, 100, 150 kg/ha when compared to the Grower Standard of 50 kg/ha. Vermitech also significantly reduced fruit weight.
Nutrition Trial - Fruit Weight
5
5.5
6
6.5
7
7.5
8
8.5
9
Con
trol
Cal
cium
1
Cal
cium
2
Cal
cium
3
Nitr
ogen
1
Nitr
ogen
2
Nitr
ogen
3
Nitr
ogen
4
Pho
s 1
Pho
s 2
Pho
s 3
Pot
assi
um 1
Pot
assi
um 2
Pot
assi
um 3
Sul
phur
1
Sul
phur
2
Sul
phur
3
Ver
mite
ch
Treatment
Wei
ght (
kg)
Fig 33. Fruit weight - Robinvale

61
Results: Fruit Yield Potassium at 100 kg/ha, Sulphur at 25 kg/ha and the Grower Standard all produced similar yields that were significantly greater than all other treatments accept for Nitrogen at 200 kg/ha which produced a yield that was significantly greater than all other treatments.
Nutrition Trial - Fruit Yield
20
25
30
35
40
45
50
Con
trol
Cal
cium
1
Cal
cium
2
Cal
cium
3
Nitr
ogen
1
Nitr
ogen
2
Nitr
ogen
3
Nitr
ogen
4
Phos
1
Phos
2
Phos
3
Pot
assi
um 1
Pot
assi
um 2
Pot
assi
um 3
Sulp
hur 1
Sul
phur
2
Sul
phur
3
Verm
itech
Treatment
Yiel
d (t/
ha)
Fig 34. Fruit yield - Robinvale

62
Results: Fruit Brix Nitrogen at 50 and 150 kg/ha, Phosphorous at 25 and 150 kg/ha, Potassium at 100 kg/ha, Sulphur at 25 kg/ha and Vermitech all produced a significantly lower fruit Brix %.
Nutrition Trial - Fruit Brix
10
10.5
11
11.5
12
12.5
13
Con
trol
Cal
cium
1
Cal
cium
2
Cal
cium
3
Nitr
ogen
1
Nitr
ogen
2
Nitr
ogen
3
Nitr
ogen
4
Pho
s 1
Pho
s 2
Pho
s 3
Pot
assi
um 1
Pot
assi
um 2
Pot
assi
um 3
Sul
phur
1
Sul
phur
2
Sul
phur
3
Ver
mite
ch
Treatment
Brix
%
Fig 35. Fruit Brix - Robinvale Conclusion These results clearly show that fruit Brix can be effected by the Phosphorous supply. A low rate of Phosphorous results in a reduced fruit Brix as does a high rate. In this experiment it was shown that an intermediate rate lying somewhere between 25 to 150 kg/ha produced the highest Brix. In this experiment significantly higher percentages of fruit Brix were recorded for Phosphorous at 50 and 100 kg/ha. This experiment also showed that fruit Brix can be affected by Potassium supply. Fruit Brix was significantly lower when Potassium was supplied at the rate of 100 kg/ha. No trend could be concluded from this result and it is recommended that further trials be conducted. The results of this experiment show that to maximise fruit quality the Grower Standards should be used, however the yield could be increased by increasing the rate of Nitrogen without any reduction in fruit quality. Thus it is recommended that an increased rate of Nitrogen be applied to future crops. It is also recommended that future trials be conducted to determine the optimum rate of Nitrogen.
63
Mataranka 2004 Base fertiliser trial There appears to be a relationship between calcium level in the leaf and fruit, and fruit Brix and sucrose content. The optimum level of calcium in the soil solution appears to be in the region of 200 mg/L. The research is unclear on which is the best method of applying calcium to plants in the field. Nitrogen and potassium are key nutrients in obtaining the optimal level of vegetative growth. Potassium is important for export of sugars from the source leaves to the fruit and is likely to be critical in the Lycopene (hence flesh colour). High levels of phosphorus are used in the US, and there are indications that these may improve sugars. Aims
1. To test the hypothesis that fruit Brix and Lycopene levels can be affected by potassium and or phosphorus supply; and,
2. Establish optimum levels of Nitrogen, Phosphorus, Potassium and Calcium supply for maximising yield and fruit quality.
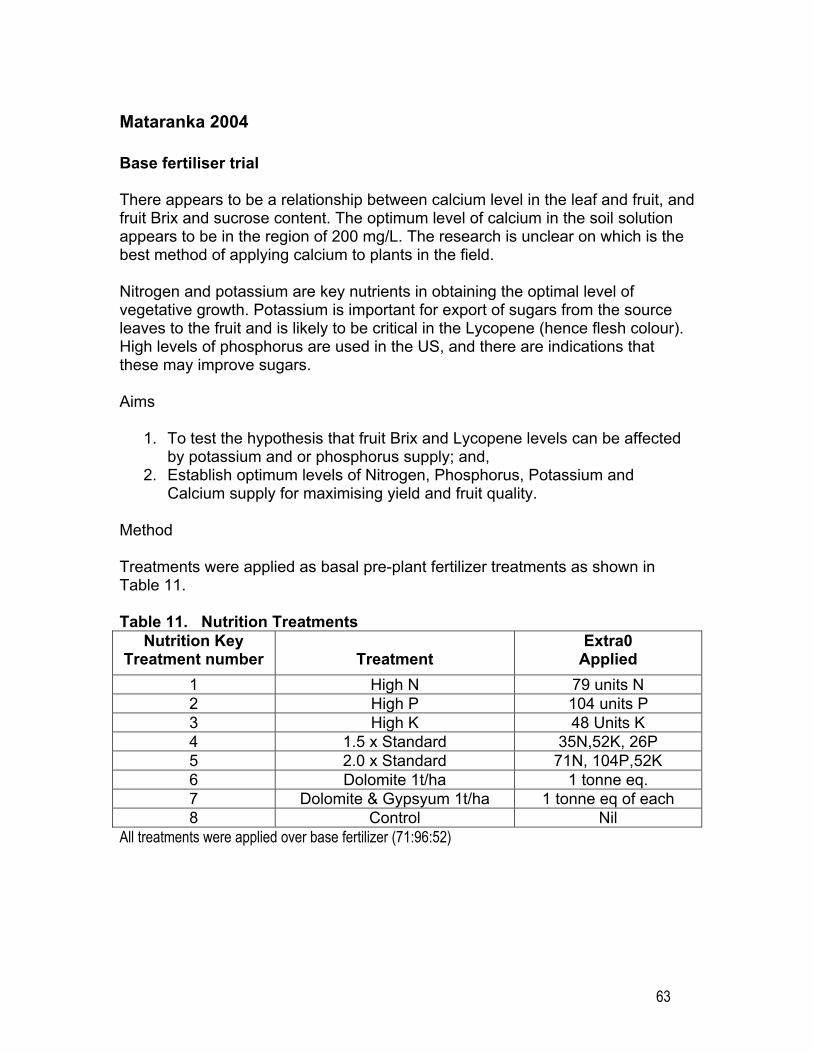
Method Treatments were applied as basal pre-plant fertilizer treatments as shown in Table 11. Table 11. Nutrition Treatments
Nutrition Key Treatment number
Treatment
Extra0 Applied
1 High N 79 units N 2 High P 104 units P 3 High K 48 Units K 4 1.5 x Standard 35N,52K, 26P 5 2.0 x Standard 71N, 104P,52K 6 Dolomite 1t/ha 1 tonne eq. 7 Dolomite & Gypsyum 1t/ha 1 tonne eq of each 8 Control Nil
All treatments were applied over base fertilizer (71:96:52)

64
Figure 36. Fruit Brix - Mataranka Figure 37. Yield - Mataranka
Seedless Water Melon Nutrition Trial Mataranka 2004 - Average Brix %
5
6
7
8
9
10
11
12
13
Control High N High P High K 1.5 x NPK 2.0 x NPK
Dolomite & Gypsum @
1.0 t/ha
Dolimite @ 1.0 t/ha
Treatment
% B
rix
Seedless Water Melon Nutrition Trial Mataranka 2004 - Yield
10000
15000
20000
25000
30000
35000
40000
45000
Control High N High P High K 1.5 x NPK 2.0 x NPK Dolimite @ 1.0t/ha
Dolimite &Gypsum @ 1.0
t/ha
Treatment
Yield
Kg/
ha

65
Fig 38. Fruit weight – Mataranka
Seedless Water Melon Nutrition Trial Mataranka 2004 - Average Fruit Weight
0
1000
2000
3000
4000
5000
6000
7000
8000
9000
Control High N High P High K 1.5 x NPK 2.0 x NPK Dolimite @ 1.0t/ha
Dolimite &Gypsum @ 1.0
t/ha
66
Chinchilla – Summer 2005 Aim The aim of this trial was to test the effectiveness of liquid dolomite and additional NPK fertilizer over the grower standard practice. Methodology The following treatments were applied on large plots (full bays). There was no replication of the basic treatments, but the areas used were large enough to be considered a population, and not a sample of the farm. Variation between bays was be minimal, and gave a much more accurate estimate of yield than would using small plot trials for these experiments. Fruit sampled for all measurements other than yield were selected randomly from within the large plots, giving a useful measure of variation in the experiment.
1. Control = Standard Practice 2. Dolomite = 2 x 25 lt/ha applications + 1 x 15 lt/ha application. 3. Dolomite + Fertilizer = 2 x 25 lt/ha applications + 1 x 15 lt/ha application +
additional Grower Standard Practice was: Terra Firma Melon Mix No1: @ 500kg/ha
1. Nitrogen = 60nuits 2. Phosphorus = 45 units 3. Potassium = 30 units 4. Calcuim = 7.5 units 5. Sulphur = 19 units 6. Copper = 0.25 units 7. Magnesium = 1.5 units 8. Zinc = 0.25 units 9. Boron = 0.1 units 10. Molybdenum = 0.1 units 11. (1 unit = 1 kg/ha)
The trial results were analysed using the following measurements: yield, fruit weight, flesh firmness, cracking, black seeds, flesh colour, taste, Brix, and leaf nutrition tests. Results
• Fruit yield showed that applying 150% base fertilizer did not increase yield more than the standard.
• Liquid dolomite increased yield by 12 % and reduced fruit size by 9%

67
• Liquid dolomite plus additional fertiliser (63N 40P 106K) increased yield by 21%, increased firmness by 10% with no reduction in fruit size.
Fig 39 Yield – Chinchilla
Fig 40. Fruit weight - Chinchilla
Average Fruit Weight (Nutrition Trial)
6809.257475.3757531.75
4000
5000
6000
7000
8000
9000
Liquid Dolimite Liquid Dolimite + Fert StandardTreatment
Ave
rage
Fru
it W
eigh
t (g)
Yield (NutritionTrial)
39.70 35.4043.02
05
101520253035404550
Dolimite Dolimite + Fertilizer Normal 3:1Treatment
Yiel
d T/
ha

68
Fig 41. Fruit Brix - Chinchilla Conclusions Liquid dolomite increased yield by 12 % and reduced fruit size by 9% Liquid dolomite plus additional fertiliser (63N 40P 106K) increased yield by 21%, increased firmness by 10% with no reduction in fruit size The liquid dolomite resulted in an estimated additional net return to the grower of $1645 /ha and liquid dolomite plus additional NPK fertilizer resulted in an additional $2765 /ha. Table 12. Financial analysis - Nutrition ($/ha)
Treatment Costs Returns (40c/kg) Net
Dolomite +$75 +$1720 $1645
Dolomite + extra fert
+$75 +$200 ? +$3040 $2765
Average Fruit Brix (Nutrition Trial)
11.25 12.05 12.25
0
2
4
6
8
10
12
14
Liquid Dolimite Liquid Dolimite + Fert Standard
Ave
rage
Fru
it B
rix\

69
Condoblin - 2005 Aim The aim of this trial is to evaluate three rates of balanced nitrogen, phosphorous, and potassium (NPK) fertilizer program. The control is a ‘best bet’ estimate of the crop requirement and was based on soil test data, tissue tests from previous crops, and results from previous trials. Methodology The trial evaluated 50% 100% and 150% of grower standard as a basal fertilizer application. Each treatment consisted of three rates of fertilizer DAP (250, 500, 750 kg/ha). The other two treatments were 50% more and 50% less than the control. Table 13. Treatments for Fertilizer Trial Plan
Treatment Rate Fert /ha
1 0.5 x grower standard 250 kg/ha DAP
2 Control – grower standard 500 kg/ha DAP
3 1.5 x grower standard 750 kg/ha DAP
Each treatment was applied over 3 rows and the plots were 50m long and replicated three times. The aim will be to establish new tissue standards.
Table14. Fertilizer Trial Layout
150 % Base
50% Base
100 % Base
50% Base
150% Base
100 % Base
Roa
dway
Buffer (30m)
150% Base
50% Base
100 % Base

70
Table 15. Soil amendment, foliar, and liquid fertilizer Program Timing Fertilizer Rate
kg/ha N P K Ca
Soil amendments
GYPSUM 500 90
Lime 4000 720 First irrigation Calcium
nitrate 50 7.5 10
Carbo cal 10 1 infiltrate Zn/B/Mo Fruit set Calcium
nitrate 50 7.5 10
Carbo cal 10 1 Zn/B/Mo Tennis Ball size
Carbo cal 10 1
TOTALS 15 0 0 833 Table 16. N, P, K, and Ca applied Treatment N P K Ca
1. 0.5 x grower standard
2. Grower
standard
3. 1.5 x
grower standard
65 120 172
50 100 150
0 0 0
833 833 833
Totals 357 300 0 2499

71
Chart 1. Soil Analysis Report
Fig 42. Soil test results – Condoblin 2004/05

72
Results The highest yield was achieved using the calculated fertiliser level of 120 kg nitrogen (N), 100 kg phosphorous (P), no potassium (K), which included 15 kg nitrogen per hectare (N/ha), and calcium applied during the crop growing stage, ie the grower standard. Increasing the N and P levels by 50% did not improve yields but actually resulted in softer flesh. Applying only 50% of the grower standard of 65 kg N/ha and 50 kg P/ha reduced the yield and fruit size. The higher levels of N did not result in increased fruit hollowness, which is consistent with previous results from this project. New Leaf Tissue Levels Replicated leaf tissue samples were taken at mid fruit development and analysed by a commercial testing laboratory. The results of these analyses were reviewed and as a result we have suggested same new target leaf tissue levels for sampling at mid fruit development. (Results presented in Table 5). New levels should also be established for an earlier growth stage such as flowering.
Nutrition trial yield
0.0
10.0
20.0
30.0
40.0
50.0
60.0
70.0
50% base 100% base 150% base
Mar
keta
ble
yiel
d t/h
a
Fig 43. Yield – Condoblin 2005
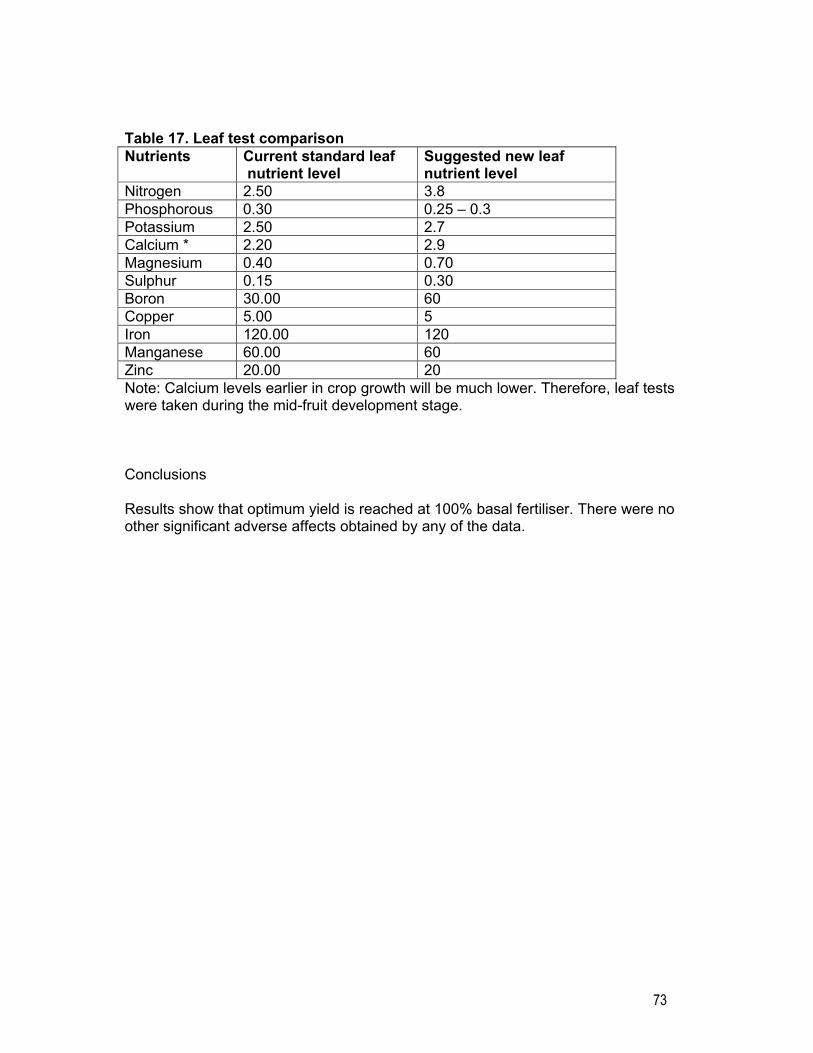
73
Table 17. Leaf test comparison Nutrients Current standard leaf
nutrient level Suggested new leaf nutrient level
Nitrogen 2.50 3.8 Phosphorous 0.30 0.25 – 0.3 Potassium 2.50 2.7 Calcium * 2.20 2.9 Magnesium 0.40 0.70 Sulphur 0.15 0.30 Boron 30.00 60 Copper 5.00 5 Iron 120.00 120 Manganese 60.00 60 Zinc 20.00 20 Note: Calcium levels earlier in crop growth will be much lower. Therefore, leaf tests were taken during the mid-fruit development stage. Conclusions Results show that optimum yield is reached at 100% basal fertiliser. There were no other significant adverse affects obtained by any of the data.
74
3. Foliar Trials
3.1 CPPU – growth regulator
Chinchilla - November/December 2003 Production of parthenocarpic fruit using CPPU and growth regulators Pollination is needed to trigger the production of growth regulators required for fruit development. These growth regulators can be suppled directly to the plant, thereby removing the requirement for triploid seedless watermelon plants to be pollinated. There is strong evidence that high quality parthenocarpic watermelon fruits can be induced by foliar application of CPPU (forchlorfenuron). Aim To determine whether foliar application of CPPU can induce the production of high quality parthenocarpic watermelon. Methodology CPPU was applied at a range of concentrations from 20 mg/L, 50 mg/L, 100 mg/L and 200 mg/L to whole plants. CPPU was also tested in combination with GA3. Plants treated with CPPU were covered by floating row covers to prevent pollination by bees. All Treatments were applied at a water rate equivalent to 500 L/ha. Treatments were as follows:
1. CPPU 20 mg/L 2. CPPU 50 mg/L 3. CPPU 100 mg/L 4. CPPU 200 mg/L 5. CPPU 20 mg/L + GA3 2 mg/L 6. CPPU 50 mg/L + GA3 2 mg/L 7. CPPU 100 mg/L + GA3 2 mg/L 8. CPPU 200 mg/L + GA3 2 mg/L

75
Results The CPPU trial conducted at O’Leary’s in 2003-2004 yielded some very interesting results. All plots in the CPPU trial yielded a very low number of fruit. The numbers of fruit produced from the trial were such that no data could be collected in regards to any differences between treatments. The following Photographs show some of the fruit produced from this trial.
Photo 5. All of the fruit produced displayed internal cracking to varying degrees. Miss shaped fruit was also a common feature of the fruit in the trial. Conclusion The Cracking and production of miss shaped fruit relates to pollination. It is likely that lack of coverage while applying the CPPU onto the ovary in the female flower has contributed greatly to the miss shaped appearance of much of the fruit. Further exploration of this technology is still necessary at this point. If this technology can be managed in a way that good quality fruit could be produced, CPPU could become a great management tool for scheduling seedless production.

76
3.2 GA3 – Bowen and Chinchilla
Bowen, Qld - Autumn 2003 Gibberellic Acid Experiment Pollination is needed to trigger the production of growth regulators required for fruit development. These growth regulators can be suppled directly to the plant, potentially improving fruit set and quality of the fruit produced. An experiment was set up evaluating 5 rates of Gibberellic Acid (GA) applied at late flowering/fruit set. There is some literature that suggests that fruit set and fruit quality can be improved through the application of GA. Table 18. Treatments Treatment Name Description Control None GA 5ppm Gibberellic Acid applied to runoff at 5ppm GA 10ppm Gibberellic Acid applied to runoff at 10ppm GA 25ppm Gibberellic Acid applied to runoff at 25ppm GA 50ppm Gibberellic Acid applied to runoff at 50ppm GA 100ppm Gibberellic Acid applied to runoff at 100ppm
GA treatments were applied once at late flowering stage. Results Summary No Differences were observed between treatments in:
6. Number of seeded melons 7. Mean Fruit weight, length or diameter 8. Fruit Firmness Rating 9. Presence/Absence of Black Seeds 10. Presence/Absence of Light coloured areas of flesh
Relative to the Control:
7. The number of seedless melons was significantly higher where GA was applied at 100ppm (Fig 44)
8. Plant vigour was higher wherever GA was applied at all rates (Fig 45) 9. Fruit Brix was lower in GA treatments (Fig 46) 10. Generally fruit flavour rating was lower in GA treatments (Fig 47) 11. GA treatments showed higher resistance to cracking (Fig 48) 12. Fruit yield was significantly higher where GA was applied at 100ppm (Fig 49)

77
Fruit Number - Seedless
0
2
4
6
8
10
12
14
Control GA 5ppmAverage
GA 10ppmAverage
GA 25ppmAverage
GA 50ppmAverage
GA 100ppmAverage
Frui
t Num
ber p
er 1
0m
Fig 44. Fruit number - Bowen
Crop Vigour
0
0.5
1
1.5
2
2.5
3
3.5
4
4.5
5
Control GA 5ppmAverage
GA 10ppmAverage
GA 25ppmAverage
GA 50ppmAverage
GA 100ppmAverage
Vigo
ur R
atin
g (1
-5
Fig 45. Crop vigour rating
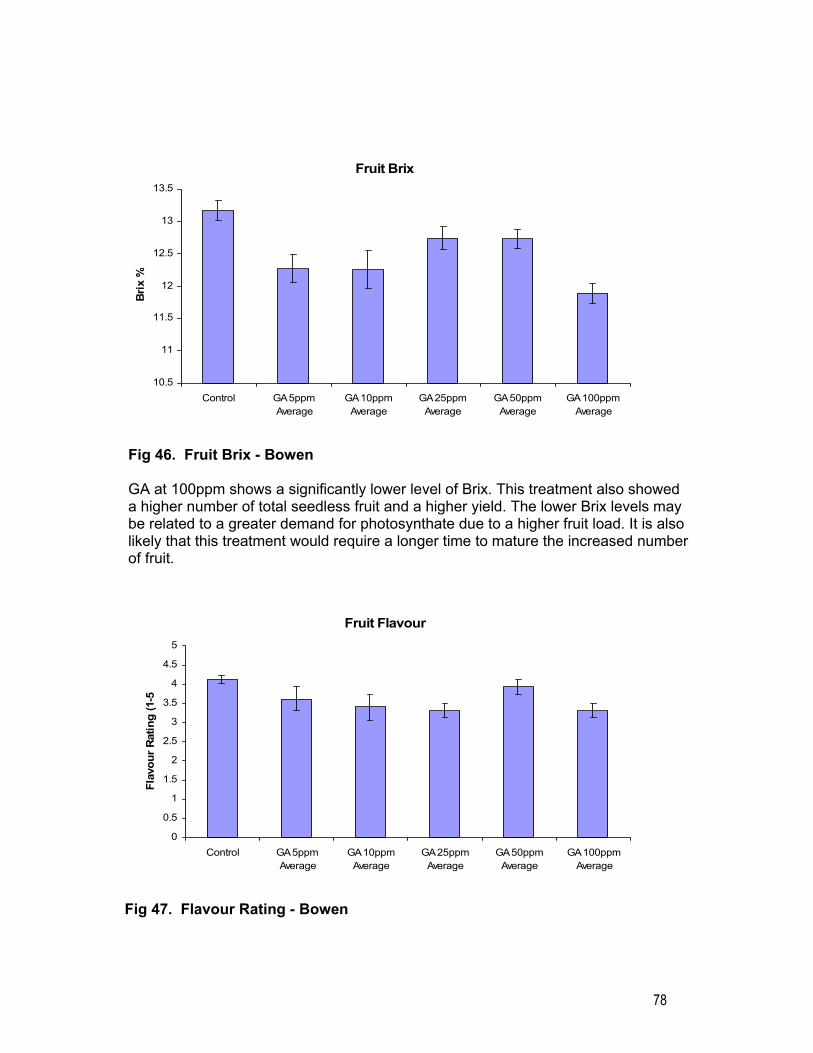
78
Fruit Brix
10.5
11
11.5
12
12.5
13
13.5
Control GA 5ppmAverage
GA 10ppmAverage
GA 25ppmAverage
GA 50ppmAverage
GA 100ppmAverage
Brix
%
Fig 46. Fruit Brix - Bowen GA at 100ppm shows a significantly lower level of Brix. This treatment also showed a higher number of total seedless fruit and a higher yield. The lower Brix levels may be related to a greater demand for photosynthate due to a higher fruit load. It is also likely that this treatment would require a longer time to mature the increased number of fruit.
Fruit Flavour
0
0.5
1
1.5
2
2.5
3
3.5
4
4.5
5
Control GA 5ppmAverage
GA 10ppmAverage
GA 25ppmAverage
GA 50ppmAverage
GA 100ppmAverage
Flav
our R
atin
g (1
-5)
Fig 47. Flavour Rating - Bowen

79
Cracking Resistance
0
0.5
1
1.5
2
2.5
3
3.5
4
4.5
5
Control GA 5ppmAverage
GA 10ppmAverage
GA 25ppmAverage
GA 50ppmAverage
GA 100ppmAverage
Crac
king
Res
ista
nce
(1-5
Fig 48. Cracking resistance - Bowen
Estimated Yield
0
5
10
15
20
25
30
35
40
45
Control GA 5ppmAverage
GA 10ppmAverage
GA 25ppmAverage
GA 50ppmAverage
GA 100ppmAverage
Est.
Yiel
d (t/
ha
Fig 49. Yield - Bowen Conclusions This trial tested a form of plant available silica. The trial produced results with no significant difference between treatments.

80
Chinchilla - November/December 2003 Foliar sprays It is believed that the application of both Gibberellic Acid and foliar Calcium applied as foliar sprays have the potential to improve cell growth and sugar accumulation in seedless watermelons. Aim The aim of this trial was to evaluate the effects and determine the optimum rate of both foliar calcium and foliar Gibberellic Acid. Two products applied as foliar sprays were tested. One is a GA spray, applied twice which may help with cell growth and sugars accumulation. The other is a form of plant-available Calcium which is also applied as a foliar spray. Method This trial tested four levels of Calcium (0.5, 1.0, 2.0 and 4.0 L/ha) applied as a foliar spray and two levels of Gibberellic Acid (100 and 200 mg/L) applied as a foliar spray compared to a control with no foliar spray applications. A randomised complete block design was used with treatments replicated four times in 10 m long plots. Measurements: Yield, fruit size and number, Flesh quality (Brix, colour, cracking
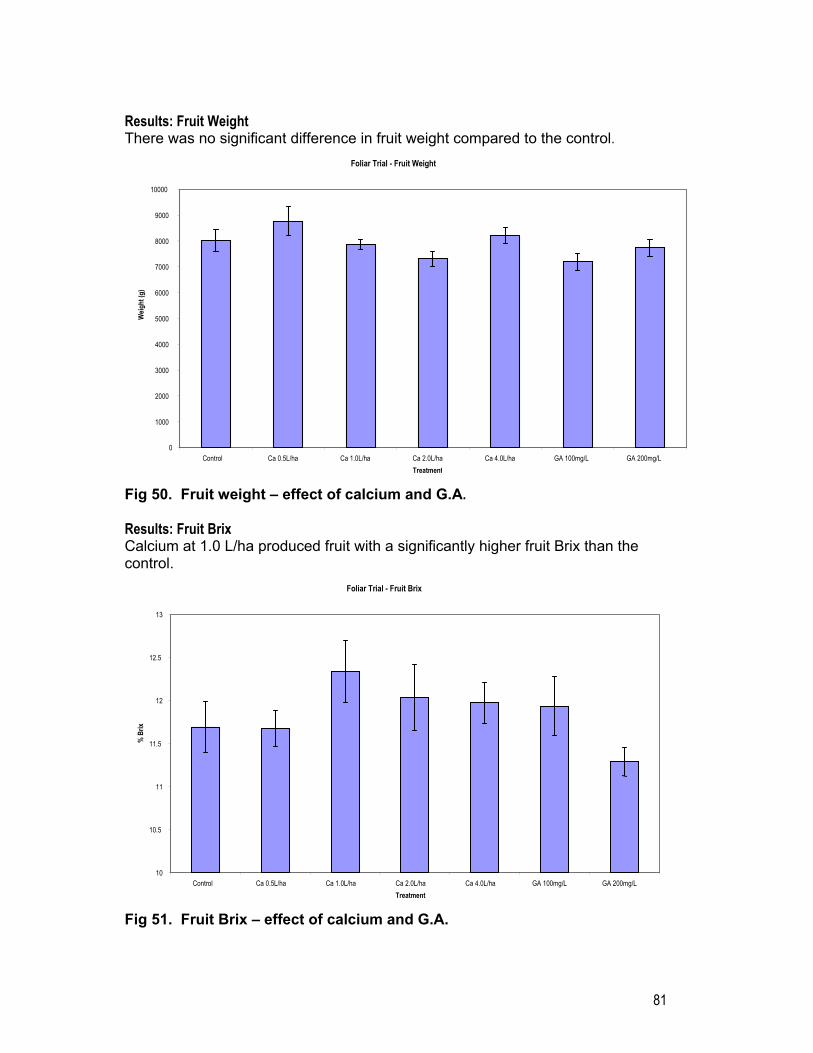
81
Results: Fruit Weight There was no significant difference in fruit weight compared to the control.
Fig 50. Fruit weight – effect of calcium and G.A. Results: Fruit Brix Calcium at 1.0 L/ha produced fruit with a significantly higher fruit Brix than the control.
Fig 51. Fruit Brix – effect of calcium and G.A.
Foliar Trial - Fruit Weight
0
1000
2000
3000
4000
5000
6000
7000
8000
9000
10000
Control Ca 0.5L/ha Ca 1.0L/ha Ca 2.0L/ha Ca 4.0L/ha GA 100mg/L GA 200mg/LTreatment
Weig
ht (g
)
Foliar Trial - Fruit Brix
10
10.5
11
11.5
12
12.5
13
Control Ca 0.5L/ha Ca 1.0L/ha Ca 2.0L/ha Ca 4.0L/ha GA 100mg/L GA 200mg/LTreatment
% B
rix
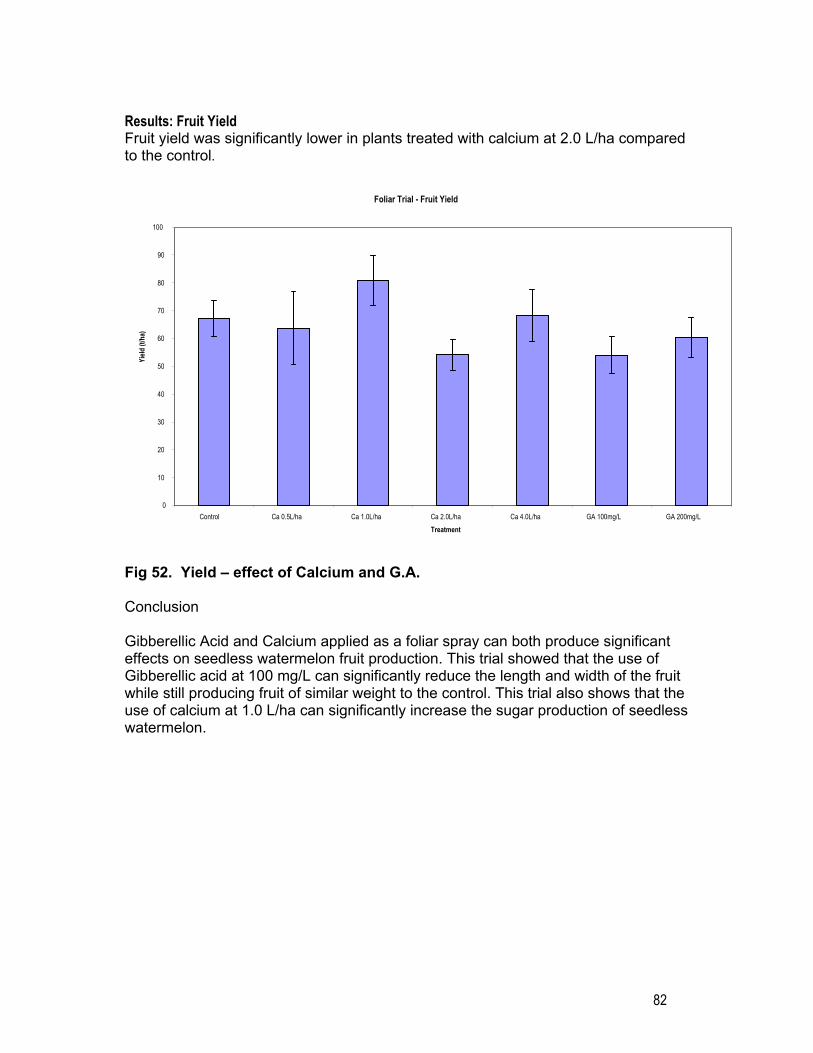
82
Results: Fruit Yield Fruit yield was significantly lower in plants treated with calcium at 2.0 L/ha compared to the control.
Fig 52. Yield – effect of Calcium and G.A. Conclusion Gibberellic Acid and Calcium applied as a foliar spray can both produce significant effects on seedless watermelon fruit production. This trial showed that the use of Gibberellic acid at 100 mg/L can significantly reduce the length and width of the fruit while still producing fruit of similar weight to the control. This trial also shows that the use of calcium at 1.0 L/ha can significantly increase the sugar production of seedless watermelon.
Foliar Trial - Fruit Yield
0
10
20
30
40
50
60
70
80
90
100
Control Ca 0.5L/ha Ca 1.0L/ha Ca 2.0L/ha Ca 4.0L/ha GA 100mg/L GA 200mg/LTreatment
Yield
(t/h
a)

83
3.3 Potassium & NBX
Victoria – Summer 2003-2004 Foliar fertiliser trial Aim The aim of this trial is to evaluate the effects and determine the optimum rate of application of foliar potassium and NBX. Methodology This trial tested three levels of NBX (2, 3, and 4 L/ha) applied two weeks prior to harvest and three levels of 24% Potassium (2.6, 3.9, and 5.2 L/ha) applied at 4, 5, and 6 weeks after transplant compared to a control with no foliar fertiliser applications. A randomised complete block design was used with treatments replicated three times in 10 metre long plots consisting of six seedless watermelons and three pollinators. Measurements: Yield, fruit size and number, Flesh quality (Brix, colour, cracking).

84
Results: Fruit Yield Fruit yield was significantly decreased by the application of NBX at 2 and 3 L/ha and by 24% Potassium at 2.6 and 5.2 L/ha.
Foliar Fertiliser Trial - Fruit Yield
8
13
18
23
28
33
38
Control NBX 2L/ha NBX 3L/ha NBX 4L/ha 24% K @ 2.6L/ha 24% K @ 3.9L/ha 24% K @ 5.2L/ha
Foliar Fertiliser Treatment
Yiel
d (t/
ha)
Fig 53. Effect of NBX and K on yield

85
Results: Fruit Cracking Fruit cracking was significantly increased by the application of NBX at 3 and 4 L/ha.
Fig 54. Effect of NBX & K on fruit cracking Results Fruit Length, Weight, Brix, and Firmness showed no significant difference for all treatments. Conclusion These results clearly show that the effects of both foliar potassium and NBX on yield and quality gave no significant benefit. Thus it is concluded that neither foliar fertiliser be applied on this farm.
Foliar Fertiliser Trial - Fruit Cracking
0
0.5
1
1.5
2
2.5
3
Control NBX 2L/ha NBX 3L/ha NBX 4L/ha 24% K @ 2.6L/ha 24% K @ 3.9L/ha 24% K @ 5.2L/ha
Foliar Fertiliser Treatment
Crac
king
Rate
(1-5
)

86
4. Irrigation
4.1 Irrigation Trials
Bowen, Qld - Autumn 2003 Aim Water management was highlighted in the literature review as an area critical to yield, internal cracking and sugar accumulation in seedless watermelons. There is evidence that frequent watering after flowering can result in fruit cracking. If soil moisture levels are too low, especially after flowering, yield is reduced. Methodology Watermelon growth was divided into 4 stages:
1. Transplant to 1st Flower 2. Flowering / Fruit set – late fruit development – i.e. fruit growth phase 3. Late fruit development 4. Harvest Period
A level of water stress was imposed at each growth phase based on published reference information on seedless watermelon. The soil moisture levels were monitored using an EnviroSCAN equipped with remote access capability so that soil moisture status of all trials can be monitored in the AHR office in Sydney, as well as on the farm. Table 19. Treatments Treatment Name Description Control Standard Practice Moderate Stress - 1st Flower Apply moderate stress from transplant to 1st
flower – similar to Control Moderate Stress - Fruit Growth
Apply a moderate stress from fruit set to late fruit development
Moderate Stress - Late Fruit Dev.
Apply a moderate stress from fruit set to Late fruit development
Moderate Stress - Harvest Apply a moderate stress during harvest
*“Moderate Stress” involved the treated area receiving every second irrigation.

87
Results Summary No Differences were observed between treatments in:
11. Number of seedless melons 12. Number of seeded melons 13. Mean fruit weight, length or diameter 14. Fruit Brix 15. Fruit firmness rating 16. Resistance to fruit cracking 17. Presence/Absence of black seeds 18. Presence/Absence of light coloured areas of flesh
Relative to the Control:
19. Plant vigour was slightly lower in treatments stressed at harvest (Fig 1) 20. Fruit flavour rating was lower in treatments stressed during late fruit
development and at harvest (Fig 2) 21. Fruit yield was slightly higher in treatments stresses during late fruit
development and at harvest (Fig 3)
Crop Vigour
0
0.5
1
1.5
2
2.5
3
3.5
4
4.5
Control Moderate Stress -1st Flower
Moderate Stress -Fruit Growth
Moderate Stress -Late Fruit Dev.
Moderate Stress -Harvest
Vig
our
Rat
ing
(1-5
Fig 55. Effect of water stress on vine vigor

88
Fruit Flavour
0
0.5
1
1.5
2
2.5
3
3.5
4
4.5
Control Moderate Stress -1st Flower
Moderate Stress -Fruit Growth
Moderate Stress -Late Fruit Dev.
Moderate Stress -Harvest
Flav
our R
atin
g (1
-5)
Fig. 56. Effect of water stress on fruit flavour. Figure 3
Estimated Yield
0.0
10.0
20.0
30.0
40.0
50.0
60.0
Control Moderate Stress -1st Flower
Moderate Stress -Fruit Growth
Moderate Stress -Late Fruit Dev.
Moderate Stress -Harvest
Est.
Yiel
d (t
/ha)
Fig. 57. Effect of water stress on yield

89
Conclusion This trial tested the effects of water stress at various growth stages on seedless watermelon. The trial showed that inducing water stress during late fruit development and at harvest increased yield and fruit flavour rating.

90
Bowen, Qld - Spring 2003 Irrigation trial Aims Water management was highlighted in the literature review as an area critical to yield, internal cracking and sugar accumulation in seedless watermelons. There is evidence that frequent watering after flowering can result in fruit cracking. If soil moisture levels are too low, especially after flowering, yield is reduced. The aim of soil moisture monitoring in this trial was to establish water stress and field capacity threshold points in preparation for in-depth studies in water management next season. Methodology Watermelon growth was divided into 4 stages and moderate stress or additional water provided at each stage. The soil moisture levels were monitored using an EnviroSCAN equipped with remote access capability so that soil moisture status of all trials can be monitored by AHR, as well as on the farm. Table 20. Treatments Treatment Name Description Reduced - Transplant to Flowering
Standard Practice
Reduced - Flowering to 10-15cm Fruit
Apply a moderate stress from flowering to 10-15cm fruit
Reduced - 10-15cm to 1 week before harvest
Apply a moderate stress from 10-15cm fruit to late fruit development
Reduced - 1 week before to end of harvest
Apply a moderate stress from late fruit development to end of harvest period
Extra - Transplant to Flowering
Supply additional water to maintain field capacity from transplant to flowering
Extra - Flowering to 10-15cm Fruit
Supply additional water from flowering to 10-15cm fruit
Extra - 10-15cm to 1 week before harvest
Supply additional water from 10-15cm fruit to late fruit development
Extra - 1 week before to end of harvest
Supply additional water from late fruit development to end of harvest period

91
Results: Fruit Weight Fruit weight was significantly reduced by applying stress during early fruit development and by providing additional water during harvest.
Figure 58. Irrigation: fruit weight - Bowen
Irrigation Trial - Fruit Weight
0.00
1.00
2.00
3.00
4.00
5.00
6.00
7.00
8.00
Reduced -Flowering to 10-
15cm Fruit
Reduced - 10-15cm to 1 weekbefore harvest
Reduced - 1 weekbefore to end of
harvest
Extra - Transplantto Flowering
Extra - Floweringto 10-15cm Fruit
Extra - 10-15cmFruit to 1 weekbefore harvest
Extra - 1 weekbefore to end of
harvest
Irrigation Treatment
Wei
ght (
kg)
Reduced – Transplant to Flowering
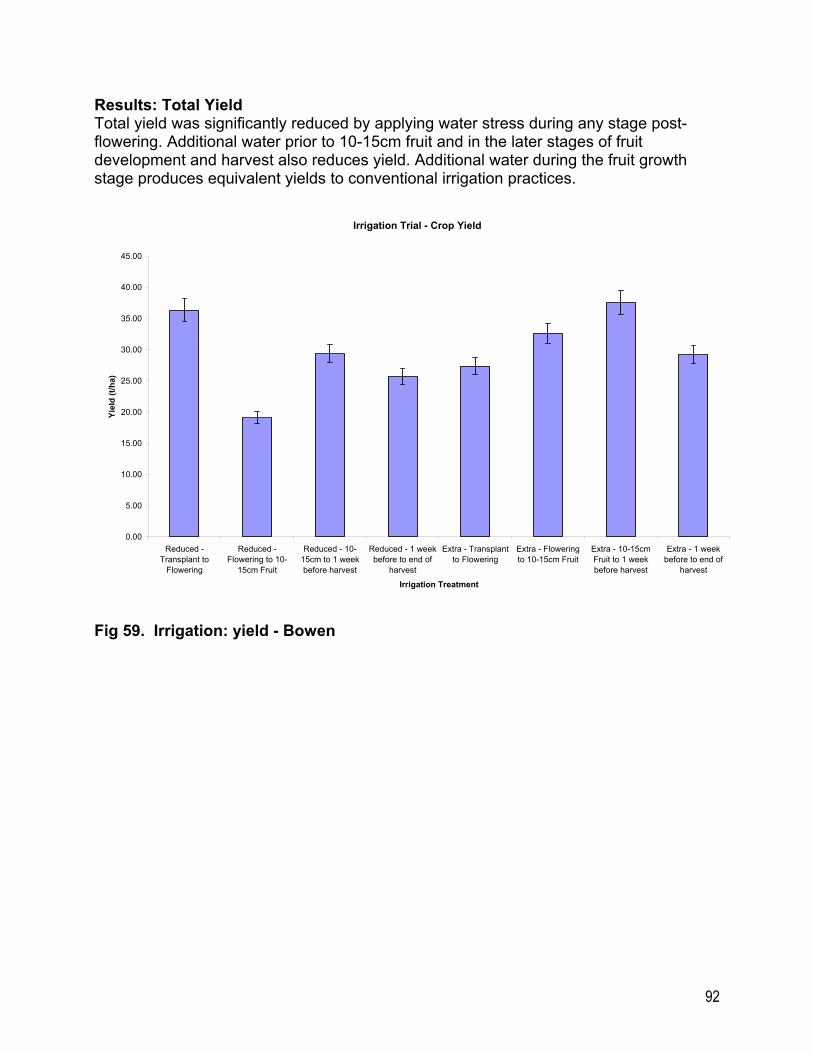
92
Results: Total Yield Total yield was significantly reduced by applying water stress during any stage post-flowering. Additional water prior to 10-15cm fruit and in the later stages of fruit development and harvest also reduces yield. Additional water during the fruit growth stage produces equivalent yields to conventional irrigation practices.
Irrigation Trial - Crop Yield
0.00
5.00
10.00
15.00
20.00
25.00
30.00
35.00
40.00
45.00
Reduced -Transplant to
Flowering
Reduced -Flowering to 10-
15cm Fruit
Reduced - 10-15cm to 1 weekbefore harvest
Reduced - 1 weekbefore to end of
harvest
Extra - Transplantto Flowering
Extra - Floweringto 10-15cm Fruit
Extra - 10-15cmFruit to 1 weekbefore harvest
Extra - 1 weekbefore to end of
harvest
Irrigation Treatment
Yiel
d (t/
ha)
Fig 59. Irrigation: yield - Bowen
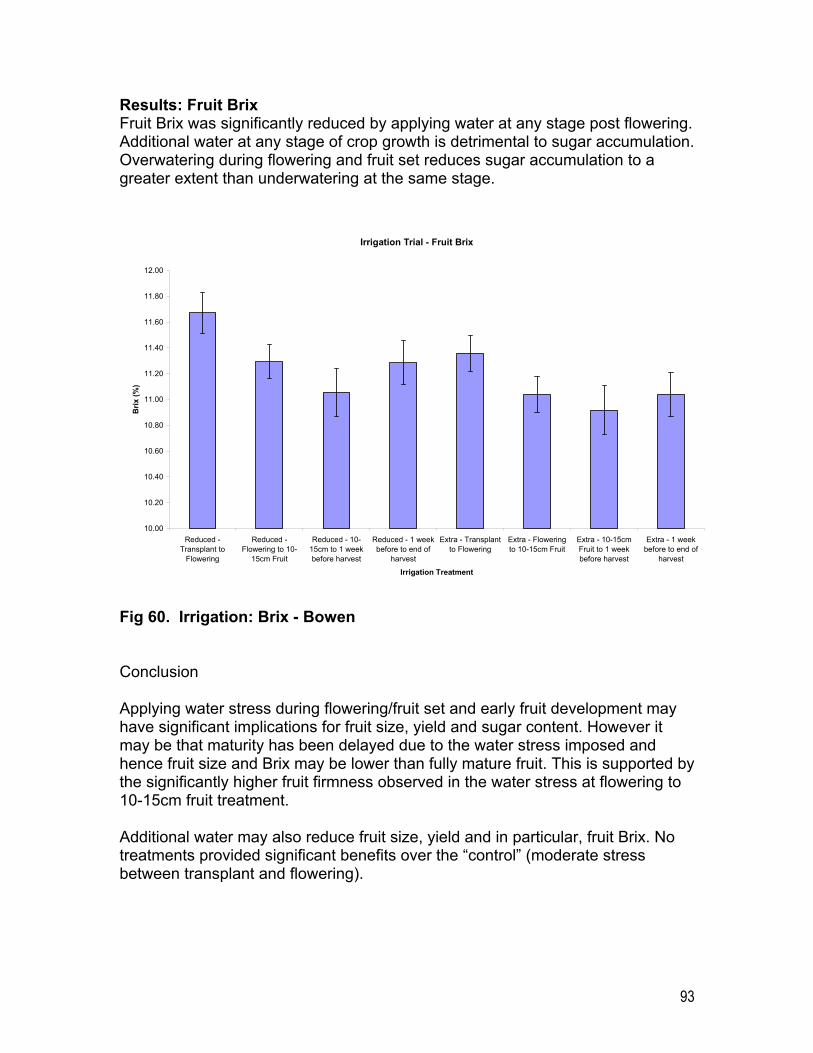
93
Results: Fruit Brix Fruit Brix was significantly reduced by applying water at any stage post flowering. Additional water at any stage of crop growth is detrimental to sugar accumulation. Overwatering during flowering and fruit set reduces sugar accumulation to a greater extent than underwatering at the same stage.
Irrigation Trial - Fruit Brix
10.00
10.20
10.40
10.60
10.80
11.00
11.20
11.40
11.60
11.80
12.00
Reduced -Transplant to
Flowering
Reduced -Flowering to 10-
15cm Fruit
Reduced - 10-15cm to 1 weekbefore harvest
Reduced - 1 weekbefore to end of
harvest
Extra - Transplantto Flowering
Extra - Floweringto 10-15cm Fruit
Extra - 10-15cmFruit to 1 weekbefore harvest
Extra - 1 weekbefore to end of
harvest
Irrigation Treatment
Brix
(%)
Fig 60. Irrigation: Brix - Bowen
Conclusion Applying water stress during flowering/fruit set and early fruit development may have significant implications for fruit size, yield and sugar content. However it may be that maturity has been delayed due to the water stress imposed and hence fruit size and Brix may be lower than fully mature fruit. This is supported by the significantly higher fruit firmness observed in the water stress at flowering to 10-15cm fruit treatment. Additional water may also reduce fruit size, yield and in particular, fruit Brix. No treatments provided significant benefits over the “control” (moderate stress between transplant and flowering).

94
Chinchilla - November/December 2003 Irrigation Trial Aims Water management was highlighted in the literature review as an area critical to yield, internal cracking and sugar accumulation in seedless watermelons. There is evidence that frequent watering after flowering can result in fruit cracking. If soil moisture levels are too low, especially after flowering, yield is reduced. Method The water stress and field capacity threshold points will be initially established for the trial site. Variations in optimum irrigation management practices are expected in different regions due to soil and climatic variations. Watermelon growth was divided into 4 stages:
1. Transplant to 1st Flower 2. Flowering / Fruit set – late fruit development – i.e. fruit growth phase 3. Late fruit development 4. Harvest Period
Two levels of water stress will be imposed at each growth phase and are based on published reference information on seedless watermelon. The soil moisture levels were monitored using an EnviroSCAN equipped with remote access capability. The treatments will be:
1. Additional Water – Twice the amount of water applied during particular irrigations.
2. Reduced Water - No irrigation at scheduled irrigations times. This gives a total of 8 irrigation treatments. This trial was design as a Randomised Split plot design with four replicates. Plots were 10m long and trickle irrigation was used to supply water to all plots.

95
Results: Fruit Weight Fruit weight was significantly increased by reducing the water at both the late fruit development and harvest period.
Fig 61. Irrigation: fruit weight - Chinchilla
Irrigation Trial - Fruit Weight
7500
8000
8500
9000
9500
10000
10500
Irrigation Treatment
Weig
ht (g
)
Transplant to 1st Flower – Additional
Water Flowering to Fruit set – Additional
Water Flowering to Fruit
set – Reduced Water
Late Fruit development –
Reduceed Water
Harvest Period Reduced Water
Transplant to 1st Flower – Reduced
Water Late fruit
development – Additional water
Harvest Period Additional Water

96
Results: Fruit Brix Reducing the irrigation at the transplant to first flower, the flowering to fruit set and the late fruit development periods significantly increased fruit Brix.
Fig 62. Irrigation: Fruit Brix - Chinchilla
Irrigation Trial - Fruit Brix
11
11.2
11.4
11.6
11.8
12
12.2
12.4
12.6
12.8
Irrigation Treatment
% B
rix
Transplant to 1st Flower – Reduced
Water Transplant to 1st
Flower – Additional Water
Flowering to Fruitset – Reduced
Water Flowering to Fruit set – Additional
Water Late Fruit
development – Reduceed Water
Late fruit development –
Additional water
Harvest Period Reduced Water
Harvest Period Additional Water

97
Results: Fruit Yield Fruit yield was significantly increased by applying additional irrigation water during the flowering to fruit set growth period.
Fig 63. Irrigation: Yield - Chinchilla Conclusion In this trial applying reduced irrigation water between transplant and harvest produced larger, heavier fruit with higher sugar contents than if additional irrigation water had been applied. However to maximise yields it is recommended that additional irrigation water be supplied between transplant and fruit set. The greater yields produced by applying additional irrigation water are possibly the result of greater fruit set due to optimal irrigation
Irrigation Trial - Fruit Yield
0
10
20
30
40
50
60
Irrigation Treatment
Yield
(t/h
a)
Transplant to 1st Flower – Reduced
Water Transplant to 1st
Flower – Additional Water
Flowering to Fruitset – Reduced
Water Flowering to Fruit set – Additional
Water Late Fruit
development – Reduceed Water
Late fruit development –
Additional water
Harvest Period Reduced Water
Harvest Period Additional Water

98
Victoria – Summer 2003-2004 Irrigation Trials Aims Water management was highlighted in the literature review as an area critical to yield, internal cracking and sugar accumulation in seedless watermelons. There is evidence that frequent watering after flowering can result in fruit cracking. If soil moisture levels are too low, especially after flowering, yield is reduced. Methodology The water stress and field capacity threshold points were initially established for the trial site. Variations in optimum irrigation management practices are expected in different regions due to soil and climatic variations. Watermelon growth was divided into 4 stages:
1. Transplant to 1st Flower 2. Flowering / Fruit set – late fruit development – i.e. fruit growth phase 3. Late fruit development 4. Harvest Period
Two levels of water stress were imposed at each growth phase and are based on published reference information on seedless watermelon. The soil moisture levels were monitored using an EnviroSCAN equipped with remote access capability so that soil moisture status of all trials could monitored in the AHR office in Sydney, as well as on the farm. This gave a total 8 irrigation treatments. The trial was designed as a Randomised Compete Block Design. Plots were 10m long and Trickle irrigation was used to supply water to all plots.
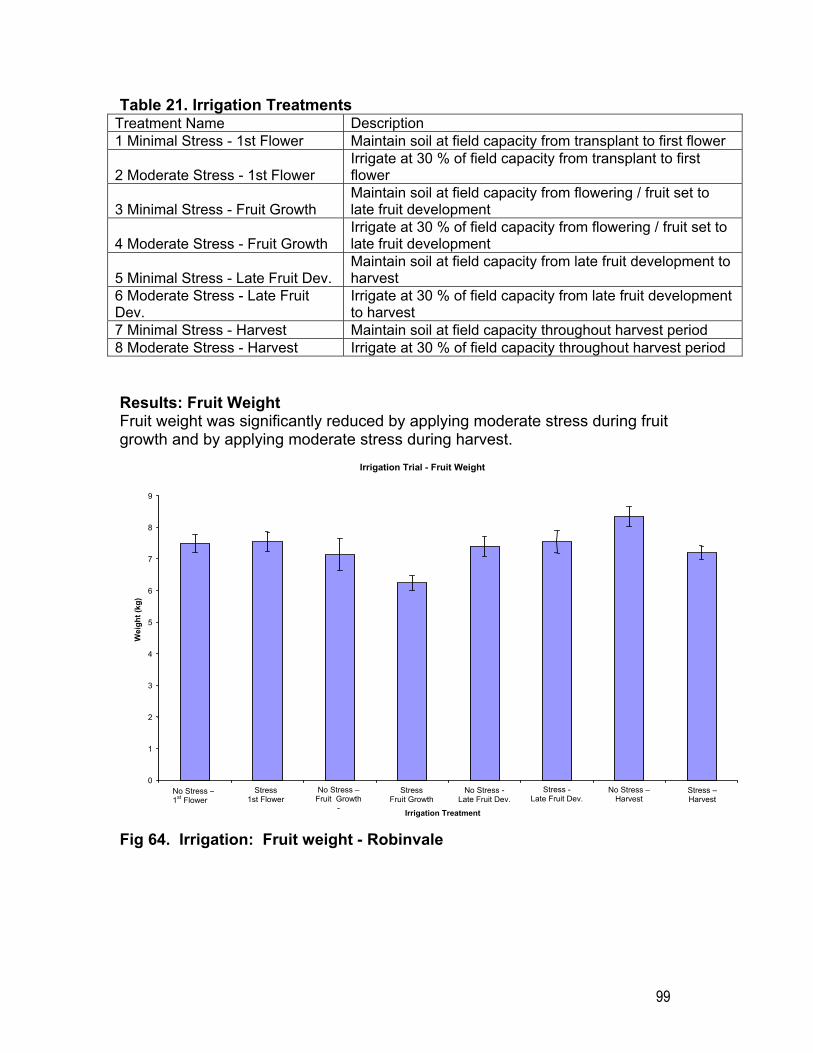
99
Table 21. Irrigation Treatments Treatment Name Description 1 Minimal Stress - 1st Flower Maintain soil at field capacity from transplant to first flower
2 Moderate Stress - 1st Flower Irrigate at 30 % of field capacity from transplant to first flower
3 Minimal Stress - Fruit Growth Maintain soil at field capacity from flowering / fruit set to late fruit development
4 Moderate Stress - Fruit Growth Irrigate at 30 % of field capacity from flowering / fruit set to late fruit development
5 Minimal Stress - Late Fruit Dev. Maintain soil at field capacity from late fruit development to harvest
6 Moderate Stress - Late Fruit Dev.
Irrigate at 30 % of field capacity from late fruit development to harvest
7 Minimal Stress - Harvest Maintain soil at field capacity throughout harvest period 8 Moderate Stress - Harvest Irrigate at 30 % of field capacity throughout harvest period Results: Fruit Weight Fruit weight was significantly reduced by applying moderate stress during fruit growth and by applying moderate stress during harvest.
Fig 64. Irrigation: Fruit weight - Robinvale
Irrigation Trial - Fruit Weight
0
1
2
3
4
5
6
7
8
9
No Stress –1st Flower No Stress –
Fruit Growth - No Stress –
Harvest Irrigation Treatment
Wei
ght (
kg)
Stress 1st Flower
Stress Fruit Growth
No Stress - Late Fruit Dev.
Stress - Late Fruit Dev.
Stress –Harvest

100
Results: Fruit Yield Fruit yield was significantly reduced by applying moderate stress during fruit growth and by applying moderate stress during harvest. Yields were unaffected by moderate or minimal stress during the transplant to flowering period.
Fig 65. Irrigation: Yield - Robinvale
Irrigation Treatment - Fruit Yield
8
13
18
23
28
33
38
43
48
53
58
Irrigation Treatment
Yiel
d (t/
ha)
No Stress –1st Flower Stress
1st FlowerNo Stress –
Fruit Growth -
Stress Fruit Growth
No Stress - Late Fruit Dev.
Stress - Late Fruit Dev.
No Stress –Harvest Stress –
Harvest
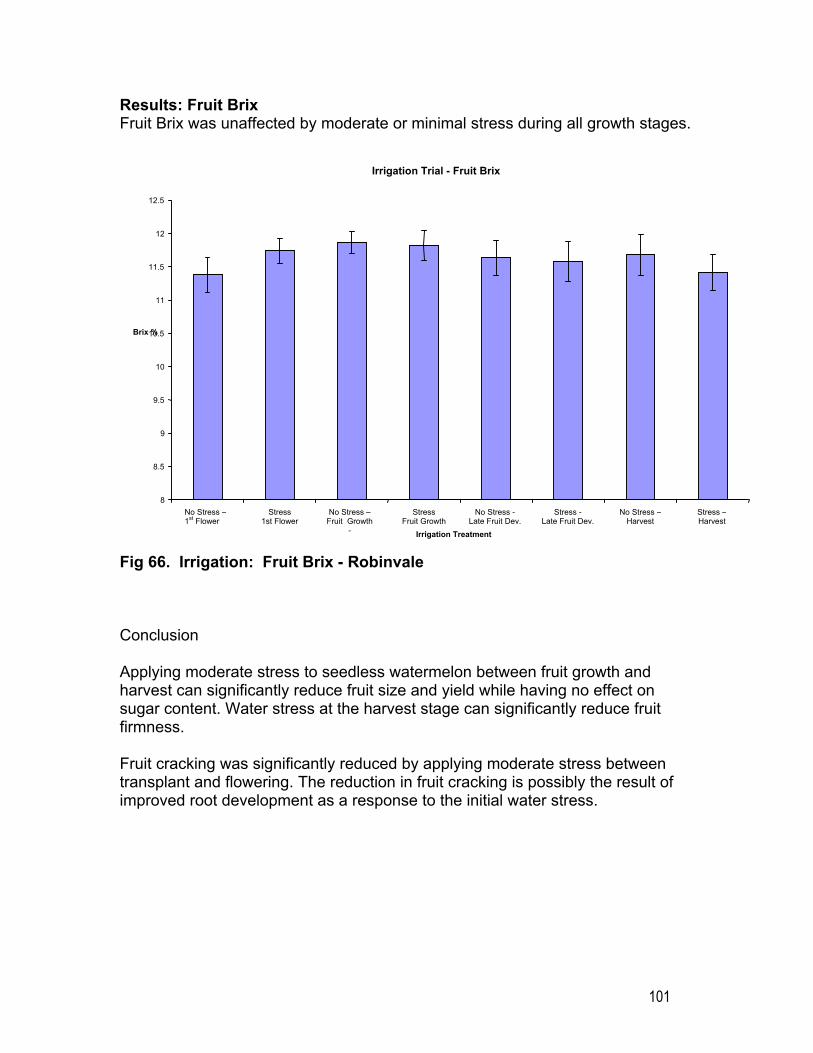
101
Results: Fruit Brix Fruit Brix was unaffected by moderate or minimal stress during all growth stages.
Fig 66. Irrigation: Fruit Brix - Robinvale Conclusion Applying moderate stress to seedless watermelon between fruit growth and harvest can significantly reduce fruit size and yield while having no effect on sugar content. Water stress at the harvest stage can significantly reduce fruit firmness. Fruit cracking was significantly reduced by applying moderate stress between transplant and flowering. The reduction in fruit cracking is possibly the result of improved root development as a response to the initial water stress.
Irrigation Trial - Fruit Brix
8
8.5
9
9.5
10
10.5
11
11.5
12
12.5
Irrigation Treatment
Brix %
No Stress –1st Flower Stress
1st FlowerNo Stress –
Fruit Growth -
Stress Fruit Growth
No Stress - Late Fruit Dev.
Stress - Late Fruit Dev.
No Stress –Harvest Stress –
Harvest

102
Condoblin – 2005 Aim The aim of this trial was to test the effect of applying either more water or less water than the grower’s standard irrigation practice on yield and quality. Previous trials have indicated that keeping seedless watermelon plants free of water stress throughout the whole growth of the plant results in the healthiest plants and highest yields of good quality fruit. Methods 175 L/hr/100m trickle tube was installed in all rows except control in addition to the standard 250 L/hr/100m. To obtain lower irrigation rates, the 250 L/hr tubes were turned off, leaving only 175 L/hr tube connected. To achieve higher irrigation rates, both 175 and 250 L/hr tubes were turned on. Taps were turned off to run according to crop growth stages. Three stages are identified:
• Early (to first male flower) • Mid (to fruit golf ball size) • Fruit development (to harvest)
Three treatments include:
• less water 175 l/h/100m • standard water 250 L/h/100m • more water during vegetative and flowering (425 L/h/100m)
Table 22. Trial design
Buffer 1. Less water (vegetative) 175 L/h 3. Less water Mid (early fruit development)
175 L/h
5. Less water Late (late fruit development)
175 L/h
2. More water (vegetative) 425 L/h 4. More water Mid (early fruit development)
425 L/h
6. More water Late (late fruit development)
425 L/h
7. Grower Standard 250 L/h
Roa
dway
Buffer

103
The plots were 70m long with 20m being a buffer to reduce end-of-row effect. Sentek’s EnviroSCAN technology was installed to monitor soil moisture during the trial. Results Generally, the higher applications of water (425 L/h) yielded more fruit.
Marketable yield
0.0
10.0
20.0
30.0
40.0
50.0
60.0
70.0
1. L
ess
wat
er(v
eget
ativ
e)
2. L
ess
wat
erM
id (e
arly
frui
t)
3. L
ess
wat
erLa
te (l
ate
fruit)
4. M
ore
wat
er(v
eget
ativ
e)
5. M
ore
wat
erM
id (e
arly
frui
t)
6. M
ore
wat
erLa
te (l
ate
fruit)
7. G
row
erS
tand
ard
tonn
es/h
a
Fig 67. Irrigation: Yield - Condoblin
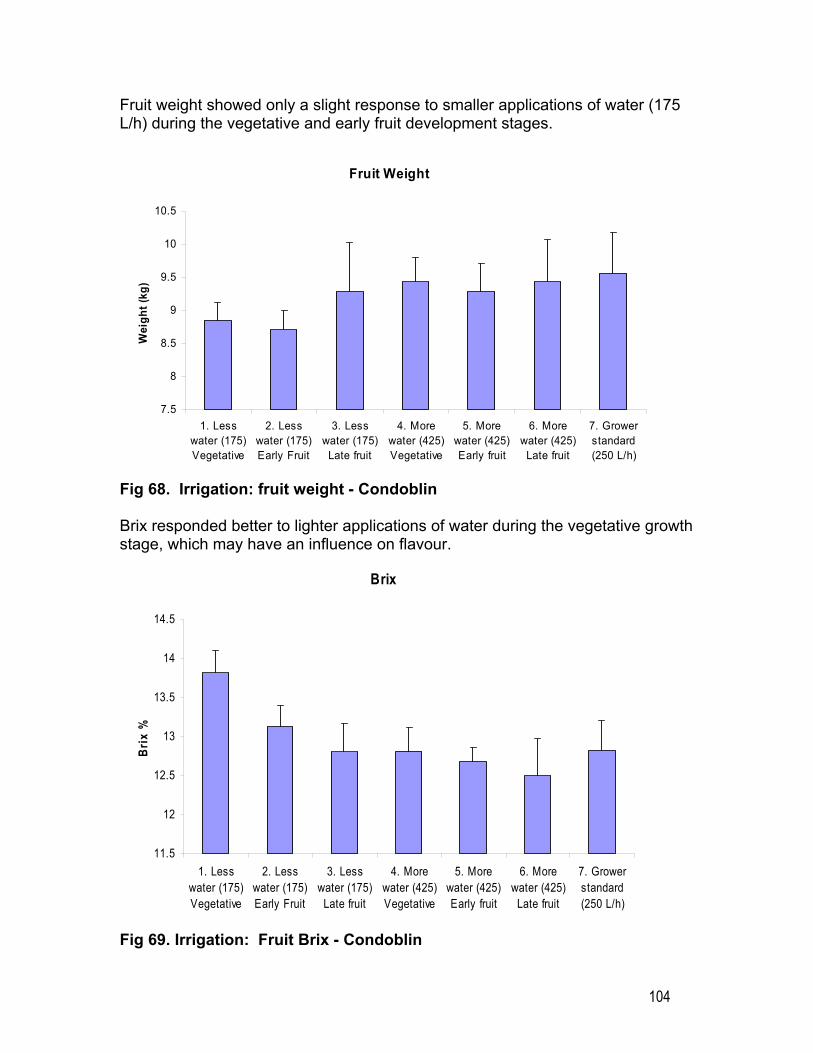
104
Fruit weight showed only a slight response to smaller applications of water (175 L/h) during the vegetative and early fruit development stages.
Fruit Weight
7.5
8
8.5
9
9.5
10
10.5
1. Lesswater (175)Vegetative
2. Lesswater (175)Early Fruit
3. Lesswater (175)
Late fruit
4. Morewater (425)Vegetative
5. Morewater (425)Early fruit
6. Morewater (425)
Late fruit
7. Growerstandard(250 L/h)
Wei
ght (
kg)
Fig 68. Irrigation: fruit weight - Condoblin Brix responded better to lighter applications of water during the vegetative growth stage, which may have an influence on flavour.
Brix
11.5
12
12.5
13
13.5
14
14.5
1. Lesswater (175)Vegetative
2. Lesswater (175)Early Fruit
3. Lesswater (175)
Late fruit
4. Morewater (425)Vegetative
5. Morewater (425)Early fruit
6. Morewater (425)
Late fruit
7. Growerstandard(250 L/h)
Brix
%
Fig 69. Irrigation: Fruit Brix - Condoblin
105
Conclusions
• Generally, the higher applications of water (425 L/h) yielded more fruit. • Flesh firmness was softer when smaller applications of water were applied
during fruit development. • Less water during vegetative stage caused more hollowness. • Brix responded better to lighter applications of water during the vegetative
growth stage, which may have an influence on flavour.

106
Fig 70. Soil moisture levels – seedless watermelon crop showing irregular irrigations early and improved regular irrigations later in crop development.
Irregular irrigation interval 1-6 days and irregular intervals 7h – 12h. Plants going under stress
Onset of stress at 10cm
More regular irrigations (6hrs) every 3-4 days Less stress

107
Fig 71. Soil moisture data showing the effect of longer irrigations on soil moisture, later in crop development.
8 hour irrigations Every 1-2 days Drying out at 50cm
12 hour irrigations Every 2-3 days Filled profile at 50cm NO MORE WATER USED
Flowering

108
Condoblin – 2006 Irrigation Trials The aim of this trial was to test the effect of applying either more water or less water than the grower’s standard irrigation practice on yield and quality. Previous trials have indicated that keeping seedless watermelon plants free of water stress throughout the whole growth of the plant results in the healthiest plants and highest yields of good quality fruit. Methods 175L/hr/100m trickle tube was installed in all rows except control in addition to the standard 250L/ph/100m. To achieve higher irrigation rates, both 175 and 250L/hr tubes were turned on. Taps were turned off to run according to crop growth stages.
1. Extra water to mid fruit 2. Extra water to flowering 3. Extra water fruit development 4. Control 5. Standard water supplied in 250 L/100m/h tape extra
Results
Irrigation Trial - Condo 2006
0
10
20
30
40
50
60
70
extra
wat
erto
mid
frui
t
extra
wat
erto
flow
erin
g
extra
wat
erfru
itde
vlop
men
t
Con
trol
Yiel
d (to
nnes
/ha)
SeedlessTigers

109
Fig 72. Effect on yield of extra irrigation at key crop growth stages. Irrigation control
Fig 73. Soil moisture content (mm water/50cm soil depth): standard irrigation

110
Extra water – Fruit development
Fig 74 Soil moisture content (74 mm water/50cm soil depth): extra water during fruit development

111
Extra watering to flowering
Fig 75. Soil moisture content (mm water/50cm soil depth): extra water to flowering stages
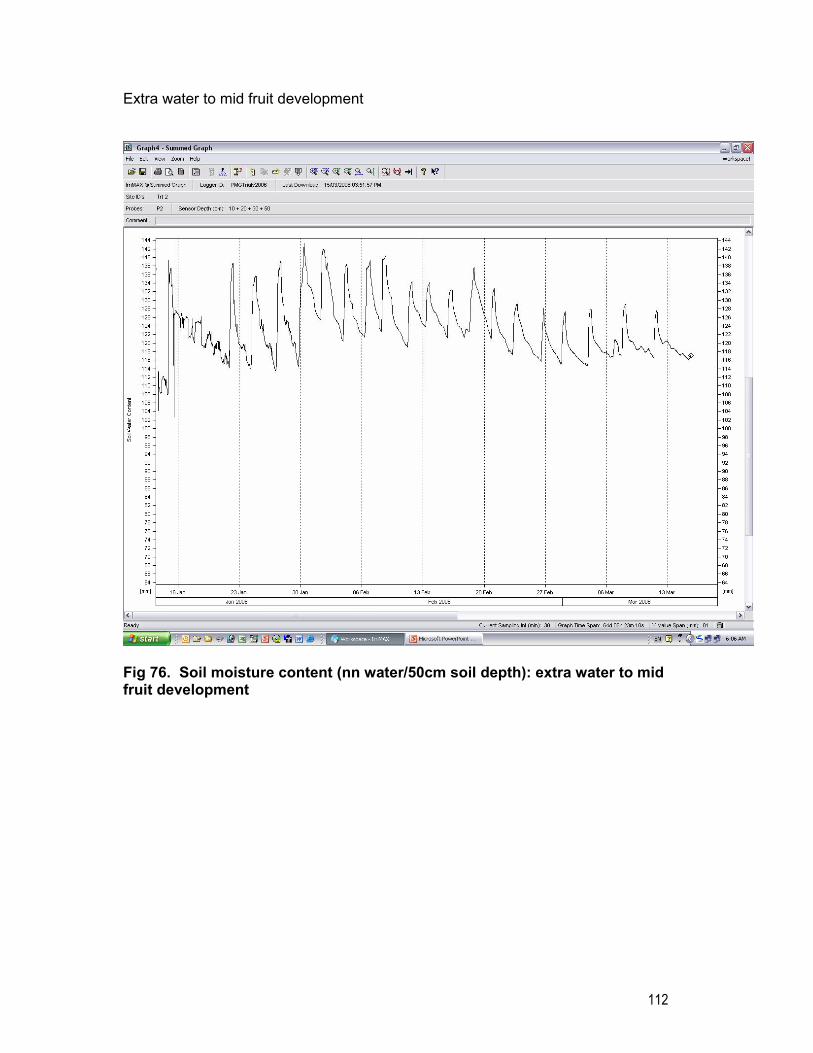
112
Extra water to mid fruit development
Fig 76. Soil moisture content (nn water/50cm soil depth): extra water to mid fruit development
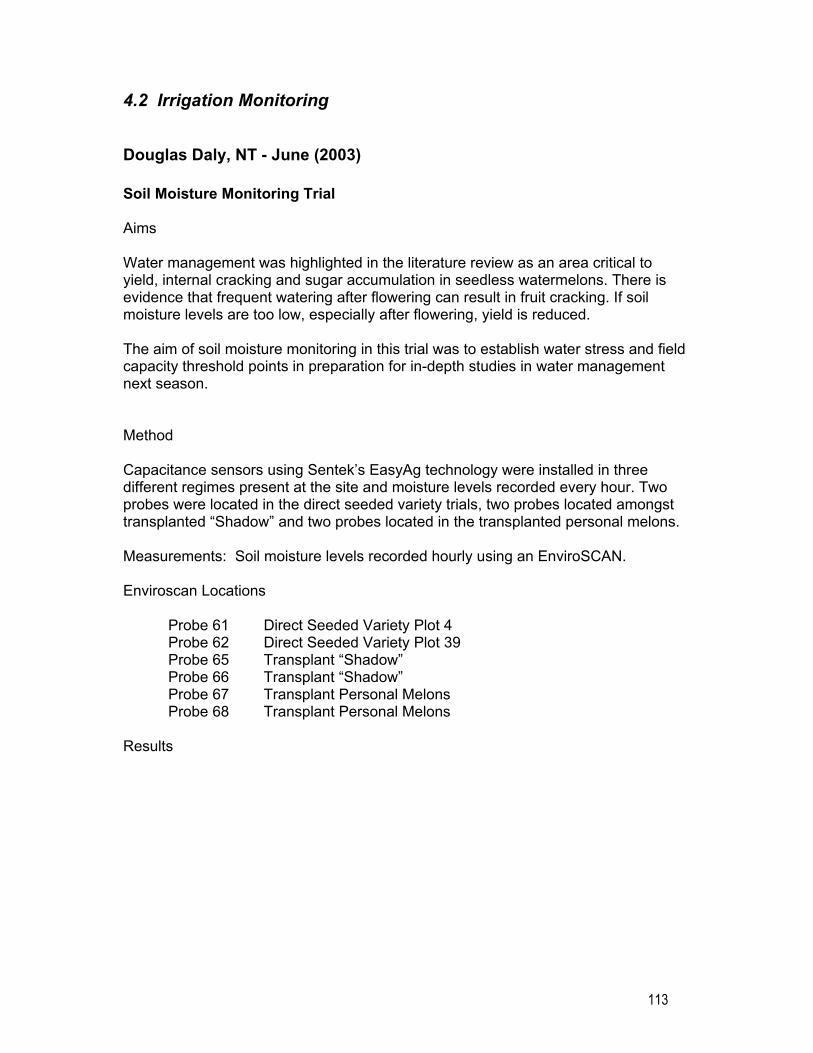
113
4.2 Irrigation Monitoring
Douglas Daly, NT - June (2003) Soil Moisture Monitoring Trial Aims Water management was highlighted in the literature review as an area critical to yield, internal cracking and sugar accumulation in seedless watermelons. There is evidence that frequent watering after flowering can result in fruit cracking. If soil moisture levels are too low, especially after flowering, yield is reduced. The aim of soil moisture monitoring in this trial was to establish water stress and field capacity threshold points in preparation for in-depth studies in water management next season. Method Capacitance sensors using Sentek’s EasyAg technology were installed in three different regimes present at the site and moisture levels recorded every hour. Two probes were located in the direct seeded variety trials, two probes located amongst transplanted “Shadow” and two probes located in the transplanted personal melons. Measurements: Soil moisture levels recorded hourly using an EnviroSCAN. Enviroscan Locations
Probe 61 Direct Seeded Variety Plot 4 Probe 62 Direct Seeded Variety Plot 39 Probe 65 Transplant “Shadow” Probe 66 Transplant “Shadow” Probe 67 Transplant Personal Melons Probe 68 Transplant Personal Melons
Results

114
Fig 77 Soil moisture data, direct seeded watermelons, replicate 1
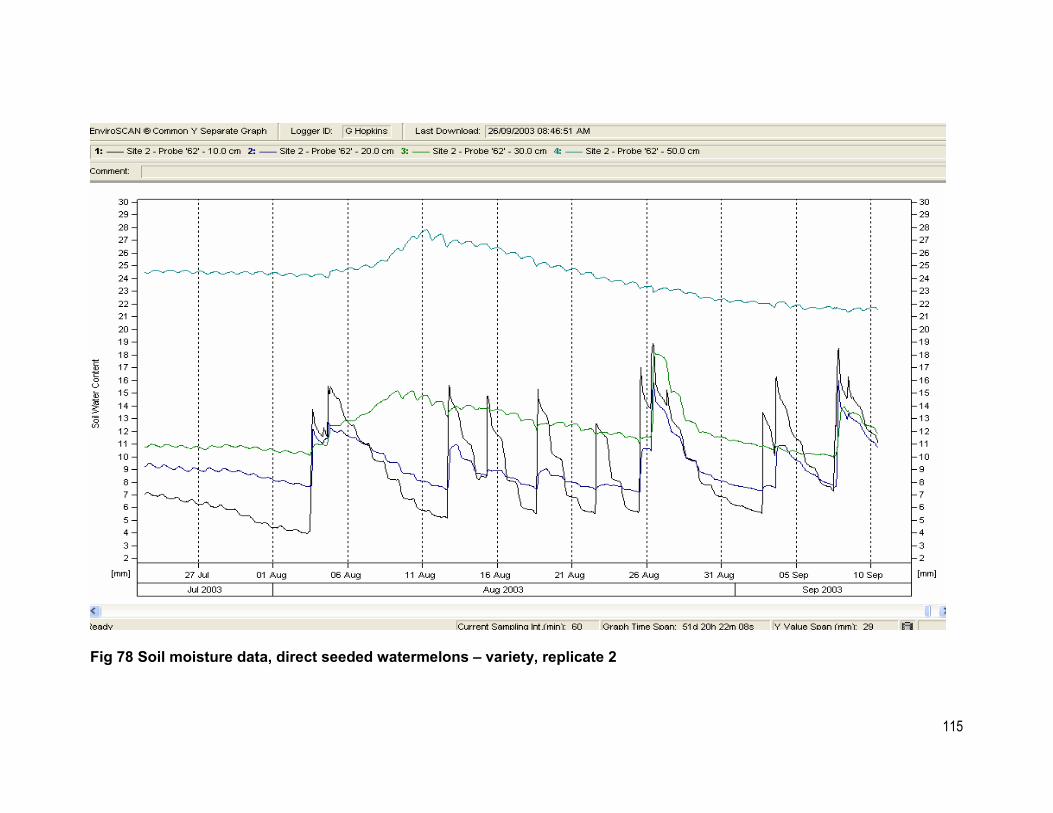
115
Fig 78 Soil moisture data, direct seeded watermelons – variety, replicate 2

116
Fig 79. Soil moisture data, transplanted watermelons, replicate 1
117
Fig 80. Soil moisture, transplanted watermelon, replicate 2

118
Fig 81. Soil moisture, transplanted personal melons, replicate 1

119
Fig 82. Soil moisture, transplanted personal melons, replicate 2
120
Conclusions Water management appears to be quite good although the 60 minute sampling interval may not necessarily record the “peak” of each irrigation event. Importantly, there was no period where the soil was saturated, as soil saturation causes the plant to shut down photosynthesis, reducing the production and transport of sugars and other flavour and colouring agents into the fruit. Crop water use did not vary significantly between direct seeded and transplanted crops; however personal melons did appear to be stressed in the few days prior to the fourth irrigation event. This may indicate a need for different irrigation strategies for both personal and “Shadow” to achieve maximum yield and quality.

121
Irrigation Discussion Irrigation trials were conducted in Chinchilla, Douglas Daly, Robinvale and Bowen in stage 1 of the project. These trials tested the idea of either imposing a water stress, or maintain plants free of water stress at various defined stages in crop development. These stages were: establishment to first flower; flowering and fruit set period; first half of fruit development; final stage of fruit development including the harvest period. Soil moisture data was collected using capacitance probes. The pattern which emerged was that it was not possible to demonstrate imposing a water stress resulted in either an increase in yield, fruit size or fruit quality compared with the stress free treatments at any stage of the crop cycle. The next question was: is it possible to over-irrigate at any stage and what was the effect if that? This question was answered using field trials at Condobilin, (NSW), Chinchilla (Qld) and Mataranka (NT). The answer was that it was possible to ‘over water’, and the results were:
• Increased root disease/sudden wilt • Increase in fruit turgidity so that it became very prone to splitting • Lower fruit yield, probably due to poor oxygen supply to the roots.
There was a key observation made when the distribution of plant roots under plastic was investigated by excavating soil in the plant row. It was discovered that plant roots were only growing into soil that was moist. If the whole soil profile was well wetted up at planting, then the root system exploited that whole soil volume. If the initial wet up was small, then subsequent irrigations tended to only move out to that extent, and root development followed accordingly. The other relevant factor is that when plant densities were increased above the standard 5000 plants per ha, that water had to be increased to adequately supply the additional plants. This was determined using soil moisture monitoring equipment and yield data. From all this work, the following recommendation was developed:
• At or before establishment, fully wet the soil profile in the plant row. • After planting, allow roots to grow out into the moist soil profile,
encouraging a large root system. During this time, only water when required to stop the plant going into water stress, and then irrigate to fully rewet the soil profile.
• Avoid frequent short irrigations. • After flowering, irrigate when soil approached the refill point and irrigate to
field capacity. • Continue this strategy until the end of harvest.

122
5. Pollination
5.1 Pollinator ratios
Douglas Daly, NT - June (2003) Aim To test the effectiveness of a pollinating plant specifically bred for the pollination of seedless watermelon varieties Methods An area consisting of 4 rows, eighty metres long was selected for this trial. Shadow type seedlings were transplanted into this area and “Taki” pollinator seed was planted at a ratio of 3:1 over half (forty metres) of the trial area. The other half of the trial area was planted to the conventional pollinator “Red Tiger” to provide a direct comparison of pollinator effectiveness. Spacing between plants was 0.85m. Measurements: Fruit weight, fruit dimensions, number of seedless melons, yield, Brix, presence of black seeds, flesh firmness, number of pollinator melons. Results: The use of the “Taki” pollinator significantly increased the yield of seedless watermelon relative to “Red Tiger” as a pollinator.

123
Taki Pollinator Trial - Yield
20
25
30
35
40
45
50
55
60
65
Red Tiger Taki
Pollinator
Yiel
d t/h
a
Fig 83. Yield of seedless watermelon pollinated with either “Red Tiger” or Taki seed pollinator The yield increase shown above was not due to an increase in fruit weight as there was no significant difference between treatments in fruit weight.
Taki Pollinator Trial - Seedless Fruit Weight
4.00
4.50
5.00
5.50
6.00
6.50
7.00
7.50
8.00
Red Tiger Taki
Pollinator
Frui
t Wei
ght (
kg)
Fig 84. Effect of pollinator on fruit weight

124
The yield increase observed is the result of significantly higher number of seedless melons produced in the “Taki” pollinator treatments. “Taki” pollinator treatments had an average of two additional fruit per 5m of row relative to “Red Tiger”.
Taki Pollinator Trial - Number of Seedless Fruit
4.00
5.00
6.00
7.00
8.00
9.00
10.00
11.00
12.00
13.00
Red Tiger Taki
Pollinator
Num
ber o
f Fru
it pe
r 5m
Fig 85. Effect of pollinator on fruit number of seedless watermelons Fruit Brix was statistically similar between the two treatments, however there may be a slight decrease in Brix where “Taki” pollinator is used. This decline may be attributed to the increased crop load of “Shadow” melons in the “Taki” treatments.
Taki Pollinator Trial - Brix%
10.00
10.50
11.00
11.50
12.00
12.50
13.00
Red Tiger Taki
Pollinator
Brix
%
Fig 86. Effect of pollinator on fruit Brix
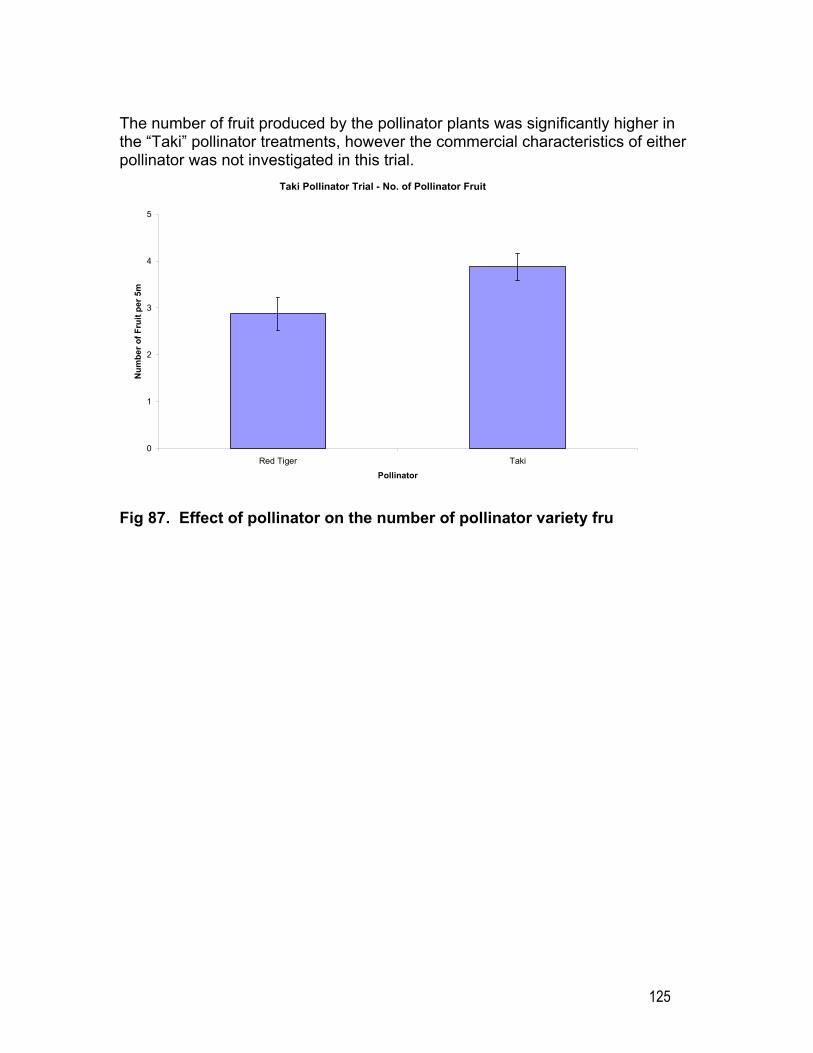
125
The number of fruit produced by the pollinator plants was significantly higher in the “Taki” pollinator treatments, however the commercial characteristics of either pollinator was not investigated in this trial.
Taki Pollinator Trial - No. of Pollinator Fruit
0
1
2
3
4
5
Red Tiger Taki
Pollinator
Num
ber o
f Fru
it pe
r 5m
Fig 87. Effect of pollinator on the number of pollinator variety fru

126
Conclusion The use of “Taki” pollinators produced a significantly higher number of “Shadow” melons and hence produced a greater commercial yield of seedless melons. There may be a decrease in Brix of fruit pollinated by “Taki” due to the increased crop yield, however this was not statistically significant in this trial. Any decrease in Brix could also be overcome by changes in agronomy to suit an increased crop load.

127
Robinvale, Victoria – Summer 2003-2004 Pollinator density trial It may be possible for pollinators and seedless melons to be planted at the same time. Grow the pollinators up to male flowering stage, then after pollination, kill the pollinators using either herbicide or cultivation before there is any significant competition effect on the seedless melons. Such an approach would eliminate the yield loss caused by growing pollinators. Aim To test a range of planting densities to establish the optimum density and arrangement to optimise yields. Method Five planting configurations would be assessed:
1. Double Density, pollinators in center at 1m spacing 2. Pollinators every third row at 1m spacing 3. Pollinators on edge of each bed at 2m spacing 4. Pollinators on edge of every second bed at 1m spacing 5. Conventional Production (Direct Seeded Poll. at 2:1)
Measurements: Yield, fruit size and number, Flesh quality (Brix, colour, cracking).

128
Results: Fruit Weight Fruit weight was significantly greater using conventional spacing.
Density Trial - Fruit Weight
0
1
2
3
4
5
6
7
8
9
1 Double Density, pollinatorsin centre at 1m spacing
2 Pollinators every third row at1m spacing
3 Pollinators on edge of eachbed at 2m spacing
4 Pollinators on edge of everysecond bed at 1m spacing
5 Conventional Production(Direct Seeded Poll. at 2:1)
(use nutrition control)
Density Treatment
Wei
ght (
kg)
Fig 88. Effect of density and pollinator ratio on fruit weight Results: Fruit Yield Fruit yield showed no significant difference between treatments.
Density Trial - Fruit
8
13
18
23
28
33
38
43
1 Double Density, pollinators in centre at 1m spacing
2 Pollinators every third row at1m spacing
3 Pollinators on edge of eachbed at 2m spacing
4 Pollinators on edge of everysecond bed at 1m spacing
5 Conventional Production (Direct Seeded Poll. at 2:1)
(use nutrition control) Density Treatment
Yiel
d (t
/ha)
Fig 89. Effect of density and pollinator ratio on yield

129
Results: Fruit Brix Treatment 1 showed a significant decrease in fruit Brix.
Density Trial - Fruit Brix
8
8.5
9
9.5
10
10.5
11
11.5
12
12.5
13
1 Double Density, pollinatorsin centre at 1m spacing
2 Pollinators every third rowat 1m spacing
3 Pollinators on edge of eachbed at 2m spacing
4 Pollinators on edge of everysecond bed at 1m spacing
5 Conventional Production(Direct Seeded Poll. at 2:1)
(use nutrition control)
Density Treatment
Brix
%
Fig 90. Effect of density and pollinator ratio on fruit Brix Results: Fruit Cracking Fruit cracking was significantly lower using conventional spacing.
Density Trial - Fruit Cracking
0
0.5
1
1.5
2
2.5
3
1 Double Density, pollinatorsin centre at 1m spacing
2 Pollinators every third row at1m spacing
3 Pollinators on edge of eachbed at 2m spacing
4 Pollinators on edge of everysecond bed at 1m spacing
5 Conventional Production(Direct Seeded Poll. at 2:1)
(use nutrition control)
Density Treatment
Cra
ckin
g R
atin
g (1
-5)
Fig 91. Effect of density and pollinator ratio on fruit cracking

130
Conclusion It can be seen that while the yield of all treatments is similar the quality of fruit produced by conventional spacing is significantly greater. Conventional spacing produced fruit of larger size, greater sugar content and less cracking. It is recommended that conventional spacing be used on this farm.

131
5.2 Direct seeded and transplanted pollinators
Chinchilla - November/December 2003 Direct seeded and transplanted pollinator comparison Aim Pollinators and seedless melons do not develop at the same rate. This creates the problem that both types are not fully flowering at the same time. One way around this problem could be to direct seed the pollinator and transplant the seedless melons. Method Seedless melons were transplanted as normal, and pollinators were direct seeded or Transplanted as per trial outline. 100m Pollinators Transplanted
Pollinators Direct Seeded
Area used = 100m x 4 rows. Measurements: Yield, fruit size and number, flesh quality (Brix, Colour, Cracking)

132
Results: Fruit Weight Fruit weight was significantly increased by transplanting the pollinators.
Fig 92. Direct seeded v’s transplant – fruit weight Results: Fruit Brix Fruit Brix was significantly increased by transplanting the pollinators.
Fig 93. Direct seeded v’s transplant – fruit Brix
Direct Seed Vs Transplant - Fruit Weight
7000
7500
8000
8500
9000
9500
Direct Seeded Transplanted
Wei
ght (
g)
Direct Seed Vs Transplant - Fruit Brix
10
10.5
11
11.5
12
12.5
13
Direct Seeded Transplanted
% B
rix

133
Results: Fruit Yield Fruit Yield was not significantly affected by either pollinator planting method.
Fig 94. Direct seeded v’s transplant – seedless fruit yield Results: Pollinator Fruit Yield Pollinator fruit yield was significantly increased by transplanting.
Fig 95. Direct seeded v’s transplant – pollinator variety - fruit yield
Direct Seed Vs Transplant - Fruit Yield
0
10
20
30
40
50
60
Direct Seeded Transplanted
Yiel
d (t/
ha)
Direct Seed Vs Transplant - Pollinator Fruit Yield
0
2
4
6
8
10
12
14
Direct Seeded Transplanted
Yiel
d (t/
ha)

134
Conclusion In this trial when pollinators were transplanted the resulting seedless fruit produced was of better quality in terms of fruit size and sugar content however there was no difference in yield of seedless watermelons when pollinators were direct seeded or transplanted. The yield produced by the pollinators was greater when they were transplanted. These results clearly show that to produce larger, sweeter fruit the best method of planting pollinator vines is via transplants.

135
5.3 Summary of key density and pollinator trials
Introduction A range of pollinator ratios from 1:1 up to 4:1 were tested over the sites used in the project. These sites covered the range of growing conditions under which seedless watermelons are grown in Australia. In addition, a range of plant densities were evaluated ranging from a low density of 2500 plants/ha to a high density of 12,000 plants/ha. There were also a number of trials comparing the establishment of pollinating varieties by either direct-seeding or transplanting and delaying seeding up to 7 days after transplanting. The objective of this section of the report is to attempt to explain how planting density, pollinator ratio and level of crop inputs interact and then explain how these factors can be managed to optimise fruit yield and quality.
Trial 1. Density and Pollinator ratios - Bowen (Autumn) Two seedless:pollinator ratios (2:1 and 3:1) were compared at five different planting densities. This was done in a replicated (n=4) small plot (10m) experiment using single plant rows per plot. Fruit was harvested by hand and the normal yield and fruit quality data collected.

136
Fig 96. Effect of pollinator ratio and planting density on fruit yield – Bowen This experiment shows that when the pollinator ratio is high (2:1), then the total yield is not affected by planting density. The plants compensate for population differences by setting more fruit per plant. This means however that the harvest period is longer at lower planting densities, which can increase harvesting costs. At a lower pollinator ratio (3:1), yield is responsive to plant population up to a plant population of 6000 plants/ha. Higher populations do not result in further yield increases. This experiment demonstrates the critical importance of pollination in determining yield and that there is an interaction between density and pollinator ratio. The optimum combination in this experiment was 6000 plants/ha at 3:1 ratio, but this is likely to be affected by climate and crop inputs and may need to be determined on a regional basis.
0.0
10.0
20.0
30.0
40.0
50.0
60.0
70.0
3000plants/ha
(2:1)
4500plants/ha
(2:1)
6000plants/ha
(2:1)
7500plants/ha
(2:1)*
9000plants/ha
(2:1)*
3000plants/ha
(3:1)
4500plants/ha
(3:1)
6000plants/ha
(3:1)
7500plants/ha
(3:1)*
9000plants/ha
(3:1)*
Yiel
d (t
/ha)
3:1 pollinator ratio, yield responds to density up to 6000 plants/ha
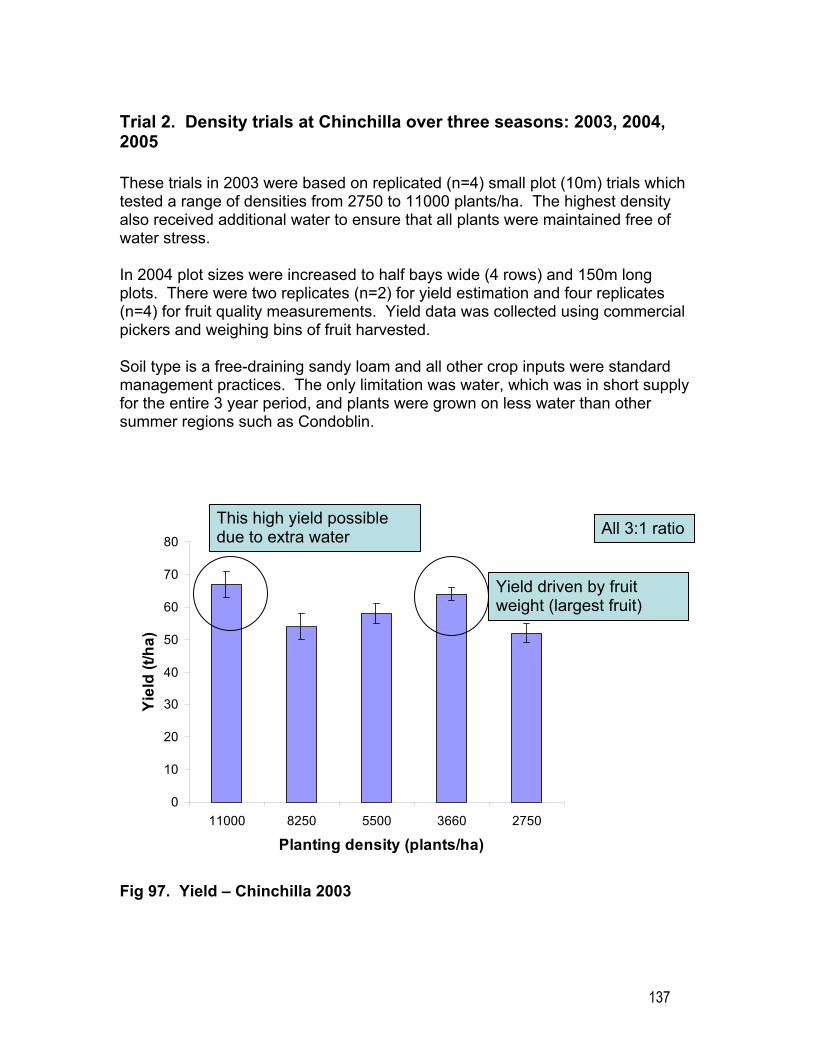
137
Trial 2. Density trials at Chinchilla over three seasons: 2003, 2004, 2005 These trials in 2003 were based on replicated (n=4) small plot (10m) trials which tested a range of densities from 2750 to 11000 plants/ha. The highest density also received additional water to ensure that all plants were maintained free of water stress. In 2004 plot sizes were increased to half bays wide (4 rows) and 150m long plots. There were two replicates (n=2) for yield estimation and four replicates (n=4) for fruit quality measurements. Yield data was collected using commercial pickers and weighing bins of fruit harvested. Soil type is a free-draining sandy loam and all other crop inputs were standard management practices. The only limitation was water, which was in short supply for the entire 3 year period, and plants were grown on less water than other summer regions such as Condoblin.
Fig 97. Yield – Chinchilla 2003
0
10
20
30
40
50
60
70
80
11000 8250 5500 3660 2750
Planting density (plants/ha)
Yie
ld (t
/ha)
All 3:1 ratio
Yield driven by fruit weight (largest fruit)
This high yield possible due to extra water
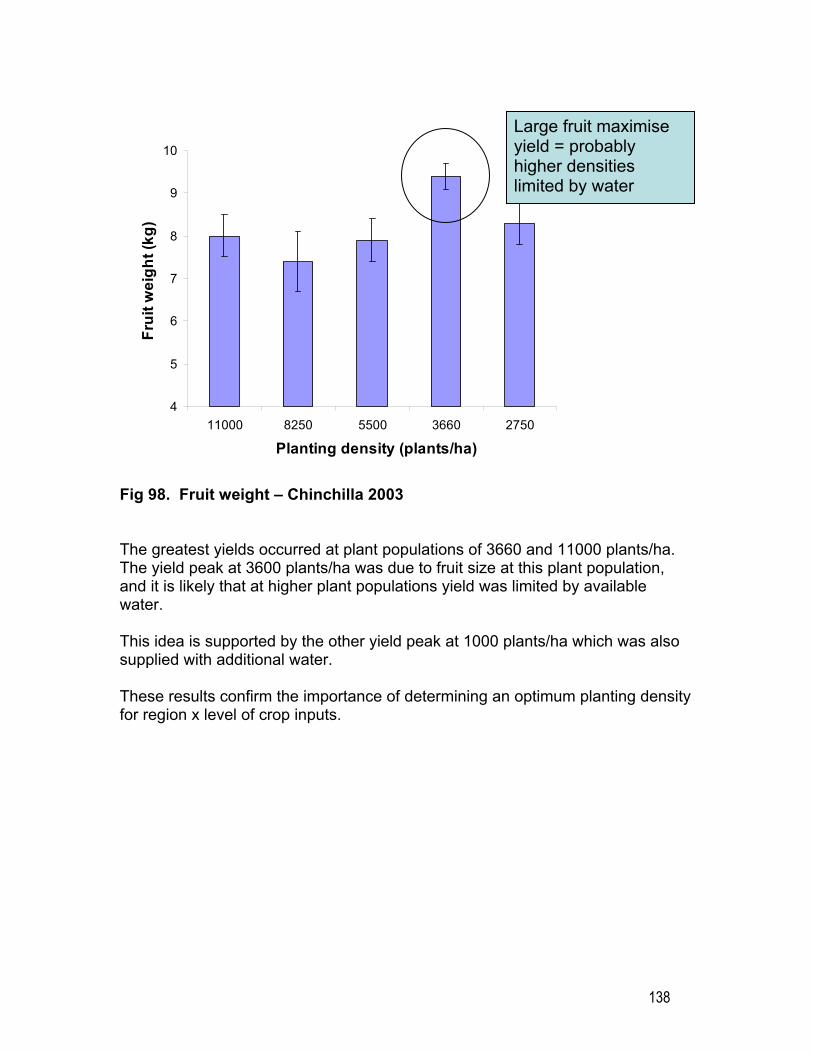
138
Fig 98. Fruit weight – Chinchilla 2003 The greatest yields occurred at plant populations of 3660 and 11000 plants/ha. The yield peak at 3600 plants/ha was due to fruit size at this plant population, and it is likely that at higher plant populations yield was limited by available water. This idea is supported by the other yield peak at 1000 plants/ha which was also supplied with additional water. These results confirm the importance of determining an optimum planting density for region x level of crop inputs.
4
5
6
7
8
9
10
11000 8250 5500 3660 2750
Planting density (plants/ha)
Fru
it w
eigh
t (kg
)Large fruit maximise yield = probably higher densities limited by water

139
Trial 3. Chinchilla – 2004
Fig 99. Yield – Chinchilla 2004
0
10
20
30
40
50
60
70
11000 at 3:1 5500 at 3:1 inrow
5500 at 2:1 5500 at 3:1
Planting density (ha)
Yiel
d (t
/ha)
2:1 gives more yield than 3:1 Must be pollination limiting yield
Group pollinators in rows better if polln limiting yield
High density only works if water not limiting

140
Fig 100. Fruit weight – Chinchilla 2004 In 2004, two planting densities were evaluated, 5500 and 11000 plants/ha. At the lower planting density, two pollinator ratios were tested, 3:1 and 2:1. At the 3:1 ratio, pollinators were either scattered evenly throughout the plot or grouped into full rows of pollinators (called 3:1 in row)’ At a plant population of 5500 plants/ha, either increasing the pollinator ratio from 3:1 to 2:1 or arranging the pollinators in a single row increased yields by 10-15%. This means that pollination was limiting yields in these crops. This is confirmed by looking at fruit size (Fig 100.). Fruit size is smaller yet yields are higher at 2:1 ratio and 3:1 in the row meaning that these pollination treatments significantly increased fruit number. Increasing the plant population to 11000 plants/ha and supplying additional water increased yields over the control (5500 @ 3:1) by 43%. Increasing plant population is really providing both more fruiting sites and more male flowers. It was shown in 2003 that higher densities needed more water for yield to increase (Fig 97) and this result was confirmed in 2004 (Fig 99).
4.0
5.0
6.0
7.0
8.0
9.0
10.0
11000 at 3:1 5500 at 3:1 inrow
5500 at 2:1 5500 at 3:1
Planting density (ha)
Frui
t wei
ght (
kg)
Higher yield but smaller fruit. Means that fruit set higher. Confirms polln limiting yield.
Larger fruit here because water limitation removed – now density limits yield not pollination

141
Trial 4. Chinchilla – 2005 In 2005, the interactions between planting density and irrigation input were repeated. This time, a low plant population (3142 plants/ha) was supplied with a normal amount of water for Chinchilla. This was compared to additional water at this plant population and to increasing both plant population and irrigation water. An additional treatment of direct-seeding the pollinators was also included to determine the effect of this practice compared to the standard practice of transplanting pollinators. Table 23. Treatments Treatments Description 3142 TP Poll 3142 plants/ha, pollinators transplanted 3142 DS Poll 3142 plants/ha, pollinators direct seeded 3142 + Irrig 3142 plants/ha, pollinators direct seeded +
extra irrigation 6284 + Irrig 6284 plants/ha, pollinators direct seeded +
extra irrigation
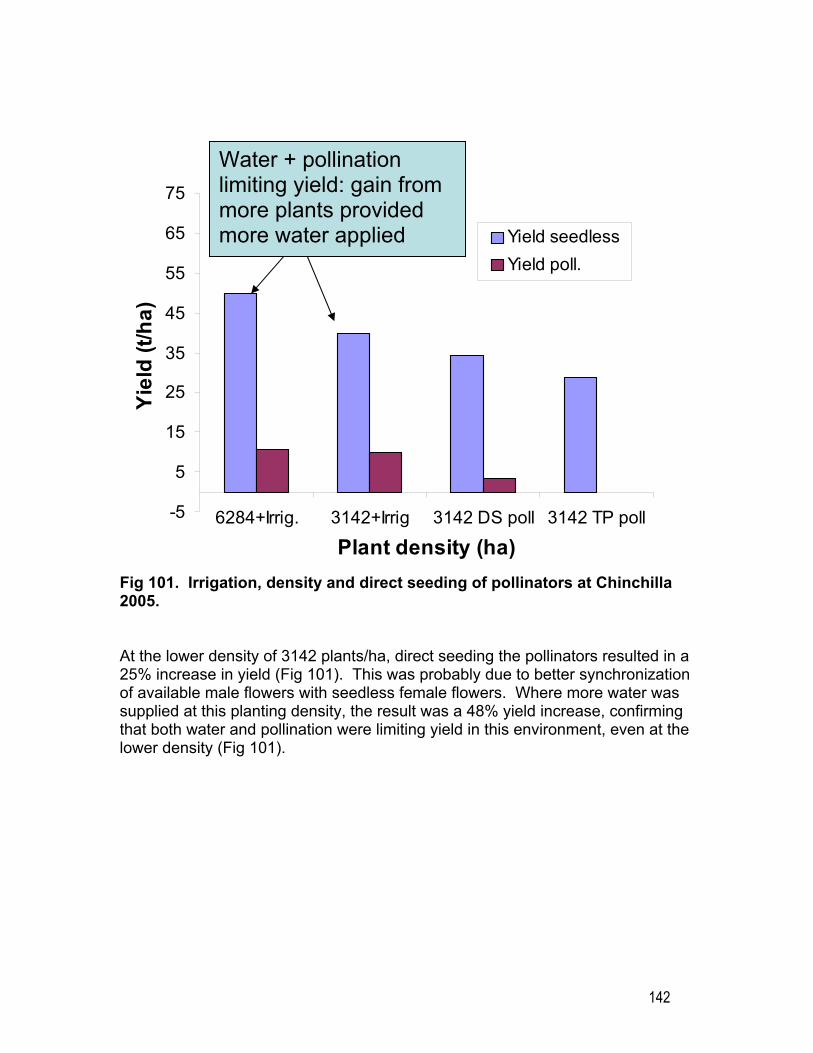
142
Fig 101. Irrigation, density and direct seeding of pollinators at Chinchilla 2005. At the lower density of 3142 plants/ha, direct seeding the pollinators resulted in a 25% increase in yield (Fig 101). This was probably due to better synchronization of available male flowers with seedless female flowers. Where more water was supplied at this planting density, the result was a 48% yield increase, confirming that both water and pollination were limiting yield in this environment, even at the lower density (Fig 101).
-5
5
15
25
35
45
55
65
75
6284+Irrig. 3142+Irrig 3142 DS poll 3142 TP poll
Plant density (ha)
Yiel
d (t/
ha)
Yield seedlessYield poll.
Water + pollination limiting yield: gain from more plants provided more water applied

143
Trial 5. Mataranka 2005 In 2005, the standard 3:1 pollinator ratio was compared to a 2:1 ratio. Then direct seeding was compared to transplanting the pollinator for three pollinating varieties: Red Tiger, 051 and Companion (Seminis).
0
5
10
15
20
25
30
35
40
45
50
DS Pollinator (3:1) T/P Pollinator (3:1) T/P Pollinator (2:1)
Yiel
d (t/
ha)
Fig 102. Pollinator ratios and establishment method – Red Tiger – Mataranka 2005
0
10
20
30
40
50
60
Red TigerT/P
Red TigerDS
051 T/P 051 DS CompanionT/P
CompanionDS
Yiel
d (t/
ha)
Fig 103. Direct seeding or transplanting three pollinating varieties – Mataranka 2005

144
This data showed that in Mataranka, transplanting the pollinator produced 30% more yield that direct-seeding the pollinator at the same time as the seedless plants were planted (Fig 102). Then by increasing the pollinator ratio from 3:1 to 2:1 and transplanting, the yield could be increased by 68% to 45.5 tonnes/ha. The yield increase due to transplanting the pollinator was not consistent with the result at Chinchilla and was probably due to it’s effect on changing the timing of male flowers being available for pollinating seedless female flowers. This confirms the need to check which practice is appropriate for each location. The timing effect of transplanting was also found in other pollinating varieties tested at Mataranka (Fig 102).
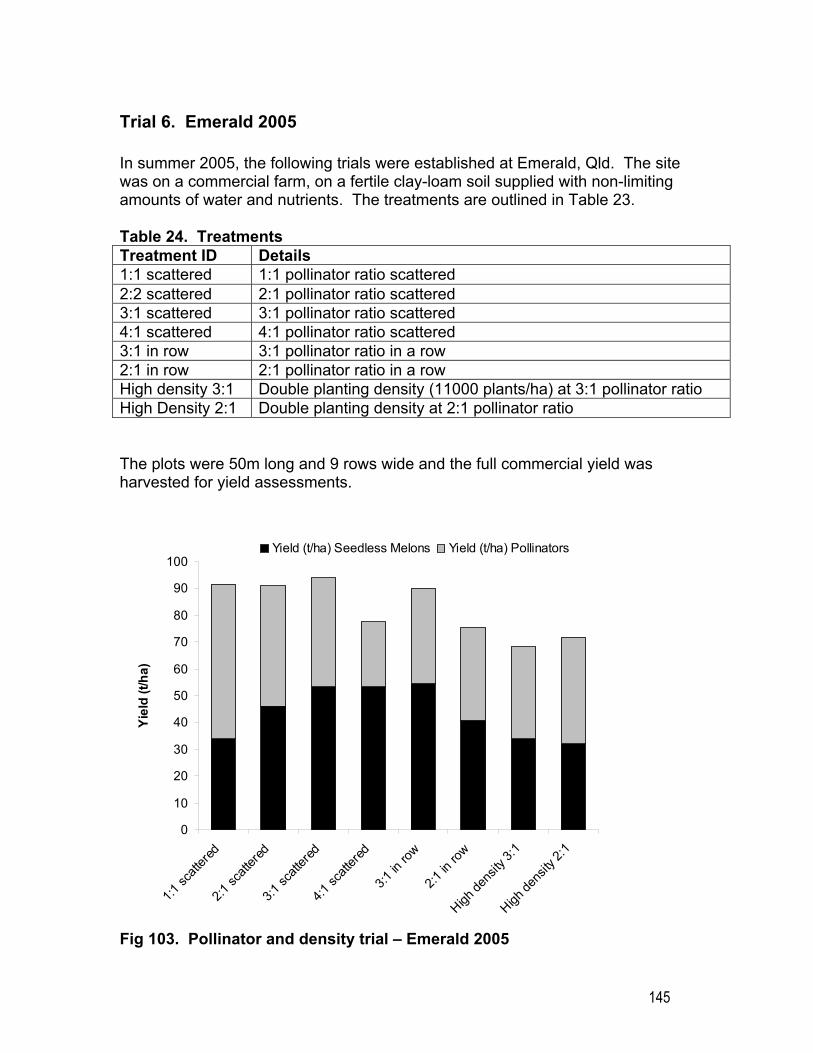
145
Trial 6. Emerald 2005 In summer 2005, the following trials were established at Emerald, Qld. The site was on a commercial farm, on a fertile clay-loam soil supplied with non-limiting amounts of water and nutrients. The treatments are outlined in Table 23. Table 24. Treatments Treatment ID Details 1:1 scattered 1:1 pollinator ratio scattered 2:2 scattered 2:1 pollinator ratio scattered 3:1 scattered 3:1 pollinator ratio scattered 4:1 scattered 4:1 pollinator ratio scattered 3:1 in row 3:1 pollinator ratio in a row 2:1 in row 2:1 pollinator ratio in a row High density 3:1 Double planting density (11000 plants/ha) at 3:1 pollinator ratio High Density 2:1 Double planting density at 2:1 pollinator ratio The plots were 50m long and 9 rows wide and the full commercial yield was harvested for yield assessments.
0
10
20
30
40
50
60
70
80
90
100
1:1 sc
attere
d
2:1 sc
attere
d
3:1 sc
attere
d
4:1 sc
attere
d
3:1 in
row
2:1 in
row
High de
nsity
3:1
High de
nsity
2:1
Yiel
d (t/
ha)
Yield (t/ha) Seedless Melons Yield (t/ha) Pollinators
Fig 103. Pollinator and density trial – Emerald 2005
146
The maximum yield of seedless watermelon fruit was achieved at pollinator ratios of 3:1 or 4:1 and it made no difference if the pollinators were arranged in rows, or scattered. Increasing pollinator ratios to 2:1 or 1:1 reduced the yield of seedless fruit (Fig 103). A fascinating result was that for most pollinator ratio treatments the total fruit yield was about 90 tonnes/ha and varying the ratio affected whether the fruit was seedless or pollinator (seeded) fruit. Increasing the number of pollinators beyond a 3:1 ratio, reduced the yield of seedless fruit and increased the yield of pollinator fruit. In this situation, doubling the planting density from 5500 to 1100 plants/ha reduced yield, and this was probably because these plantings were not supplied with additional water or fertilizer (Fig 103). At this site, it was the number of fruiting sites for seedless fruit that was limiting yield, not pollination. Another relevant point may be that watermelons tend to produce more male flowers under high temperature and this was a summer crop in central Queensland. This may have increased the number of male flowers available to bees and explain why pollination was not limiting.
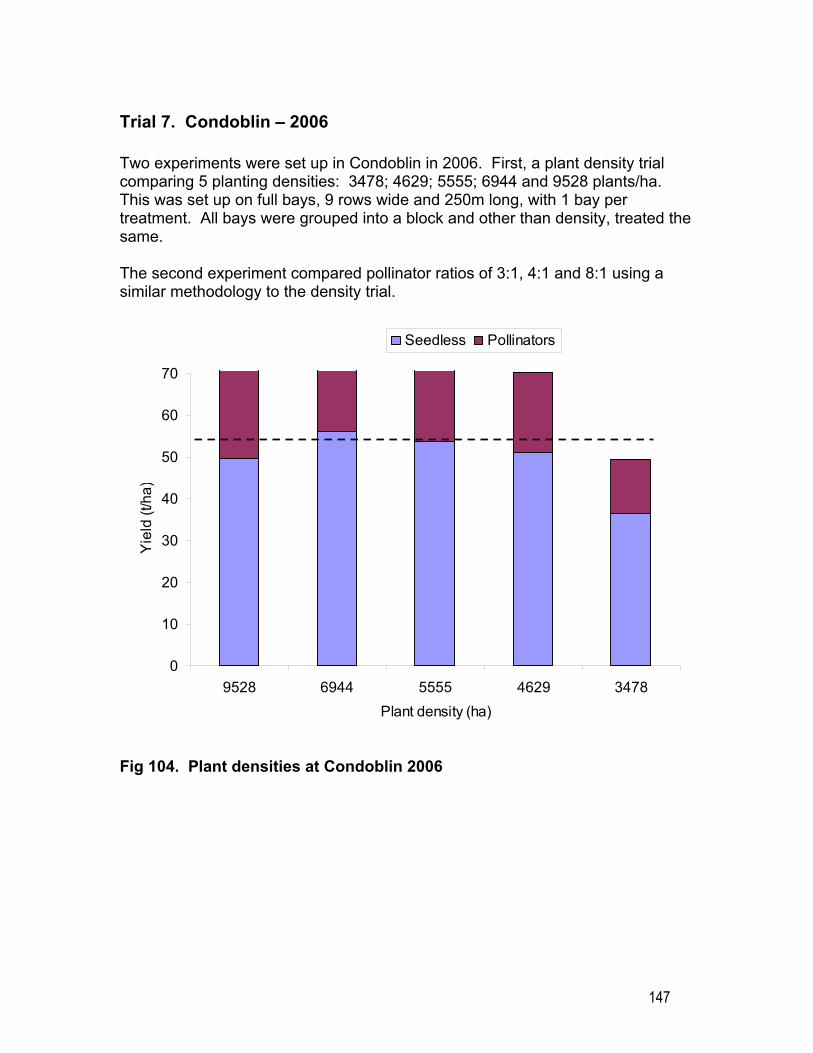
147
Trial 7. Condoblin – 2006 Two experiments were set up in Condoblin in 2006. First, a plant density trial comparing 5 planting densities: 3478; 4629; 5555; 6944 and 9528 plants/ha. This was set up on full bays, 9 rows wide and 250m long, with 1 bay per treatment. All bays were grouped into a block and other than density, treated the same. The second experiment compared pollinator ratios of 3:1, 4:1 and 8:1 using a similar methodology to the density trial.
0
10
20
30
40
50
60
70
9528 6944 5555 4629 3478Plant density (ha)
Yie
ld (t
/ha)
Seedless Pollinators
Fig 104. Plant densities at Condoblin 2006

148
0
20
40
60
80
100
120
"3:1" "8:1" "4:1"Pollinator ratio
Yie
ld (t
/ha)
Seedless Pollinators
Fig 105. Pollinator densities at Condoblin 2006 The density trial showed that the highest yields of seedless fruit were obtained at a planting of 6944 plants/ha which corresponds to a plant spacing of 0.8m on a 1.8m row spacing (Fig 104). There was not a great difference in the yields between densities ranging from 4629 to 9528, it wasn’t until the plant density was lowered to 3478 that large yield differences occur. The optimum pollinator ratio was 4:1 for the Condoblin site (Fig 105). Even dropping the pollinator ratio as low as 8:1 did not reduce seedless yields compared to the standard 3:1 ratio. This adds further weight to the idea that pollination was not limiting at Condoblin most likely for similar reasons to the Emerald site.

149
Discussion – Plant density and Pollination This work resulted in the identification of two types of sites:
3. Yield limited by pollination 4. Yield limited by fruiting sites per ha.
Yield limited by pollination: There were 4 sites where yield was consistently limited by pollination. These were Chinchilla (Qld), Mataranka (NT), NT and Bowen, Qld. Treatments which improved pollination resulted in increases in yield:
• Changing pollinator:seedless plant ratio from 3:1 to 2:1 • Arranging pollinators in their own row rather than scattering the pollinators
through the planting • Using a pollinating variety that produces more flowers than the standard
Red Tiger (e.g. Blooming Brilliant [Jarit seeds]; Taki seed pollinator) • Fine-tuning the timing of pollinators with seedless watermelon plants.
The strategy growers should follow in these areas/time slots is to do things which will improve the effectiveness of pollination. Strategies which are likely to increases yields in these areas include:
• Increasing bee populations • Using bee attractants • Increasing pollinator ratio and grouping pollinators in rows
The question of why pollination is limiting yield in these areas may need further investigation, but it is probably related to one or more of the following factors:
1. watermelon flowers tend to maleness in cooler temperatures (note the NT and Bowen sites were all winter production)
2. water stress may limit the effectiveness of pollination (don’t stress around flowering)
3. other inputs such as available nutrient and water may limit vine growth and the number of flowers available in both seedless and pollinator plants.
Yield limited by fruiting sites per ha: The other key finding was that the yield from certain sites did not respond to increasing pollination but rather to increasing the number of seedless watermelon plants: this was interpreted as responding to more fruiting sites. The two sites that responded this was were Emerald (Qld) and Condobilin (NSW).

150
The key factors these sites had in common were: • high level of fertilizer inputs, including supplemental calcium • plants grown with adequate water: i.e. not stressed at any time or
overwatered • summer production an high temperatures (promotes male flowers) • adequate population of bees which were actively foraging in the crop.
Treatments which increased the number of seedless watermelon plants and reduced competition from pollinator plants increased yield: These treatments were:
• reducing the number of pollinators from 3:1 to 4:1 • increasing plant density provided the level of inputs (water and nutrient)
was increased to match • direct seeding the pollinators rather than establishing them via transplants. •
Interestingly, in these areas, not planting 1 or 2 rows per 9 row bay did not significantly reduce yield, but clearly saved on input costs. Direct Seeding Pollinators: In all the summer trials, where establishing pollinators by direct seeding was tested, it increased yield significantly compared to establishing seedlings by transplanting. In Condobilin, it was found that direct seedling at transplanting or 4 days after transplanting the seedless plants gave the highest yield. In Mataranka, the grower practice is to direct seed 4-7 days before transplanting their seedless watermelon plants, but the optimal timing may change during the year. The timing of direct seeding is critical, and can have a significant effect on the relative yields of seedless watermelon fruit and seeded fruit from pollinators.

151
Discussion and Recommendations The project has conducted a detailed research program across a range of growing environments over four years. The early work in the project was focused on small-plot replicated experiments, mainly on the properties of collaborating growers in the SMA Select Melon group. This work focused on nutrition, irrigation management, variety screening trials, growth regulator trials including GA and CPPU, plant density and pollinator ratio work. After an initial round of trials across growing regions North Queensland and Northern Territory (Winter), Robinvale (Spring), Chinchilla and Condobilin (Summer), a clearer picture of where the main gains were likely to be achieved started to emerge. Two main guiding principles emerged. These were:
• The main focus of the project should focus on maximizing yield while maintaining adequate quality (i.e. within the One Harvest specification for seedless watermelon)
• The most promising strategies for achieving this objective were:
o Water Management: Formulating a water management strategy and testing this against the current best practice
o Plant Density and Pollination: Gaining a clear understanding of
how use plant density and pollinator ratio to maximize yield in the main growing regions.
o Varieties: Determining the best variety(ies) for each of the major
growing regions in Australia
Water Management Irrigation trials were conducted in Chinchilla, Douglas Daly, Robinvale and Bowen in stage 1 of the project. These trials tested the idea of either imposing a water stress, or maintain plants free of water stress at various defined stages in crop development. These stages were: establishment to first flower; flowering and fruit set period; first half of fruit development; final stage of fruit development including the harvest period. Soil moisture data was collected using capacitance probes. The pattern which emerged was that it was not possible to demonstrate imposing a water stress resulted in either an increase in yield, fruit size or fruit quality compared with the stress free treatments at any stage of the crop cycle.

152
The next question was: is it possible to over-irrigate at any stage and what was the effect if that? This question was answered using field trials at Condobilin, (NSW), Chinchilla (Qld) and Mataranka (NT). The answer was that it was possible to ‘over water’, and the results were:
• Increased root disease/sudden wilt • Increase in fruit turgidity so that it became very prone to splitting • Lower fruit yield, probably due to poor oxygen supply to the roots.
There was a key observation made when the distribution of plant roots under plastic was investigated by excavating soil in the plant row. It was discovered that plant roots were only growing into soil that was moist. If the whole soil profile was well wetted up at planting, then the root system exploited that whole soil volume. If the initial wet up was small, then subsequent irrigations tended to only move out to that extent, and root development followed accordingly. The other relevant factor is that when plant densities were increased above the standard 5000 plants per ha, that water had to be increased to adequately supply the additional plants. This was determined using soil moisture monitoring equipment and yield data. From all this work, the following recommendation was developed:
• At or before establishment, fully wet the soil profile in the plant row. • After planting, allow roots to grow out into the moist soil profile,
encouraging a large root system. During this time, only water when required to stop the plant going into water stress, and then irrigate to fully rewet the soil profile.
• Avoid frequent short irrigations. • After flowering, irrigate when soil approached the refill point and irrigate to
field capacity. • Continue this strategy until the end of harvest.
Plant Density and Pollination A range of pollinator ratios from 1:1 up to 4:1 were tested over the sites used in the project. These sites covered the range of growing conditions under which seedless watermelons are grown in Australia. In addition, a range of plant densities were evaluated ranging from a low density of 2500 plants/ha to a high density of 12,000 plants/ha. There were also a number of trials comparing the establishment of pollinating varieties by either direct-seeding or transplanting and then on direct-seeded

153
pollinators, investigating delaying seeding up to 7 days after transplanting seedless watermelon plants. This work resulted in the identification of two types of sites:
5. Yield limited by pollination 6. Yield limited by fruiting sites per ha.
Yield limited by pollination: There were 4 sites where yield was consistently limited by pollination. These were Chinchilla (Qld), Mataranka (NT), Douglas Daly, NT and Bowen, Qld. Treatments which improved pollination resulted in increases in yield:
• Changing seedless:pollinator plant ratio from 3:1 to 2:1 • Arranging pollinators in their own row rather than scattering the pollinators
through the planting • Using a pollinating variety that produces more flowers than the standard
Red Tiger (e.g. Blooming Brilliant [Jarit seeds]; Taki seed pollinator) • Fine-tuning the timing of pollinators with seedless watermelon plants.
The strategy growers should follow in these areas/time slots is to do things which will improve the effectiveness of pollination. Strategies which are likely to increases yields in these areas include:
• Increasing bee populations • Using bee attractants • Increasing pollinator ratio and grouping pollinators in rows
The question of why pollination is limiting yield in these areas may need further investigation, but it is probably related to one or more of the following factors:
1. watermelon flowers tend to femaleness in cooler temperatures (note the NT and Bowen sites were all winter production)
2. water stress may limit the effectiveness of pollination (don’t stress around flowering)
3. other inputs such as available nutrient and water may limit vine growth and the number of flowers available in both seedless and pollinator plants.
Yield limited by fruiting sites per ha: The other key finding was that the yield from certain sites did not respond to increasing pollination but rather to increasing the number of seedless watermelon plants: this was interpreted as responding to more fruiting sites. The two sites that responded this was were Emerald (Qld) and Condobilin (NSW).
154
The key factors these sites had in common were: • high level of fertilizer inputs, including supplemental calcium • plants grown with adequate water: i.e. not stressed at any time or
overwatered • summer production an high temperatures (promotes male flowers) • adequate population of bees which were actively foraging in the crop.
Treatments which increased the number of seedless watermelon plants and reduced competition from pollinator plants increased yield: These treatments were:
• reducing the number of pollinators from 3:1 to 4:1 • increasing plant density provided the level of inputs (water and nutrient)
was increased to match • direct seeding the pollinators rather than establishing them via transplants.
Interestingly, in these areas, not planting 1 or 2 rows per 9 row bay did not significantly reduce yield, but clearly saved on input costs. Direct Seeding Pollinators: In all the summer trials, where establishing pollinators by direct seeding was tested, it increased yield significantly compared to establishing seedlings by transplanting. In Condobilin, it was found that direct seeding at transplanting or 4 days after transplanting the seedless plants gave the highest yield. In Mataranka, the grower practice is to direct seed 4-7 days before transplanting their seedless watermelon plants, but the optimal timing may change during the year. The timing of direct seeding is critical, and can have a significant effect on the relative yields of seedless watermelon fruit and seeded fruit from pollinators.
Variety Assessment The variety assessment component of the project started with large screening trials of varieties from all available seed companies. The resulting trials were large and based on replicated 10m plot assessments. This approach was effective at identifying new genetics with potential for further evaluation, based mainly on quantitative fruit quality and qualitative plant attributes. The main limitations of this approach were:
• Plants form adjacent plots grew together and were difficult to separate at harvest.
• Yield estimates were highly variable.

155
After a full round of small plot variety evaluation trials, the most promising varieties were tested in larger plots, usually 1 full bay wide (8-9 rows) and at least 20 m long (in many cases much longer). These large plots were also replicated, usually there were two repetitions. The yields were assessed by harvesting commercially and weighing the bins of fruit harvested. Fruit quality and size data was collected from smaller sub-samples from within the large plots. There were at least three important advantages of this approach over small plot trials were:
1. The effects of fruit growing off the bed were minimized because the whole bay was harvested
2. Normal pickers were used to harvest the crop under supervision of a research agronomist
3. Growers placed more value on this data than small plot data because it was harvested commercially.
The most promising new varieties (compared with Shadow) were: Variety Seed company Nightshade Jarit Storm SPS 601-2 SPS Classic Jarit Royal armada Abbott and Cobb JTWM 755 very large fruit with good shelf life: processing?
Jarit
Most varieties firmer than Shadow: Classic, RM1290 and Royal Armada the firmest.

156
References Bhella, H. S. Effect of trickle irrigation and black mulch on growth, yield, and mineral composition of watermelon. HortScience. 1988. Dunlap, J. R. Wang, Y. T. Carson, J. L. Meacham, C. E. Improving the performance of vegetable transplants with a triazole growth retardant. Subtropical Plant Science. 1991. Duthie, J. A. Roberts, B. W. Edelson, J. V. Shrefler, J. W. Plant density-dependent variation in density, frequency, and size of watermelon fruits. Crop Science. 1999. Duval, J. NeSmith, D. Stand survival, establishment, and yield of diploid and triploid watermelon transplants of different ages and sizes. HortTechnology. 1999. Graham, C. Payne, J. Molnar, E. Cell size and pre transplant nutritional conditioning influence on growth and yield of transplanted ‘Jubilee’ watermelon. HortTechnology. 2000. Hakerlerer, H. Okur, B. Irget, E. Saatci, N. Carbohydrate fractions and nutrient status of watermelon grown on alluvial soils of Kucuk Menderes Watershed, Turkey. Improved crop quality by nutrient management. Kluwer Academic Publishers, Dorrecht, Netherlands. 1999. Hall, M. R. Cell size of seedling containers influences early vine growth and yield of transplanted watermelon. HortScience. 1989. Hayata. Y; Niimi.Y; Iwasaki. N; Nito-N (ed.); Looney NE (ed.); Nevins.DJ (ed.); Halevy. AH (1994) Inducing parthenocarpic fruit of watermelon with plant bioregulators. Plant bioregulators in horticulture - 1994, proceedings of a symposium held at the XXIV International Horticultural Congress, 21-27 Aug. 1994, Kyoto, Japan. Acta-Horticulturae. No. 394, 235-240. Hayata. Y; Niimi. Y; Iwasaki. N (1995) Synthetic cytokinin - 1-(2-chloro-4-pyridyl)-3-phenylurea (CPPU) - promotes fruit set and induces parthenocarpy in watermelon. Journal of the American Society for Horticultural Science. 120: 6, 997-1000. Hayata, Y. Niimi, Y. Inoue, K. Kondo, S. (2000a) CPPU and BA, with and without pollination, affect set, growth, and quality of muskmelon fruit. HortScience. 2000. 35: 5, 868-870.
157
Hayata, Y. Yoshioka, C. Niimi, Y. XinXian, L. (2000b) Effects of CPPU on the growth, sugar accumulation and activity of related enzymes in melon fruit. Acta Horticulturae. 2000. No. 514, 219-225. Hayata, Y. XinXian, L. Osajima, Y. (2001) CPPU promotes growth and invertase activity in seeded and seedless muskmelons during early growth stage. Journal of the Japanese Society for Horticultural Science. 2001. 70: 3, 299-303. HongXun, Z. Xiang, Z. Alin, S. ChunHe, S. Studies on the nutrient uptake and balanced fertilization of watermelon. Acta Horticulturae Sinica. 1996. Khade, V. N. Patil, B. P. Jadhav, S. N. Khanvilkar, S. A. Bhosale, S. S. Effects of irrigation, mulch, nitrogen and potassium on fruit yield and economics of watermelon. Journal of Maharashtra Agricultural Universities. 1995. Kim, H. Park, D. The effect of stored pollen and BA treatment on fruit set in watermelon. Research reports of the Rural Development Administration, Horticulture. 1991. Lee, S. G. Ko, K. D. Kim, K. Y. Park, S. K. Effects of planting density on the quality and yield in staking cultivation of watermelon under rain-shielding condition. Rda Journal of Agricultural Science Horticulture. 1993. Loy. JB; Allen. PC (1996) Phenylurea cytokinin (CPPU) more effective than 6-benzyladenine in promoting fruit set and inducing parthenocarpy in melon. Manu, V. T. The implication of application of thick organic mulch to the cropping system in Tonga. Journal of South Pacific Agriculture. 1997. Maynard, D. N. Elmstrom, G. W. McCuistion, F. T., Jr. Periodicity of watermelon fruit set and effect of bee attractants on yield. Proceedings of the Interamerican Society for Tropical Horticulture. 1992. MyeongWhoon, S. HanChul, R. YunJeong, K. JaeWook, L. ChangJae, Y, KuenWoo, P. Effects of irrigation amount on yield and sugar content of summer watermelon. RDA Journal of horticultural science. 1997. NeSmith, D. S. Plant spacing influences watermelon yield and yield components. HortScience. 1993. NeSmith, D. S. Root distribution and yield of direct seeded and transplanted watermelon. Journal of the American Society for Horticultural Science. 1999. Ohkubo, N. Ohsugi, K. Murakami, H. Akiyoshi, H. Hydroponic culture of watermelon plants. Bulletin of the experimental farm college of agriculture, Ehime University. 1997.
158
Olson, S. M. Hochmuth, G. J. Hochmuth, R. C. Effect of transplanting on earliness and total yield of watermelon. HortTechnology. 1994. Pak, H. Y. Effects of plant growth regulators on parthenocarpic fruit development in watermelon (Citrullus vulgaris Schrad.). Journal of the Korean Society for Horticultural Science. 1993. Sanders, D. Cure, J. Schultheis, J. Yield response of watermelon to planting density, planting pattern, and polyethylene mulch. HortScience. 1999. Schultheis, J. R. Ambrose, J. T. Bambara, S. B. Mangum, W. A. Selective bee attractants did not improve cucumber and watermelon yield. HortScience. 1994. Scott, W. Mc Craw, B. Motes, J. Smith, M. Application of calcium to soil and cultivar affect elemental concentration of watermelon leaf and rind tissue. Journal of the American society for horticultural science. 1993. SoonGi, P. BeomSeon, L. SoonJu, C. Effect of calcium concentration in nutrient solution on the growth and fruit quality of ‘Mudeungsan’ watermelon grown in rockwool. Journal of the Korean Society for Horticultural Science. 1999. SoonGi, P. SoonJu, C. HwaSung, P. Effect of cultural methods and planting densities on growth and fruit quality of ‘Mudeungsan’ watermelon. Journal of the Korean Society for Horticultural Science. 1999. Um, Y. C. Lee, J. H. Kang, K. H. Kang, K. Y. Son, T. H. Effects of forchlorfenuron application on the induction of parthenocarpic fruit and fruit quality in watermelon (Citrullus vulgaris S.) under greenhouse conditions. Journal of the Korean Society for Horticultural Science. 1995. Vavrina, C. S. Olson, S. Cornell, J. A. Watermelon transplant age: influence on fruit yield. HortScience. 1993. Vavrina, C. S. Transplant age in vegetable crops. HortTechnology. 1998. XinXian, L. Hayata, Y. Osajima, Y. (2000) CPPU (re-treatment), 4-CPA and NAA improve the growth and quality of parthenocarpic melon fruit induced by CPPU. Environment Control in Biology. 2000. 38: 3, 129-134.

159
Technology Transfer
Articles and Conference Presentations Rogers, G.S. 2002. Seedless watermelon agronomic improvement project. Presentation to Select Melons Australia – All Heart Conference – Townsville, Australia, October 29 – November 1 2002. Rogers, G.S. Young, A. 2002. Proposal to collect data within SMA group and use to relate back to yields and quality. Presentation to Select Melons Australia – All Heart Conference – Townsville, Australia, October 29 – November 1 2002. Rogers, G.S. Little, S. 2002. No-till vegetable production using cover crop mulches. Presentation to Select Melons Australia – All Heart Conference – Townsville, Australia. October 29 – November 1 2002. Rogers, G.S. 2003 Agronomic Improvements in Seedless Watermelons. Presentation to SMA Conference – Katherine. August Rogers, G.S. 2003 Douglas Daly Trial Results. Presentation to SMA Conference – Condobolin. November Rogers, G.S. and Giggins, B. 2005 Chinchilla results (year 3) and Condobolin results (year 3). Presentation to SMA Conference -Brisbane Thursday 25th August Rogers, G.S. and Giggins, B. 2006 SMA Annual Conference, Brisbane Presentation to SMA Conference - Brisbane Rogers, G.S. Seedless Watermelon Agronomy, Canowindra Field Day, NSW July 2006. Rogers, G., 2006. Watermelon production in Vietnam. Melon News 26,6

160
Regular project updates and brief articles are published by AHR CropScience in the SMA – All Heart Newsletter. Topics include:
• US Watermelon Scientists to Visit Australia • Watermelon protect against cancer • Systemic Acquired Resistance in Watermelons • Fresh produce can make people sick • Methyl Bromide Replacement • Nitrogen Mapping in Vegetable Crops • Improvement of post harvest life of melons using Systemic Acquired
Resistance (SAR) activators pre- and post harvest. • Sudden Wilt expert visit to Australia • Research Project Update (5th June 2003) • New Concepts in Irrigation Management (5th June 2003) • Calcium & Nitrogen key to Seedless success (25th June 2003)
Contributions to the SMA newsletter:
• Research Project Update. August 2003 • Trichogramma release in the top-end. October 2003 • Seedless Watermelon Project Update. February 2004 • Irrigation Monitoring in Seedless Watermelon. February 2004
Review Meetings
• SMA summer review meeting in Brisbane the 7th March 2005
• SMA/OneHarvest annual conference in Brisbane 28th August 2005
• Summer Review in Emerald (14th November 2005): Mataranka results (year 3) and field walk in the year 4 trials at Emerald.
• SMA Teleconference (Tuesday 14th February 2006): Mataranka results
(year 3), final year 4 trials at Emerald and results of yield prediction and crop scheduling work.
• Field day at Emerald (14th November 2005) to show growers the results
of trials in the field.


