22
MASTER THESIS KAPANEN KATJA
| Date post: | 14-Apr-2017 |
| Category: |
Documents |
| Upload: | katja-kapanen |
| View: | 322 times |
| Download: | 0 times |

MASTER THESIS
KAPANEN KATJA

TARGET PHENOMENON
IMPROVING AIRPORT PERFORMANCE –
MIKKELI CITY AIRPORT

BACKGROUND
• Own interest – work, school assignments • Actual topic – municipality level: a part of airport development project for the City of Mikkeli, governmental level: air transport strategy by the working group appointed by the Ministry of Transport and CommunicaRons
• Research gap – theme not studied
OBJECTIVES AND DELIMITATIONS The main objecRve of this thesis is to make proposal for Mikkeli City airport for developing the airport performance. The aim is to present an airport performance comparison between Mikkeli City airport and best pracRse example – Stockholm Skavsta airport. The comparison between these airports will be done using metrics as employment, produc9on capacity and the quan9ty of passengers for offering jusRficaRons why regional airport is worth of maintaining and worth of future development.

RESEARCH QUESTION(S)
Main research ques9on: How to improve the performance of Mikkeli City airport? Sub-‐research ques9ons: Why to improve the performance of Mikkeli City airport? What is airport performance and how it is measured? What can be learned from Stockholm Skavsta airport -‐case?
THEORETICAL FRAMEWORK TheoreRcal framework of the study is built on the key performance areas and key performance indicators of airport performance studies. Main sources of informaRon have been used studies conducted by Mrs Anne Graham from University of Westminster, London and Mr Hans-‐Arthur Vogel from IUBH InternaRonal University of Applied Sciences, Bad Honnef and Bad Reichenhall, and also University of Westminster, London. They have studied and published studies about airport performance individually, together, and with other researchers within the decade of 2000 (Graham 2014; Graham 2005; Vogel 2004; Vogel, H. –A., Graham, A. 2010).
RESEARCH METHOD
This study is qualita9ve research using case study approach where research data was collected using interviewing and analysing of secondary data. Study was carried out using the benchmarking technique for finding the ways of improving the performance of Mikkeli City airport. Used approach of performance indicators is Par9al Factor Produc9vity (PFP) measures, which examine the relaRonship between inputs as employment effect and producRon capacity, and output: quanRty of passengers. Hypothesis of the study was that from Stockholm Skavsta airport could be learned pracRses, which can be used to improve the performance of the Mikkeli City airport.
LIST OF REFERENCES ACI EUROPE 2014; 2012; ACI INTERNATIONAL 2012; ACRP 2011; ASSOCIATION OF FINNISH LOCAL AND REGIONAL AUTHORITIES 2010; CARLGREN, ERIC 2014; CENTRE FOR ECONOMIC D E V E L O P M E N T , T R A N S P O R T A N D T H E E N V I R O N M E N T 2013; CITY OF MIKKELI 2014; 2013; 2012; CITY OF NYKÖPING 2014; CITY OF SEINÄJOKI 2013; CROCKER, DAVID 2005; DELOVOI PETERSBURG 2013; ERIKSSON, PÄIVI & KOVALAINEN, ANNE 2008; EUROCONTROL 2014; 2013; 1999; EUROPEAN COMMISSION 2012; FINAVIA 2014; 2013; 2012; FINNAIR 2014; FRANCIS, GRAHAM & HUMPHREYS, IAN & FRY, JACKIE 2 0 0 2 ; F R A N K E N , S V E N 2 0 1 3 ; F R Y , J A C K I E & H UM P H R E Y S , I A N & FRANCIS, GRAHAM 2005; GILLHAM, BILL 2010; GRAHAM, ANNE 2014; 2005; HELSINGIN S ANOMAT 2 0 1 4 ; HUMPHR E Y S , I A N & F R ANC I S , G RAHAM 2 0 0 2 ; I C AO 2013; 2012; 2010; KULOVUORI DOT GADE 2014; KÄRNÄ, MIKKO 2014; LENTOPAIKAT 2014; LONGMAN 2001; MC-‐INFO OY 2014; MIKKELI CITY AIRPORT 2012; MINISTRY OF TRANSPORT AND COMMUNICATIONS 2014; 2013; 2012; OECD 2011; OUM, TAE HOON & YU, CHUNYAN & FU, XIAOWEN 2003; OXFORD ECONOMICS 2011; PAANANEN, JUHA-‐PEKKA 2014; PATTERSON, JAMES G. 1996; RAIVIO, JYRI 2013; RAUHAMÄKI, HARRI & MÄNTYNEN, JORMA & MÄKELÄ, TOMMI & SINISALO, ESSI & KALENOJA HANNA 2006; SILVENNOINEN, SAKARI 2014; STATISTICS FINLAND 2014; 2013; 2012; STATISTICS SWEDEN 2013; STOCKHOLM SKAVSTA AIRPORT 2014; TAK OY 2011; TRAFI 2014; 2013; 2012; VOGEL, HANS-‐ARTHUR 2004; VOGEL, HANS-‐ARTHUR & GRAHAM, ANNE 2010; WORLDS AIRPORT CODES 2014; WORLDS TOURISM ORGANISATION AND EUROPEAN TRAVEL COMMISSION 2009.
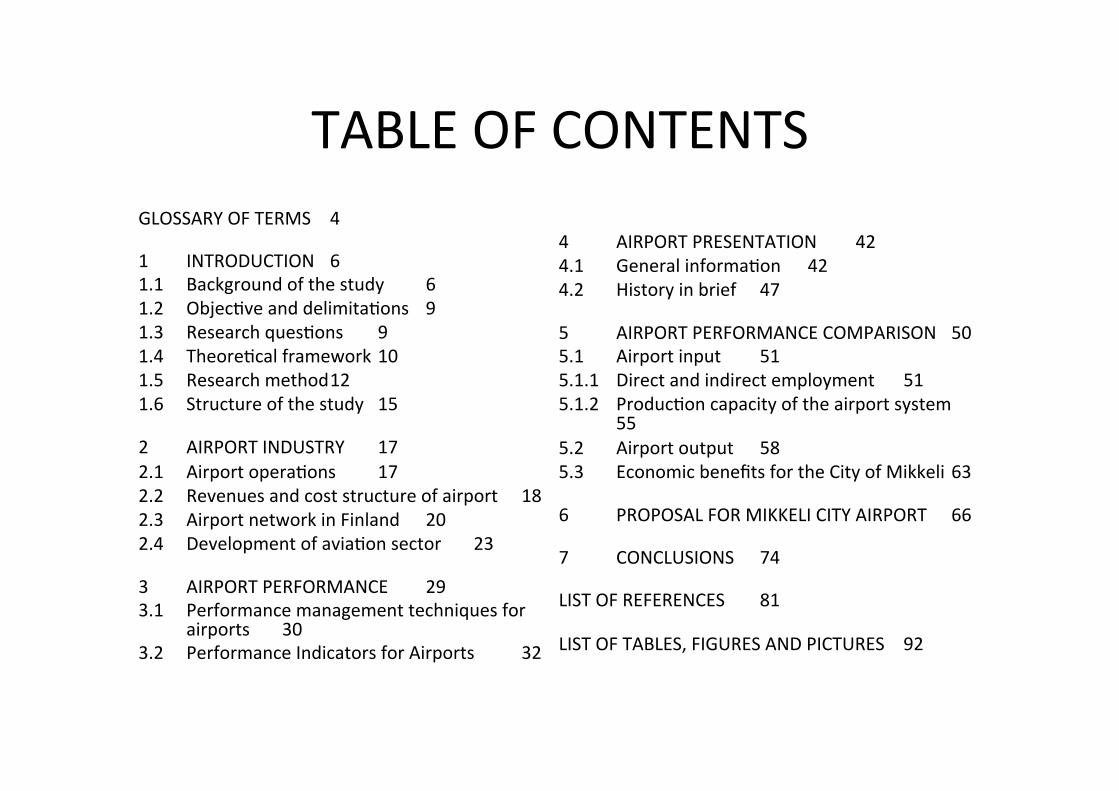
TABLE OF CONTENTS GLOSSARY OF TERMS 4 1 INTRODUCTION 6 1.1 Background of the study 6 1.2 ObjecRve and delimitaRons 9 1.3 Research quesRons 9 1.4 TheoreRcal framework 10 1.5 Research method 12 1.6 Structure of the study 15 2 AIRPORT INDUSTRY 17 2.1 Airport operaRons 17 2.2 Revenues and cost structure of airport 18 2.3 Airport network in Finland 20 2.4 Development of aviaRon sector 23 3 AIRPORT PERFORMANCE 29 3.1 Performance management techniques for
airports 30 3.2 Performance Indicators for Airports 32
4 AIRPORT PRESENTATION 42 4.1 General informaRon 42 4.2 History in brief 47 5 AIRPORT PERFORMANCE COMPARISON 50 5.1 Airport input 51 5.1.1 Direct and indirect employment 51 5.1.2 ProducRon capacity of the airport system 55 5.2 Airport output 58 5.3 Economic benefits for the City of Mikkeli 63 6 PROPOSAL FOR MIKKELI CITY AIRPORT 66 7 CONCLUSIONS 74 LIST OF REFERENCES 81 LIST OF TABLES, FIGURES AND PICTURES 92

COMPANY PRESENTATION
STOCKHOLM SKAVSTA AIRPORT Stockholm Skavsta airport from the air. Screen shot from Google maps on 4th of March 2014.
MIKKELI CITY AIRPORT Mikkeli City airport from the air. Picture by Sakari Silvennoinen.
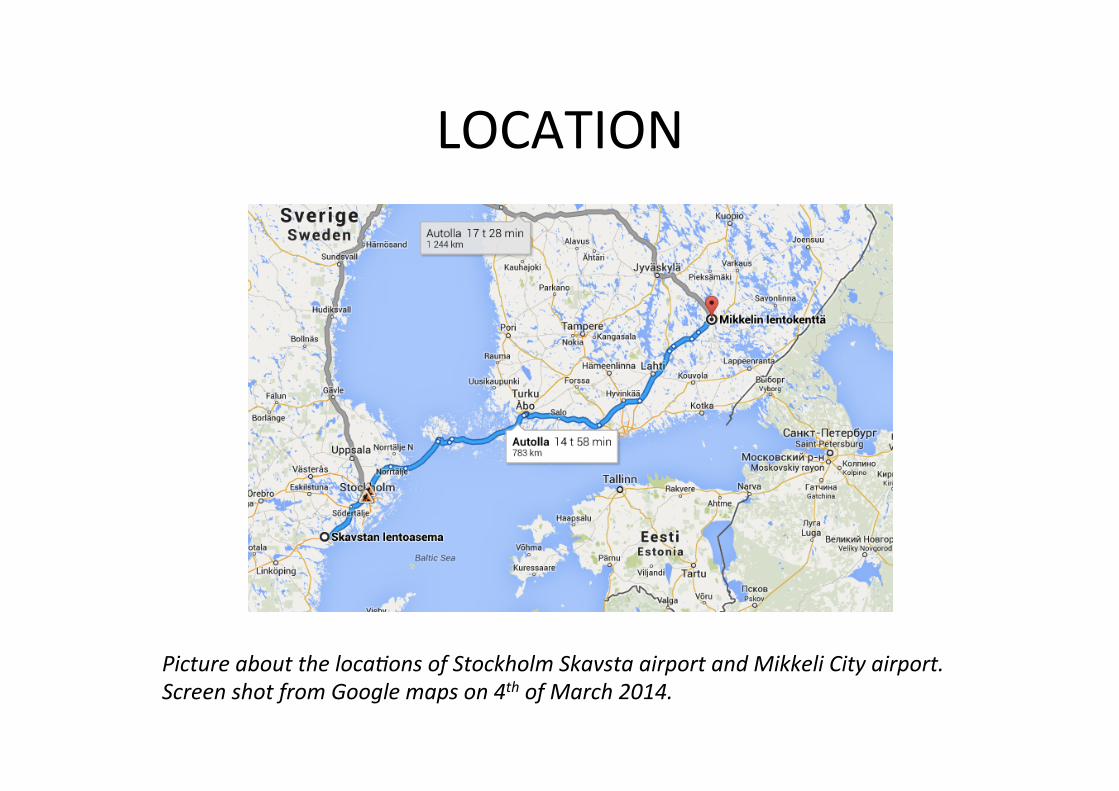
LOCATION
Picture about the loca@ons of Stockholm Skavsta airport and Mikkeli City airport. Screen shot from Google maps on 4th of March 2014.
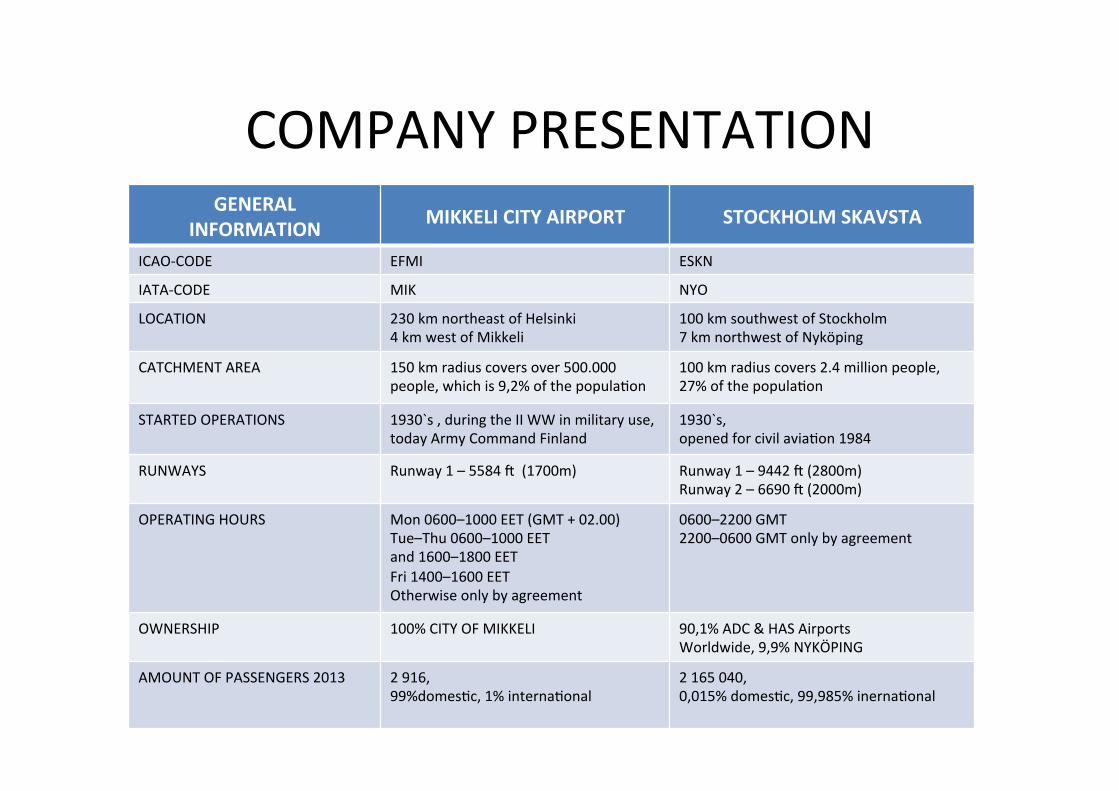
COMPANY PRESENTATION GENERAL
INFORMATION MIKKELI CITY AIRPORT STOCKHOLM SKAVSTA
ICAO-‐CODE EFMI ESKN
IATA-‐CODE MIK NYO
LOCATION 230 km northeast of Helsinki 4 km west of Mikkeli
100 km southwest of Stockholm 7 km northwest of Nyköping
CATCHMENT AREA 150 km radius covers over 500.000 people, which is 9,2% of the populaRon
100 km radius covers 2.4 million people, 27% of the populaRon
STARTED OPERATIONS 1930`s , during the II WW in military use, today Army Command Finland
1930`s, opened for civil aviaRon 1984
RUNWAYS Runway 1 – 5584 p (1700m) Runway 1 – 9442 p (2800m) Runway 2 – 6690 p (2000m)
OPERATING HOURS Mon 0600–1000 EET (GMT + 02.00) Tue–Thu 0600–1000 EET and 1600–1800 EET Fri 1400–1600 EET Otherwise only by agreement
0600–2200 GMT 2200–0600 GMT only by agreement
OWNERSHIP 100% CITY OF MIKKELI 90,1% ADC & HAS Airports Worldwide, 9,9% NYKÖPING
AMOUNT OF PASSENGERS 2013 2 916, 99%domesRc, 1% internaRonal
2 165 040, 0,015% domesRc, 99,985% inernaRonal
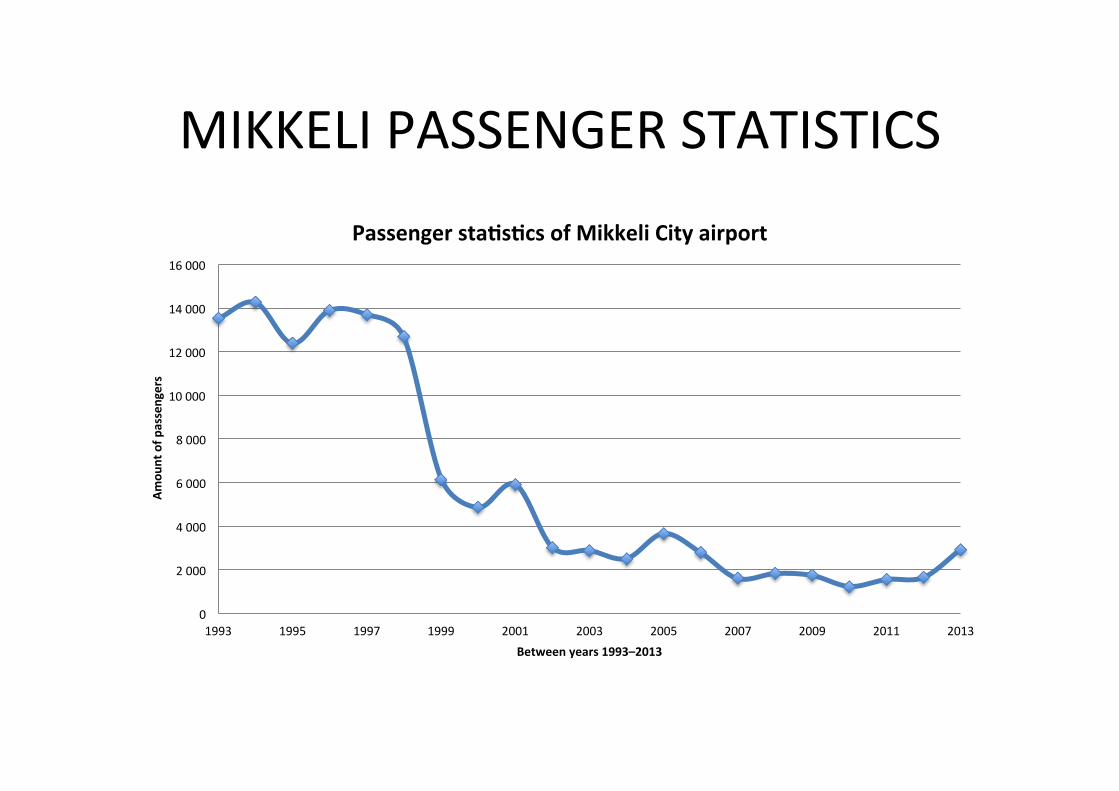
MIKKELI PASSENGER STATISTICS
0
2 000
4 000
6 000
8 000
10 000
12 000
14 000
16 000
1993 1995 1997 1999 2001 2003 2005 2007 2009 2011 2013
Amou
nt of p
assengers
Between years 1993–2013
Passenger sta9s9cs of Mikkeli City airport
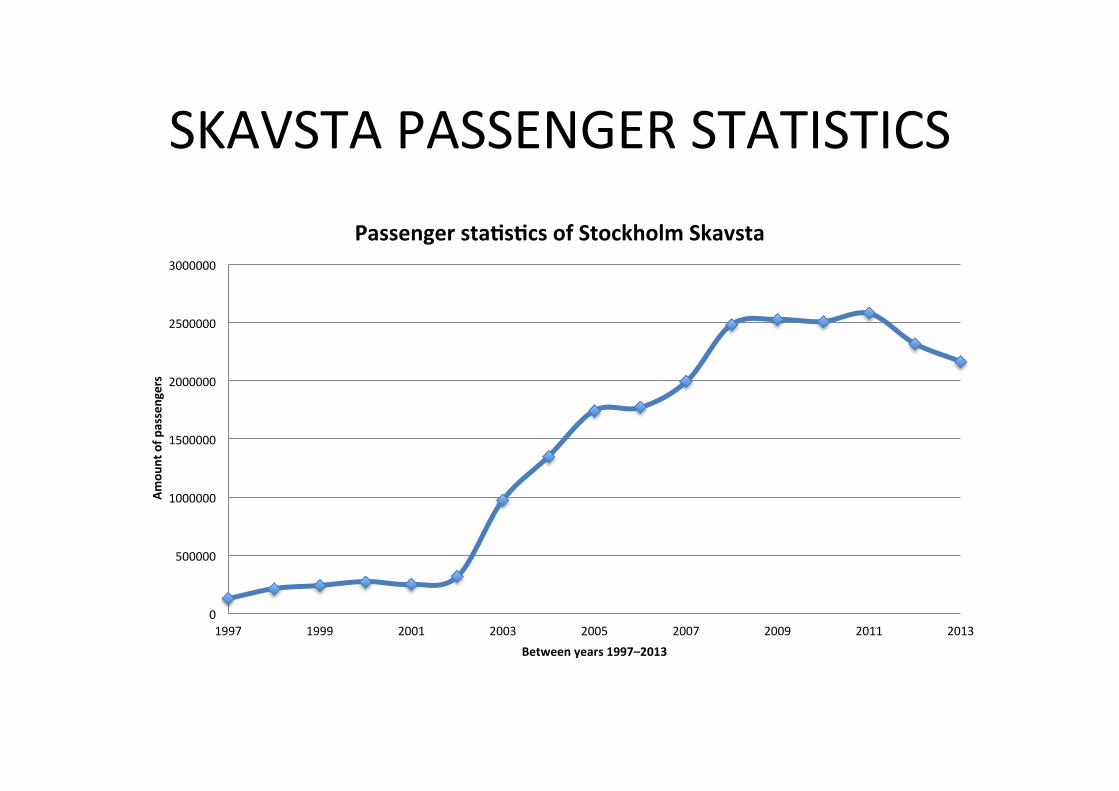
SKAVSTA PASSENGER STATISTICS
0
500000
1000000
1500000
2000000
2500000
3000000
1997 1999 2001 2003 2005 2007 2009 2011 2013
Amou
nt of p
assengers
Between years 1997–2013
Passenger sta9s9cs of Stockholm Skavsta
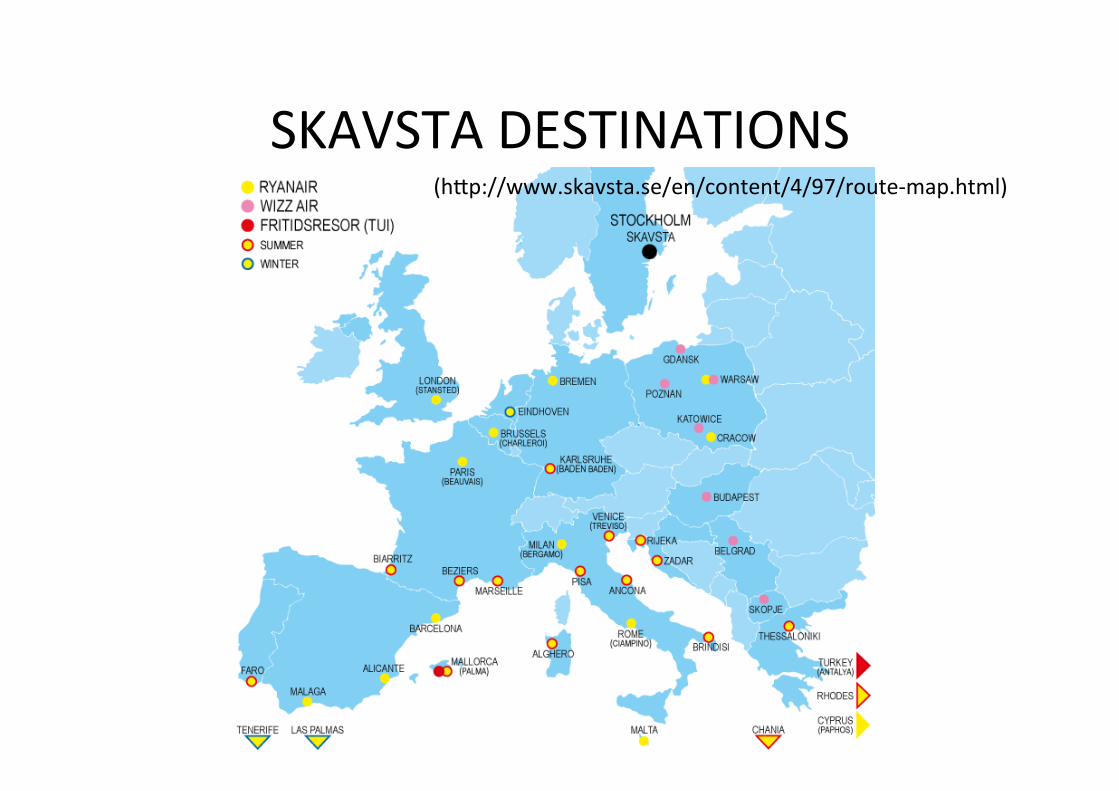
SKAVSTA DESTINATIONS (hrp://www.skavsta.se/en/content/4/97/route-‐map.html)
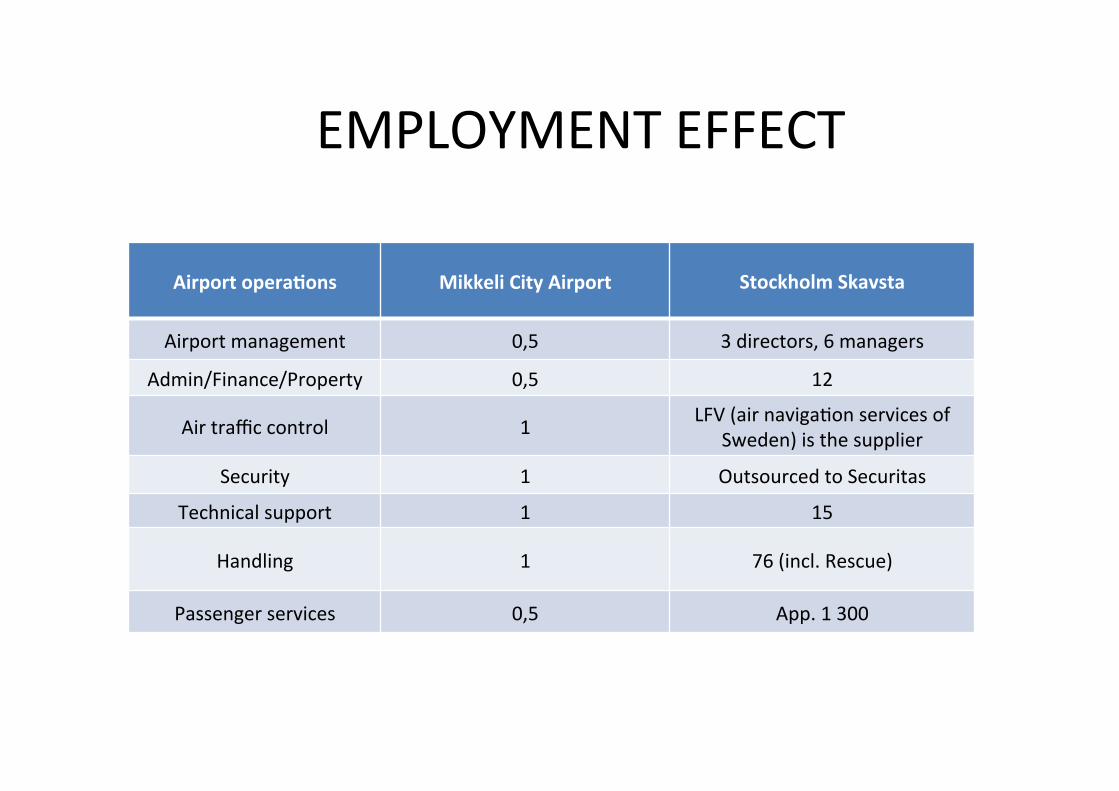
Airport opera9ons Mikkeli City Airport
Stockholm Skavsta
Airport management 0,5 3 directors, 6 managers
Admin/Finance/Property 0,5 12
Air traffic control 1 LFV (air navigaRon services of Sweden) is the supplier
Security 1 Outsourced to Securitas
Technical support 1 15
Handling 1 76 (incl. Rescue)
Passenger services 0,5 App. 1 300
EMPLOYMENT EFFECT
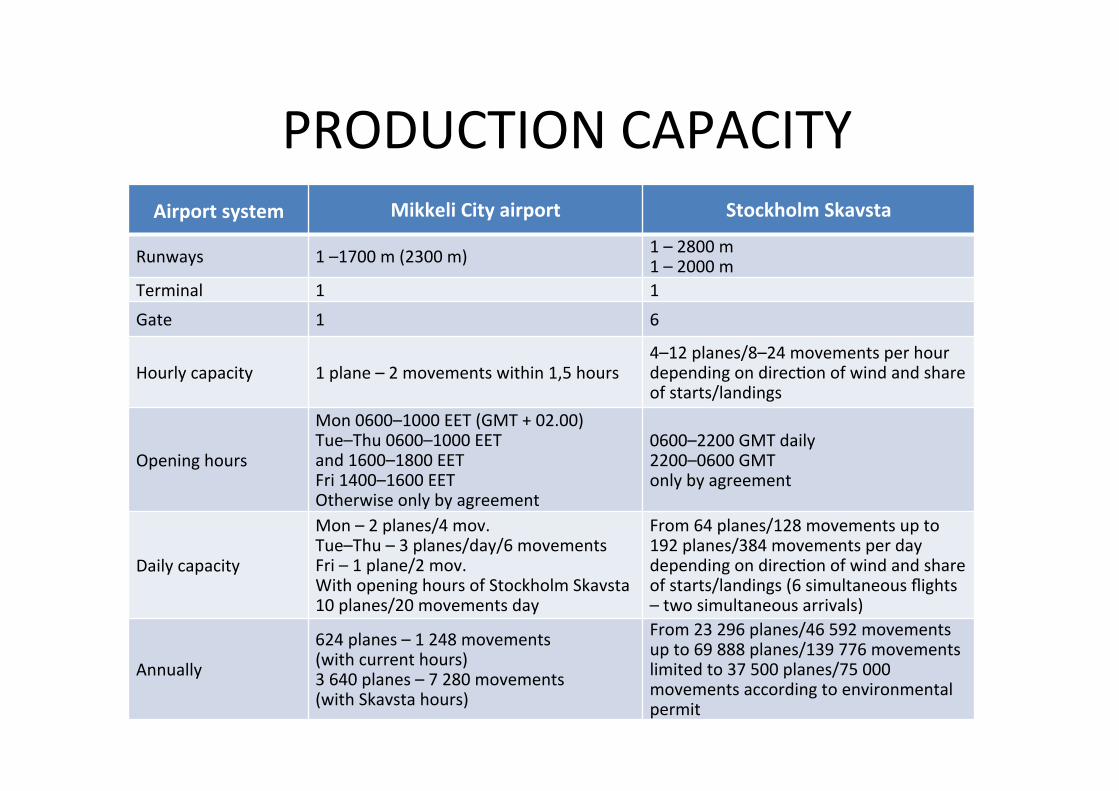
Airport system Mikkeli City airport Stockholm Skavsta
Runways 1 –1700 m (2300 m) 1 – 2800 m 1 – 2000 m
Terminal 1 1 Gate 1 6
Hourly capacity 1 plane – 2 movements within 1,5 hours 4–12 planes/8–24 movements per hour depending on direcRon of wind and share of starts/landings
Opening hours
Mon 0600–1000 EET (GMT + 02.00) Tue–Thu 0600–1000 EET and 1600–1800 EET Fri 1400–1600 EET Otherwise only by agreement
0600–2200 GMT daily 2200–0600 GMT only by agreement
Daily capacity
Mon – 2 planes/4 mov. Tue–Thu – 3 planes/day/6 movements Fri – 1 plane/2 mov. With opening hours of Stockholm Skavsta 10 planes/20 movements day
From 64 planes/128 movements up to 192 planes/384 movements per day depending on direcRon of wind and share of starts/landings (6 simultaneous flights – two simultaneous arrivals)
Annually
624 planes – 1 248 movements (with current hours) 3 640 planes – 7 280 movements (with Skavsta hours)
From 23 296 planes/46 592 movements up to 69 888 planes/139 776 movements limited to 37 500 planes/75 000 movements according to environmental permit
PRODUCTION CAPACITY
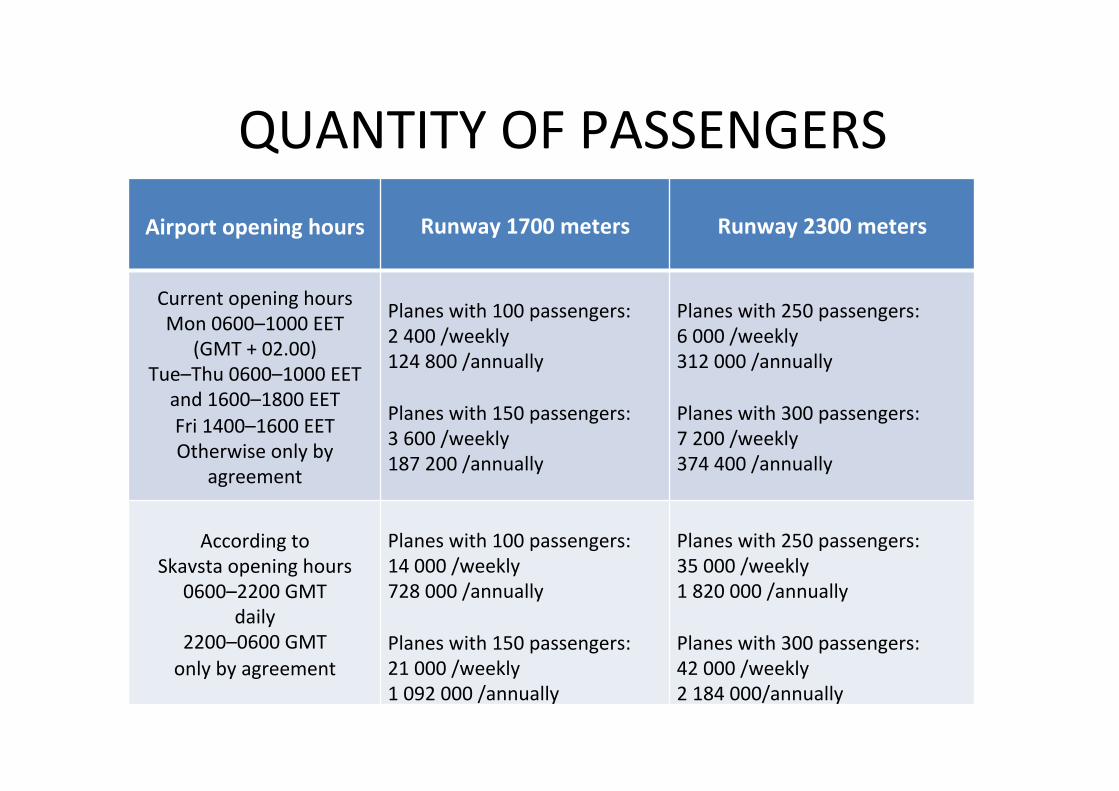
Airport opening hours
Runway 1700 meters
Runway 2300 meters
Current opening hours Mon 0600–1000 EET
(GMT + 02.00) Tue–Thu 0600–1000 EET and 1600–1800 EET Fri 1400–1600 EET Otherwise only by
agreement
Planes with 100 passengers: 2 400 /weekly 124 800 /annually Planes with 150 passengers: 3 600 /weekly 187 200 /annually
Planes with 250 passengers: 6 000 /weekly 312 000 /annually Planes with 300 passengers: 7 200 /weekly 374 400 /annually
According to Skavsta opening hours
0600–2200 GMT daily
2200–0600 GMT only by agreement
Planes with 100 passengers: 14 000 /weekly 728 000 /annually Planes with 150 passengers: 21 000 /weekly 1 092 000 /annually
Planes with 250 passengers: 35 000 /weekly 1 820 000 /annually Planes with 300 passengers: 42 000 /weekly 2 184 000/annually
QUANTITY OF PASSENGERS
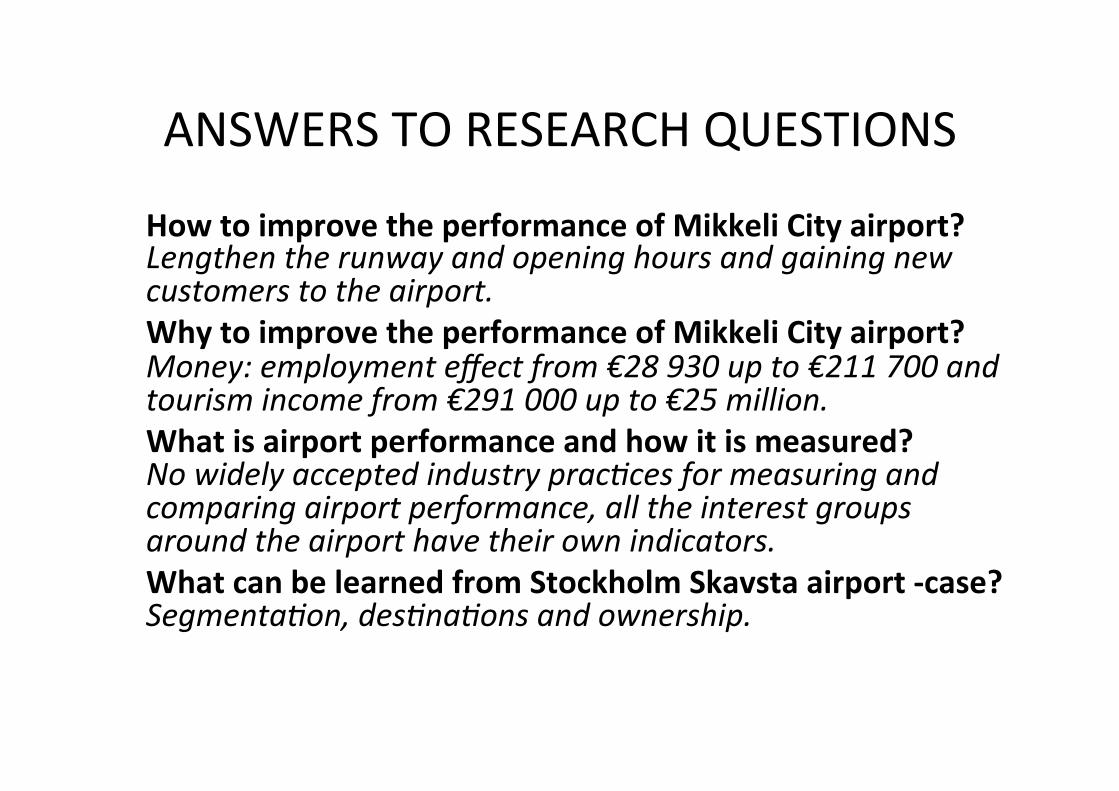
ANSWERS TO RESEARCH QUESTIONS
How to improve the performance of Mikkeli City airport? Lengthen the runway and opening hours and gaining new customers to the airport. Why to improve the performance of Mikkeli City airport? Money: employment effect from €28 930 up to €211 700 and tourism income from €291 000 up to €25 million. What is airport performance and how it is measured? No widely accepted industry prac@ces for measuring and comparing airport performance, all the interest groups around the airport have their own indicators. What can be learned from Stockholm Skavsta airport -‐case? Segmenta@on, des@na@ons and ownership.

PROPOSAL FOR MIKKELI CITY AIRPORT
1. SegmentaRon: to become leading tourism airport in Finland
2. DesRnaRons: offering wide range of tourism desRnaRons
3. Ownership: privaRzing the airport.
AT THE END Our research is reliable when conducRng the study using benchmarking with an approach of parRal factor producRvity (PFP) when analysing our data and finding the answer to our research quesRons. ParRal factor producRvity showed well the relaRonship between inputs as employment and producRon capacity and output of quanRty of passengers. Collected data is valid corresponding to the requirements for minimum amount of data according to Graham and Vogel (2014; 2004) for comparing airport performance using input and output indicators. Our study has validity, where used data, method and results, jusRfies the proposals for the City of Mikkeli for developing the Mikkeli City airport performance. Study method measures the phenomenon, using employment effect, producRon capacity and quanRty of passengers, and is reliable and it can be replicated. Study results and arguments made according to the analysis of the collected data are also reliable and can be replicated.

THANK YOU!
PHOTO BY RAIMO SUOMELA ON 09.03.2010 AT LPP.


