Improving Introductory TSP for Creating High Performance Student Teams Masanobu Umeda, Keiichi Katamine, Masaaki Hashimoto Kyushu Institute of Technology, Japan Yoshihiro Akiyama Next Process Institute Inc., Japan
Transcript
Improving Introductory TSP for Creating High Performance
Student Teams
Masanobu Umeda, Keiichi Katamine, Masaaki Hashimoto Kyushu Institute of Technology, Japan
Yoshihiro Akiyama
Next Process Institute Inc., Japan
Kyushu Institute of Technology (Kyutech)
Tokyo
Founded 1907 Established two Engineering Schools and three Graduate
Schools Major Graduate Schools related to Engineering:
– Engineering – Computer Science and Systems Engineering – Life Science and Systems Engineering
Campuses (Southern Japan): – KitaKyushu City Wakamatsu Campus, Tobata Campus – Iizuka City Iizuka Campus
500 Miles
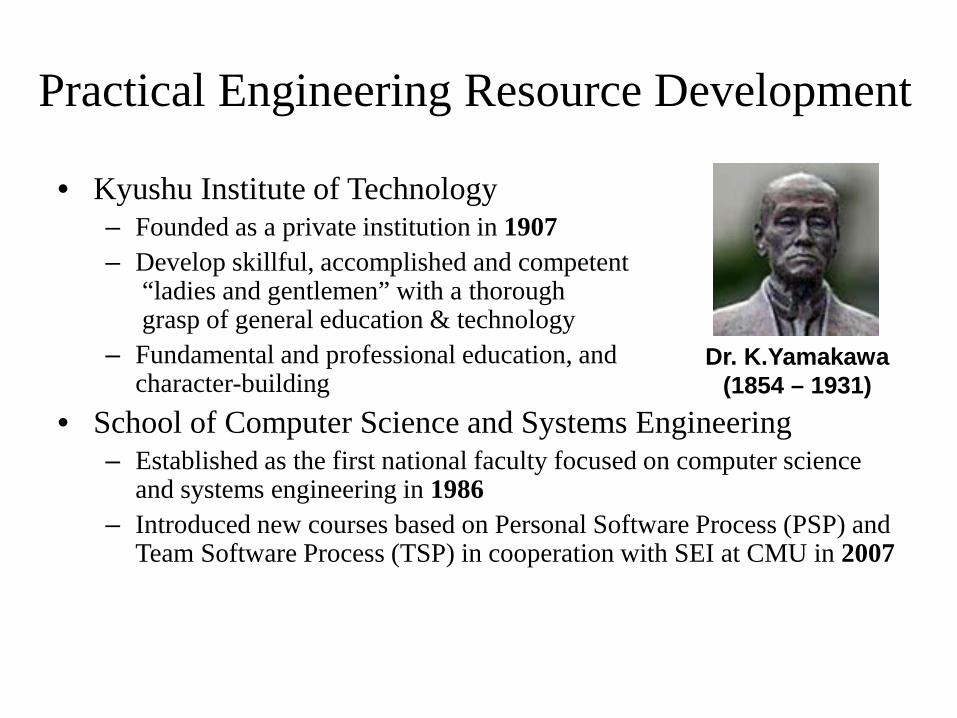
Practical Engineering Resource Development
• Kyushu Institute of Technology – Founded as a private institution in 1907 – Develop skillful, accomplished and competent
“ladies and gentlemen” with a thorough grasp of general education & technology
– Fundamental and professional education, and character-building
• School of Computer Science and Systems Engineering – Established as the first national faculty focused on computer science
and systems engineering in 1986 – Introduced new courses based on Personal Software Process (PSP) and
Team Software Process (TSP) in cooperation with SEI at CMU in 2007
Dr. K.Yamakawa (1854 – 1931)
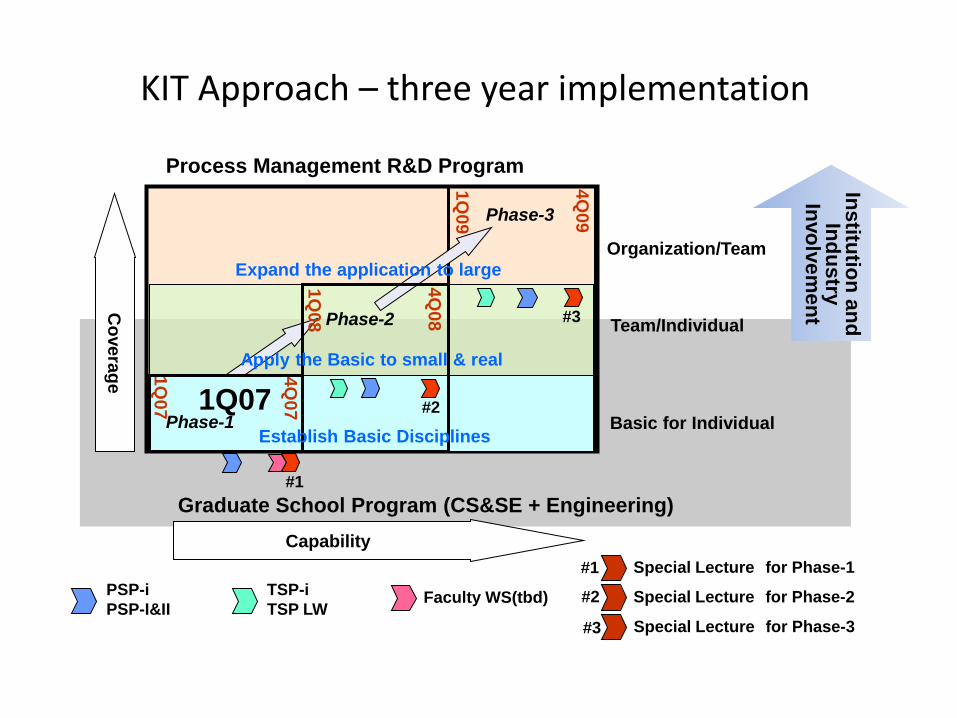
KIT Approach – three year implementation
PSP-i PSP-I&II
Faculty WS(tbd)
Special Lecture for Phase-1 TSP-i TSP LW
Graduate School Program (CS&SE + Engineering)
Process Management R&D Program
Capability
Coverage
Team/Individual
Phase-3
Expand the application to large
Special Lecture for Phase-2
Special Lecture for Phase-3
Basic for Individual Phase-1
Phase-2
Apply the Basic to small & real
Establish Basic Disciplines
1Q07
1Q08
1Q09
#1
#2
#3
#3
#2
#1
1Q07
4Q07
4Q08
4Q09
Institution and Industry
Involvement
Organization/Team
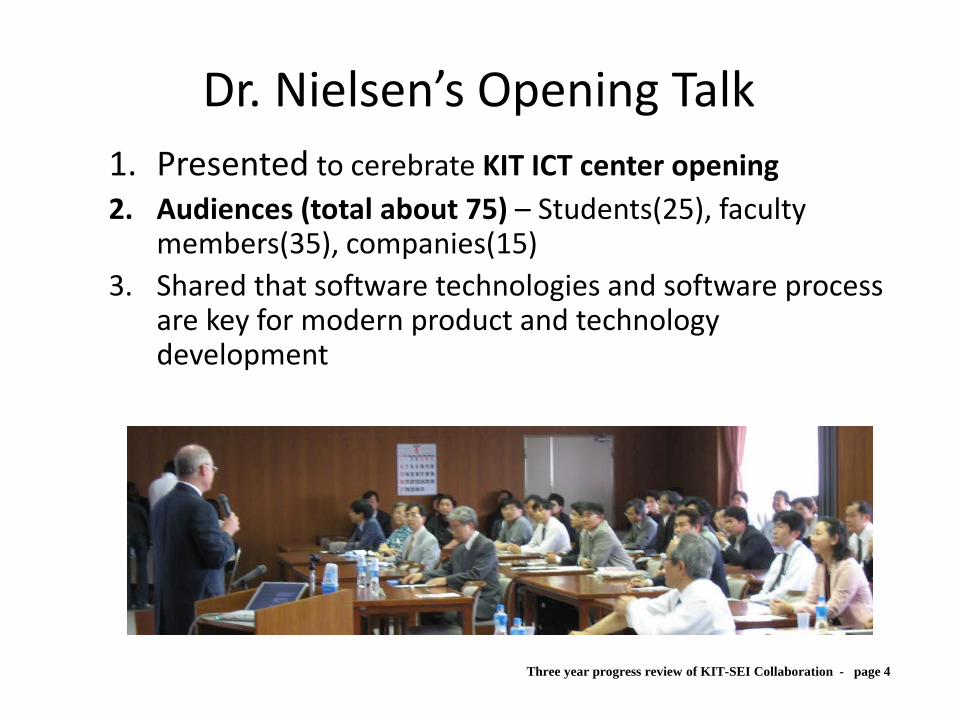
Dr. Nielsen’s Opening Talk 1. Presented to cerebrate KIT ICT center opening 2. Audiences (total about 75) – Students(25), faculty
members(35), companies(15) 3. Shared that software technologies and software process
are key for modern product and technology development
Three year progress review of KIT-SEI Collaboration - page 4
History of PSP/TSP in Kyutech 2007. 3 PSP for Engineers for the staff 2007. 5 Dr. Nielsen – Key note on Software Engineering 2007. 8 PSP/TSP Faculty Workshop 2008. 1 3 faculty members completed PSP Instructor
Training 2008. 3 PSP for Engineers for graduate students 2008. 4 Watts Humphrey – IEEE CS SEE&T2008, Teaching
Indusry-strengthend Software Engineering 2010. 8 Introduction to Personal Process for
undergraduates 2010.10 TSPi for graduates students 2011. 3 Managing TSP Teams for undergraduates 2013 .X New faculty members will take PSP Instructor
Training
PSP Certificate of Completion from Dr. Nielsen and Pres. Shimomura
Sep. 15, 2009
Special Lecture 「View of Balancing Agility and Discipline」
Speaker:James Over Software Engineering Institute, Carnegie Mellon University
August 31, 2012
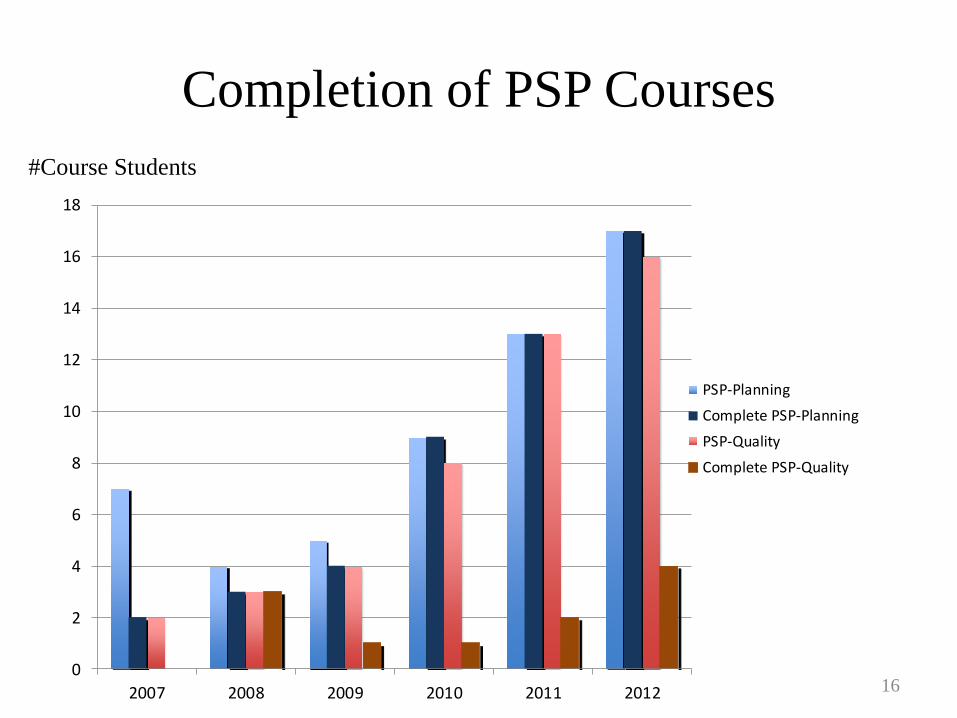
Growth of PSP/TSP Courses
0
2
4
6
8
10
12
14
16
18
2007 2008 2009 2010 2011 2012
PSP-Planning
PSP-Quality
TSPi
#Course Students
8
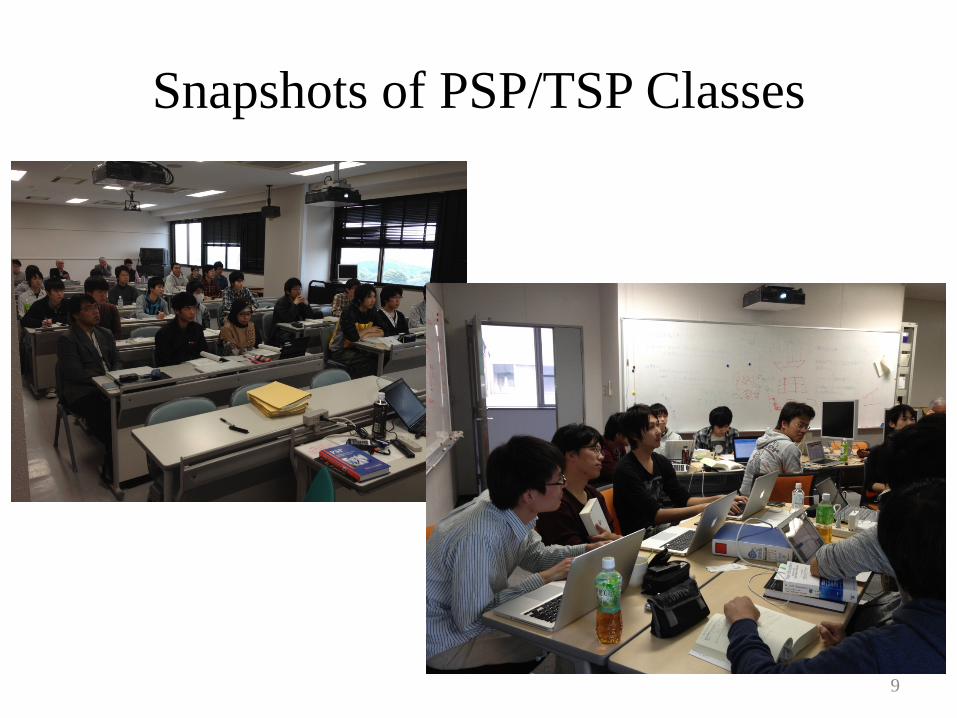
Snapshots of PSP/TSP Classes
9
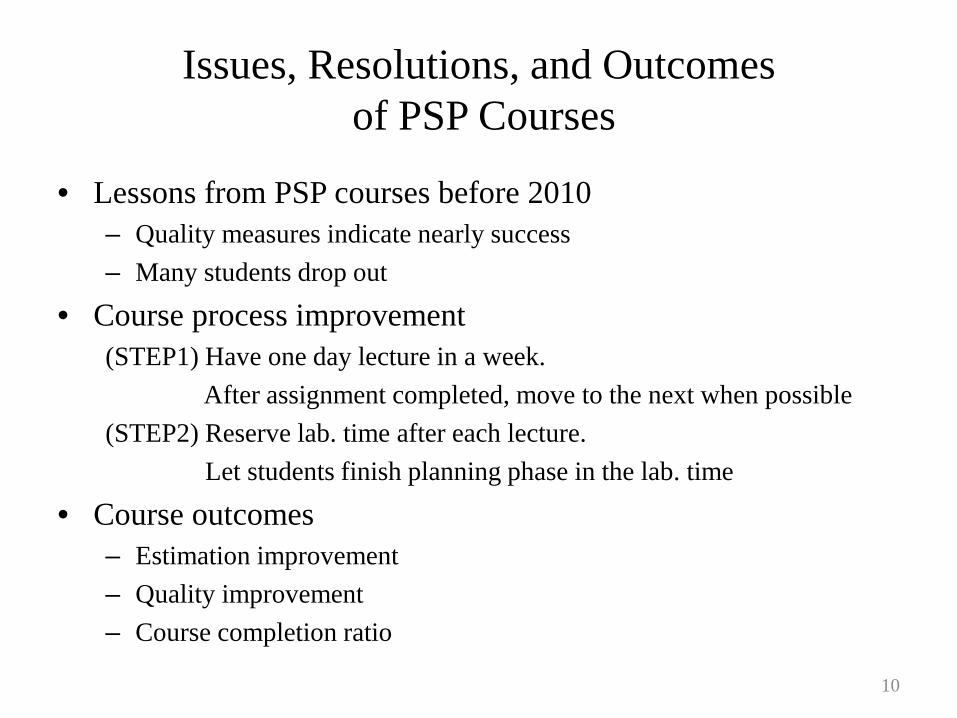
Issues, Resolutions, and Outcomes of PSP Courses
• Lessons from PSP courses before 2010 – Quality measures indicate nearly success – Many students drop out
• Course process improvement (STEP1) Have one day lecture in a week. After assignment completed, move to the next when possible (STEP2) Reserve lab. time after each lecture. Let students finish planning phase in the lab. time
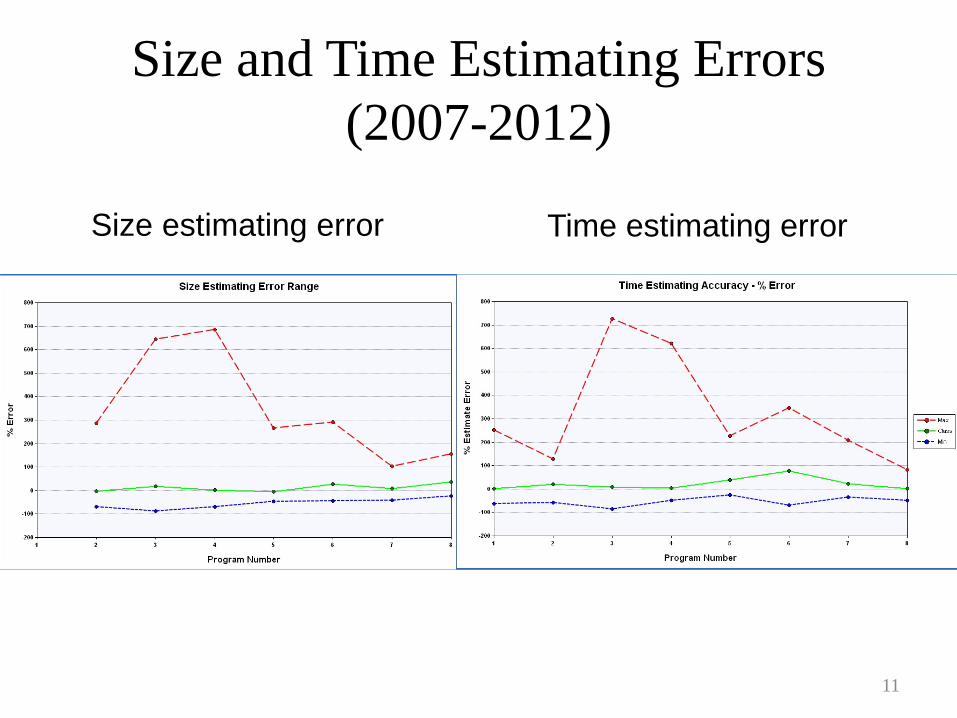
• Size and time estimating errors – Estimation and trace can be done based on the process discipline – Errors reduced as the course progress and balanced well
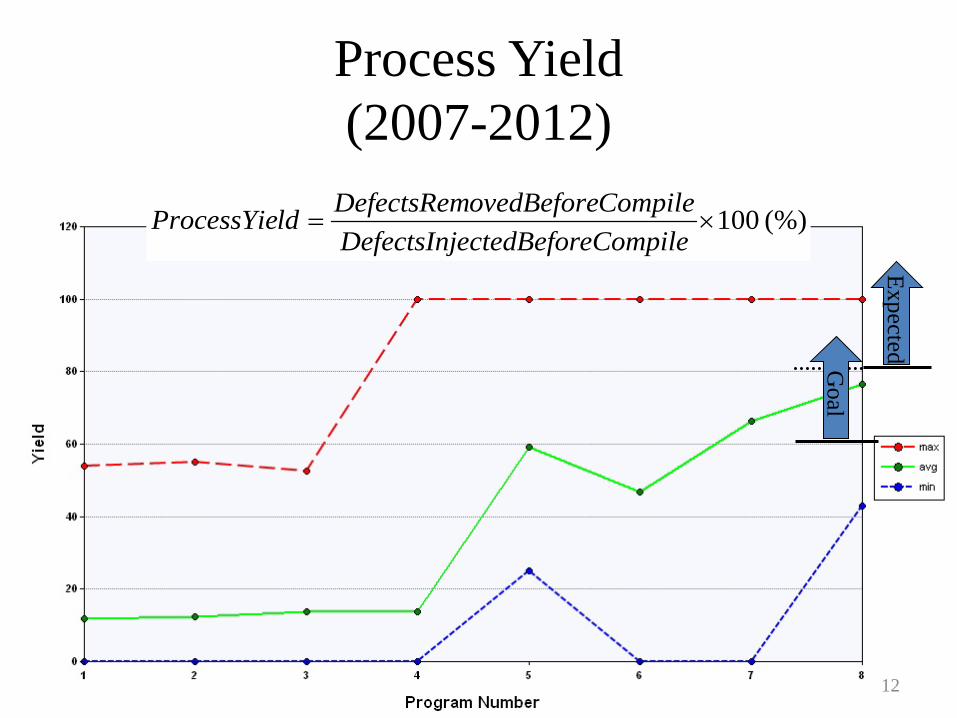
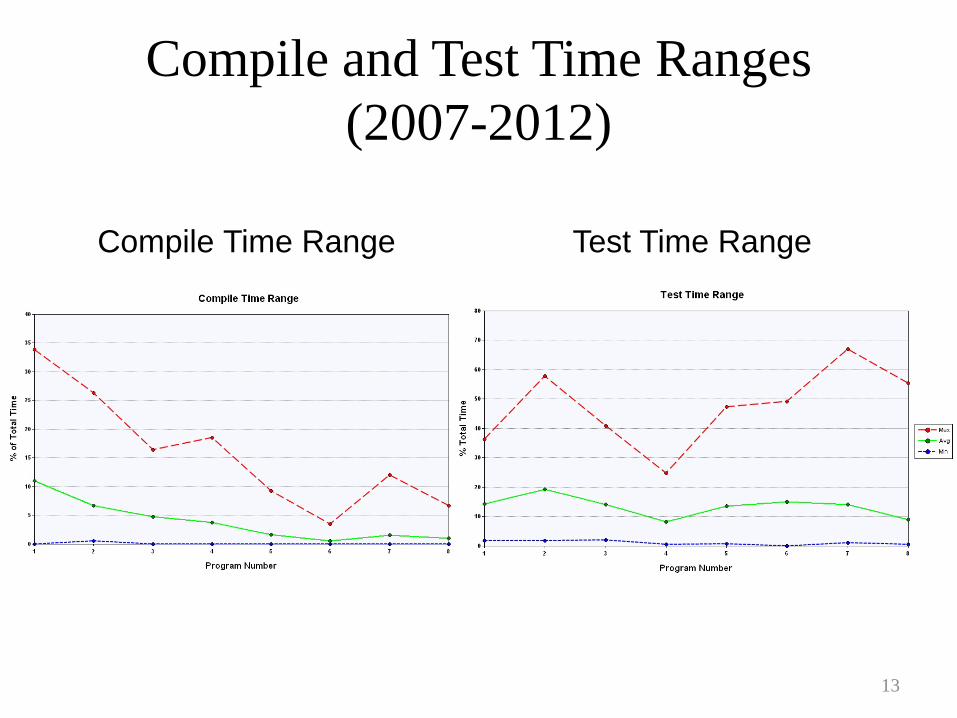
• Product quality – Process yield >= about 80% in average – 190 Defects/KLOC 25 Defects/KLOC even in worst case – 35 Defects/KLOC under 10 Defects/KLOC in average
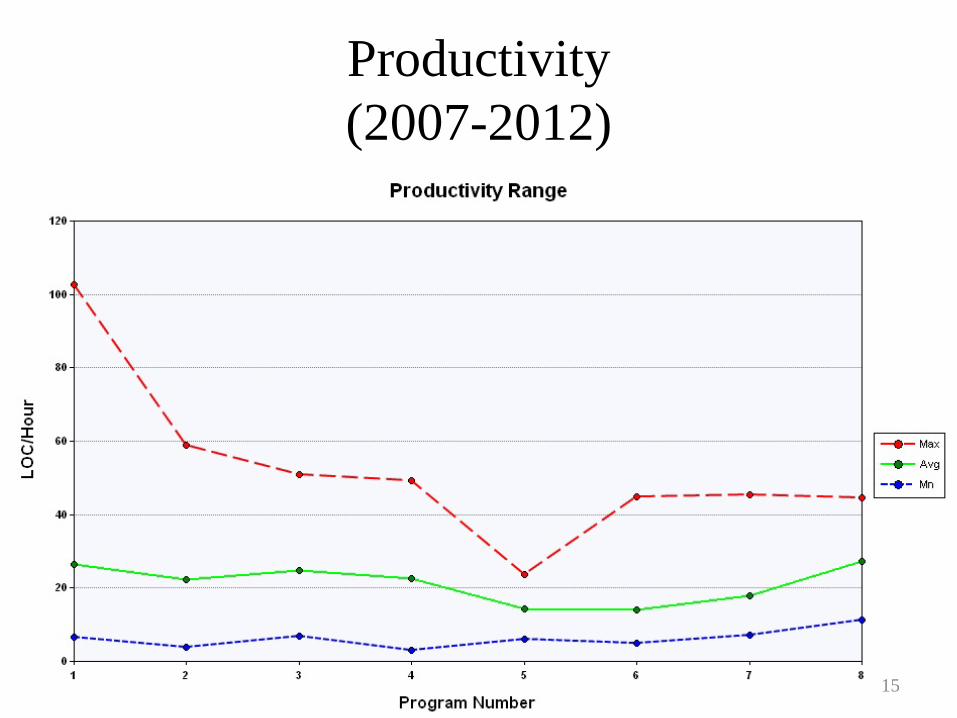
• Productivity – Nearly equal before and after the courses – May be improved after the courses
• Course completion ratio – PSP for Engineers –Planning: 100% since 2010 – PSP for Engineers –Quality: <= 25%
17
Student TSPi Teams and TSPi Course Improvement
18
TSPi Process Structure Launch
Strategy
Planning
Requirement
Design
Implementation
Integration and System Testing
Postmortem
Next cycle
• Simplified process for education
• One phase in a week • 2 or 3 cycles expected • Needs statement given
in the text book
19
Results of Student Teams in 2011
• Project overview – Two teams of 4 members – All team members completed PSP-I at least – Development of “change counter” system
• Quality – One team has no defects in system test – But, test cases might not be enough (41.7LOC/test case)
• Schedule – Schedules of both teams delayed a lot – One team could not finish cycle 1 – The other team completed only cycle 1 (delayed double) 20
① REQ
② DES
③ IMP ②
③
21
①
Cumulative EV of Team-J in 2011
3. Weekly meeting not used for project tracking because coaching is out of TSPi scope.
4. Long time was wasted on understanding out-of-dated TSPi tool
1. No experience with SRS and STP caused reworking.
2. Defects found in compile and unit test indicated re-design.
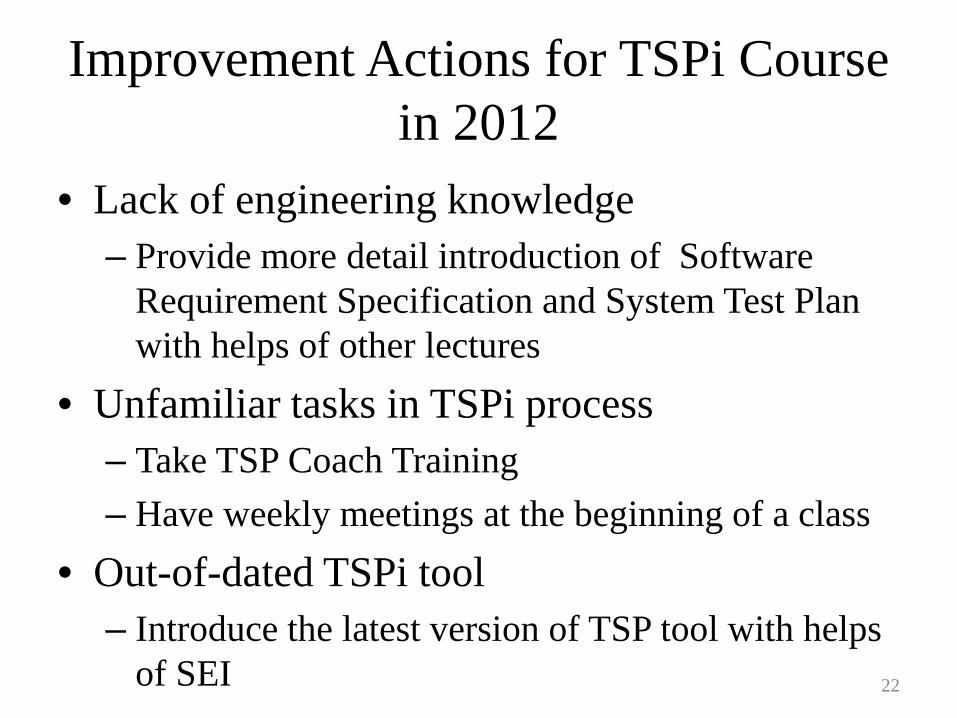
Improvement Actions for TSPi Course in 2012
• Lack of engineering knowledge – Provide more detail introduction of Software
Requirement Specification and System Test Plan with helps of other lectures
• Unfamiliar tasks in TSPi process – Take TSP Coach Training – Have weekly meetings at the beginning of a class
• Out-of-dated TSPi tool – Introduce the latest version of TSP tool with helps
of SEI
22
Remarkable Results of Student Teams in 2012
• Project overview – Two teams of 6 members – All team members completed PSP-I at least – Development of “change counter” system
• Quality – No defect, and 1 defect in system test in clycle 1 – No defects in system test in cycle 2
• Schedule – Delayed 2 and 4 weeks in cycle 1 – Finished on time in cycle 2
23
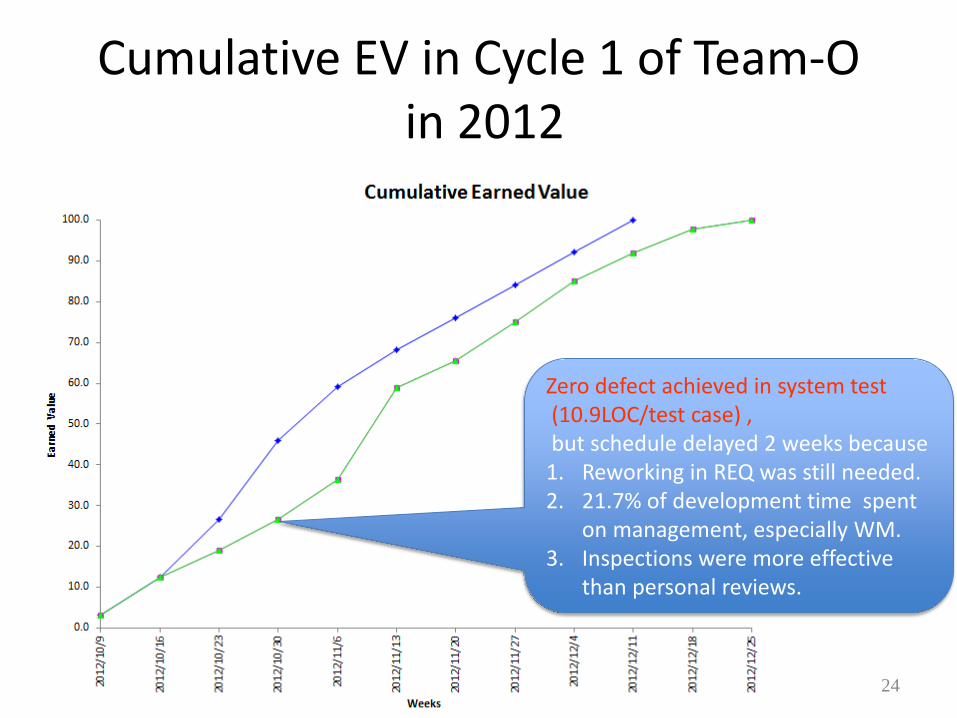
Cumulative EV in Cycle 1 of Team-O in 2012
Zero defect achieved in system test (10.9LOC/test case) , but schedule delayed 2 weeks because 1. Reworking in REQ was still needed. 2. 21.7% of development time spent
on management, especially WM. 3. Inspections were more effective
than personal reviews.
24
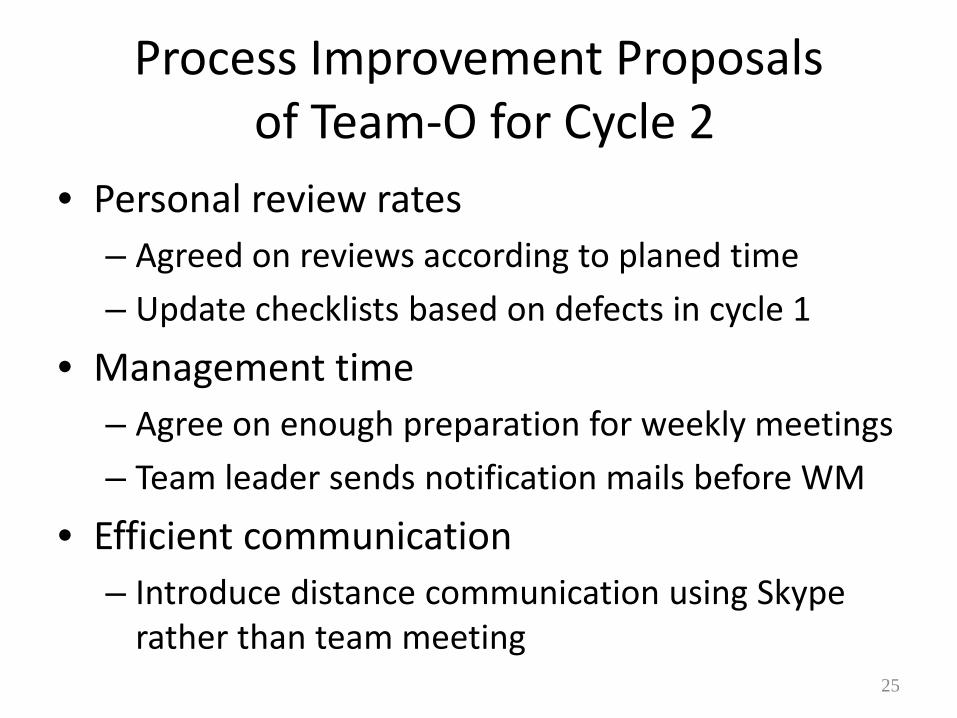
Process Improvement Proposals of Team-O for Cycle 2
• Personal review rates – Agreed on reviews according to planed time – Update checklists based on defects in cycle 1
• Management time – Agree on enough preparation for weekly meetings – Team leader sends notification mails before WM
• Efficient communication – Introduce distance communication using Skype
rather than team meeting 25
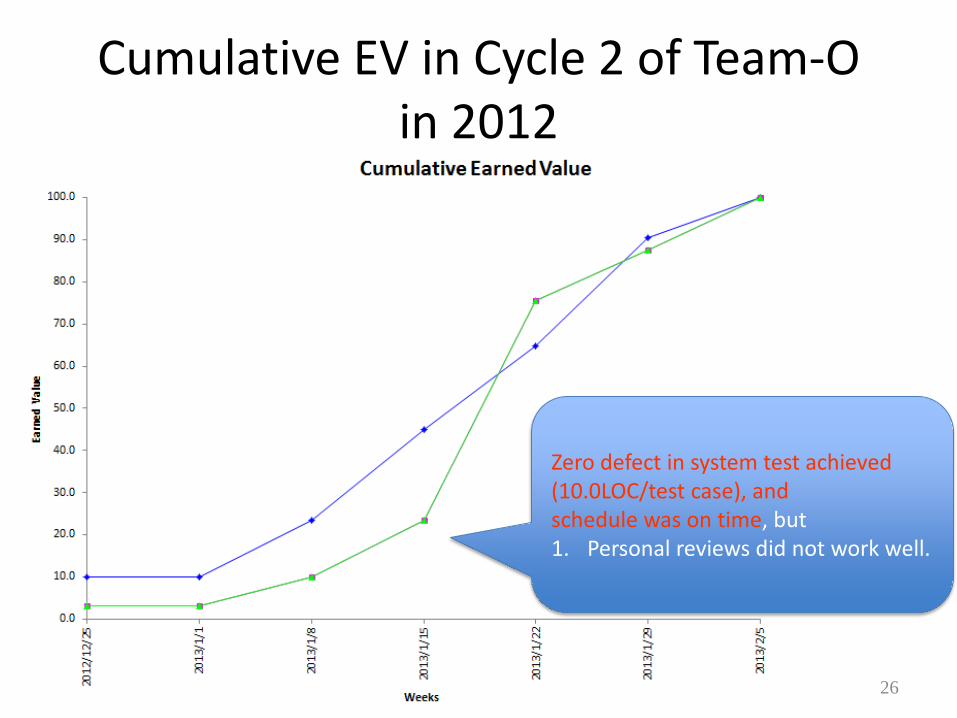
Cumulative EV in Cycle 2 of Team-O in 2012
26
Zero defect in system test achieved (10.0LOC/test case), and schedule was on time, but 1. Personal reviews did not work well.
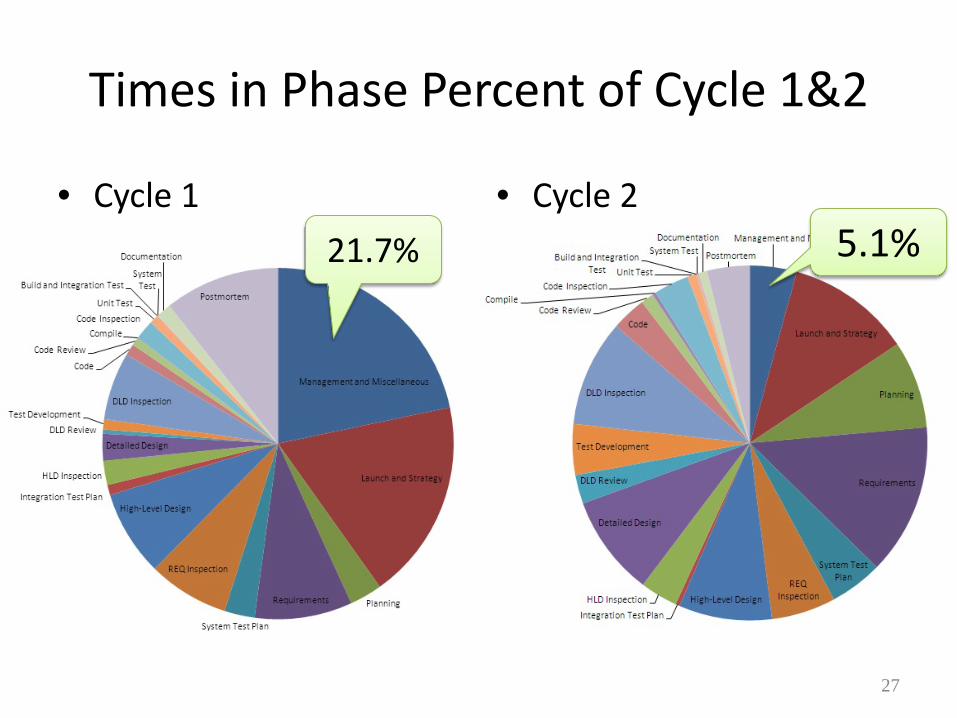
Times in Phase Percent of Cycle 1&2
• Cycle 1 • Cycle 2 21.7% 5.1%
27
Phase Yields of Cycle 1 & 2
• Cycle 1 – Reviews did not work
well, but instead most of defects removed by inspections
• Cycle 2 – DLD Reviews still did not
work well
Zero defects in both system tests. 28
Quality Profiles of Cycle 1 & 2
• Cycle 1 – PQI = 0.314782
• Cycle 2 – PQI = 0.422543
29
Team Goals Status in Cycle 2
1. High quality product – Defects removed before compile: 93.5% > 80% – Defects removed in system test: 0 defect < 0 defect
2. Productive and well-managed project – Size estimation error: 36.7% < 20% – Time estimation error: 17% < 20%
3. Finishing on time – Schedule delay:0 week < 2weeks
30
Yield and Defect Density of PSP and TSPi
0
10
20
30
40
50
60
70
80
90
100
5A 6A 7A 8A Cycle1 Cycle2
Yield
Phase Yield(DLDR) Phase Yield(CR) Process Yield
0
10
20
30
40
50
60
70
80
90
100
1A 2A 3A 4A 5A 6A 7A 8A Cycle1 Cycle2
Defect Density
Compile UT
31
TSPi is an Effective Companion to PSP for Learning Software Process
• Effective for understanding the fundamentals of software development process in a team – Member roles clarify things to do for a team
• Experience with successful project – Understand essentials to succeed even if failed
• Opportunity of understanding why PSP is so important to learn – Discipline, process, planning, quality, … – Some unfinished students took PSP after TSPi again
32
Enabling TSPi to be Practical for Creating High Performance Student Teams
• Providing supplementary software engineering knowledge – Software Requirement Specification, System Test Plan
• Coaching teams in all TSPi processes – Preventing misunderstanding of TSPi processes – Resolving technical and motivational problems
• Establishment of personal reviews in PSP course – Completion of PSP 2.0 or later is strongly encouraged
33
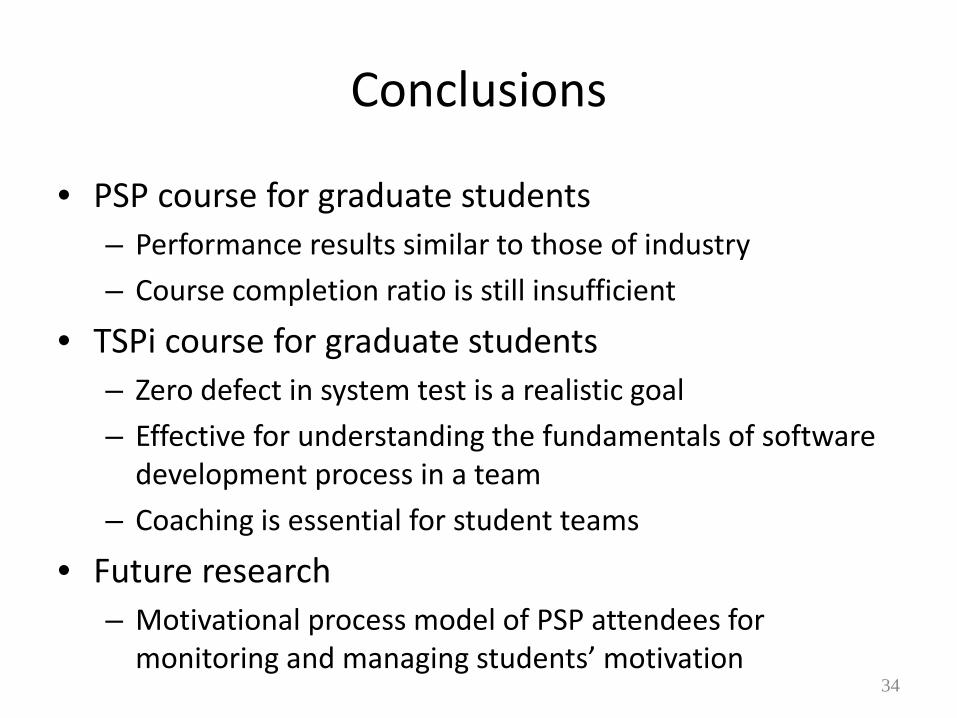
Conclusions
• PSP course for graduate students – Performance results similar to those of industry – Course completion ratio is still insufficient
• TSPi course for graduate students – Zero defect in system test is a realistic goal – Effective for understanding the fundamentals of software
development process in a team – Coaching is essential for student teams
• Future research – Motivational process model of PSP attendees for
monitoring and managing students’ motivation
34
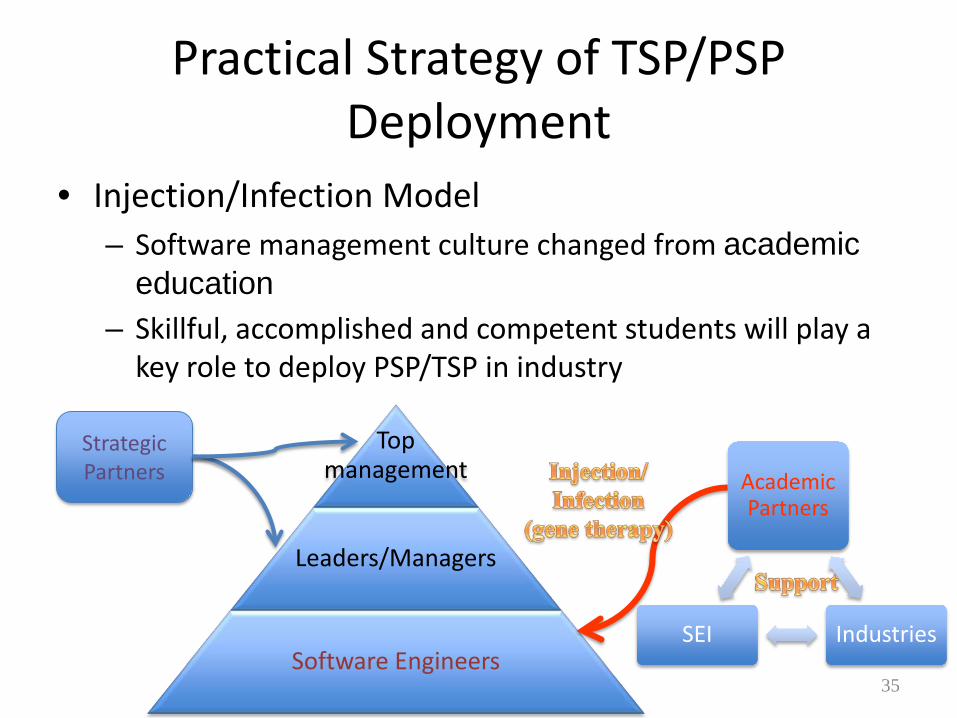
Practical Strategy of TSP/PSP Deployment
• Injection/Infection Model – Software management culture changed from academic
education – Skillful, accomplished and competent students will play a
key role to deploy PSP/TSP in industry
Top management
Leaders/Managers
Software Engineers
Strategic Partners Academic
Partners
Industries SEI
35
Thank you for your continuous strong support
6.64
12.92
23.00
31.86
42.93
53.01
61.87
70.73
79.34
84.50
92.62
100.00
0.00
6.64
12.92
21.53 21.53
36.89
44.78
52.89
59.65
67.54 72.28
72.77
81.74
91.89
0.00
6.64
12.92
21.53 21.53 23.00 24.69 26.04
44.78 46.13
67.54
70.92
70.92
77.68 77.68
81.07
0.00
10.00
20.00
30.00
40.00
50.00
60.00
70.00
80.00
90.00
100.00
Cum. PV
Cum. EV
Replaned PV
Replaned EV
After the TSPi Course: Development of Transferred Patient Support System