226
Copyright © 2015 The eVSM Group, All Rights Reserved Improving Mixed Model Value Streams

Copyright © 2015 The eVSM Group, All Rights Reserved
Improving Mixed Model
Value Streams

Copyright © 2015 The eVSM Group, All Rights Reserved

Copyright © 2015 The eVSM Group, All Rights Reserved
Lean, VSM, & eVSM 3
Working with Quick Stencils in eVSM v8 20
Plant Level Mapping 23
Discrete Parts VSM Terms 30
ACME Case Study – Plant 36
Quick Manufacturing Tutorial 49
Mixed Model Environment 125
Mixed Model Slides 126
Hand Exercises 161
ACME Mixed Model Case Study 181
ACME Case Study – Plant 182
eVSM Wizards 187
Spaghetti Wizard Tutorial 189
Standard Work Wizard Tutorial 205

Copyright © 2015 The eVSM Group, All Rights Reserved 2

Copyright © 2015 The eVSM Group, All Rights Reserved
Lean, VSM, & eVSM
3Lean VSM & eVSM

Copyright © 2015 The eVSM Group, All Rights Reserved
Cycle Time / Takt Time Chart
Se
c/It
em
0
1
2
3
4
5
6
7
8
A 040 A 060 A 080
Cycle Time Per Unit
Activity Takt Time
14
Day
Hr
5
Wk
Day
all
Customer
Customer Demand
ItemDay
7000
A 0101
ATLAS Warehouse
Activity Lead Time
Day0
A 020
Control
Activity
1
Blanks
Day1. 07
Inventory Item7500
A 030
1
Mold Handles
Min0. 47
Qty Per Cycle Item5
Cycle Time Sec28
1
A 040
1
Molded Blanks
Day0. 55
Inventory Item3850
A 050
1
Sharpen
Min0. 75
Qty Per Cycle Item5
Cycle Time Sec45
1
A 060
1
Drilled Blanks
Day0. 44
Inventory Item3100
A 070
1
Assemble
Min1
Qty Per Cycle Item10
Cycle Time Sec60
2
A 080
1
Scissors
Inventory Item9000
A 090
Activity TimeHrDay
10 Stations Stn2
Daily Order Weekly Order
1
Day0. 44
Time Summary
Takt TimeMinItem
0. 12
Total Value Added
Min2. 22
Lead Time Day2. 07
Value Added Percent
%0. 13
Z 010
Lead Time Summary
Day
0 0.2 0. 4 0. 6 0. 8 1 1. 2 1. 4 1. 6 1. 8 2 2.2
A 030
Blanks
A 050
Molded Blanks
A 070
Drilled Blanks
2. 06
Non Value Added
Legend
Value Added
U - shape Layout for Assembly Cell
Replace D 4 Drilling Station
Milling Inventory Area 5 S
New lighting in Hanger 501
Replace D 7 Drilling Station
Group Value Stream Mapping Event
Wall MapCapture
Analyze
Improve
Prioritize
eVSM / Supporting Process Improvement
5
4
3
2
1
1 2 3 4 5
Ease Of Implementation
Imp
act O
n V
alu
e
Kaizen Impact Matrix
001
002
004
003
4

Copyright © 2015 The eVSM Group, All Rights Reserved
Brown Paper & Post-Its
Best Practice
Maps
eVSM
Collaborative
Tools
Visio Excel
Group
Interaction
Diagramming Data
VSM Icons for Visio
Excel Integration
Application Specific Stencils
Company specificBest Practice Maps
Capture wall
maps
Use maps for
calculations
Standardized
mapping &
analysis
What is eVSM?
Applying the
standard
5Lean VSM & eVSM

Copyright © 2015 The eVSM Group, All Rights Reserved
eVSM Architecture
Drag and Drop Core
Visio + Excel Integration (32 bit + 64 bit)
Quick Stencils Wizards
Multi-path Maps
Kaizen Risk
Sketcher (wall maps)
Multi-level Maps
Ente
rpri
se
Pro
cess
ing
Tran
sact
ion
al
Hea
lth
care
Mu
lti-
stat
ion
Faci
lity
tim
e
Kaizen Report
Process Based Toolbar
EPEI
Man
ufa
ctu
rin
g
Kan
ban
Kaizen Impact
Production Units
Data Variation
Standard Variables
Windows 7 + 8 Support (32 bit + 64 bit)
Built-in Equations
What-If Studies
Built-in Charts
6

Copyright © 2015 The eVSM Group, All Rights Reserved
C/TC/OLT
Standard Variables
Design Macro Shapes
F(x)Built-inEquations
Built-in Charts
Quick Manufacturing
Lead Time
Resources
Capacity
CostOEE
-Shared Resource
-Resource Utilization
-Resource Bottlenecks
-Resource Allocation
---------------------------------
Resource Balance Chart
-Inventory Holding Cost
-Activity Based Cost
-Material Cost
-Resource Cost
-------------------------------
Cumulative Cost Chart
-VA & NVA Time
-Queues and Delays
-Process Lead Time
---------------------------
Lead Time Chart
-Cycle Time
-Multiple Stations
-Qty Per Cycle
-Takt Time
-Utilization
-Transfer Lot Size
---------------------------------------
Cycle Time / Takt Time Chart
-Scrap
-Changeover
-Setup
-Rework
-Performance
-Availability
--------------------------------
Effective Capacity Chart
Multi-Path Maps
Space Utilization
Energy Efficiency
-Map Linkage
-Side Calculations
Map Hierarchy
-Critical Path
Manufacturing Concepts
The technical concepts addressed by the Quick Manufacturing stencil are shown
below.
7Lean VSM & eVSM

Copyright © 2015 The eVSM Group, All Rights Reserved
What is Lean?Lean is a set of concepts, principles, and tools used to create
and deliver the most value from the customer’s perspective
while consuming the fewest resources.
...Lean Enterprise Institute
· Value is defined from the Customer’s perspective
· Map the Value Stream
· Create flow & eliminate waste
· Create pull where flow is difficult
· Seek perfection
Lean Principles
8

Copyright © 2015 The eVSM Group, All Rights Reserved
The Lean Process
Current State
Future State
Implementation Plan
Improvements Implementation
...Learning to See, LEI
Lean Means...· Lower cost
· Less inventory
· Less space
· Shorter lead-time
· Fewer people
9Lean VSM & eVSM

Copyright © 2015 The eVSM Group, All Rights Reserved
What is a Value Stream Map?A simple tool that visually represents what’s going on in a
value stream
What is a Value Stream?
All steps, both Value Added and Non Value Added, required to
complete a product or service from beginning to end
10

Copyright © 2015 The eVSM Group, All Rights Reserved
What is a Value Stream Map?ACME Scissors Manufacturing
Current State
Z020
Customer
7000Customer Daily Demand
Item
1
14
Day
Hr
60
Hr
Min
60
Min
Sec
1Activity Lead Time
Day
A010
ATLAS Warehouse
1
1.07 Day
Type
7500Inventory Item
A030 1
1Time
BetweenDay
A020 1
0.80 Min
1Associates Staff
10Qty Per Cycle Item
0.8Cycle Time Min
Mold Handles
A050 1
0.55 Day
Blanks
3850Inventory Item
A060 1
2.20 Min
1Associates Staff
10Qty Per Cycle Item
2.2Cycle Time Min
Sharpen
A070 1
0.39 Day
Sharp Blanks
2700Inventory Item
A080 1
0.50 Min
1Associates Staff
10Qty Per Cycle Item
0.5Cycle Time Min
A090 1
0.44 Day
Drilled Blanks
3100Inventory Item
A100 1
1.00 Min
1Associates Staff
10Qty Per Cycle Item
1Cycle Time Min
Assemble
A110 1
1.29 Day
Scissors
9000Inventory Item
A120 1
MRP
Production
Control
Forecast 30 Days
Weekly Order
Daily
Daily
Weekly Schedule
Z010
Time Summary 1
0.12Takt Time Min
4.50Total Value
AddedMin
6.74Lead Time Day
0.08Value Added
Percent%
1
Z140
Time Summary 2
0.12Takt Time Min
6.00Total Value
AddedMin
2.64Lead Time Day
0.27Value Added
Percent%
2
1Time
BetweenDay
A150 1
2
2Stations Stn8Activity Time
Per Day Hr 9000Activity Daily
DemandItem
Drill
2
2
2
Cycle Time / Takt Time Chart
Min
0
0.02
0.04
0.06
0.08
0.1
0.12
A050
Mold Han
dles
A070
Sharpe
n
A090
Drill
A110
Assem
ble
A160
Cardb
oard
Box
es
Cycle Time Per Item
Activity Takt Time
VSM – Learning to See
11Lean VSM & eVSM
Copyright © 2015 The eVSM Group, All Rights Reserved
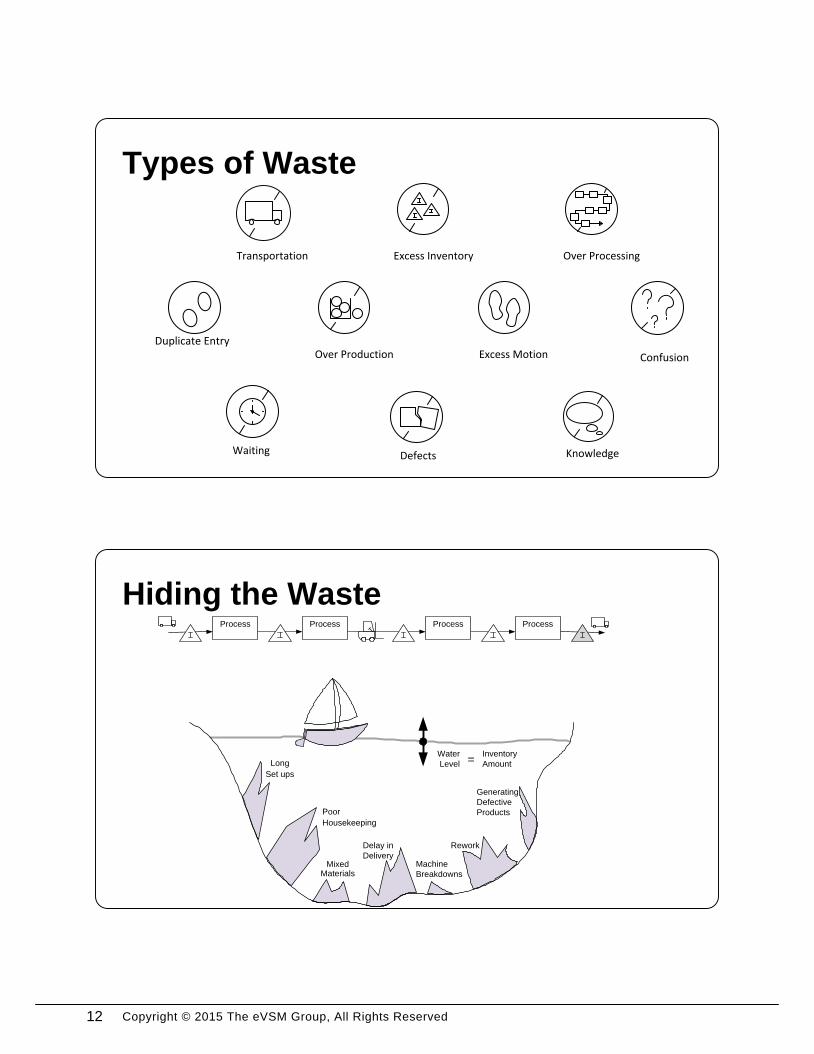
Types of Waste
Hiding the Waste
Generating
Defective
Products
Machine
Breakdowns
ReworkDelay in
DeliveryMixed
Materials
Poor
Housekeeping
Long
Set ups
Process Process Process Process
=Water
Level
Inventory
Amount
Excess Inventory
Excess MotionOver Production
Transportation
Waiting
Over Processing
Confusion
Duplicate Entry
Defects Knowledge
12

Copyright © 2015 The eVSM Group, All Rights Reserved
What is a LEAN Value Stream?· Define value from the customer’s perspective
· Map the value stream
· Create flow and eliminate waste
· Create pull where flow is difficult
· Seek perfection
· Minimize the LEAD TIME
· Adequate & Efficient CAPACITY
· Minimum COST for QUALITY
Lead Time, Capacity, Cost
Excess
Inventory
Waiting
Defects
Over
ProductionTransportation
Excess
Motion
Over
Processing
Capacity
Lead Time
Cost
13Lean VSM & eVSM

Copyright © 2015 The eVSM Group, All Rights Reserved
What is eVSM?· Software Tool:
-VSM, A3 Reports, Spaghetti Reports, Communication
Circles
-Analyze VSM Data
-Manage Lean Transformation
· Built on Visio and Excel
· Based on Publications from Lean Enterprise Institute
Lean WorkbooksProcess Level
Plant Level
Office Services
Multiple Plants
Across
Companies
Materials
14

Copyright © 2015 The eVSM Group, All Rights Reserved
eVSM v7 Platform
Wall Maps/Digital Pictures/eVSMValue Stream Mapping is a Paper & Pencil tool
15Lean VSM & eVSM

Copyright © 2015 The eVSM Group, All Rights Reserved
· Very fast way to map
· Drag, Drop & Enter Values
· Automated Calculation & Charts
What is a Quick Stencil?
Total Time=VA + NVA
=(5+1+2+5) + (10+45+15)
=13+70
=83 Min’s
Cycle Time / Takt Time Chart
Sec/I
tem
0
1
2
3
4
5
6
7
8
A040
Mol
d Han
dles
A060
Sha
rpen
A080
Ass
embl
e
Cycle Time Per Unit
Legend
Changeover Loss
Activity Takt Time
Cycle Time / Takt Time Chart
Sec/Ite
m
0
1
2
3
4
5
6
7
8
A040
Mold
Han
dles
A060
Sha
rpen
A080
Ass
emble
Cycle Time Per
UnitLegend
Scrap Loss
DownStr Loss
Activity Takt Time
Visualizing Capacity
16

Copyright © 2015 The eVSM Group, All Rights Reserved
Capacity LossesCycle Time / Takt Time Chart
Sec/Ite
m
0
1
2
3
4
5
6
7
8
A040
Mold
Han
dles
A060
Sharp
en
A080
Ass
emble
Cycle Time Per Unit
Legend
Changeover Loss
Activity Takt Time
Cycle Time / Takt Time Chart
Sec/Ite
m
0
1
2
3
4
5
6
7
8
A040
Mold
Han
dles
A060
Sha
rpen
A080
Ass
emble
Cycle Time Per Unit
Legend
Scrap Loss
DownStr Loss
Activity Takt Time
Visualizing Lead Time
17Lean VSM & eVSM

Copyright © 2015 The eVSM Group, All Rights Reserved
Visualizing Cost
Kaizen – Ideas in Context
18

Copyright © 2015 The eVSM Group, All Rights Reserved
Kaizen Impact Matrix
Bottleneck process. Above
takt time.
1
Badly unbalanced line.
Single cell option for sharpen and
drill.
Supermarket and pull system
Quality issues on goods reaching
customer
2
3
4
5
Improvement Cycle
Cycle Time / Takt Time Chart
Sec/Ite
m
0
1
2
3
4
5
6
7
8
A040 A060 A080
Cycle Time Per Unit
Activity Takt Time
2
01
81
61
41
21
0
8
6
4
2
2 4 6 81
0
1
2
1
4
1
6
1
8
2
0
IV
I
II
III
Difficulty Of Implementation
Imp
act O
n V
alu
e
Kaizen Impact Matrix
1
2
3
4
14
Day
Hr
5
Wk
Day
all
Customer
Customer Demand
ItemDay
7000
A0101
ATLAS Warehouse
Activity Lead Time
Day0
A020
Control
Activity
1
Blanks
Day1.07
Inventory Item7500
A030
1
Mold Handles
Min0.47
Qty Per Cycle Item5
Cycle Time Sec28
1
A040
1
Molded Blanks
Day0.55
Inventory Item3850
A050
1
Sharpen
Min0.75
Qty Per Cycle Item5
Cycle Time Sec45
1
A060
1
Drilled Blanks
Day0.44
Inventory Item3100
A070
1
Assemble
Min1
Qty Per Cycle Item10
Cycle Time Sec60
2
A080
1
Scissors
Inventory Item9000
A090
Activity TimeHr
Day10 Stations Stn2
Daily Order Weekly Order
1
Day0.44
Time Summary
Takt TimeMinItem
0.12
Total Value Added
Min2.22
Lead Time Day2.07
Value Added Percent
%0.13
Z010
Lead Time Summary
Day
0 0.2 0.4 0.6 0.8 1 1.2 1.4 1.6 1.8 2 2.2
A030Blanks
A050Molded Blanks
A070Drilled Blanks
2.06
Non Value Added
Legend
Value Added
U-shape Layout for Assembly Cell
Replace D4 Drilling Station
Milling Inventory Area 5S
New lighting in Hanger 501
Replace D7 Drilling Station
Group Value Stream Mapping Event
Select Product Family
Wall SketchCapture Map
Analyze and Visualize
Brainstorm
Improvements
Prioritize
ImprovementsCreate Future
State
Plan & Implement
Improvements
Sustain improvements
Future State becomes Current State
Improvement cycle continues
5
4
3
2
1
1 2 3 4 5
Ease Of Implementation
Imp
act O
n V
alu
e
Kaizen Impact Matrix
001
002
003
004
005
19Lean VSM & eVSM

Copyright © 2015 The eVSM Group, All Rights Reserved
Working with Quick Stencils in eVSM v8
Quick Stencil
Add-ons must
be glued under
existing data
shapes
Drag out the red
icons FIRST
Use the Green icons
to draw the Flow
Yellow icons
represent optional
“Add-on” calculations
Glue
3
4
5
2
eVSM Toolbar
Access each Quick Stencil using the
Open button and a corresponding
Sketch Stencil for initial map capture
and layout will open as well
1
Blue values get
calculated
automatically
Summary
calculations
Automatic
Charts
7
8
6
Process
1
Qty Per Cycle Item1
Cycle Time Minx.xx
1
A0070
MinAuto
Activity TimeHr
Dayx.xx
20

Copyright © 2015 The eVSM Group, All Rights Reserved
Main Stencil
For variable name help, select
any variable and use the right-
mouse button menu “Name Help”
for a description of the variable.
9
Process
1
Qty Per Cycle Item1
Cycle Time Minx.xx
1
A0080
MinAuto
21Lean VSM & eVSM

Copyright © 2015 The eVSM Group, All Rights Reserved
Quick Stencil – Try This:
1. Go to a new page and use the “Open” command to access the Quick Mfg stencil.
2. Which icons from the stencil must be put on the map first?
3. How do you get quick help on the icons in the stencil?
4. Drag out an Activity Center from the stencil. How do you get a quick description of the “Qty
Per Cycle” variable in the center?
5. What is the meaning of the blue “Auto” value in the Activity Center?
22

Copyright © 2015 The eVSM Group, All Rights Reserved
Plant Level Mapping
23Plant Level Mapping

Copyright © 2015 The eVSM Group, All Rights Reserved
Activity Sequence
Activity Available Time
· Available Time = Planned Production Time after breaks
· Plant Available Time = Default Available Time for all activities
· Activity Time: Overrides the Plant Available Time at an activity
· Facility Time Wizard: Allows off-page calculation of Available
Time for different shift patterns
· Sequence arrows to explicitly establish upstream/downstream
connectivity
· Rolling scrap calculation based on connectivity
· Cumulative Cost calculation based on connectivity
· Value stream path generation for multi-lane maps based on
connectivity
24

Copyright © 2015 The eVSM Group, All Rights Reserved
Resource Modeling
· Resources (Manpower) are now modeled explicitly within the
value stream map.
· Resources can be connected to multiple activities.
· Resource VA and NVA times can be captured to help identify
improvement areas.
· Resource cost handling.
· Bottleneck resources are identified (Resource Utilization).
· Resource usage (balancing) chart.
OEE – Overall Equipment
Effectiveness
· Availability
-Changeover, unplanned downtime, setup
· Quality
-Scrap (and rolling scrap)
· Performance
-Machine, material, or operator inefficiency
25Plant Level Mapping

Copyright © 2015 The eVSM Group, All Rights Reserved
Customer Demand
Carrying Cost
· Based on Inventory Cost
Calculated using Activity Based Costing
Carry Cost Factors
-Cost of Capital
-Damage
-Obsolescence
-Shrinkage
-Insurance
· Multiple Customers
· Path-based demand
· Demand override (Activity Demand or Demand %)
-Production for other value streams
-Product family routing
-Rework situation
26

Copyright © 2015 The eVSM Group, All Rights Reserved
Kaizen Report, Impact & Risk
· Kaizen burst for improvement opportunities
· Association of bursts with activities
· Improvement prioritization via impact, difficulty, and risk
· Charting with impact and risk matrices
· Kaizen reporting to spreadsheet
27Plant Level Mapping

Copyright © 2015 The eVSM Group, All Rights Reserved
Capacity Modeling
Capacity analysis in Quick Mfg requires consideration of both activity capacity and resource
capacity. Let’s see it works.
Activity Capacity
So let’s say that an activity has:
· Cycle Time = 5 mins
· Qty Per Cycle = 2 Item
· Activity Time = 10 Hrs/Day
· OEE = 80%
· Number of Stations = 2
Then Cycle Time Per Item
Min/Item 25.122
5
Stations ofNumber CyclePer Qty
Time Cycle
OEEItemPer Time Cycle
TimeActivity CapacityActivity
Item/Day 38418.025.1
6010
This capacity calculation assumes that a station has all of the resources it needs over its activity
time period to process items within the cycle time stated. If this is a concern, then explicit
resources can be modeled and a resource capacity calculation can be done in addition.
28

Copyright © 2015 The eVSM Group, All Rights Reserved
Resource Capacity
Let’s say that for a particular resource used by an activity, (could be a person or a machine) it
has the following characteristics:
· Resource Qty = 2
· Resource Time = 8 Hrs/Day
· Resource PT (Resource Process Time) = 10 Min/Item
then,
PT Resource
Qty Resource Time ResourceCapacity Resource
10
2608
Item/Day 96
So in this example, while the Activity Capacity (independent of Resource consideration) is 384
Item/Day, the resource would actually limit the capacity to 96 Item/Day.
The Quick Mfg stencil reports both the Activity Capacity and the Resource Capacity associated
with each resource used by the activity. It also handles the issue of shared resources between
activities.
29Plant Level Mapping

Copyright © 2015 The eVSM Group, All Rights Reserved
For a full glossary of lean terminology, we recommend the “Lean Lexicon”.
The terminology described here is specific to discrete parts and assemblies and we propose that
you use it to “standardize” your variables on these types of maps.
Acronyms
· OEE – Overall Equipment Effectiveness
· NVA – Non-Value Added
· VA – Value-Added
· VSM – Value Stream Map
· WACT – Weighted Average Cycle Time
· WIP – Work In Process
Discrete Parts VSM Terms
30

Copyright © 2015 The eVSM Group, All Rights Reserved
· Takt Time: Time interval of planned production time at which the value stream needs to
produce an item to meet demand.
· Lead Time: The time it takes for an item to move between two designated points in the process.
· OEE Rate =
· OEE Availability Rate =
· OEE Quality Rate =
· OEE Performance Rate =
Plant Operating Time
Planned Production TimePlanned
Shutdown
Operating TimeLoss
Times
Net Operating TimePerformance
Loss
Fully Productive TimeQuality
Loss
Lunch, breaks,
planned
maintenance
Loss from unplanned
downtime, setups,
changeovers
Loss from machine wear, operator
inefficiency, substandard material
Product that does not meet quality
standard
Time the facility is open and available for equipment operation.
TimeproductionPlanned
timeOperating
RateePerformancRateQualityRatetyAvailabili
TimeOperatingNet
timeproductiveFully
TimeOperating
TimeOperatingNet
Facility Time Related Terms
31Plant Level Mapping

Copyright © 2015 The eVSM Group, All Rights Reserved
Station 1
Cycle Time
Station 2
Qty Per
Cycle
· Stations: Number of identical stations of an activity.
Each additional station reduces the Cycle Time Per
Unit.
· Cycle Time: The time interval between a set of
items exiting an activity and the next set.
· Qty Per Cycle: The number of items produced
during one cycle at one station.
· Cycle Time Per Unit =
· Activity Time: Planned Production Time specific to an activity.
· Activity Takt Time: Takt Time specific to an activity.
· Value-Added Time: Time of those work elements that transform the product in a way that
adds value for the customer.
· Non-Value Added Time: Time of those work elements that adds Cost but no value to the
product or service as seen by the customer.
· Uptime: The percent of Activity Time that is actually available for production work after
unplanned downtime.
· Time Per Changeover: Time required to switch a station from producing one type of item to
another.
· Process Lead Time: Time from when an item enter an activity to when it leaves the activity.
Activity Time Related Terms
StationsCyclePerQty
TimeCycle
Process Lead Time
32
Copyright © 2015 The eVSM Group, All Rights Reserved
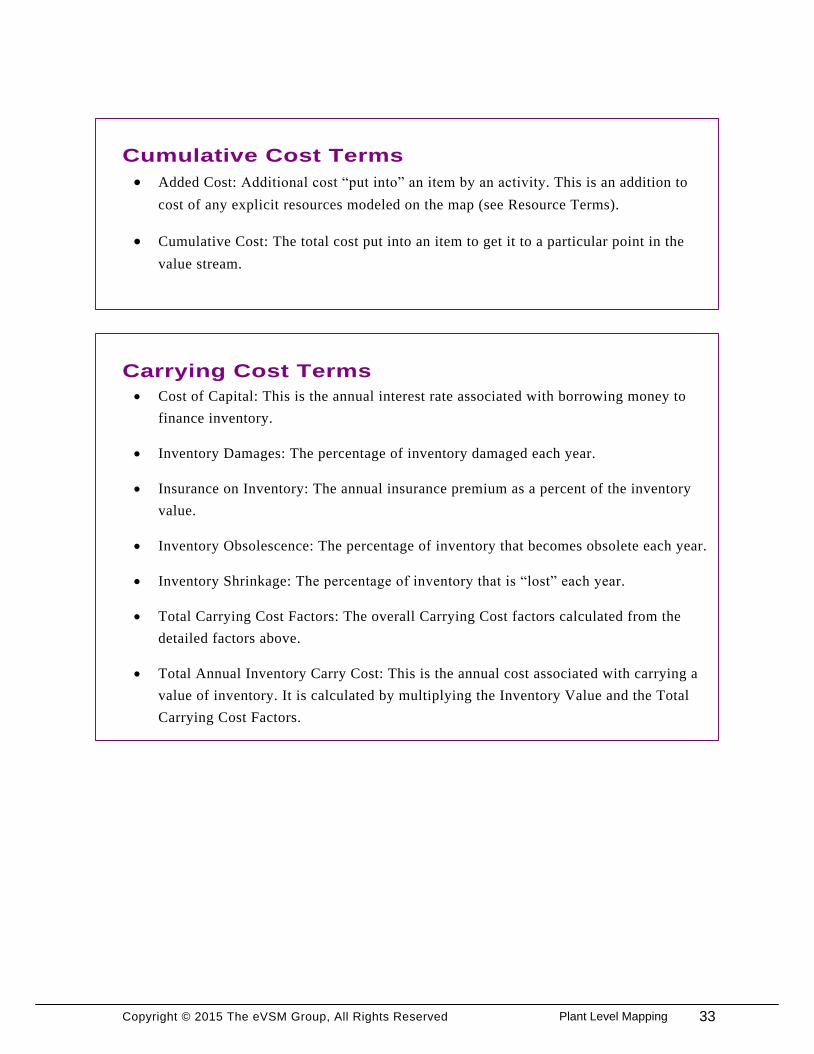
· Added Cost: Additional cost “put into” an item by an activity. This is an addition to
cost of any explicit resources modeled on the map (see Resource Terms).
· Cumulative Cost: The total cost put into an item to get it to a particular point in the
value stream.
Carrying Cost Terms
· Cost of Capital: This is the annual interest rate associated with borrowing money to
finance inventory.
· Inventory Damages: The percentage of inventory damaged each year.
· Insurance on Inventory: The annual insurance premium as a percent of the inventory
value.
· Inventory Obsolescence: The percentage of inventory that becomes obsolete each year.
· Inventory Shrinkage: The percentage of inventory that is “lost” each year.
· Total Carrying Cost Factors: The overall Carrying Cost factors calculated from the
detailed factors above.
· Total Annual Inventory Carry Cost: This is the annual cost associated with carrying a
value of inventory. It is calculated by multiplying the Inventory Value and the Total
Carrying Cost Factors.
Cumulative Cost Terms
33Plant Level Mapping

Copyright © 2015 The eVSM Group, All Rights Reserved
Resource Terms
· Efficiency: Efficiency rating for a resource to allow for auxiliary activities (walking,
interruptions..)
· Effective Resource Time: Resource Time * Resource Qty * Efficiency
· NVA Utilization: Resource Time Used for Non Value Added Activity / Effective Resource
Time
· Resource Cost: Cost of this resource to process an item
· Resource NVA Cost: Resource cost for NVA activity per item
· Resource PT: Resource time to process an item
· Resource PT NVA: The NVA portion of the resource time to process an item
· Resource Quantity: Quantity of resource available
· Resource Query Cost: Resource cost to service queries in a time period
· Resource Rate: Cost rate for a resource
· Resource Time: Resource available time after subtracting planned breaks.
· Resource Usage: Total resource usage per period via this pipe
· Resource Usage NVA: The NVA portion of the Total resource usage per period via this pipe
· Resource Utilization: Total Time Spent / Effective Resource Time
· Resource VA Cost: Resource cost for VA activity per item
· Total Resource Cost: Cost per time period for this resource
· Total Time Spent: Total time used of this resource
· VA Utilization: Time Used for Value Added Activity / Effective Resource Time
34

Copyright © 2015 The eVSM Group, All Rights Reserved 35Plant Level Mapping

Copyright © 2015 The eVSM Group, All Rights Reserved
ACME Case Study – Plant
Background and Overview
ACME, founded in 1965, specializes in high-quality surgical instruments and has recently added
surgical, re-usable, double-action cutters to its catalog, retailing at $90 per set. Each set consists
of four cast pieces which are supplied by Tower Hills Foundry. At ACME, the castings are
machined, polished, and sent to the final assembly line. The metal for the springs is supplied by
Fornost Quality steelworks in steel rolls which are cut down into springs and assembled with the
castings. One casting set and one spring set makes one final Surgical Cutter. Finally, the finished
product is individually packaged for shipping.
Introduction
You will be using this case study to create a value stream map on the wall. With your group, read
through the information below then complete the exercises at the end.
The assembled cutters are sent to packaging where they are individually boxed and then stored
for shipping.
36
Copyright © 2015 The eVSM Group, All Rights Reserved
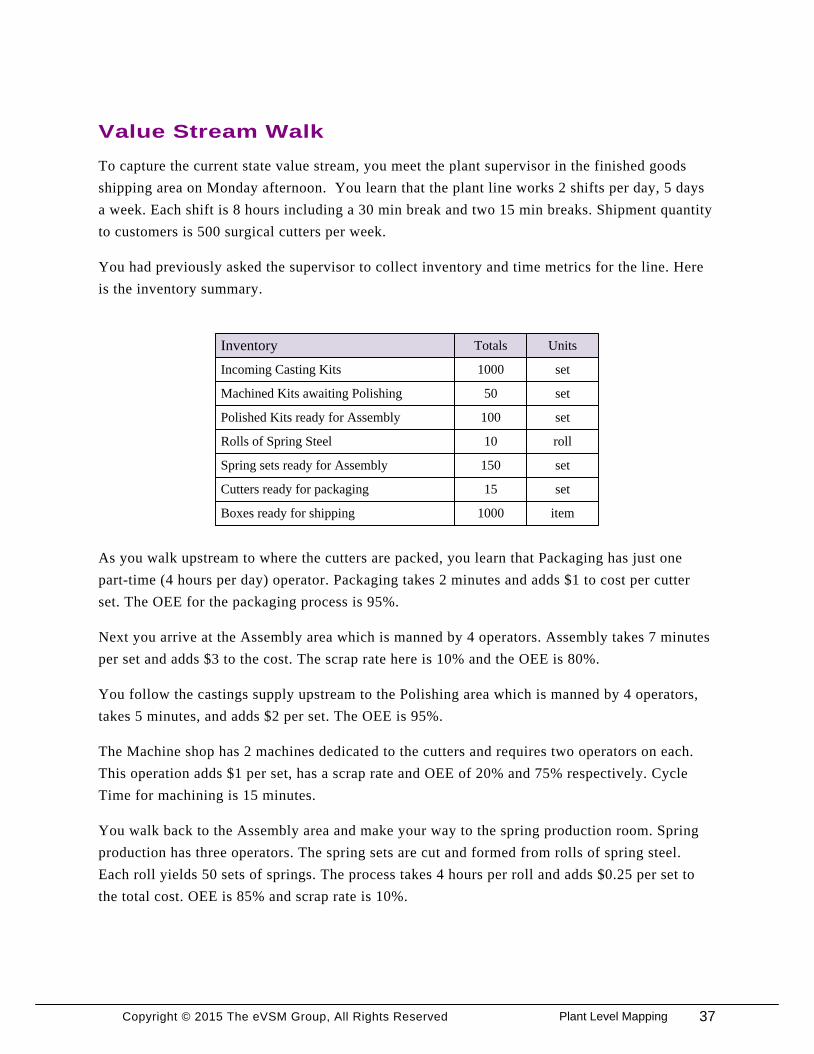
Value Stream Walk
Inventory
Incoming Casting Kits
Machined Kits awaiting Polishing
Polished Kits ready for Assembly
Rolls of Spring Steel
Spring sets ready for Assembly
1000
UnitsTotals
50
100
10
150
set
set
set
set
roll
Cutters ready for packaging
Boxes ready for shipping
15
1000 item
set
To capture the current state value stream, you meet the plant supervisor in the finished goods
shipping area on Monday afternoon. You learn that the plant line works 2 shifts per day, 5 days
a week. Each shift is 8 hours including a 30 min break and two 15 min breaks. Shipment quantity
to customers is 500 surgical cutters per week.
You had previously asked the supervisor to collect inventory and time metrics for the line. Here
is the inventory summary.
As you walk upstream to where the cutters are packed, you learn that Packaging has just one
part-time (4 hours per day) operator. Packaging takes 2 minutes and adds $1 to cost per cutter
set. The OEE for the packaging process is 95%.
Next you arrive at the Assembly area which is manned by 4 operators. Assembly takes 7 minutes
per set and adds $3 to the cost. The scrap rate here is 10% and the OEE is 80%.
You follow the castings supply upstream to the Polishing area which is manned by 4 operators,
takes 5 minutes, and adds $2 per set. The OEE is 95%.
The Machine shop has 2 machines dedicated to the cutters and requires two operators on each.
This operation adds $1 per set, has a scrap rate and OEE of 20% and 75% respectively. Cycle
Time for machining is 15 minutes.
You walk back to the Assembly area and make your way to the spring production room. Spring
production has three operators. The spring sets are cut and formed from rolls of spring steel.
Each roll yields 50 sets of springs. The process takes 4 hours per roll and adds $0.25 per set to
the total cost. OEE is 85% and scrap rate is 10%.
37Plant Level Mapping

Copyright © 2015 The eVSM Group, All Rights Reserved 38

Copyright © 2015 The eVSM Group, All Rights Reserved
Exercises
Part A
1. Draw a wall value stream map using the template cut outs for the product showing the
customer, inventories, and processes.
2. Show the data associated with the inventory, activities, and any costs.
Part C
1. Follow the step by step tutorial on the following pages to bring the wall map into eVSM and
create the map electronically.
Part B
1. Calculate how many days of inventory you have at each point.
2. Identify useful summary metrics for the map.
3. Identify what charts would be useful to visualize the value stream and mark these up.
39Plant Level Mapping

Copyright © 2015 The eVSM Group, All Rights Reserved 40

Copyright © 2015 The eVSM Group, All Rights Reserved
Quick Manufacturing Templates
41Plant Level Mapping

Copyright © 2015 The eVSM Group, All Rights Reserved 42

Copyright © 2015 The eVSM Group, All Rights Reserved
Qty Per Cycle Item
Cycle Time Min
Added Cost$
ItemOEE Input
Percent%
Stations Stn
Scrap Percent %
Activity TimeHr
Day
Plant Activity
Qty Per Cycle Item
Cycle Time Min
Added Cost$
ItemOEE Input
Percent%
Stations Stn
Scrap Percent %
Activity TimeHr
Day
Plant Activity
43Plant Level Mapping

Copyright © 2015 The eVSM Group, All Rights Reserved 44

Copyright © 2015 The eVSM Group, All Rights Reserved
Qty Per Cycle Item
Cycle Time Min
Added Cost$
ItemOEE Input
Percent%
Stations Stn
Scrap Percent %
Activity TimeHr
Day
Plant Activity
Qty Per Cycle Item
Cycle Time Min
Added Cost$
ItemOEE Input
Percent%
Stations Stn
Scrap Percent %
Activity TimeHr
Day
Plant Activity
45Plant Level Mapping

Copyright © 2015 The eVSM Group, All Rights Reserved 46

Copyright © 2015 The eVSM Group, All Rights Reserved 47Plant Level Mapping

Copyright © 2015 The eVSM Group, All Rights Reserved 48

Copyright © 2015 The eVSM Group, All Rights Reserved
This tutorial will guide you through the steps to draw the
following map using the Quick Manufacturing stencil.
Quick Manufacturing Tutorial
A0130
Customer
Customer Demand
SetWeek
500
Share % %100
Effective Demand
ItemWeek
500.00
A0040
Casting Sets
Inventory Set1500
Day15.00
Machine
A0050
2.00
Min15.00
Qty Per Cycle Set1
Cycle Time Min15
CapacityItemDay
75.04
Pre OEE Capacity
ItemDay
112.00
OEE Percent %75.00
A0060
Machined Sets
Inventory Set50
Day0.50
Polish
A0070
4.00
Min5.00
Qty Per Cycle Item1
Cycle Time Min5
CapacityItemDay
142.80
Pre OEE Capacity
ItemDay
168.00
OEE Percent %95.00
A0080
Polished Sets
Inventory Set100
Day1.00
Assemble
A0090
4.00
Min7.00
Qty Per Cycle Item1
Cycle Time Min7
CapacityItemDay
96.00
Pre OEE Capacity
ItemDay
120.00
OEE Percent %80.00
A0100
Cutters
Inventory Set15
Day0.15
Package
A0110
1.00
Min2.00
Qty Per Cycle Item1
Cycle Time Min2
CapacityItemDay
114.00
Pre OEE Capacity
ItemDay
120.00
OEE Percent %95.00
A0120
Boxes
Inventory Set1000
Day10.00
A0010
Spring Steel Rolls
Inventory Roll100
Day50.00
Machine and form
caliper springs
A0020
3.00
Min240.00
Qty Per Cycle Roll1
Cycle Time Hr4
CapacityItemDay
133.00
Pre OEE Capacity
ItemDay
175.00
OEE Percent %85.00
A0030
Springs
Inventory Set150
Day1.50
all
1
1
1
1
1
12
12
12
12
2
2
2
1
Time Summary
Z0010
Takt TimeMinItem
8.40
Total Value Added
Min29.00
Lead Time Day26.68
Value Added Percent
%0.13
Process Time Per Unit
MinItem
21.50
2
Time Summary
Z0150
Takt TimeMinItem
8.40
Total Value Added
Min249.00
Lead Time Day61.95
Value Added Percent
%0.48
Process Time Per Unit
MinItem
13.80
Stations Stn2
OEE Input Percent
%75
Scrap Percent %20
OEE Input Percent
%95
OEE Input Percent
%80
Scrap Percent %10
OEE Input Percent
%95
Activity TimeHr
Day4
OEE Input Percent
%85
Scrap Percent %10
Cumulative Cost
$Item37.00
Added Cost
$Set37
Cumulative Cost
$Item
38.00
Added Cost$
Set1
Cumulative Cost
$Item45.60
Added Cost
$Item0.00
Cumulative Cost
$Item
49.27
Added Cost$
Item2
Cumulative Cost
$Item49.27
Added Cost
$Item0.00
Cumulative Cost
$Item
64.71
Added Cost$
Item3
Cumulative Cost
$Item71.18
Added Cost
$Item0.00
Cumulative Cost
$Item
72.18
Added Cost$
Item1
Cumulative Cost
$Item72.18
Added Cost
$Item0.00
Cumulative Cost
$Item6.00
Added Cost
$Roll300
Cumulative Cost
$Item
6.01
Added Cost$
Roll0.25
Cumulative Cost
$Item6.61
Added Cost
$Item0.00
allA0160
Operator
Resource Utilization %
104.17
Resource Quantity RQ2
Resource Time
HrDay
12
Resource Rate
$Hr
20
Resource PTMinItem5 Resource PT
MinItem10
allA0170
Machine
Resource Utilization %
119.05
Resource Quantity RQ1
Resource Time
HrDay
14
Resource Rate
$Hr
15
Resource PTMinItem10
all
Inventory Summary
Z0130
Total Inventory Value
$166941.
18
all
Scrap Costs
Z0030
Total Scrap Cost
$Day
1467.11
49Plant Level Mapping

Copyright © 2015 The eVSM Group, All Rights Reserved 50

Copyright © 2015 The eVSM Group, All Rights Reserved
On your Desktop, click
the “Start eVSM” icon.
1
Click to enable
macros.Click “Trust all from
publisher” to avoid the
security notice in future.
3
4
If you see a message like this,
you must “Enable” macros.
2
Step 1: Start eVSM
51Plant Level Mapping

Copyright © 2015 The eVSM Group, All Rights Reserved
Quick_eVSM
Learn eVSM BasicsStep 2:
Avoid re-sizing eVSM shapes. Instead
grow the drawing page when needed.
To resize the page, hold down the “Ctrl”
key, and then drag any page edge to the
required size. This method works on all
four edges of the page.
2
VSM
Save your Visio file and then
insert a new page via the right-
mouse menus on the page-tabs.
5
52

Copyright © 2015 The eVSM Group, All Rights Reserved
Learn eVSM Basics
Blue icons in the main stencil
represent families of shapes. Drag
out the Transport icon.
3
Use the shape’s
right-mouse menus
to turn it into a car
4
eVSM Help resources are available in the
Learn module of the toolbar. Hover over
each help button to learn what it does.
1
Zooming:
-Ctrl + Shift = Drag Zoom Options
-Whole page view in Visio 2003/2007: Ctrl + W
-Whole page view in Visio 2010/2013: Ctrl + Shift + W
6
53Plant Level Mapping

Copyright © 2015 The eVSM Group, All Rights Reserved 54

Copyright © 2015 The eVSM Group, All Rights Reserved
White icons
represent Summary
Centers
Yellow icons are
additional add-on
variables to add to
Centers
**DRAG RED
SHAPES OUT
FIRST**
Green icons
represent Centers
Purple icons are the
graphs and other
charts
Quick Mfg Stencil Overview
Below is an overview of the Quick Mfg stencil shapes.
55Plant Level Mapping

Copyright © 2015 The eVSM Group, All Rights Reserved
Click the Wall Map button in the
toolbar to import a wall map picture
into eVSM.
1
Using the wall map sketcher
Click the Insert Wall Map
button to browse for the
image on your computer.
2
Draw a rectangle
over any one
process box to
scale the picture.
3
Click Done
when finished.
4
Step 3:
Wall Map
56

Copyright © 2015 The eVSM Group, All Rights Reserved
Using the wall map sketcher
Map visibility can be
switched on/off and
transparency can be
set in this form as well.
5
Click OK to start
sketching over the
picture.
6
Delete the wall picture.
Click the Wall Map button
again to bring up the form.
7
57Plant Level Mapping
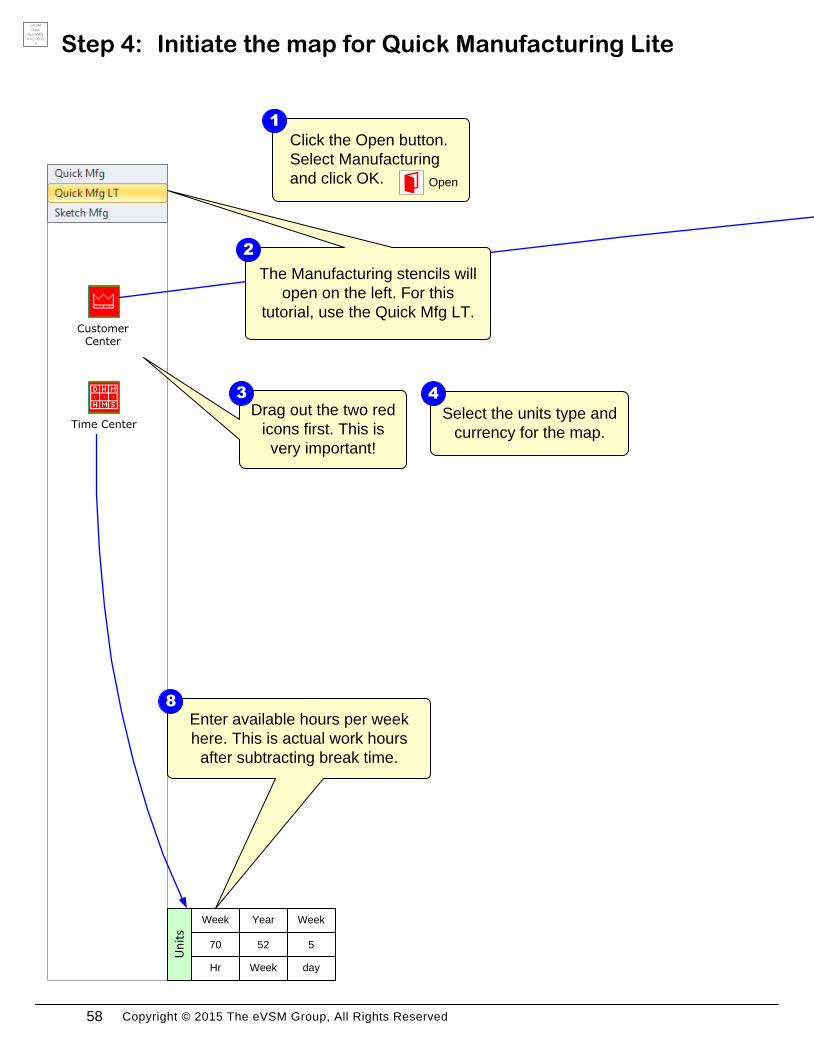
Copyright © 2015 The eVSM Group, All Rights Reserved
Click the Open button.
Select Manufacturing
and click OK.
Drag out the two red
icons first. This is
very important!
3
1
Time Center
Customer Center
Enter available hours per week
here. This is actual work hours
after subtracting break time.
8
Initiate the map for Quick Manufacturing LiteStep 4:
The Manufacturing stencils will
open on the left. For this
tutorial, use the Quick Mfg LT.
2
Select the units type and
currency for the map.
4
5
Week
day
70
Week
Hr
52
Year
Week
Un
its
Open
eVSM
Data
QuickMfg
8.02.0000.
0
58

Copyright © 2015 The eVSM Group, All Rights Reserved
Align all new
shapes to the grid
as you drop them.
5
Enter customer
demand here.
6
Initiate the map for Quick Manufacturing Lite
Leave “Auto” fields
alone. They will be
calculated
automatically.
7
allA0010
Customer
Customer Demand
ItemWeek
500
Share % %100
Effective Demand
ItemWeek
Auto
59Plant Level Mapping

Copyright © 2015 The eVSM Group, All Rights Reserved
Drag out two Units Converter
shapes from the Quick Extras
stencil and glue to the existing
Time Center.
1
Adding Custom Unit ConvertersStep 5:
Double-click the
bottom field to change
to “Item”.
2
Click the NUM button in
the toolbar.
3
Click the “New Unit”
button, type “Set”, and
click OK. Create
another unit named
“Roll” and click OK.
4
Double-click each
field to match the
appropriate units
converters.
5
5
Week
day
70
Week
Hr
52
Year
Week
Un
its
50
Roll
Set
1
Set
Item
NUM
eVSM
Data
QuickMfg
8.02.0000.
0
60

Copyright © 2015 The eVSM Group, All Rights Reserved
Adding Custom Unit Converters
allA0010
Customer
Customer Demand
SetWeek
500
Share % %100
Effective Demand
ItemWeek
Auto
Double-click the
units for Customer
Demand and
change the
numerator to “Set”.
6
61Plant Level Mapping
Copyright © 2015 The eVSM Group, All Rights Reserved
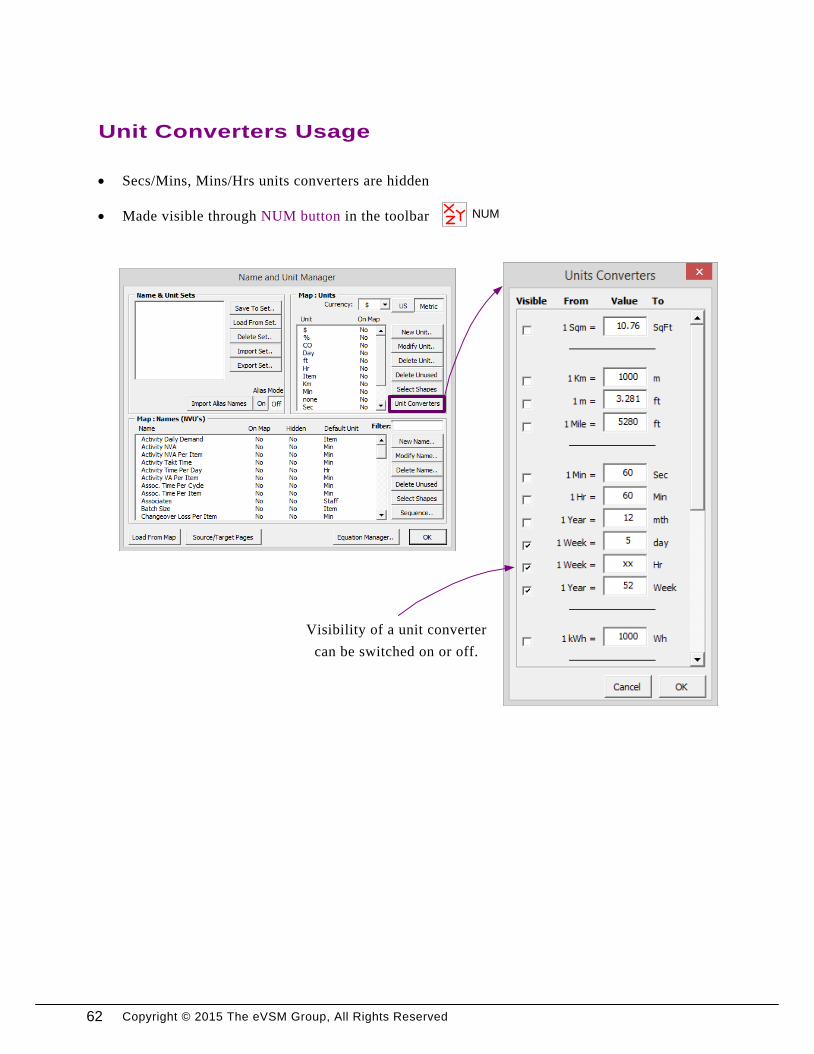
Unit Converters Usage
· Secs/Mins, Mins/Hrs units converters are hidden
· Made visible through NUM button in the toolbar
Visibility of a unit converter
can be switched on or off.
NUM
62

Copyright © 2015 The eVSM Group, All Rights Reserved
· Unit families eliminate errors when changing units
· Only Time units will appear when double-clicking on Mins to change to Hrs
· If desired unit does not appear:
· Create a new unit -- OR --
· Place a units converter on map
· Use NUM button in toolbar to create the new unit
· New unit will require units converter to connect default unit to new unit
· New unit will appear in “Select Unit” window when double-click unit (family)
· If desired unit was in the NUM, add a units converter to the map
· Built-in error proofing to prevent incompatible units
NUM
63Plant Level Mapping
Copyright © 2015 The eVSM Group, All Rights Reserved
5
Week
day
70
Week
Hr
52
Year
Week
Un
its
50
Roll
Set
1
Set
Item
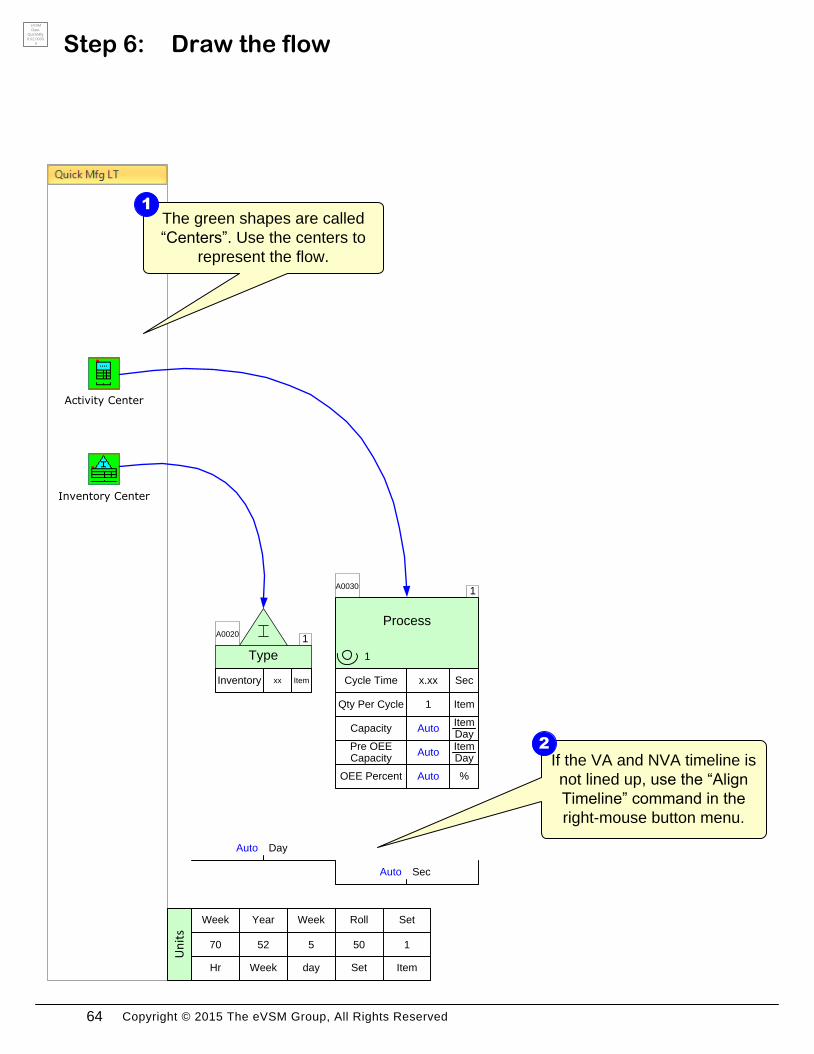
Draw the flow Step 6:
The green shapes are called
“Centers”. Use the centers to
represent the flow.
1
If the VA and NVA timeline is
not lined up, use the “Align
Timeline” command in the
right-mouse button menu.
2
Activity Center
Inventory Center
1A0020
Type
Inventory Itemxx
DayAuto
Process
1A0030
1
SecAuto
Qty Per Cycle Item1
Cycle Time Secx.xx
CapacityItemDay
Auto
Pre OEE Capacity
ItemDay
Auto
OEE Percent %Auto
eVSM
Data
QuickMfg
8.02.0000.
0
64

Copyright © 2015 The eVSM Group, All Rights Reserved
allA0010
Customer
Customer Demand
SetWeek
500
Share % %100
Effective Demand
ItemWeek
Auto
Draw the flow
65Plant Level Mapping

Copyright © 2015 The eVSM Group, All Rights Reserved
MinAuto
DayAuto
Disable Flying Connector
Select Timeline
Align Timeline
MinAuto
MinAuto
DayAuto
MinAuto
Working with the timeline
· Shift the entire timeline up or down, use “Select Timeline” in the right-mouse menu
· If that option doesn’t appear in the menu, make sure you have the entire VA or NVA shape
selected and try again
· “Align Timeline” function also in the right-mouse menu will create the ladder timeline for
you if the VA and NVA shapes are not correctly aligned, as shown below
66

Copyright © 2015 The eVSM Group, All Rights Reserved 67Plant Level Mapping
Copyright © 2015 The eVSM Group, All Rights Reserved
5
Week
day
70
Week
Hr
52
Year
Week
Un
its
50
Roll
Set
1
Set
Item
1A0020
Casting Sets
Inventory Set1000
DayAuto
Machine
1A0030
2
SecAuto
Qty Per Cycle Set1
Cycle Time Min15
CapacityItemDay
Auto
Pre OEE Capacity
ItemDay
Auto
OEE Percent %Auto
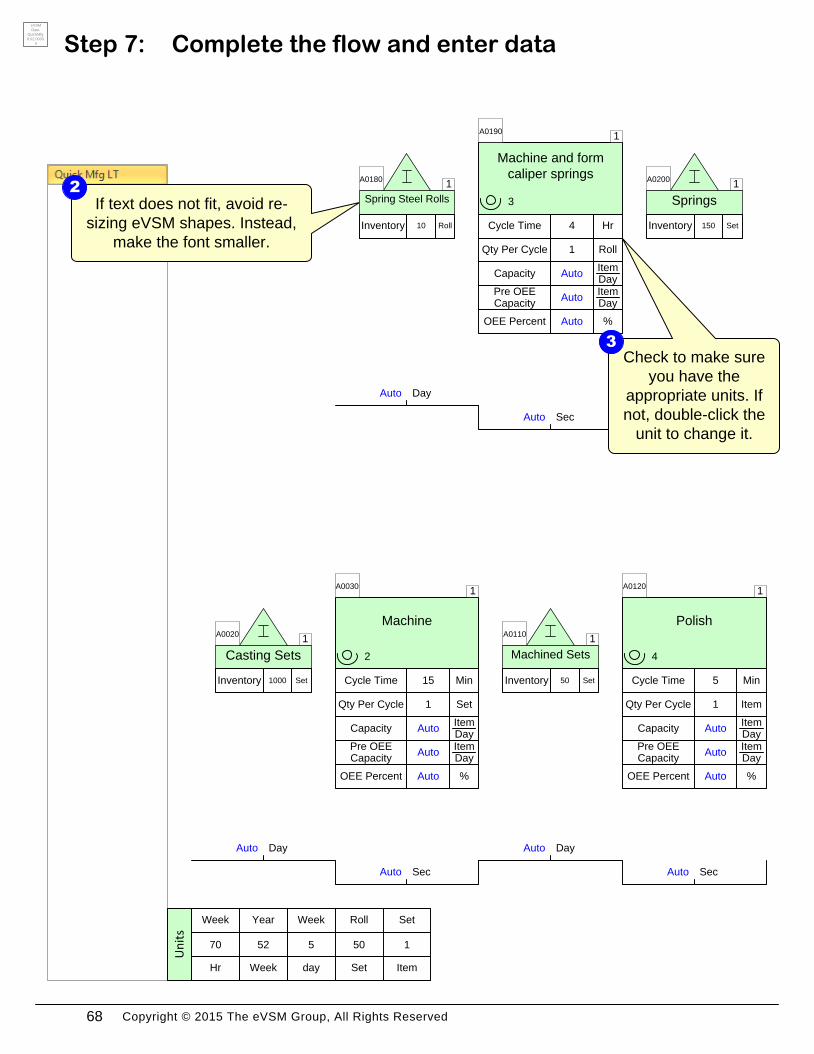
If text does not fit, avoid re-
sizing eVSM shapes. Instead,
make the font smaller.
2
Complete the flow and enter dataStep 7:
1A0110
Machined Sets
Inventory Set50
DayAuto
Polish
1A0120
4
SecAuto
Qty Per Cycle Item1
Cycle Time Min5
CapacityItemDay
Auto
Pre OEE Capacity
ItemDay
Auto
OEE Percent %Auto
1A0180
Spring Steel Rolls
Inventory Roll10
DayAuto
Machine and form
caliper springs
1A0190
3
SecAuto
Qty Per Cycle Roll1
Cycle Time Hr4
CapacityItemDay
Auto
Pre OEE Capacity
ItemDay
Auto
OEE Percent %Auto
1A0200
Springs
Inventory Set150
DayAuto
Check to make sure
you have the
appropriate units. If
not, double-click the
unit to change it.
3
eVSM
Data
QuickMfg
8.02.0000.
0
68
Copyright © 2015 The eVSM Group, All Rights Reserved
allA0010
Customer
Customer Demand
SetWeek
500
Share % %100
Effective Demand
ItemWeek
Auto
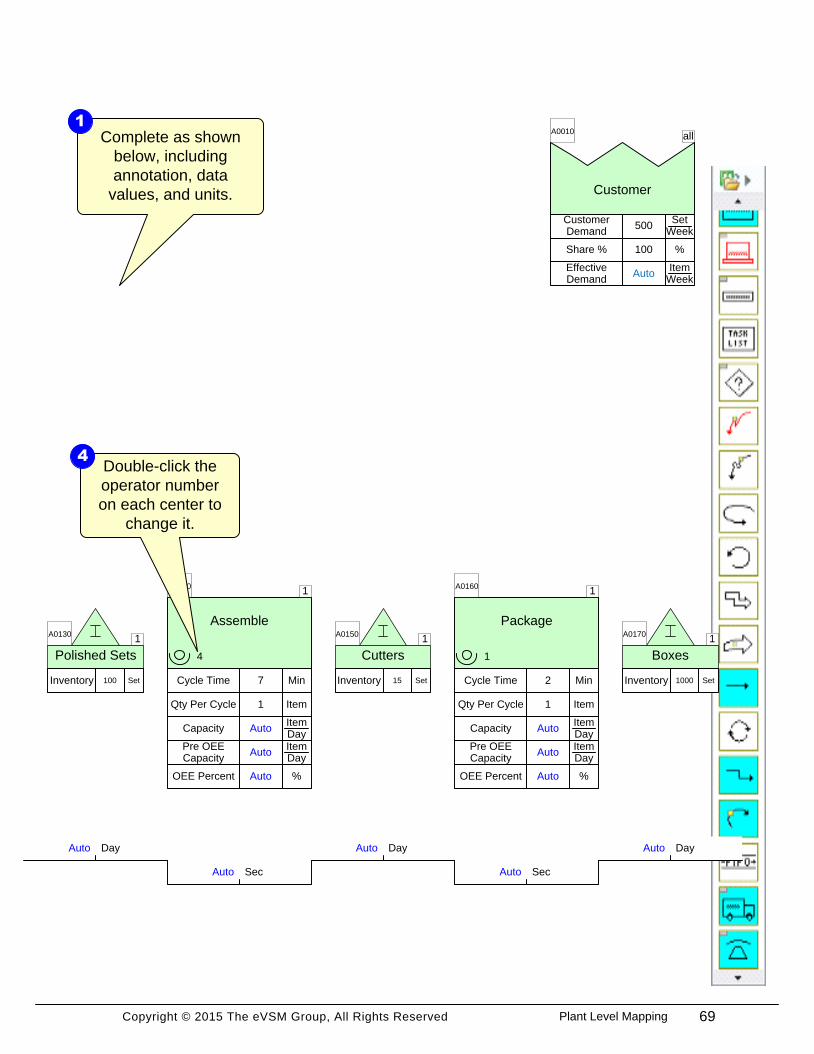
Complete the flow and enter data
Complete as shown
below, including
annotation, data
values, and units.
1
1A0130
Polished Sets
Inventory Set100
DayAuto
Assemble
1A0140
4
SecAuto
Qty Per Cycle Item1
Cycle Time Min7
CapacityItemDay
Auto
Pre OEE Capacity
ItemDay
Auto
OEE Percent %Auto
1A0150
Cutters
Inventory Set15
DayAuto
Package
1A0160
1
SecAuto
Qty Per Cycle Item1
Cycle Time Min2
CapacityItemDay
Auto
Pre OEE Capacity
ItemDay
Auto
OEE Percent %Auto
1A0170
Boxes
Inventory Set1000
DayAuto
Double-click the
operator number
on each center to
change it.
4
69Plant Level Mapping

Copyright © 2015 The eVSM Group, All Rights Reserved
· Fractional units makes specifying and computing demand quantities or production times
easier
· Provides better control of data entry and display
· Fractional units changed like any other unit on map using the NUM button in the toolbar
Fractional Units
70

Copyright © 2015 The eVSM Group, All Rights Reserved
Non-Value Added =
Inventory / Customer
Demand
· When entering data use tab key to go to next NVU
· Non-Value Added and Value Added ladders are already glued to Activity Center
and Inventory Center, respectively
· The standard NVUs on an Activity Center are required for calculations and MUST
NOT be deleted
Input values with a default x.xx
are mandatory and require a
numeric value otherwise the map
will not solve
Data Entry Hints
1
Inventory Itemxx
DayAuto
A0010
Type
Process
1
Qty Per Cycle Item1
Cycle Time Minx.xx
1
MinAuto
A0020
71Plant Level Mapping

Copyright © 2015 The eVSM Group, All Rights Reserved
5
Week
day
70
Week
Hr
52
Year
Week
Un
its
50
Roll
Set
1
Set
Item
1A0020
Casting Sets
Inventory Set1000
DayAuto
Machine
1A0030
2
SecAuto
Qty Per Cycle Set1
Cycle Time Min15
CapacityItemDay
Auto
Pre OEE Capacity
ItemDay
Auto
OEE Percent %Auto
1A0110
Machined Sets
Inventory Set50
DayAuto
Polish
1A0120
4
SecAuto
Qty Per Cycle Item1
Cycle Time Min5
CapacityItemDay
Auto
Pre OEE Capacity
ItemDay
Auto
OEE Percent %Auto
1A0180
Spring Steel Rolls
Inventory Roll10
DayAuto
Machine and form
caliper springs
1A0190
3
SecAuto
Qty Per Cycle Roll1
Cycle Time Hr4
CapacityItemDay
Auto
Pre OEE Capacity
ItemDay
Auto
OEE Percent %Auto
1A0200
Springs
Inventory Set150
DayAuto
Add Arrows from Main StencilStep 8:
Glue all arrows at
both ends.
2
eVSM
Data
QuickMfg
8.02.0000.
0
72

Copyright © 2015 The eVSM Group, All Rights Reserved
allA0010
Customer
Customer Demand
SetWeek
500
Share % %100
Effective Demand
ItemWeek
Auto
1A0130
Polished Sets
Inventory Set100
DayAuto
Assemble
1A0140
4
SecAuto
Qty Per Cycle Item1
Cycle Time Min7
CapacityItemDay
Auto
Pre OEE Capacity
ItemDay
Auto
OEE Percent %Auto
1A0150
Cutters
Inventory Set15
DayAuto
Package
1A0160
1
SecAuto
Qty Per Cycle Item1
Cycle Time Min2
CapacityItemDay
Auto
Pre OEE Capacity
ItemDay
Auto
OEE Percent %Auto
1A0170
Boxes
Inventory Set1000
DayAuto
Add Arrows from Main Stencil
Use the right mouse
button menu of the
arrows to turn into a
“Push” arrow.
3
Drag the arrows from the
Main stencil on the right.
1
73Plant Level Mapping

Copyright © 2015 The eVSM Group, All Rights Reserved
5
Week
day
70
Week
Hr
52
Year
Week
Un
its
50
Roll
Set
1
Set
Item
1A0020
Casting Sets
Inventory Set1000
DayAuto
Machine
1A0030
2
SecAuto
Qty Per Cycle Set1
Cycle Time Min15
CapacityItemDay
Auto
Pre OEE Capacity
ItemDay
Auto
OEE Percent %Auto
1A0110
Machined Sets
Inventory Set50
DayAuto
Polish
1A0120
4
SecAuto
Qty Per Cycle Item1
Cycle Time Min5
CapacityItemDay
Auto
Pre OEE Capacity
ItemDay
Auto
OEE Percent %Auto
1A0180
Spring Steel Rolls
Inventory Roll10
DayAuto
Machine and form
caliper springs
1A0190
3
SecAuto
Qty Per Cycle Roll1
Cycle Time Hr4
CapacityItemDay
Auto
Pre OEE Capacity
ItemDay
Auto
OEE Percent %Auto
1A0200
Springs
Inventory Set150
DayAuto
Step 9: Add Transport shapeseVSM
Data
QuickMfg
8.02.0000.
0
74
Copyright © 2015 The eVSM Group, All Rights Reserved
allA0010
Customer
Customer Demand
SetWeek
500
Share % %100
Effective Demand
ItemWeek
Auto
1A0130
Polished Sets
Inventory Set100
DayAuto
Assemble
1A0140
4
SecAuto
Qty Per Cycle Item1
Cycle Time Min7
CapacityItemDay
Auto
Pre OEE Capacity
ItemDay
Auto
OEE Percent %Auto
1A0150
Cutters
Inventory Set15
DayAuto
Package
1A0160
1
SecAuto
Qty Per Cycle Item1
Cycle Time Min2
CapacityItemDay
Auto
Pre OEE Capacity
ItemDay
Auto
OEE Percent %Auto
1A0170
Boxes
Inventory Set1000
DayAuto
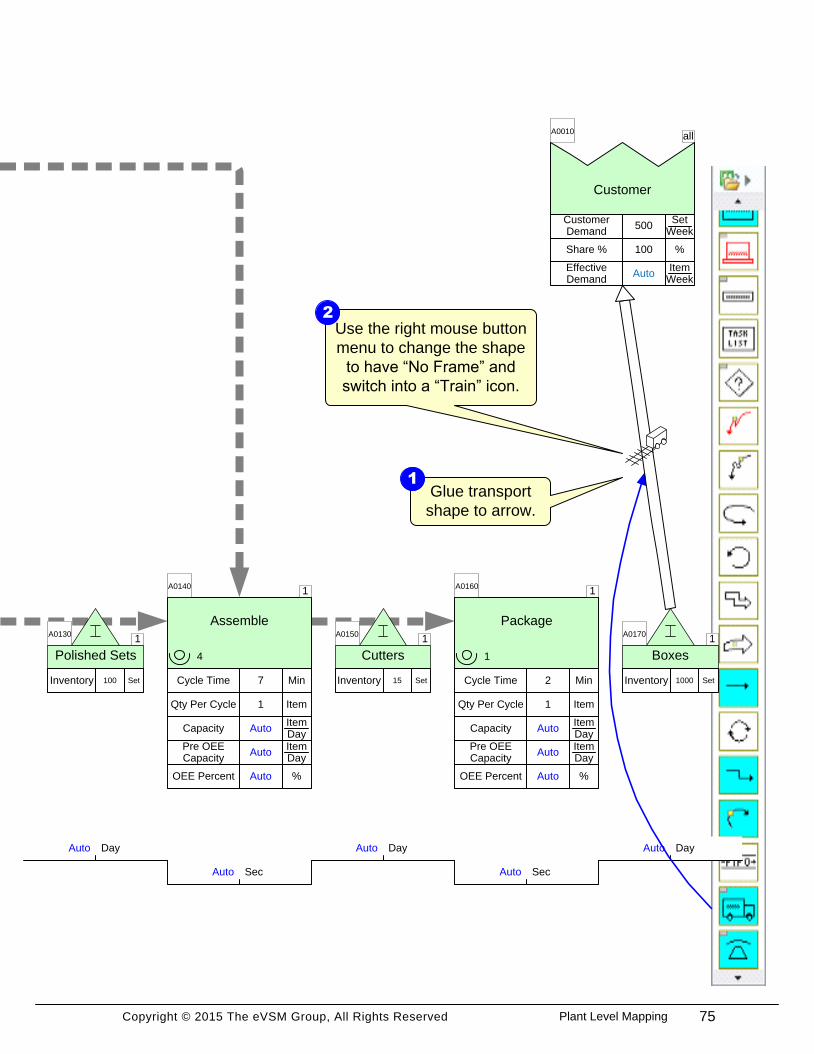
Use the right mouse button
menu to change the shape
to have “No Frame” and
switch into a “Train” icon.
2
Glue transport
shape to arrow.
1
75Plant Level Mapping

Copyright © 2015 The eVSM Group, All Rights Reserved
· Transport, Transmit, and Flow Shapes now have text box framed to allow data values to be
added if needed
· If data is added to shape, an Operation Tag and Path Locator needs to be added
· To remove frame, right-click on shape and select “Frame Icon”
Frame All
Frame Icon
No Frame
Frame All
(Default)
Frame Icon No Frame
· Use Text Block tool to move text
Transport, Transmit, and Flow Shapes
76
Copyright © 2015 The eVSM Group, All Rights Reserved
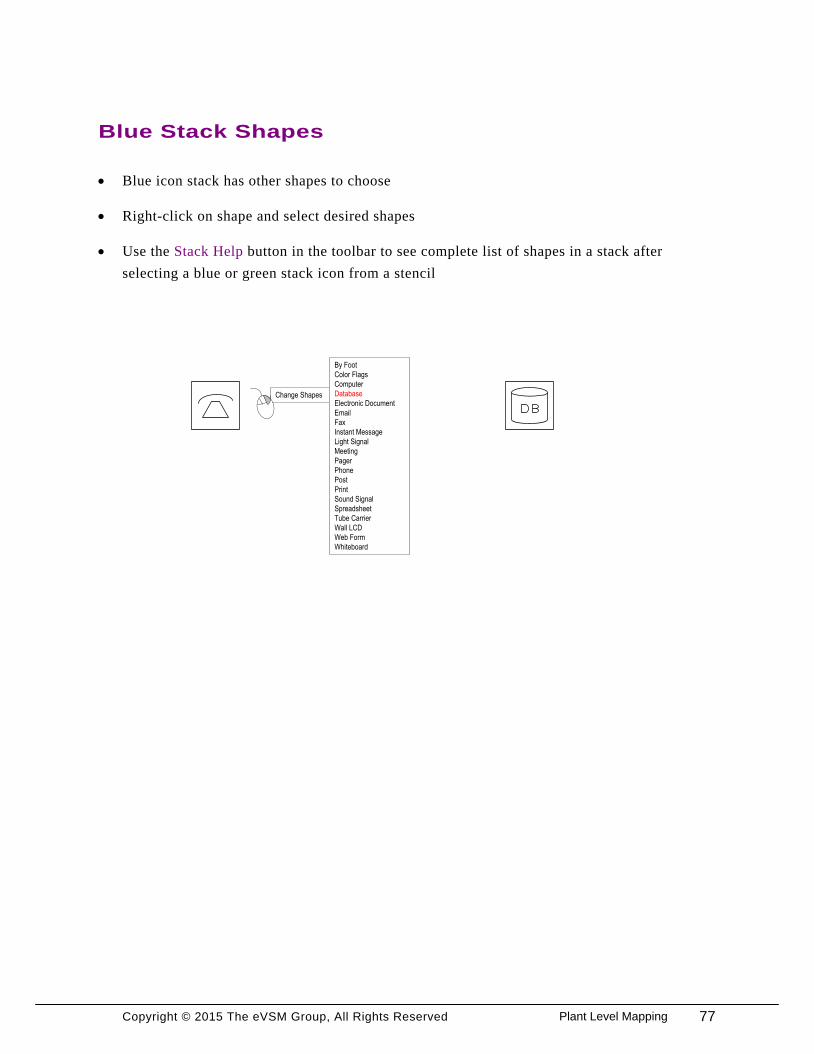
Blue Stack Shapes
Change Shapes
By Foot
Color Flags
Computer
Database
Electronic Document
Fax
Instant Message
Light Signal
Meeting
Pager
Phone
Post
Sound Signal
Spreadsheet
Tube Carrier
Wall LCD
Web Form
Whiteboard
· Blue icon stack has other shapes to choose
· Right-click on shape and select desired shapes
· Use the Stack Help button in the toolbar to see complete list of shapes in a stack after
selecting a blue or green stack icon from a stencil
77Plant Level Mapping

Copyright © 2015 The eVSM Group, All Rights Reserved
5
Week
day
70
Week
Hr
52
Year
Week
Un
its
50
Roll
Set
1
Set
Item
1A0020
Casting Sets
Inventory Set1000
DayAuto
Machine
1A0030
2
SecAuto
Qty Per Cycle Set1
Cycle Time Min15
CapacityItemDay
Auto
Pre OEE Capacity
ItemDay
Auto
OEE Percent %Auto
1A0110
Machined Sets
Inventory Set50
DayAuto
Polish
1A0120
4
SecAuto
Qty Per Cycle Item1
Cycle Time Min5
CapacityItemDay
Auto
Pre OEE Capacity
ItemDay
Auto
OEE Percent %Auto
1A0180
Spring Steel Rolls
Inventory Roll10
DayAuto
Machine and form
caliper springs
1A0190
3
SecAuto
Qty Per Cycle Roll1
Cycle Time Hr4
CapacityItemDay
Auto
Pre OEE Capacity
ItemDay
Auto
OEE Percent %Auto
1A0200
Springs
Inventory Set150
DayAuto
Step 10: Sequence Arrows
Sequence arrows are needed for
upstream and downstream
calculations. To add them, hold down
the SHIFT key and select the green
shapes in the order shown here.
1
Click the Sequence
button.
2
Sequence
A
B
C
D
eVSM
Data
QuickMfg
8.02.0000.
0
78

Copyright © 2015 The eVSM Group, All Rights Reserved
allA0010
Customer
Customer Demand
SetWeek
500
Share % %100
Effective Demand
ItemWeek
Auto
1A0130
Polished Sets
Inventory Set100
DayAuto
Assemble
1A0140
4
SecAuto
Qty Per Cycle Item1
Cycle Time Min7
CapacityItemDay
Auto
Pre OEE Capacity
ItemDay
Auto
OEE Percent %Auto
1A0150
Cutters
Inventory Set15
DayAuto
Package
1A0160
1
SecAuto
Qty Per Cycle Item1
Cycle Time Min2
CapacityItemDay
Auto
Pre OEE Capacity
ItemDay
Auto
OEE Percent %Auto
1A0170
Boxes
Inventory Set1000
DayAuto
Sequence Arrows
E
F
G
H
I
J
79Plant Level Mapping

Copyright © 2015 The eVSM Group, All Rights Reserved
· Provide a means of generating tag numbers in upstream to downstream sequence (using the
AutoTag button)
· Provide a means of generating path numbers that comprehend all of the paths on the map
(using the Auto Path button)
· Are the basis for upstream/downstream calculations in the built-in eVSM equations
Sequence Arrows Sequence
Auto Path
Auto Tag
80

Copyright © 2015 The eVSM Group, All Rights Reserved 81Plant Level Mapping

Copyright © 2015 The eVSM Group, All Rights Reserved
5
Week
day
70
Week
Hr
52
Year
Week
Un
its
50
Roll
Set
1
Set
Item
1A0020
Casting Sets
Inventory Set1000
DayAuto
Machine
1A0030
2
SecAuto
Qty Per Cycle Set1
Cycle Time Min15
CapacityItemDay
Auto
Pre OEE Capacity
ItemDay
Auto
OEE Percent %Auto
1A0110
Machined Sets
Inventory Set50
DayAuto
Polish
1A0120
4
SecAuto
Qty Per Cycle Item1
Cycle Time Min5
CapacityItemDay
Auto
Pre OEE Capacity
ItemDay
Auto
OEE Percent %Auto
1A0180
Spring Steel Rolls
Inventory Roll10
DayAuto
Machine and form
caliper springs
1A0190
3
SecAuto
Qty Per Cycle Roll1
Cycle Time Hr4
CapacityItemDay
Auto
Pre OEE Capacity
ItemDay
Auto
OEE Percent %Auto
1A0200
Springs
Inventory Set150
DayAuto
A
B
C
Step 11: Sequence Path 2
For the second path, hold the SHIFT
key and select the green shapes A to
D in the order shown. Then click the
Sequence button.
2
eVSM
Data
QuickMfg
8.02.0000.
0
82

Copyright © 2015 The eVSM Group, All Rights Reserved
allA0010
Customer
Customer Demand
SetWeek
500
Share % %100
Effective Demand
ItemWeek
Auto
1A0130
Polished Sets
Inventory Set100
DayAuto
Assemble
1A0140
4
SecAuto
Qty Per Cycle Item1
Cycle Time Min7
CapacityItemDay
Auto
Pre OEE Capacity
ItemDay
Auto
OEE Percent %Auto
1A0150
Cutters
Inventory Set15
DayAuto
Package
1A0160
1
SecAuto
Qty Per Cycle Item1
Cycle Time Min2
CapacityItemDay
Auto
Pre OEE Capacity
ItemDay
Auto
OEE Percent %Auto
1A0170
Boxes
Inventory Set1000
DayAuto
D
The sequence arrows
are now connecting
path one.
1
83Plant Level Mapping

Copyright © 2015 The eVSM Group, All Rights Reserved
5
Week
day
70
Week
Hr
52
Year
Week
Un
its
50
Roll
Set
1
Set
Item
A0040
Casting Sets
Inventory Set1000
DayAuto
Machine
A0050
2
SecAuto
Qty Per Cycle Set1
Cycle Time Min15
CapacityItemDay
Auto
Pre OEE Capacity
ItemDay
Auto
OEE Percent %Auto
A0060
Machined Sets
Inventory Set50
DayAuto
Polish
A0070
4
SecAuto
Qty Per Cycle Item1
Cycle Time Min5
CapacityItemDay
Auto
Pre OEE Capacity
ItemDay
Auto
OEE Percent %Auto
A0010
Spring Steel Rolls
Inventory Roll10
DayAuto
Machine and form
caliper springs
A0020
3
SecAuto
Qty Per Cycle Roll1
Cycle Time Hr4
CapacityItemDay
Auto
Pre OEE Capacity
ItemDay
Auto
OEE Percent %Auto
A0030
Springs
Inventory Set150
DayAuto
Click Auto Path to
automatically generate Path
numbers based on Sequence
arrows.
2
Click AutoTag again to re-order
the tags based on the new
sequence arrows.
3
Auto PathAuto Tag
1
1
1
1
2
2
2
Step 12: Use Auto Path to Generate Path ID’s based on Sequence ArrowseVSM
Data
QuickMfg
8.02.0000.
0
84

Copyright © 2015 The eVSM Group, All Rights Reserved
A0130
Customer
Customer Demand
SetWeek
500
Share % %100
Effective Demand
ItemWeek
Auto
A0080
Polished Sets
Inventory Set100
DayAuto
Assemble
A0090
4
SecAuto
Qty Per Cycle Item1
Cycle Time Min7
CapacityItemDay
Auto
Pre OEE Capacity
ItemDay
Auto
OEE Percent %Auto
A0100
Cutters
Inventory Set15
DayAuto
Package
A0110
1
SecAuto
Qty Per Cycle Item1
Cycle Time Min2
CapacityItemDay
Auto
Pre OEE Capacity
ItemDay
Auto
OEE Percent %Auto
A0120
Boxes
Inventory Set1000
DayAuto
The sequence arrows
are now connecting
path one and two.
1 Sequence arrow visibility can be
switched On/Off with the Show
Seq button. Try it.
4
These Path Locator tags are used to specify
paths. You can manually change these. You
can add new ones with copy/paste or from
the main stencil on the right. Another way to
specify paths is with Sequence arrows and
the Auto Path function.
5
Show Seq.
all
1
12
12
12
12
85Plant Level Mapping
Copyright © 2015 The eVSM Group, All Rights Reserved
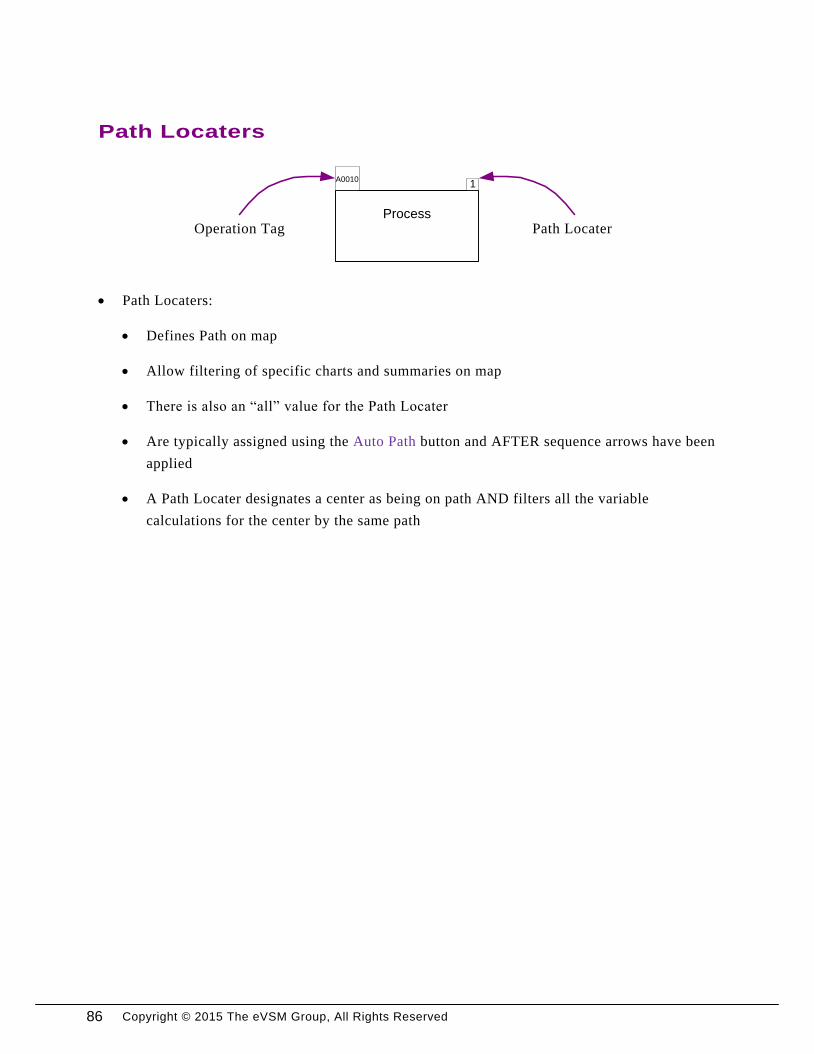
Path Locaters
· Path Locaters:
· Defines Path on map
· Allow filtering of specific charts and summaries on map
· There is also an “all” value for the Path Locater
· Are typically assigned using the Auto Path button and AFTER sequence arrows have been
applied
· A Path Locater designates a center as being on path AND filters all the variable
calculations for the center by the same path
Process
A00101
Path LocaterOperation Tag
86

Copyright © 2015 The eVSM Group, All Rights Reserved
· Operation Tags:
· Provides short name for process step
· Identifies process step to Excel for calculations
· Defines the order in which data is plotted on charts
· Operation Tags MUST be 1-alpha and 4-numeric characters (ie: A0200)
· Are typically assigned using the Auto Tag button and AFTER sequence arrows have been
applied
Operation Tags
87Plant Level Mapping

Copyright © 2015 The eVSM Group, All Rights Reserved
5
Week
day
70
Week
Hr
52
Year
Week
Un
its
50
Roll
Set
1
Set
Item
A0040
Casting Sets
Inventory Set1000
DayAuto
Machine
A0050
2
SecAuto
Qty Per Cycle Set1
Cycle Time Min15
CapacityItemDay
Auto
Pre OEE Capacity
ItemDay
Auto
OEE Percent %Auto
A0060
Machined Sets
Inventory Set50
DayAuto
Polish
A0070
4
SecAuto
Qty Per Cycle Item1
Cycle Time Min5
CapacityItemDay
Auto
Pre OEE Capacity
ItemDay
Auto
OEE Percent %Auto
A0010
Spring Steel Rolls
Inventory Roll10
DayAuto
Machine and form
caliper springs
A0020
3
SecAuto
Qty Per Cycle Roll1
Cycle Time Hr4
CapacityItemDay
Auto
Pre OEE Capacity
ItemDay
Auto
OEE Percent %Auto
A0030
Springs
Inventory Set150
DayAuto
1
1
1
1
2
2
2
Step 13: Time Summary by Path
Double-click to
change this
path ID to 2.
2
Double-click to
change this path
ID to 1.
3
Drag out a two
Time Summary
Centers.
1
Time Summary
1
Time Summary
Z0010
Takt TimeSecItem
Auto
Total Value Added
MinAuto
Lead Time DayAuto
Value Added Percent
%Auto
Process Time Per Unit
SecItem
Auto
2
Time Summary
Z0150
Takt TimeSecItem
Auto
Total Value Added
MinAuto
Lead Time DayAuto
Value Added Percent
%Auto
Process Time Per Unit
SecItem
Auto
eVSM
Data
QuickMfg
8.02.0000.
0
88

Copyright © 2015 The eVSM Group, All Rights Reserved
A0130
Customer
Customer Demand
SetWeek
500
Share % %100
Effective Demand
ItemWeek
Auto
A0080
Polished Sets
Inventory Set100
DayAuto
Assemble
A0090
4
SecAuto
Qty Per Cycle Item1
Cycle Time Min7
CapacityItemDay
Auto
Pre OEE Capacity
ItemDay
Auto
OEE Percent %Auto
A0100
Cutters
Inventory Set15
DayAuto
Package
A0110
1
SecAuto
Qty Per Cycle Item1
Cycle Time Min2
CapacityItemDay
Auto
Pre OEE Capacity
ItemDay
Auto
OEE Percent %Auto
A0120
Boxes
Inventory Set1000
DayAuto
all
1
12
12
12
12
Time Summary by Path
89Plant Level Mapping

Copyright © 2015 The eVSM Group, All Rights Reserved
5
Week
day
70
Week
Hr
52
Year
Week
Un
its
50
Roll
Set
1
Set
Item
A0040
Casting Sets
Inventory Set1000
Day10.00
Machine
A0050
2.00
Min15.00
Qty Per Cycle Set1
Cycle Time Min15
CapacityItemDay
56.00
Pre OEE Capacity
ItemDay
56.00
OEE Percent %100.00
A0060
Machined Sets
Inventory Set50
Day0.50
Polish
A0070
4.00
Min5.00
Qty Per Cycle Item1
Cycle Time Min5
CapacityItemDay
168.00
Pre OEE Capacity
ItemDay
168.00
OEE Percent %100.00
A0010
Spring Steel Rolls
Inventory Roll10
Day5.00
Machine and form
caliper springs
A0020
3.00
Min240.00
Qty Per Cycle Roll1
Cycle Time Hr4
CapacityItemDay
175.00
Pre OEE Capacity
ItemDay
175.00
OEE Percent %100.00
A0030
Springs
Inventory Set150
Day1.50
1
1
1
1
2
2
2
1
Time Summary
Z0010
Takt TimeMinItem
8.40
Total Value Added
Min29.00
Lead Time Day21.68
Value Added Percent
%0.16
Process Time Per Unit
MinItem
29.00
2
Time Summary
Z0150
Takt TimeMinItem
8.40
Total Value Added
Min249.00
Lead Time Day16.95
Value Added Percent
%1.75
Process Time Per Unit
MinItem
13.80
Step 14: Perform Calculations
When complete, note that
all blue values show
calculated results
3
Double-click the unit if
you would like to change
it to minutes, or any
other time measure.
4
eVSM
Data
QuickMfg
8.02.0000.
0
90

Copyright © 2015 The eVSM Group, All Rights Reserved
A0130
Customer
Customer Demand
SetWeek
500
Share % %100
Effective Demand
ItemWeek
500.00
A0080
Polished Sets
Inventory Set100
Day1.00
Assemble
A0090
4.00
Min7.00
Qty Per Cycle Item1
Cycle Time Min7
CapacityItemDay
120.00
Pre OEE Capacity
ItemDay
120.00
OEE Percent %100.00
A0100
Cutters
Inventory Set15
Day0.15
Package
A0110
1.00
Min2.00
Qty Per Cycle Item1
Cycle Time Min2
CapacityItemDay
420.00
Pre OEE Capacity
ItemDay
420.00
OEE Percent %100.00
A0120
Boxes
Inventory Set1000
Day10.00
all
1
12
12
12
12
Click the “Solve” button
to calculate.
2
Click the “Check” button
and fix any problems
flagged.
1
CheckSolve
91Plant Level Mapping

Copyright © 2015 The eVSM Group, All Rights Reserved
First Check then Solve
· Performs comprehensive model checking
· Fixes obvious problem
· Provides list of outstanding issues
Check Button
· Performs basic model checking
· Stops if there is any obvious issues like missing data values
· Solves the built-in equations and puts the results on the map
· Exports data to an Excel spreadsheet
Solve Button
Users should first Check and then Solve the map.
Check
Solve
92

Copyright © 2015 The eVSM Group, All Rights Reserved 93Plant Level Mapping

Copyright © 2015 The eVSM Group, All Rights Reserved
5
Week
day
70
Week
Hr
52
Year
Week
Un
its
50
Roll
Set
1
Set
Item
A0040
Casting Sets
Inventory Set1000
Day10.00
Machine
A0050
2.00
Min15.00
Qty Per Cycle Set1
Cycle Time Min15
CapacityItemDay
56.00
Pre OEE Capacity
ItemDay
56.00
OEE Percent %100.00
A0060
Machined Sets
Inventory Set50
Day0.50
Polish
A0070
4.00
Min5.00
Qty Per Cycle Item1
Cycle Time Min5
CapacityItemDay
168.00
Pre OEE Capacity
ItemDay
168.00
OEE Percent %100.00
A0010
Spring Steel Rolls
Inventory Roll10
Day5.00
Machine and form
caliper springs
A0020
3.00
Min240.00
Qty Per Cycle Roll1
Cycle Time Hr4
CapacityItemDay
175.00
Pre OEE Capacity
ItemDay
175.00
OEE Percent %100.00
A0030
Springs
Inventory Set150
Day1.50
1
1
1
1
2
2
2
1
Time Summary
Z0010
Takt TimeMinItem
8.40
Total Value Added
Min29.00
Lead Time Day21.68
Value Added Percent
%0.16
Process Time Per Unit
MinItem
29.00
2
Time Summary
Z0150
Takt TimeMinItem
8.40
Total Value Added
Min249.00
Lead Time Day16.95
Value Added Percent
%1.75
Process Time Per Unit
MinItem
13.80
Step 15:
Use the right mouse
button menu of chart icon
and select “Plot Chart”
Drag out CT/TT
Chart icon
1
2
CT / TT Chart
Add Cycle Time Takt Time Chart
CT / TT
Chart
eVSM
Data
QuickMfg
8.02.0000.
0
94

Copyright © 2015 The eVSM Group, All Rights Reserved
A0130
Customer
Customer Demand
SetWeek
500
Share % %100
Effective Demand
ItemWeek
500.00
A0080
Polished Sets
Inventory Set100
Day1.00
Assemble
A0090
4.00
Min7.00
Qty Per Cycle Item1
Cycle Time Min7
CapacityItemDay
120.00
Pre OEE Capacity
ItemDay
120.00
OEE Percent %100.00
A0100
Cutters
Inventory Set15
Day0.15
Package
A0110
1.00
Min2.00
Qty Per Cycle Item1
Cycle Time Min2
CapacityItemDay
420.00
Pre OEE Capacity
ItemDay
420.00
OEE Percent %100.00
A0120
Boxes
Inventory Set1000
Day10.00
all
1
12
12
12
12
Add Cycle Time Takt Time Chart Here is the chart. Note the
bottleneck in the Machine
activity.
3
Cycle Time / Takt Time Chart
Min
/Ite
m
0
2
4
6
8
10
12
14
16
A0020
Mac
hine
and
form
ca.
.
A0050
Mac
hine
A0070
Polish
A0090
Ass
emble
A0110
Pac
kage
Cycle Time Per Unit
Legend
Activity Takt Time
95Plant Level Mapping

Copyright © 2015 The eVSM Group, All Rights Reserved
5
Week
day
70
Week
Hr
52
Year
Week
Un
its
50
Roll
Set
1
Set
Item
A0040
Casting Sets
Inventory Set1000
Day10.00
Machine
A0050
2.00
Min15.00
Qty Per Cycle Set1
Cycle Time Min15
CapacityItemDay
112.00
Pre OEE Capacity
ItemDay
112.00
OEE Percent %100.00
A0060
Machined Sets
Inventory Set50
Day0.50
Polish
A0070
4.00
Min5.00
Qty Per Cycle Item1
Cycle Time Min5
CapacityItemDay
168.00
Pre OEE Capacity
ItemDay
168.00
OEE Percent %100.00
A0010
Spring Steel Rolls
Inventory Roll10
Day5.00
Machine and form
caliper springs
A0020
3.00
Min240.00
Qty Per Cycle Roll1
Cycle Time Hr4
CapacityItemDay
175.00
Pre OEE Capacity
ItemDay
175.00
OEE Percent %100.00
A0030
Springs
Inventory Set150
Day1.50
1
1
1
1
2
2
2
1
Time Summary
Z0010
Takt TimeMinItem
8.40
Total Value Added
Min29.00
Lead Time Day21.68
Value Added Percent
%0.16
Process Time Per Unit
MinItem
21.50
2
Time Summary
Z0150
Takt TimeMinItem
8.40
Total Value Added
Min249.00
Lead Time Day16.95
Value Added Percent
%1.75
Process Time Per Unit
MinItem
13.80
Step 16: Try Add-on Calculations: Stations
Drag out the Stations
add-on and glue to the
Machine Activity Center.
1
Activity Stations
Activity Center
Run “Solve” and
note the changes in
the chart.
2
Stations Stn2
Solve
eVSM
Data
QuickMfg
8.02.0000.
0
96

Copyright © 2015 The eVSM Group, All Rights Reserved
A0130
Customer
Customer Demand
SetWeek
500
Share % %100
Effective Demand
ItemWeek
500.00
A0080
Polished Sets
Inventory Set100
Day1.00
Assemble
A0090
4.00
Min7.00
Qty Per Cycle Item1
Cycle Time Min7
CapacityItemDay
120.00
Pre OEE Capacity
ItemDay
120.00
OEE Percent %100.00
A0100
Cutters
Inventory Set15
Day0.15
Package
A0110
1.00
Min2.00
Qty Per Cycle Item1
Cycle Time Min2
CapacityItemDay
420.00
Pre OEE Capacity
ItemDay
420.00
OEE Percent %100.00
A0120
Boxes
Inventory Set1000
Day10.00
all
1
12
12
12
12
CT / TT
Chart
Try Add-on Calculations: Stations
Cycle Time / Takt Time Chart
Min
/Ite
m
0
1
2
3
4
5
6
7
8
9
A0020
Mac
hine
and
form
ca.
.
A0050
Mac
hine
A0070
Polish
A0090
Ass
emble
A0110
Pac
kage
Cycle Time Per Unit
Legend
Activity Takt Time
97Plant Level Mapping

Copyright © 2015 The eVSM Group, All Rights Reserved
5
Week
day
70
Week
Hr
52
Year
Week
Un
its
50
Roll
Set
1
Set
Item
A0040
Casting Sets
Inventory Set1000
Day10.00
Machine
A0050
2.00
Min15.00
Qty Per Cycle Set1
Cycle Time Min15
CapacityItemDay
75.04
Pre OEE Capacity
ItemDay
112.00
OEE Percent %75.00
A0060
Machined Sets
Inventory Set50
Day0.50
Polish
A0070
4.00
Min5.00
Qty Per Cycle Item1
Cycle Time Min5
CapacityItemDay
142.80
Pre OEE Capacity
ItemDay
168.00
OEE Percent %95.00
A0010
Spring Steel Rolls
Inventory Roll10
Day5.00
Machine and form
caliper springs
A0020
3.00
Min240.00
Qty Per Cycle Roll1
Cycle Time Hr4
CapacityItemDay
133.00
Pre OEE Capacity
ItemDay
175.00
OEE Percent %85.00
A0030
Springs
Inventory Set150
Day1.50
1
1
1
1
2
2
2
1
Time Summary
Z0010
Takt TimeMinItem
8.40
Total Value Added
Min29.00
Lead Time Day21.68
Value Added Percent
%0.16
Process Time Per Unit
MinItem
21.50
2
Time Summary
Z0150
Takt TimeMinItem
8.40
Total Value Added
Min249.00
Lead Time Day16.95
Value Added Percent
%1.75
Process Time Per Unit
MinItem
13.80
Stations Stn2
Step 17: Try Add-on Calculations: OEE, Scrap, Activity Time
Activity Center
Activity Scrap
Activity OEE Direct
Run “Solve” and
note the changes in
the chart.
3
OEE Input Percent
%75
Scrap Percent %20
OEE Input Percent
%95
OEE Input Percent
%85
Scrap Percent %10
Solve
Activity Time
eVSM
Data
QuickMfg
8.02.0000.
0
98

Copyright © 2015 The eVSM Group, All Rights Reserved
A0130
Customer
Customer Demand
SetWeek
500
Share % %100
Effective Demand
ItemWeek
500.00
A0080
Polished Sets
Inventory Set100
Day1.00
Assemble
A0090
4.00
Min7.00
Qty Per Cycle Item1
Cycle Time Min7
CapacityItemDay
96.00
Pre OEE Capacity
ItemDay
120.00
OEE Percent %80.00
A0100
Cutters
Inventory Set15
Day0.15
Package
A0110
1.00
Min2.00
Qty Per Cycle Item1
Cycle Time Min2
CapacityItemDay
114.00
Pre OEE Capacity
ItemDay
120.00
OEE Percent %95.00
A0120
Boxes
Inventory Set1000
Day10.00
all
1
12
12
12
12
CT / TT
Chart
Try Add-on Calculations: OEE, Scrap, Activity Time
Drag out the appropriate add-ons to
each center. Be sure to glue the
add-ons to the center.
1
OEE Input Percent
%80
Scrap Percent %10
OEE Input Percent
%95
Activity TimeHr
Day4
Double-click to
change to Hr/
Day.
2
Cycle Time / Takt Time Chart
Min
/Ite
m
0
2
4
6
8
10
12
A0020
Mac
hine
and
form
ca.
.
A0050
Mac
hine
A0070
Polish
A0090
Ass
emble
A0110
Pac
kage
Scrap Loss
Legend
DownStr Loss
OEE Remainder Loss
Cycle Time Per Unit
Activity Takt Time
99Plant Level Mapping

Copyright © 2015 The eVSM Group, All Rights Reserved
A0040
Casting Sets
Inventory Set1000
Day10.00
Machine
A0050
2.00
Min15.00
Qty Per Cycle Set1
Cycle Time Min15
CapacityItemDay
75.04
Pre OEE Capacity
ItemDay
112.00
OEE Percent %75.00
A0060
Machined Sets
Inventory Set50
Day0.50
Polish
A0070
4.00
Min5.00
Qty Per Cycle Item1
Cycle Time Min5
CapacityItemDay
142.80
Pre OEE Capacity
ItemDay
168.00
OEE Percent %95.00
A0010
Spring Steel Rolls
Inventory Roll10
Day5.00
Machine and form
caliper springs
A0020
3.00
Min240.00
Qty Per Cycle Roll1
Cycle Time Hr4
CapacityItemDay
133.00
Pre OEE Capacity
ItemDay
175.00
OEE Percent %85.00
A0030
Springs
Inventory Set150
Day1.50
1
1
1
1
2
2
2
1
Time Summary
Z0010
Takt TimeMinItem
8.40
Total Value Added
Min29.00
Lead Time Day21.68
Value Added Percent
%0.16
Process Time Per Unit
MinItem
21.50
2
Time Summary
Z0150
Takt TimeMinItem
8.40
Total Value Added
Min249.00
Lead Time Day16.95
Value Added Percent
%1.75
Process Time Per Unit
MinItem
13.80
Stations Stn2
OEE Input Percent
%75
Scrap Percent %20
OEE Input Percent
%95
OEE Input Percent
%85
Scrap Percent %10
Step 18: Hide/Show Variables
Click the Views button
in the toolbar.
1
Views
Cumulative Cost
$Item37.00
Added Cost
$Set37
Cumulative Cost
$Item
38.00
Added Cost$
Set1
Cumulative Cost
$Item45.60
Added Cost
$Item0.00
Cumulative Cost
$Item
47.60
Added Cost$
Item2
Cumulative Cost
$Item6.00
Added Cost
$Roll300
Cumulative Cost
$Item
6.25
Added Cost$
set0.25
Cumulative Cost
$Item6.88
Added Cost
$Item0.00
eVSM
Data
QuickMfg
8.02.0000.
0
100

Copyright © 2015 The eVSM Group, All Rights Reserved
5
Week
day
70
Week
Hr
52
Year
Week
Un
its
A0130
Customer
Customer Demand
SetWeek
500
Share % %100
Effective Demand
ItemWeek
500.00
50
Roll
Set
1
Set
Item
A0080
Polished Sets
Inventory Set100
Day1.00
Assemble
A0090
4.00
Min7.00
Qty Per Cycle Item1
Cycle Time Min7
CapacityItemDay
96.00
Pre OEE Capacity
ItemDay
120.00
OEE Percent %80.00
A0100
Cutters
Inventory Set15
Day0.15
Package
A0110
1.00
Min2.00
Qty Per Cycle Item1
Cycle Time Min2
CapacityItemDay
114.00
Pre OEE Capacity
ItemDay
120.00
OEE Percent %95.00
A0120
Boxes
Inventory Set1000
Day10.00
all
1
12
12
12
12
OEE Input Percent
%80
Scrap Percent %10
OEE Input Percent
%95
Activity TimeHr
Day4
Hide/Show Variables
Now that the Added Cost and
Cumulative Cost variables are
visible, fill in the data values
for Added Cost and click the
Solve button.
4
Cumulative Cost
$Item47.60
Added Cost
$Item0.00
Cumulative Cost
$Item
57.48
Added Cost$
Item3
Cumulative Cost
$Item63.22
Added Cost
$Item0.00
Cumulative Cost
$Item
64.22
Added Cost$
Item1
Cumulative Cost
$Item64.22
Added Cost
$Item0.00
Check the Added
Cost visibility box
and click OK.
3
Check the
Cumulative Cost
visibility box.
2
Solve
101Plant Level Mapping

Copyright © 2015 The eVSM Group, All Rights Reserved
A0040
Casting Sets
Inventory Set1000
Day10.00
Machine
A0050
2.00
Min15.00
Qty Per Cycle Set1
Cycle Time Min15
CapacityItemDay
75.04
Pre OEE Capacity
ItemDay
112.00
OEE Percent %75.00
A0060
Machined Sets
Inventory Set50
Day0.50
Polish
A0070
4.00
Min5.00
Qty Per Cycle Item1
Cycle Time Min5
CapacityItemDay
142.80
Pre OEE Capacity
ItemDay
168.00
OEE Percent %95.00
A0010
Spring Steel Rolls
Inventory Roll10
Day5.00
Machine and form
caliper springs
A0020
3.00
Min240.00
Qty Per Cycle Roll1
Cycle Time Hr4
CapacityItemDay
133.00
Pre OEE Capacity
ItemDay
175.00
OEE Percent %85.00
A0030
Springs
Inventory Set150
Day1.50
1
1
1
1
2
2
2
1
Time Summary
Z0010
Takt TimeMinItem
8.40
Total Value Added
Min29.00
Lead Time Day21.68
Value Added Percent
%0.16
Process Time Per Unit
MinItem
21.50
2
Time Summary
Z0150
Takt TimeMinItem
8.40
Total Value Added
Min249.00
Lead Time Day16.95
Value Added Percent
%1.75
Process Time Per Unit
MinItem
13.80
Stations Stn2
OEE Input Percent
%75
Scrap Percent %20
OEE Input Percent
%95
OEE Input Percent
%85
Scrap Percent %10
Step 19:
Cumulative Cost
$Item37.00
Added Cost
$Set37
Cumulative Cost
$Item
38.00
Added Cost$
Set1
Cumulative Cost
$Item45.60
Added Cost
$Item0.00
Cumulative Cost
$Item
47.60
Added Cost$
Item2
Cumulative Cost
$Item6.00
Added Cost
$Roll300
Cumulative Cost
$Item
6.25
Added Cost$
set0.25
Cumulative Cost
$Item6.88
Added Cost
$Item0.00
Cost Chart
Make sure the fractional
units for the Added Cost
variable match. Double-
click to change it.
1
Cost Chart
Use the right mouse button
menu of chart icon and select
“Plot Chart”
Drag out the Cost
Chart from the
Quick Mfg stencil.
3
2
Cost
Chart
eVSM
Data
QuickMfg
8.02.0000.
0
102

Copyright © 2015 The eVSM Group, All Rights Reserved
5
Week
day
70
Week
Hr
52
Year
Week
Un
its
A0130
Customer
Customer Demand
SetWeek
500
Share % %100
Effective Demand
ItemWeek
500.00
50
Roll
Set
1
Set
Item
A0080
Polished Sets
Inventory Set100
Day1.00
Assemble
A0090
4.00
Min7.00
Qty Per Cycle Item1
Cycle Time Min7
CapacityItemDay
96.00
Pre OEE Capacity
ItemDay
120.00
OEE Percent %80.00
A0100
Cutters
Inventory Set15
Day0.15
Package
A0110
1.00
Min2.00
Qty Per Cycle Item1
Cycle Time Min2
CapacityItemDay
114.00
Pre OEE Capacity
ItemDay
120.00
OEE Percent %95.00
A0120
Boxes
Inventory Set1000
Day10.00
all
1
12
12
12
12
OEE Input Percent
%80
Scrap Percent %10
OEE Input Percent
%95
Activity TimeHr
Day4
Cumulative Cost
$Item47.60
Added Cost
$Item0.00
Cumulative Cost
$Item
57.48
Added Cost$
Item3
Cumulative Cost
$Item63.22
Added Cost
$Item0.00
Cumulative Cost
$Item
64.22
Added Cost$
Item1
Cumulative Cost
$Item64.22
Added Cost
$Item0.00
Cost Chart
Cost Chart
$/Ite
m
0
10
20
30
40
50
60
70
A0010
Spr
ing
Ste
el R
olls
A0020
Mac
hine
and
form
ca.
.
A0030
Spr
ings
A0040
Cas
ting
Set
s
A0050
Mac
hine
A0060
Mac
hine
d Set
s
A0070
Polish
A0080
Polishe
d Set
s
A0090
Ass
emble
A0100
Cut
ters
A0110
Pac
kage
A0120
Box
es
Added Scrap Cost
Legend
Added Cost
Cumulative Cost
103Plant Level Mapping

Copyright © 2015 The eVSM Group, All Rights Reserved
A0040
Casting Sets
Inventory Set1000
Day10.00
Machine
A0050
2.00
Min15.00
Qty Per Cycle Set1
Cycle Time Min15
CapacityItemDay
75.04
Pre OEE Capacity
ItemDay
112.00
OEE Percent %75.00
A0060
Machined Sets
Inventory Set50
Day0.50
Polish
A0070
4.00
Min5.00
Qty Per Cycle Item1
Cycle Time Min5
CapacityItemDay
142.80
Pre OEE Capacity
ItemDay
168.00
OEE Percent %95.00
A0010
Spring Steel Rolls
Inventory Roll10
Day5.00
Machine and form
caliper springs
A0020
3.00
Min240.00
Qty Per Cycle Roll1
Cycle Time Hr4
CapacityItemDay
133.00
Pre OEE Capacity
ItemDay
175.00
OEE Percent %85.00
A0030
Springs
Inventory Set150
Day1.50
1
1
1
1
2
2
2
1
Time Summary
Z0010
Takt TimeMinItem
8.40
Total Value Added
Min29.00
Lead Time Day21.68
Value Added Percent
%0.16
Process Time Per Unit
MinItem
21.50
2
Time Summary
Z0150
Takt TimeMinItem
8.40
Total Value Added
Min249.00
Lead Time Day16.95
Value Added Percent
%1.75
Process Time Per Unit
MinItem
13.80
Stations Stn2
OEE Input Percent
%75
Scrap Percent %20
OEE Input Percent
%95
OEE Input Percent
%85
Scrap Percent %10
Cumulative Cost
$Item37.00
Added Cost
$Set37
Cumulative Cost
$Item
38.00
Added Cost$
Set1
Cumulative Cost
$Item45.60
Added Cost
$Item0.00
Cumulative Cost
$Item
47.60
Added Cost$
Item2
Cumulative Cost
$Item6.00
Added Cost
$Roll300
Cumulative Cost
$Item
6.25
Added Cost$
set0.25
Cumulative Cost
$Item6.88
Added Cost
$Item0.00
Step 20: Plot Lead Time Chart
Use the right mouse
button menu of chart
icon and select “Plot
Ladder Chart”
Drag out Lead
Time Chart icon.
2
1
See how the lead times
for the two paths match
the Time Summaries
3
Lead
Time
all
Lead Time Chart
eVSM
Data
QuickMfg
8.02.0000.
0
Lead Time Summary
0 5 10 15 20
A0040
Casting Sets
A0060
Machined Sets
A0080
Polished Sets
A0100
Cutters
A0120
Boxes
21.68
A0010
Spring Steel
Rolls
A0020
Machine and
form caliper
springs
A0030
Springs
A0100
Cutters
A0120
Boxes
2
16.95
104

Copyright © 2015 The eVSM Group, All Rights Reserved
5
Week
day
70
Week
Hr
52
Year
Week
Un
its
A0130
Customer
Customer Demand
SetWeek
500
Share % %100
Effective Demand
ItemWeek
500.00
50
Roll
Set
1
Set
Item
A0080
Polished Sets
Inventory Set100
Day1.00
Assemble
A0090
4.00
Min7.00
Qty Per Cycle Item1
Cycle Time Min7
CapacityItemDay
96.00
Pre OEE Capacity
ItemDay
120.00
OEE Percent %80.00
A0100
Cutters
Inventory Set15
Day0.15
Package
A0110
1.00
Min2.00
Qty Per Cycle Item1
Cycle Time Min2
CapacityItemDay
114.00
Pre OEE Capacity
ItemDay
120.00
OEE Percent %95.00
A0120
Boxes
Inventory Set1000
Day10.00
all
1
12
12
12
12
OEE Input Percent
%80
Scrap Percent %10
OEE Input Percent
%95
Activity TimeHr
Day4
Cumulative Cost
$Item47.60
Added Cost
$Item0.00
Cumulative Cost
$Item
57.48
Added Cost$
Item3
Cumulative Cost
$Item63.22
Added Cost
$Item0.00
Cumulative Cost
$Item
64.22
Added Cost$
Item1
Cumulative Cost
$Item64.22
Added Cost
$Item0.00
Plot Lead Time Chart
Lead Time SummaryDay
25
1
Non Value Added
Legend
Value Added
105Plant Level Mapping

Copyright © 2015 The eVSM Group, All Rights Reserved
A0040
Casting Sets
Inventory Set1000
Day10.00
Machine
A0050
2.00
Min15.00
Qty Per Cycle Set1
Cycle Time Min15
CapacityItemDay
75.04
Pre OEE Capacity
ItemDay
112.00
OEE Percent %75.00
A0060
Machined Sets
Inventory Set50
Day0.50
Polish
A0070
4.00
Min5.00
Qty Per Cycle Item1
Cycle Time Min5
CapacityItemDay
142.80
Pre OEE Capacity
ItemDay
168.00
OEE Percent %95.00
A0010
Spring Steel Rolls
Inventory Roll10
Day5.00
Machine and form
caliper springs
A0020
3.00
Min240.00
Qty Per Cycle Roll1
Cycle Time Hr4
CapacityItemDay
133.00
Pre OEE Capacity
ItemDay
175.00
OEE Percent %85.00
A0030
Springs
Inventory Set150
Day1.50
1
1
1
1
2
2
2
1
Time Summary
Z0010
Takt TimeMinItem
8.40
Total Value Added
Min29.00
Lead Time Day21.68
Value Added Percent
%0.16
Process Time Per Unit
MinItem
21.50
2
Time Summary
Z0150
Takt TimeMinItem
8.40
Total Value Added
Min249.00
Lead Time Day16.95
Value Added Percent
%1.75
Process Time Per Unit
MinItem
13.80
Stations Stn2
OEE Input Percent
%75
Scrap Percent %20
OEE Input Percent
%95
OEE Input Percent
%85
Scrap Percent %10
Cumulative Cost
$Item37.00
Added Cost
$Set37
Cumulative Cost
$Item
38.00
Added Cost$
Set1
Cumulative Cost
$Item45.60
Added Cost
$Item0.00
Cumulative Cost
$Item
49.27
Added Cost$
Item2
Cumulative Cost
$Item6.00
Added Cost
$Roll300
Cumulative Cost
$Item
6.25
Added Cost$
set0.25
Cumulative Cost
$Item6.88
Added Cost
$Item0.00
Step 21: Resource Modeling
Resource PTMinItem5
Resource Center
Add Resource Pipes for the
appropriate Resource Centers to
Activity Centers. Make sure the
correct unit is changed for the
data on the Resource Pipe.
4
eVSM
Data
QuickMfg
8.02.0000.
0
106
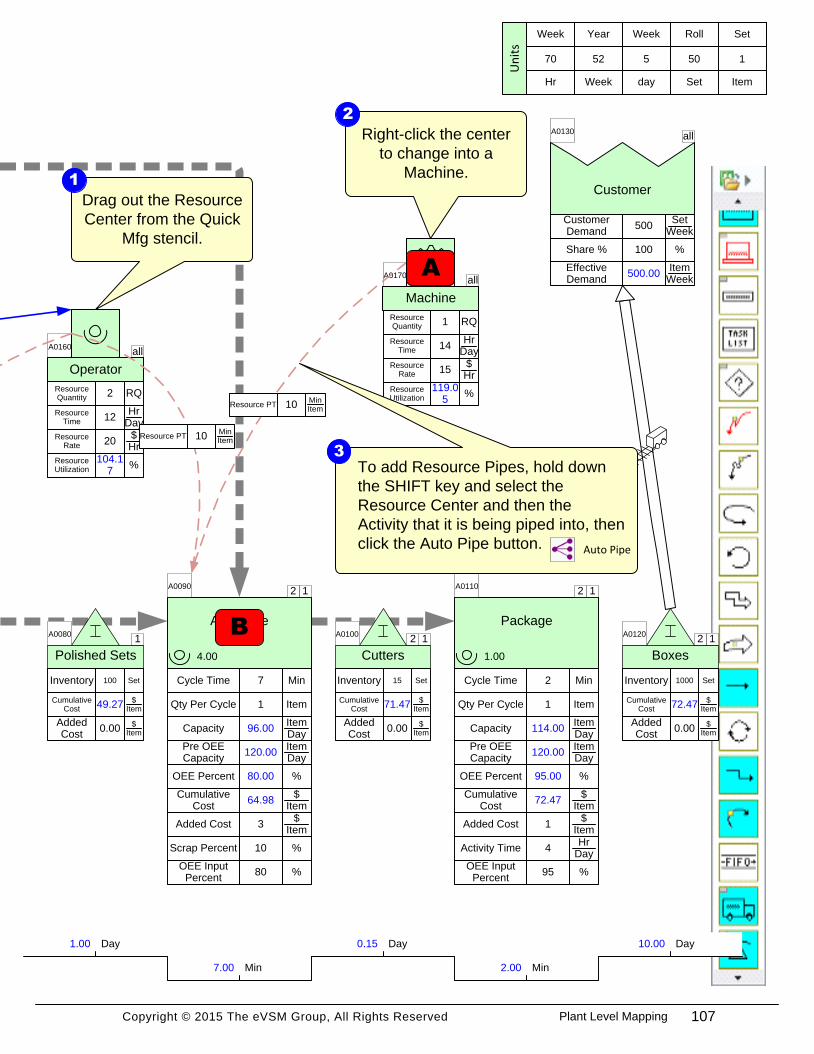
Copyright © 2015 The eVSM Group, All Rights Reserved
5
Week
day
70
Week
Hr
52
Year
Week
Un
its
A0130
Customer
Customer Demand
SetWeek
500
Share % %100
Effective Demand
ItemWeek
500.00
50
Roll
Set
1
Set
Item
A0080
Polished Sets
Inventory Set100
Day1.00
Assemble
A0090
4.00
Min7.00
Qty Per Cycle Item1
Cycle Time Min7
CapacityItemDay
96.00
Pre OEE Capacity
ItemDay
120.00
OEE Percent %80.00
A0100
Cutters
Inventory Set15
Day0.15
Package
A0110
1.00
Min2.00
Qty Per Cycle Item1
Cycle Time Min2
CapacityItemDay
114.00
Pre OEE Capacity
ItemDay
120.00
OEE Percent %95.00
A0120
Boxes
Inventory Set1000
Day10.00
all
1
12
12
12
12
OEE Input Percent
%80
Scrap Percent %10
OEE Input Percent
%95
Activity TimeHr
Day4
Cumulative Cost
$Item49.27
Added Cost
$Item0.00
Cumulative Cost
$Item
64.98
Added Cost$
Item3
Cumulative Cost
$Item71.47
Added Cost
$Item0.00
Cumulative Cost
$Item
72.47
Added Cost$
Item1
Cumulative Cost
$Item72.47
Added Cost
$Item0.00
Resource Modeling
Drag out the Resource
Center from the Quick
Mfg stencil.
1
allA0160
Operator
Resource Utilization %
104.17
Resource Quantity RQ2
Resource Time
HrDay
12
Resource Rate
$Hr
20Resource PT
MinItem10
allA0170
Machine
Resource Utilization %
119.05
Resource Quantity RQ1
Resource Time
HrDay
14
Resource Rate
$Hr
15
Resource PTMinItem10
Right-click the center
to change into a
Machine.
2
To add Resource Pipes, hold down
the SHIFT key and select the
Resource Center and then the
Activity that it is being piped into, then
click the Auto Pipe button.
3
Auto Pipe
A
B
107Plant Level Mapping

Copyright © 2015 The eVSM Group, All Rights Reserved
A0040
Casting Sets
Inventory Set1000
Day10.00
Machine
A0050
2.00
Min15.00
Qty Per Cycle Set1
Cycle Time Min15
CapacityItemDay
75.04
Pre OEE Capacity
ItemDay
112.00
OEE Percent %75.00
A0060
Machined Sets
Inventory Set50
Day0.50
Polish
A0070
4.00
Min5.00
Qty Per Cycle Item1
Cycle Time Min5
CapacityItemDay
142.80
Pre OEE Capacity
ItemDay
168.00
OEE Percent %95.00
A0010
Spring Steel Rolls
Inventory Roll10
Day5.00
Machine and form
caliper springs
A0020
3.00
Min240.00
Qty Per Cycle Roll1
Cycle Time Hr4
CapacityItemDay
133.00
Pre OEE Capacity
ItemDay
175.00
OEE Percent %85.00
A0030
Springs
Inventory Set150
Day1.50
1
1
1
1
2
2
2
1
Time Summary
Z0010
Takt TimeMinItem
8.40
Total Value Added
Min29.00
Lead Time Day21.68
Value Added Percent
%0.16
Process Time Per Unit
MinItem
21.50
2
Time Summary
Z0150
Takt TimeMinItem
8.40
Total Value Added
Min249.00
Lead Time Day16.95
Value Added Percent
%1.75
Process Time Per Unit
MinItem
13.80
Stations Stn2
OEE Input Percent
%75
Scrap Percent %20
OEE Input Percent
%95
OEE Input Percent
%85
Scrap Percent %10
Cumulative Cost
$Item37.00
Added Cost
$Set37
Cumulative Cost
$Item
38.00
Added Cost$
Set1
Cumulative Cost
$Item45.60
Added Cost
$Item0.00
Cumulative Cost
$Item
49.27
Added Cost$
Item2
Cumulative Cost
$Item6.00
Added Cost
$Roll300
Cumulative Cost
$Item
6.25
Added Cost$
set0.25
Cumulative Cost
$Item6.88
Added Cost
$Item0.00
Step 22: Resource Balance Chart
Resource PTMinItem5
Click the Solve button
to update the new
calculations.
1
Solve
Resource Balance Chart
Resource
Balance
Use the right mouse
button menu of chart
icon and select “Plot
Chart”
Drag out the
Resource Balance
Chart shape.
3
2
eVSM
Data
QuickMfg
8.02.0000.
0
108

Copyright © 2015 The eVSM Group, All Rights Reserved
5
Week
day
70
Week
Hr
52
Year
Week
Un
its
A0130
Customer
Customer Demand
SetWeek
500
Share % %100
Effective Demand
ItemWeek
500.00
50
Roll
Set
1
Set
Item
A0080
Polished Sets
Inventory Set100
Day1.00
Assemble
A0090
4.00
Min7.00
Qty Per Cycle Item1
Cycle Time Min7
CapacityItemDay
96.00
Pre OEE Capacity
ItemDay
120.00
OEE Percent %80.00
A0100
Cutters
Inventory Set15
Day0.15
Package
A0110
1.00
Min2.00
Qty Per Cycle Item1
Cycle Time Min2
CapacityItemDay
114.00
Pre OEE Capacity
ItemDay
120.00
OEE Percent %95.00
A0120
Boxes
Inventory Set1000
Day10.00
all
1
12
12
12
12
OEE Input Percent
%80
Scrap Percent %10
OEE Input Percent
%95
Activity TimeHr
Day4
Cumulative Cost
$Item49.27
Added Cost
$Item0.00
Cumulative Cost
$Item
64.98
Added Cost$
Item3
Cumulative Cost
$Item71.47
Added Cost
$Item0.00
Cumulative Cost
$Item
72.47
Added Cost$
Item1
Cumulative Cost
$Item72.47
Added Cost
$Item0.00
Resource Balance Chart
allA0160
Operator
Resource Utilization %
104.17
Resource Quantity RQ2
Resource Time
HrDay
12
Resource Rate
$Hr
20
Resource PTMinItem10
allA0170
Machine
Resource Utilization %
119.05
Resource Quantity RQ1
Resource Time
HrDay
14
Resource Rate
$Hr
15
Resource PTMinItem10
Resource Balance Chart
Min
/Da
y
0
200
400
600
800
1000
1200
1400
1600
A0160
Ope
rato
r
A0170
Mac
hine
Polish
Assemble
Assemble
Resource Usage PT
Legend
Effective Resource Time
109Plant Level Mapping

Copyright © 2015 The eVSM Group, All Rights Reserved
A0040
Casting Sets
Inventory Set1000
Day10.00
Machine
A0050
2.00
Min15.00
Qty Per Cycle Set1
Cycle Time Min15
CapacityItemDay
75.04
Pre OEE Capacity
ItemDay
112.00
OEE Percent %75.00
A0060
Machined Sets
Inventory Set50
Day0.50
Polish
A0070
4.00
Min5.00
Qty Per Cycle Item1
Cycle Time Min5
CapacityItemDay
142.80
Pre OEE Capacity
ItemDay
168.00
OEE Percent %95.00
A0010
Spring Steel Rolls
Inventory Roll10
Day5.00
Machine and form
caliper springs
A0020
3.00
Min240.00
Qty Per Cycle Roll1
Cycle Time Hr4
CapacityItemDay
133.00
Pre OEE Capacity
ItemDay
175.00
OEE Percent %85.00
A0030
Springs
Inventory Set150
Day1.50
1
1
1
1
2
2
2
1
Time Summary
Z0010
Takt TimeMinItem
8.40
Total Value Added
Min29.00
Lead Time Day21.68
Value Added Percent
%0.16
Process Time Per Unit
MinItem
21.50
2
Time Summary
Z0150
Takt TimeMinItem
8.40
Total Value Added
Min249.00
Lead Time Day16.95
Value Added Percent
%1.75
Process Time Per Unit
MinItem
13.80
Stations Stn2
OEE Input Percent
%75
Scrap Percent %20
OEE Input Percent
%95
OEE Input Percent
%85
Scrap Percent %10
Cumulative Cost
$Item37.00
Added Cost
$Set37
Cumulative Cost
$Item
38.00
Added Cost$
Set1
Cumulative Cost
$Item45.60
Added Cost
$Item0.00
Cumulative Cost
$Item
49.27
Added Cost$
Item2
Cumulative Cost
$Item6.00
Added Cost
$Roll300
Cumulative Cost
$Item
6.25
Added Cost$
set0.25
Cumulative Cost
$Item6.88
Added Cost
$Item0.00
Step 23: Kaizen Improvements
Resource PTMinItem5
Very high level of
Casting Set
inventory
001
Machine process
is a bottleneck
because of low
OEE
002
Right click kaizen and select “Edit
Kaizen”. Add relevant information in the
Kaizen Properties form, such as Impact
and Ease of Implementation values.
2
Kaizen
Data
eVSM
Data
QuickMfg
8.02.0000.
0
110

Copyright © 2015 The eVSM Group, All Rights Reserved
5
Week
day
70
Week
Hr
52
Year
Week
Un
its
A0130
Customer
Customer Demand
SetWeek
500
Share % %100
Effective Demand
ItemWeek
500.00
50
Roll
Set
1
Set
Item
A0080
Polished Sets
Inventory Set100
Day1.00
Assemble
A0090
4.00
Min7.00
Qty Per Cycle Item1
Cycle Time Min7
CapacityItemDay
96.00
Pre OEE Capacity
ItemDay
120.00
OEE Percent %80.00
A0100
Cutters
Inventory Set15
Day0.15
Package
A0110
1.00
Min2.00
Qty Per Cycle Item1
Cycle Time Min2
CapacityItemDay
114.00
Pre OEE Capacity
ItemDay
120.00
OEE Percent %95.00
A0120
Boxes
Inventory Set1000
Day10.00
all
1
12
12
12
12
OEE Input Percent
%80
Scrap Percent %10
OEE Input Percent
%95
Activity TimeHr
Day4
Cumulative Cost
$Item49.27
Added Cost
$Item0.00
Cumulative Cost
$Item
64.98
Added Cost$
Item3
Cumulative Cost
$Item71.47
Added Cost
$Item0.00
Cumulative Cost
$Item
72.47
Added Cost$
Item1
Cumulative Cost
$Item72.47
Added Cost
$Item0.00
Kaizen Improvements
allA0160
Operator
Resource Utilization %
104.17
Resource Quantity RQ2
Resource Time
HrDay
12
Resource Rate
$Hr
20
Resource PTMinItem10
allA0170
Machine
Resource Utilization %
119.05
Resource Quantity RQ1
Resource Time
HrDay
14
Resource Rate
$Hr
15
Resource PTMinItem10
Reduce assemble
CT
003
Increase delivery
frequency to
customer
004
Drag out Kaizen
starbursts from the
Quick Extras stencil.
1
Click the Kaizen Export button
in the toolbar to create a kaizen
report in Excel.
3
Kaizen Export
111Plant Level Mapping

Copyright © 2015 The eVSM Group, All Rights Reserved
A0040
Casting Sets
Inventory Set1000
Day10.00
Machine
A0050
2.00
Min15.00
Qty Per Cycle Set1
Cycle Time Min15
CapacityItemDay
75.04
Pre OEE Capacity
ItemDay
112.00
OEE Percent %75.00
A0060
Machined Sets
Inventory Set50
Day0.50
Polish
A0070
4.00
Min5.00
Qty Per Cycle Item1
Cycle Time Min5
CapacityItemDay
142.80
Pre OEE Capacity
ItemDay
168.00
OEE Percent %95.00
A0010
Spring Steel Rolls
Inventory Roll10
Day5.00
Machine and form
caliper springs
A0020
3.00
Min240.00
Qty Per Cycle Roll1
Cycle Time Hr4
CapacityItemDay
133.00
Pre OEE Capacity
ItemDay
175.00
OEE Percent %85.00
A0030
Springs
Inventory Set150
Day1.50
1
1
1
1
2
2
2
1
Time Summary
Z0010
Takt TimeMinItem
8.40
Total Value Added
Min29.00
Lead Time Day21.68
Value Added Percent
%0.16
Process Time Per Unit
MinItem
21.50
2
Time Summary
Z0150
Takt TimeMinItem
8.40
Total Value Added
Min249.00
Lead Time Day16.95
Value Added Percent
%1.75
Process Time Per Unit
MinItem
13.80
Stations Stn2
OEE Input Percent
%75
Scrap Percent %20
OEE Input Percent
%95
OEE Input Percent
%85
Scrap Percent %10
Cumulative Cost
$Item37.00
Added Cost
$Set37
Cumulative Cost
$Item
38.00
Added Cost$
Set1
Cumulative Cost
$Item45.60
Added Cost
$Item0.00
Cumulative Cost
$Item
49.27
Added Cost$
Item2
Cumulative Cost
$Item6.00
Added Cost
$Roll300
Cumulative Cost
$Item
6.25
Added Cost$
set0.25
Cumulative Cost
$Item6.88
Added Cost
$Item0.00
Step 24: Kaizen Impact Matrix
Resource PTMinItem5
Very high level of
Casting Set
inventory
001
Machine process
is a bottleneck
because of low
OEE
002
Kaizen
Data
eVSM
Data
QuickMfg
8.02.0000.
0
5
4
3
2
1
1 2 3 4 5
Ease Of Implementation
Imp
act O
n V
alu
e
Kaizen Impact Matrix
001
002
003
004
112

Copyright © 2015 The eVSM Group, All Rights Reserved
5
Week
day
70
Week
Hr
52
Year
Week
Un
its
A0130
Customer
Customer Demand
SetWeek
500
Share % %100
Effective Demand
ItemWeek
500.00
50
Roll
Set
1
Set
Item
A0080
Polished Sets
Inventory Set100
Day1.00
Assemble
A0090
4.00
Min7.00
Qty Per Cycle Item1
Cycle Time Min7
CapacityItemDay
96.00
Pre OEE Capacity
ItemDay
120.00
OEE Percent %80.00
A0100
Cutters
Inventory Set15
Day0.15
Package
A0110
1.00
Min2.00
Qty Per Cycle Item1
Cycle Time Min2
CapacityItemDay
114.00
Pre OEE Capacity
ItemDay
120.00
OEE Percent %95.00
A0120
Boxes
Inventory Set1000
Day10.00
all
1
12
12
12
12
OEE Input Percent
%80
Scrap Percent %10
OEE Input Percent
%95
Activity TimeHr
Day4
Cumulative Cost
$Item49.27
Added Cost
$Item0.00
Cumulative Cost
$Item
64.98
Added Cost$
Item3
Cumulative Cost
$Item71.47
Added Cost
$Item0.00
Cumulative Cost
$Item
72.47
Added Cost$
Item1
Cumulative Cost
$Item72.47
Added Cost
$Item0.00
Kaizen Impact Matrix
allA0160
Operator
Resource Utilization %
104.17
Resource Quantity RQ2
Resource Time
HrDay
12
Resource Rate
$Hr
20
Resource PTMinItem10
allA0170
Machine
Resource Utilization %
119.05
Resource Quantity RQ1
Resource Time
HrDay
14
Resource Rate
$Hr
15
Resource PTMinItem10
Reduce assemble
CT
003
Increase delivery
frequency to
customer
004
Drag out the Kaizen
Impact Matrix and
right-click to plot.
1
Kaizen
Impact
Matrix
113Plant Level Mapping

Copyright © 2015 The eVSM Group, All Rights Reserved
eVSM
Data
QuickMfg
7.30.0182.
2
A0040
Casting Sets
Inventory Set1000
Day10.00
Machine
A0050
2.00
Min15.00
Qty Per Cycle Set1
Cycle Time Min15
CapacityItemDay
75.04
Pre OEE Capacity
ItemDay
112.00
OEE Percent %75.00
A0060
Machined Sets
Inventory Set50
Day0.50
Polish
A0070
4.00
Min5.00
Qty Per Cycle Item1
Cycle Time Min5
CapacityItemDay
142.80
Pre OEE Capacity
ItemDay
168.00
OEE Percent %95.00
A0010
Spring Steel Rolls
Inventory Roll10
Day5.00
Machine and form
caliper springs
A0020
3.00
Min240.00
Qty Per Cycle Roll1
Cycle Time Hr4
CapacityItemDay
133.00
Pre OEE Capacity
ItemDay
175.00
OEE Percent %85.00
A0030
Springs
Inventory Set150
Day1.50
1
1
1
1
2
2
2
1
Time Summary
Z0010
Takt TimeMinItem
8.40
Total Value Added
Min29.00
Lead Time Day21.68
Value Added Percent
%0.16
Process Time Per Unit
MinItem
21.50
2
Time Summary
Z0150
Takt TimeMinItem
8.40
Total Value Added
Min249.00
Lead Time Day16.95
Value Added Percent
%1.75
Process Time Per Unit
MinItem
13.80
Stations Stn2
OEE Input Percent
%75
Scrap Percent %20
OEE Input Percent
%95
OEE Input Percent
%85
Scrap Percent %10
Cumulative Cost
$Item37.00
Added Cost
$Set37
Cumulative Cost
$Item
38.00
Added Cost$
Set1
Cumulative Cost
$Item45.60
Added Cost
$Item0.00
Cumulative Cost
$Item
49.27
Added Cost$
Item2
Cumulative Cost
$Item6.00
Added Cost
$Roll300
Cumulative Cost
$Item
6.25
Added Cost$
Set0.25
Cumulative Cost
$Item6.88
Added Cost
$Item0.00
Resource PTMinItem5
ACME Plant – Current State
114

Copyright © 2015 The eVSM Group, All Rights Reserved
5
Week
day
70
Week
Hr
52
Year
Week
Un
its
A0130
Customer
Customer Demand
SetWeek
500
Share % %100
Effective Demand
ItemWeek
500.00
50
Roll
Set
1
Set
Item
A0080
Polished Sets
Inventory Set100
Day1.00
Assemble
A0090
4.00
Min7.00
Qty Per Cycle Item1
Cycle Time Min7
CapacityItemDay
96.00
Pre OEE Capacity
ItemDay
120.00
OEE Percent %80.00
A0100
Cutters
Inventory Set15
Day0.15
Package
A0110
1.00
Min2.00
Qty Per Cycle Item1
Cycle Time Min2
CapacityItemDay
114.00
Pre OEE Capacity
ItemDay
120.00
OEE Percent %95.00
A0120
Boxes
Inventory Set1000
Day10.00
all
1
12
12
12
12
OEE Input Percent
%80
Scrap Percent %10
OEE Input Percent
%95
Activity TimeHr
Day4
Cumulative Cost
$Item49.27
Added Cost
$Item0.00
Cumulative Cost
$Item
64.98
Added Cost$
Item3
Cumulative Cost
$Item71.47
Added Cost
$Item0.00
Cumulative Cost
$Item
72.47
Added Cost$
Item1
Cumulative Cost
$Item72.47
Added Cost
$Item0.00
allA0160
Operator
Resource Utilization %
104.17
Resource Quantity RQ2
Resource Time
HrDay
12
Resource Rate
$Hr
20
Resource PTMinItem10
allA0170
Machine
Resource Utilization %
119.05
Resource Quantity RQ1
Resource Time
HrDay
14
Resource Rate
$Hr
15
Resource PTMinItem10
all
Inventory Summary
Z0130
Total Inventory Value
$121782.
50
all
Scrap Costs
Z0030
Total Scrap Cost
$Day
1472.25
115Plant Level Mapping

Copyright © 2015 The eVSM Group, All Rights Reserved
ACME – Resource Modeling
Exercise
With your group, read the information below and then:
1. Model the resources for the activity.
2. Show the data associated with the resource handling as well as resource pipe data.
3. Calculate the map.
4. Identify what charts would be useful to visualize the value stream and mark these up.
5. Identify where there is a bottleneck.
Background and Overview
ACME sells Surgical Cutters which are made from a combination of springs and kits. The plant
line first creates the polished kits from the casting sets and then joins the springs in the Assemble
step. You take a second value stream walk with the plant supervisor to model the resource
allocation for the activity processes.
Value Stream Walk
The plant supervisor explains how resources are coming from technicians as well as machines.
You first notice that the Assemble activity has two different resources being piped into it. The
first is a machine that runs 14 hours a day with a resource quantity of 1 at a cost of $15 an hour.
The second resource is an operator that works 12 hours a days with a resource quantity of 2 at
$20 an hour. Both have a resource process time of 10 minutes. The operator is also shared at the
Polish activity with a resource process time of 5 minutes.
116

Copyright © 2015 The eVSM Group, All Rights Reserved 117Plant Level Mapping

Copyright © 2015 The eVSM Group, All Rights Reserved
Multi-Station Workshop
BSQI has augmented their old machine with a new machine for making machined kits to increase
capacity.
Insert a new page and use the Open button to select the Mfg Multi Station Wizard to calculate the
equivalent capacity from the two machines as shown below.
14
Day
Hr
Un
its
50
Roll
Set
1
Set
Item
Old Machine
1A0040
Qty Per Cycle_M
set1
Cycle Time_M Min10
Cycle Time Per Item
Min10.00
Stations_M Stn1
Activity Time_M
HrDay
14
OEE Percent_M
%80
CT Capacity Per Day
Item84.00
QPC Contributor
ItSq84.00
All Stations Time
HrDay
14.00
Capacity Per Day
Item67.20
New Machine
1A0050
Qty Per Cycle_M
set1
Cycle Time_M Min20
Cycle Time Per Item
Min20.00
Stations_M Stn1
Activity Time_M
HrDay
14
OEE Percent_M
%70
CT Capacity Per Day
Item42.00
QPC Contributor
ItSq42.00
All Stations Time
HrDay
14.00
Capacity Per Day
Item29.40
Multiple Station Equiv.
1Z0060
Stations Stn2.00
MS Capacity Per Day
Item96.60
Activity TimeHr
Day14.00
MS CT Capacity Per Day Item126.00
MS Cycle Time Per Item Min6.67
OEE Percent %76.67
Qty Per Cycle set1.00
Cycle Time Min13.33
118

Copyright © 2015 The eVSM Group, All Rights Reserved
Improvement Workshop
Part C
1. Identify any improvements that can be made to the process.
2. Use kaizen bursts on the map, to capture and prioritize all the improvements you identified.
3. Using Map Copy as a starting point, design a future state map for ACME Surgical Cutter
production.
119Plant Level Mapping

Copyright © 2015 The eVSM Group, All Rights Reserved
eVSM
Data
QuickMfg
7.30.0182.
2
A0040
Casting Sets
Inventory Set500
Day5.00
Machine
A0050
2.00
Min10.43
Qty Per Cycle Set1
Cycle Time Min10.43
CapacityItemDay
129.31
Pre OEE Capacity
ItemDay
161.07
OEE Percent %84.78
A0060
Machined Sets
Inventory Set50
Day0.50
Polish
A0070
4.00
Min5.00
Qty Per Cycle Item1
Cycle Time Min5
CapacityItemDay
151.20
Pre OEE Capacity
ItemDay
168.00
OEE Percent %95.00
A0010
Spring Steel Rolls
Inventory Roll2
Day1.00
Machine and form
caliper springs
A0020
3.00
Min240.00
Qty Per Cycle Roll1
Cycle Time Hr4
CapacityItemDay
140.88
Pre OEE Capacity
ItemDay
175.00
OEE Percent %85.00
A0030
Springs
Inventory Set100
Day1.00
1
1
1
1
2
2
2
1
Time Summary
Z0010
Takt TimeMinItem
8.40
Total Value Added
Min24.43
Lead Time Day7.88
Value Added Percent
%0.37
Process Time Per Unit
MinItem
19.22
2
Time Summary
Z0150
Takt TimeMinItem
8.40
Total Value Added
Min249.00
Lead Time Day3.65
Value Added Percent
%8.13
Process Time Per Unit
MinItem
13.80
Stations Stn2
OEE Input Percent
%84.78
Scrap Percent %10
OEE Input Percent
%95
OEE Input Percent
%85
Scrap Percent %10
Cumulative Cost
$Item37.00
Added Cost
$Set37
Cumulative Cost
$Item
38.00
Added Cost$
Set1
Cumulative Cost
$Item41.80
Added Cost
$Item0.00
Cumulative Cost
$Item
45.47
Added Cost$
Item2
Cumulative Cost
$Item6.00
Added Cost
$Roll300
Cumulative Cost
$Item
6.25
Added Cost$
Set0.25
Cumulative Cost
$Item6.88
Added Cost
$Item0.00
Resource PTMinItem5
ACME Plant – Future State
Springs WIP will go
down because
Assemble no longer
a bottleneck.
120

Copyright © 2015 The eVSM Group, All Rights Reserved
5
Week
day
70
Week
Hr
52
Year
Week
Un
its
A0130
Customer
Customer Demand
SetWeek
500
Share % %100
Effective Demand
ItemWeek
500.00
50
Roll
Set
1
Set
Item
A0080
Polished Sets
Inventory Set100
Day1.00
Assemble
A0090
4.00
Min7.00
Qty Per Cycle Item1
Cycle Time Min7
CapacityItemDay
102.00
Pre OEE Capacity
ItemDay
120.00
OEE Percent %85.00
A0100
Cutters
Inventory Set15
Day0.15
Package
A0110
1.00
Min2.00
Qty Per Cycle Item1
Cycle Time Min2
CapacityItemDay
114.00
Pre OEE Capacity
ItemDay
120.00
OEE Percent %95.00
A0120
Boxes
Inventory Set120
Day1.20
all
1
12
12
12
12
OEE Input Percent
%85
Scrap Percent %5
OEE Input Percent
%95
Activity TimeHr
Day4
Cumulative Cost
$Item45.47
Added Cost
$Item0.00
Cumulative Cost
$Item
61.18
Added Cost$
Item3
Cumulative Cost
$Item64.23
Added Cost
$Item0.00
Cumulative Cost
$Item
65.23
Added Cost$
Item1
Cumulative Cost
$Item65.23
Added Cost
$Item0.00
allA0160
Operator
Resource Utilization %
104.17
Resource Quantity RQ2
Resource Time
HrDay
12
Resource Rate
$Hr
20
Resource PTMinItem10
allA0170
Machine
Resource Utilization %
119.05
Resource Quantity RQ1
Resource Time
HrDay
14
Resource Rate
$Hr
15
Resource PTMinItem10
all
Inventory Summary
Z0130
Total Inventory Value
$35215.7
2
all
Scrap Costs
Z0030
Total Scrap Cost
$Day
748.38
Springs WIP will go
down because
Assemble no longer
a bottleneck.
Cost savings
because of
reduced Scrap.
121Plant Level Mapping
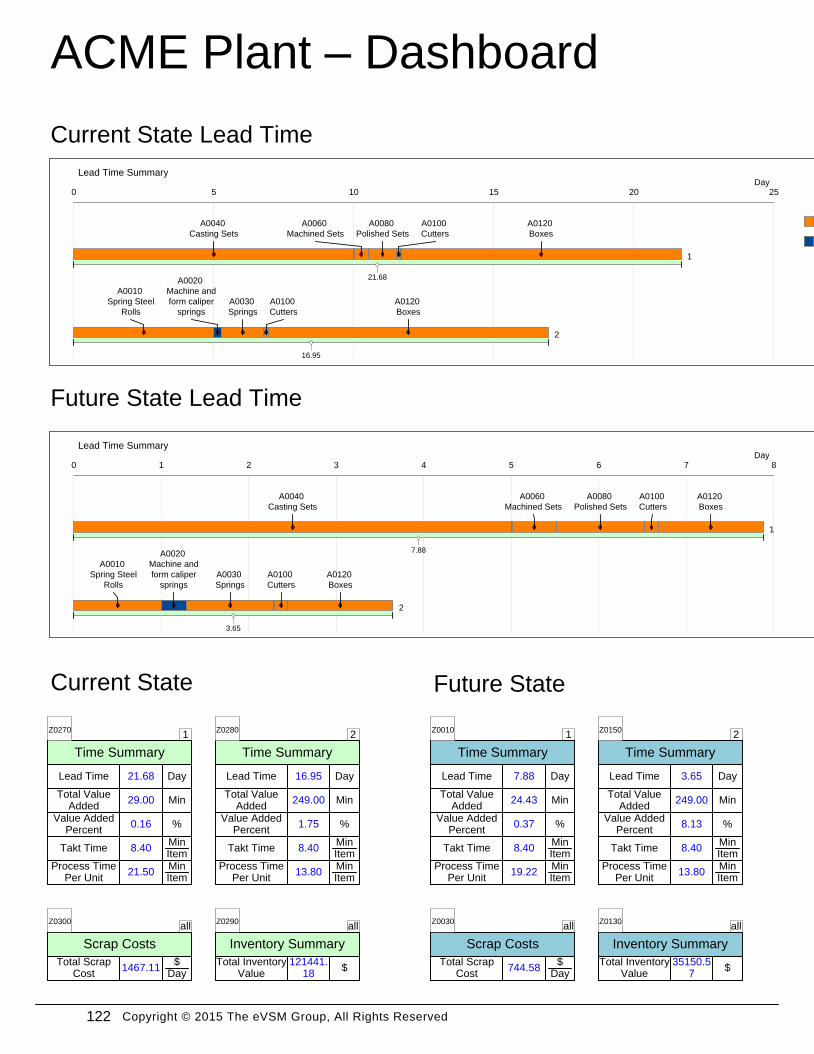
Copyright © 2015 The eVSM Group, All Rights Reserved
ACME Plant – Dashboard
Current State Lead Time
Future State Lead Time
Current State Future State
1
Time Summary
Z0010
Takt TimeMinItem
8.40
Total Value Added
Min24.43
Lead Time Day7.88
Value Added Percent
%0.37
Process Time Per Unit
MinItem
19.22
2
Time Summary
Z0150
Takt TimeMinItem
8.40
Total Value Added
Min249.00
Lead Time Day3.65
Value Added Percent
%8.13
Process Time Per Unit
MinItem
13.80
all
Inventory Summary
Z0130
Total Inventory Value
$35150.5
7
all
Scrap Costs
Z0030
Total Scrap Cost
$Day
744.58
1
Time Summary
Z0270
Takt TimeMinItem
8.40
Total Value Added
Min29.00
Lead Time Day21.68
Value Added Percent
%0.16
Process Time Per Unit
MinItem
21.50
2
Time Summary
Z0280
Takt TimeMinItem
8.40
Total Value Added
Min249.00
Lead Time Day16.95
Value Added Percent
%1.75
Process Time Per Unit
MinItem
13.80
all
Inventory Summary
Z0290
Total Inventory Value
$121441.
18
all
Scrap Costs
Z0300
Total Scrap Cost
$Day
1467.11
Lead Time SummaryDay
0 1 2 3 4 5 6 7 8
A0040
Casting Sets
A0060
Machined Sets
A0080
Polished Sets
A0100
Cutters
A0120
Boxes
1
7.88
A0010
Spring Steel
Rolls
A0020
Machine and
form caliper
springs
A0030
Springs
A0100
Cutters
A0120
Boxes
2
3.65
Non Value Added
Legend
Value Added
Lead Time SummaryDay
0 5 10 15 20 25
A0040
Casting Sets
A0060
Machined Sets
A0080
Polished Sets
A0100
Cutters
A0120
Boxes
1
21.68
A0010
Spring Steel
Rolls
A0020
Machine and
form caliper
springs
A0030
Springs
A0100
Cutters
A0120
Boxes
2
16.95
Non Value Added
Legend
Value Added
122

Copyright © 2015 The eVSM Group, All Rights Reserved
Current State CT/TT
Future State CT/TT
Lead Time SummaryDay
0 1 2 3 4 5 6 7 8
A0040
Casting Sets
A0060
Machined Sets
A0080
Polished Sets
A0100
Cutters
A0120
Boxes
1
7.88
A0010
Spring Steel
Rolls
A0020
Machine and
form caliper
springs
A0030
Springs
A0100
Cutters
A0120
Boxes
2
3.65
Non Value Added
Legend
Value Added
Lead Time SummaryDay
0 5 10 15 20 25
A0040
Casting Sets
A0060
Machined Sets
A0080
Polished Sets
A0100
Cutters
A0120
Boxes
1
21.68
A0010
Spring Steel
Rolls
A0020
Machine and
form caliper
springs
A0030
Springs
A0100
Cutters
A0120
Boxes
2
16.95
Non Value Added
Legend
Value Added
Cycle Time / Takt Time Chart
Min
/Ite
m
0
2
4
6
8
10
12
A0020
Mac
hine
and
form
ca.
.
A0050
Mac
hine
A0070
Polish
A0090
Ass
emble
A0110
Pac
kage
Scrap Loss
Legend
DownStr Loss
OEE Remainder Loss
Cycle Time Per Unit
Activity Takt Time
Cycle Time / Takt Time Chart
Min
/Ite
m
0
1
2
3
4
5
6
7
8
9
A0020
Mac
hine
and
form
ca.
.
A0050
Mac
hine
A0070
Polish
A0090
Ass
emble
A0110
Pac
kage
Scrap Loss
Legend
DownStr Loss
OEE Remainder Loss
Cycle Time Per Unit
Activity Takt Time
123Plant Level Mapping

Copyright © 2015 The eVSM Group, All Rights Reserved 124

Copyright © 2015 The eVSM Group, All Rights Reserved
Mixed Model Environment
125Mixed Model Environment

Copyright © 2015 The eVSM Group, All Rights Reserved
Today’s Factories Are Often
Complex
References
· Creating Mixed Model Value Streams by Kevin Duggan
· Lots of “tailoring” for customers
· Shared resources
· Many product variations
· Workfloor spaghetti
· Optimization of resources
· Uncertain demand from day to day
· No management time frame
-“Creating Mixed Model Value Streams” by
Kevin Duggan
Mixed Model Slides
126

Copyright © 2015 The eVSM Group, All Rights Reserved
Mixed Model Value Streams
· Mixed Model means to produce a variety or mix of products or
product variations through the same value stream at the pull
of the customer.
-“Creating Mixed Model Value Streams” by
Kevin Duggan
Ten Guidelines for Mixed Model
1. Do you have the right product families?
2. What is the takt time at the pacemaker?
3. Can the equipment support takt time?
4. What is the interval?
5. What are the balance charts for the products?
6. How will we balance flow for the mix?
7. How will we create standard work for the mix?
8. How will we create pitch at the pacemaker?
9. How do we schedule the mix at the pacemaker?
10. How do we deal with changes in customer demand?
-“Creating Mixed Model Value Streams” by Kevin Duggan
127Mixed Model Environment

Copyright © 2015 The eVSM Group, All Rights Reserved
Mixed Model Complexity
Value Stream Metrics
· “10 products, 9 to 12 operations, 15 stations, overlapping
capabilities”
· “Cycle times vary by product / operation / station / resource
combination”
· “Have to avoid needing human computers to figure out what
we need to improve”
Operations
People
Stations
Products
128

Copyright © 2015 The eVSM Group, All Rights Reserved
Product Lead Times
Stations Capacity
Takt TimeComplexity Losses
Cycle Time
S1 S2 Stations
Tim
e P
er
Unit
OEE Losses
129Mixed Model Environment

Copyright © 2015 The eVSM Group, All Rights Reserved
Production Cost
Mixed Model Improvement
Excel
Input
Op10
1
SecAuto
Qty Per Cycle Item1
Cycle Time Secx.xx
CapacityItemDay
Auto
Pre OEE Capacity
ItemDay
Auto
OEE Percent %Auto
A0010
Op15
1
SecAuto
Qty Per Cycle Item1
Cycle Time Secx.xx
CapacityItemDay
Auto
Pre OEE Capacity
ItemDay
Auto
OEE Percent %Auto
A0020
Op20
1
SecAuto
Qty Per Cycle Item1
Cycle Time Secx.xx
CapacityItemDay
Auto
Pre OEE Capacity
ItemDay
Auto
OEE Percent %Auto
A0030
ProductProcessi
ng Time
(hr)
Wait
Time (hr)
%
Usage
3606DIE
SEL
3606GA
S
ProductProcessi
ng Time
(hr)
Wait
Time (hr)
%
Usage
3606DIE
SEL7.50
3606GA
S
ProductProcessi
ng Time
(hr)
Wait
Time (hr)
%
Usage
3606DIE
SEL
3606GA
S
Simple
Simulation
VSM
Usage Factors and
Charts
Improvement
Ideas
Visuals
· How can VS visualization effort be minimized AND give us
useful results?
130

Copyright © 2015 The eVSM Group, All Rights Reserved
Production Period Studies
· Ideal Sequence?
· Lead Times
Processing Time Studies
· Wait Times
· Lead Times
0.00
0.02
0.04
0.06
0.08
0.10
0.12
Day
Products
Production Periods
Production Time
Earliest release toproduction
Required By
0.00
0.10
0.20
0.30
0.40
0.50
0.60
Hr
Products
Production Time Components
Planned Downtime
Queue Time
Cycle Time
131Mixed Model Environment

Copyright © 2015 The eVSM Group, All Rights Reserved
VSM Creation
Machine Utilization Studies
· Idle Times
· Bottlenecks
0.00
0.20
0.40
0.60
0.80
1.00
1.20
M1 P1 A1 Pa1
Hr
Station
Station Time Components
PlannedDowntime
Idle Time
Cycle Time
132
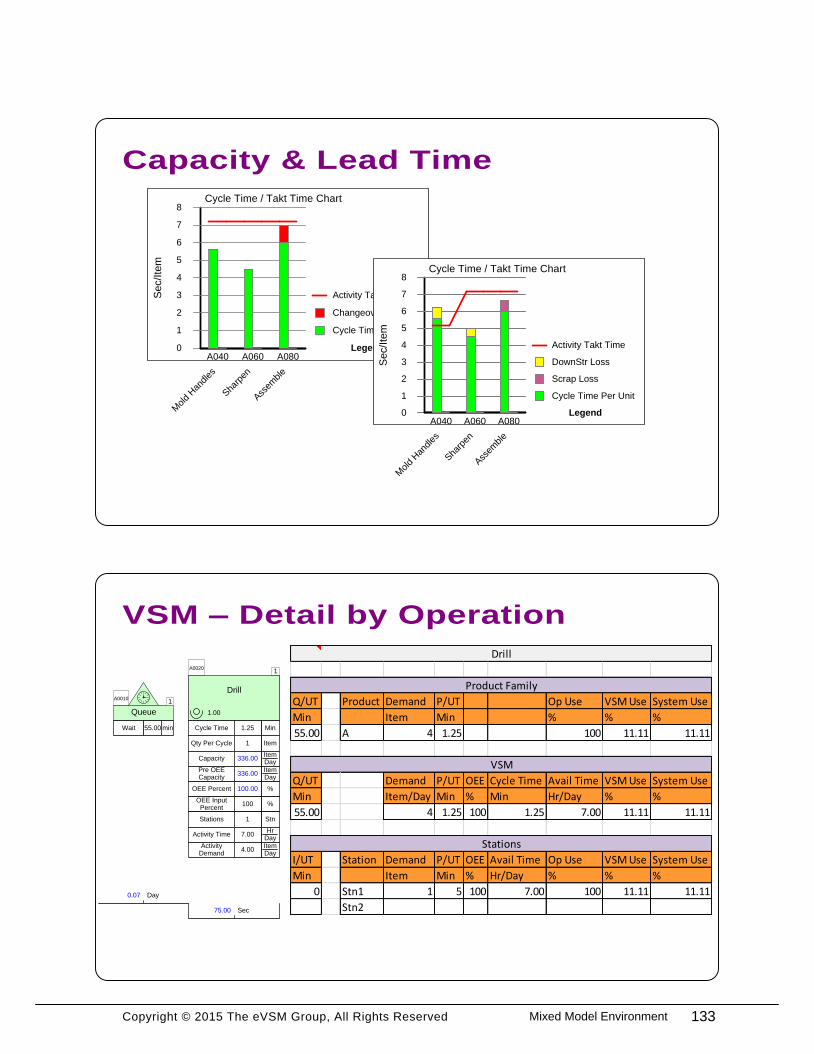
Copyright © 2015 The eVSM Group, All Rights Reserved
Drill Sharpen
Product Family Product Family
Q/UT Product Demand P/UT Op Use VSM Use System Use
Min Item Min % % %
55.00 A 4 1.25 100 11.11 11.11
VSM VSM
Q/UT Demand P/UT OEE Cycle Time Avail Time VSM Use System Use
Min Item/Day Min % Min Hr/Day % %
55.00 4 1.25 100 1.25 7.00 11.11 11.11
Stations Stations
I/UT Station Demand P/UT OEE Avail Time Op Use VSM Use System Use
Min Item Min % Hr/Day % % %
0 Stn1 1 5 100 7.00 100 11.11 11.11
Stn2
Capacity & Lead Time
VSM – Detail by Operation
A0010
Queue
Wait min55.00
Day0.07
Drill
A0020
1.00
Sec75.00
Qty Per Cycle Item1
Cycle Time Min1.25
CapacityItemDay
336.00
Pre OEE Capacity
ItemDay
336.00
OEE Percent %100.00
1
OEE Input Percent
%100
Stations Stn1
Activity TimeHr
Day7.00
Activity Demand
ItemDay
4.00
1
Cycle Time / Takt Time Chart
Sec/Ite
m
0
1
2
3
4
5
6
7
8
A040
Mold
Han
dles
A060
Sharp
en
A080
Ass
emble
Cycle Time Per Unit
Legend
Changeover Loss
Activity Takt Time
Cycle Time / Takt Time Chart
Sec/Ite
m
0
1
2
3
4
5
6
7
8
A040
Mold
Han
dles
A060
Sha
rpen
A080
Ass
emble
Cycle Time Per Unit
Legend
Scrap Loss
DownStr Loss
Activity Takt Time
133Mixed Model Environment

Copyright © 2015 The eVSM Group, All Rights Reserved
Flowchart of Mix Model
Benefits of Approach
· Standardized mixed model approach
· Common visual process understanding
· Applicable to machining and assembly VS
· See true capacity for complex VS
· See how changes in mix, product, equipment effect through-
put & cost
· See how changes in staffing effect VS
· Help determine optimal staffing and inventory levels
· Do “what if’s” for varying demand and products
· Help manage improvement projects
134

Copyright © 2015 The eVSM Group, All Rights Reserved
Excel
Worksheet
Expected
Production Time
I_VS Worksheet
Expected Production Time
· From: Product entering the first station
· To: When it leaves the last station
· User input value and can be compared to simulator output
Value StreamAJ1
"C" for
Comment
Row Product
Expected
Production
Time
Value
Stream ID
Day
A 1 Scissors
Excel
WorksheetI_VS
135Mixed Model Environment

Copyright © 2015 The eVSM Group, All Rights Reserved
Value Stream Untangling
Value Stream ID
· Each product type has a value
stream ID
· One map is generated per value
stream ID
· Value stream ID’s correspond to
product families
A Blade
Product Value Stream
A
A
A
Blade
Axle
Axle
A Blade
Product Value Stream
A
A
A
Blade
Axle
Axle
VSM_Axle
eVSM
Data
QuickMfg
8.01.0014.
0
Wait
Hr0.00
Wait Hr0
A0010
Op10
1.00
Hr18.00
Qty Per Cycle Item1
Cycle Time Hr18
A0020
Wait
Hr1.92
Wait Hr1.92
A0030
Op15
1.00
Hr18.40
Qty Per Cycle Item1
Cycle Time Hr18.40
A0040
Wait
Hr1.92
Wait Hr1.92
A0050
Op20
1.00
Hr13.97
Qty Per Cycle Item1
Cycle Time Hr13.97
A0060
Wait
Hr0.32
Wait Hr0.32
A0070
Op25
1.00
Hr3.87
Qty Per Cycle Item1
Cycle Time Hr3.87
A0080
Wait
Hr0.43
Wait Hr0.43
A0090
Op30
1.00
Hr5.56
Qty Per Cycle Item1
Cycle Time Hr5.56
A0100
Wait
Hr0.00
Wait Hr0
A0130
Op40
1.00
Hr3.63
Qty Per Cycle Item1
Cycle Time Hr3.63
A0140
Wait
Hr0.06
Wait Hr0.06
A0150
Op50
1.00
Hr3.51
Qty Per Cycle Item1
Cycle Time Hr3.51
A0160
Customer
Customer Demand
ItemWeek
9
Share % %100
Effective Demand
ItemWeek
9.00
A0170
5
Week
Day
52
Year
Week
12
Year
mth
Un
its
24
Day
hr
all
Time Summary
Takt TimeMinItem
800.00
Total Value Added
Hr66.94
Lead Time Day2.98
Value Added Percent
%93.50
Process Time Per Unit
MinItem
4016.40
Z0010
Title
DESCRIPTION
FILENAME
3600_TEST.VSD
REVISED
12/16/2014
TITLE
3600 test model
DATE
12/16/2014
Lead
Time
1
1
1
1
1
1
1
1
1
1
1
1
1
1
1
Lead Time SummaryDay
0 0.5 1 1.5 2 2.5 3
A0020
Op10
A0030
Wait
A0040
Op15
A0050
Wait
A0060
Op20
A0080
Op25
A0090
Wait
A0100
Op30
A0140
Op40
A0160
Op50
2.98
Value Added
Legend
Non Value Added
CT / TT
Chart
Cycle Time / Takt Time Chart
Hr/
Item
0
2
4
6
8
10
12
14
16
18
20
A0020
Op1
0
A0040
Op1
5
A0060
Op2
0
A0080
Op2
5
A0100
Op3
0
A0140
Op4
0
A0160
Op5
0
Cycle Time Per Unit
Legend
Activity Takt Time
System
Use = 98%
System
Use = 2%
VSM_Blade
eVSM
Data
QuickMfg
8.01.0014.
0
Wait
Hr0.00
Wait Hr0
A0010
Op10
1.00
Hr18.00
Qty Per Cycle Item1
Cycle Time Hr18
A0020
Wait
Hr1.92
Wait Hr1.92
A0030
Op15
1.00
Hr18.40
Qty Per Cycle Item1
Cycle Time Hr18.40
A0040
Wait
Hr1.92
Wait Hr1.92
A0050
Op20
1.00
Hr13.97
Qty Per Cycle Item1
Cycle Time Hr13.97
A0060
Wait
Hr0.32
Wait Hr0.32
A0070
Op25
1.00
Hr3.87
Qty Per Cycle Item1
Cycle Time Hr3.87
A0080
Wait
Hr0.43
Wait Hr0.43
A0090
Op30
1.00
Hr5.56
Qty Per Cycle Item1
Cycle Time Hr5.56
A0100
Wait
Hr0.00
Wait Hr0
A0130
Op40
1.00
Hr3.63
Qty Per Cycle Item1
Cycle Time Hr3.63
A0140
Wait
Hr0.06
Wait Hr0.06
A0150
Op50
1.00
Hr3.51
Qty Per Cycle Item1
Cycle Time Hr3.51
A0160
Customer
Customer Demand
ItemWeek
9
Share % %100
Effective Demand
ItemWeek
9.00
A0170
5
Week
Day
52
Year
Week
12
Year
mth
Un
its
24
Day
hr
all
Time Summary
Takt TimeMinItem
800.00
Total Value Added
Hr66.94
Lead Time Day2.98
Value Added Percent
%93.50
Process Time Per Unit
MinItem
4016.40
Z0010
Title
DESCRIPTION
FILENAME
3600_TEST.VSD
REVISED
12/16/2014
TITLE
3600 test model
DATE
12/16/2014
Lead
Time
1
1
1
1
1
1
1
1
1
1
1
1
1
1
1
Lead Time SummaryDay
0 0.5 1 1.5 2 2.5 3
A0020
Op10
A0030
Wait
A0040
Op15
A0050
Wait
A0060
Op20
A0080
Op25
A0090
Wait
A0100
Op30
A0140
Op40
A0160
Op50
2.98
Value Added
Legend
Non Value Added
CT / TT
Chart
Cycle Time / Takt Time Chart
Hr/
Item
0
2
4
6
8
10
12
14
16
18
20
A0020
Op1
0
A0040
Op1
5
A0060
Op2
0
A0080
Op2
5
A0100
Op3
0
A0140
Op4
0
A0160
Op5
0
Cycle Time Per Unit
Legend
Activity Takt Time
Excel
Worksheet
Excel
Worksheet
136

Copyright © 2015 The eVSM Group, All Rights Reserved
2 Hr2 Hr2 Hr
Value Stream Complexity
A
· Dedicated Balanced VS
· Dedicated Unbalanced VS
· Product Family VS
· Shared Resource Across VS’s
· Job Shop
Increasing
Complexity
Dedicated Balanced VS
· Single Product Type
· Equal CT at each station
· No waiting
Stn 1 Stn 2 Stn 3
137Mixed Model Environment

Copyright © 2015 The eVSM Group, All Rights Reserved
1 hr4 hr0.5
hr
2 Hr2 Hr 3 Hr
Product Family VS
A
2 Hr3 Hr2 Hr
A
Dedicated Unbalanced VS
Stn 1 Stn 2 Stn 3
· Single Product Type
· Unequal CT at each station
· WIP ahead of slower station (Stn 2)
· Idle time at faster stations (Stn 1, Stn 3)
· 2 Product Types / One value stream
· C/O’s consume production time
· Unequal CTs create WIP & Idle Time
· Larger the inequality between CTs, the greater the losses
Stn 1 Stn 2 Stn 3
C/O
BC/O C/O
138

Copyright © 2015 The eVSM Group, All Rights Reserved
1
3
2
Shared Resources · Understanding how
much of a shared
resource is used by
each value stream
can help untangle
the value streams
Shared Resources
% of Shared
Resources
eVSM
Mix
Job Shop
Stn
Stn 4
Stn 2
Stn 3
139Mixed Model Environment

Copyright © 2015 The eVSM Group, All Rights Reserved
I_Demand Worksheet
A
Floating Resources / Sequencing
Stn 1 Stn 2 Stn 3
· If we made sure that we are making at max one B at any time
and all operators float across Stn’s 1, 2, and 3 (x-trained) then
we only need 4 operators
B
"C" for
Comment
Row Job Product Job Qty Earliest Release Required By Last Operation
Item Day Day
J1 A 1 0 1
140
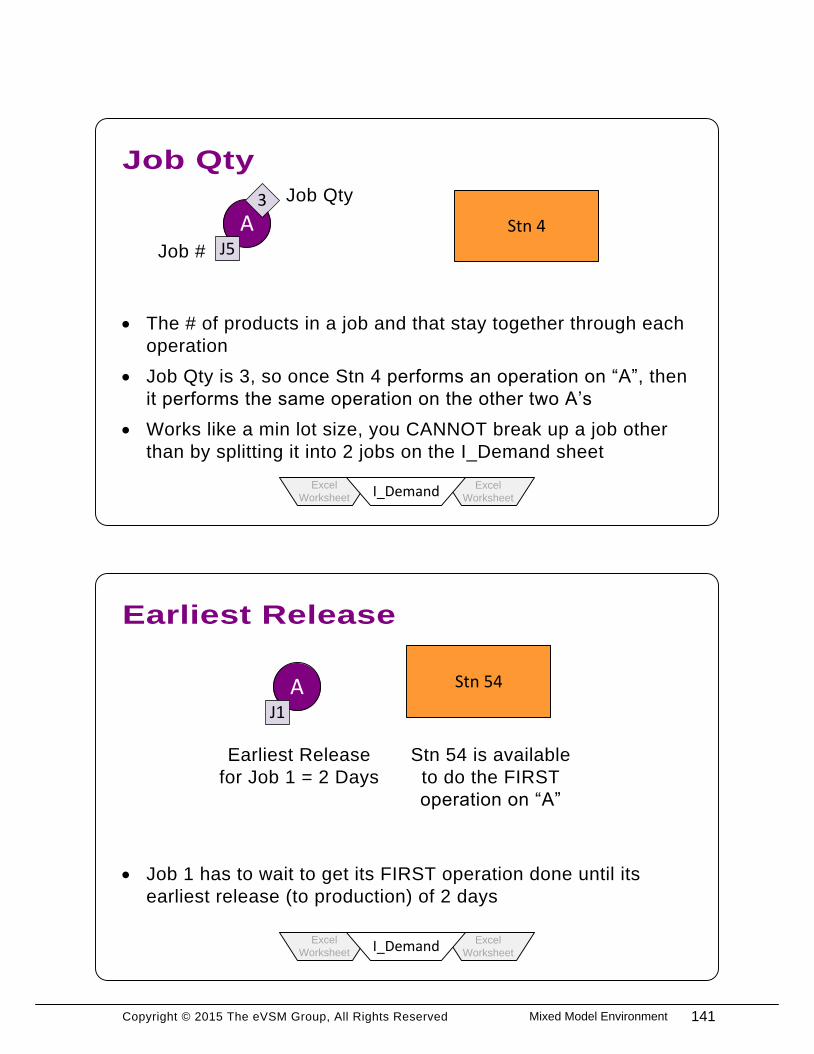
Copyright © 2015 The eVSM Group, All Rights Reserved
Job Qty
Earliest Release
Stn 54
· The # of products in a job and that stay together through each
operation
· Job Qty is 3, so once Stn 4 performs an operation on “A”, then
it performs the same operation on the other two A’s
· Works like a min lot size, you CANNOT break up a job other
than by splitting it into 2 jobs on the I_Demand sheet
Stn 4AJ5
3
Job #
Job Qty
· Job 1 has to wait to get its FIRST operation done until its
earliest release (to production) of 2 days
AJ1
Earliest Release
for Job 1 = 2 Days
Stn 54 is available
to do the FIRST
operation on “A”
Excel
Worksheet
Excel
WorksheetI_Demand
Excel
Worksheet
Excel
WorksheetI_Demand
141Mixed Model Environment

Copyright © 2015 The eVSM Group, All Rights Reserved
Customer
Last Operation
Required By
Stn 5 Stn 13AJ1
· When is production for Job 1 required to complete (as
measured from Day 0)
· User input value and can be compared to simulator output
· Provides means of specifying WIP in the value stream as a
starting condition
· “Last Operation” references the operation that has been
completed for this job
AJ1
Last Operation = “Drill”
Excel
Worksheet
Excel
WorksheetI_Demand
Excel
Worksheet
Excel
WorksheetI_Demand
142
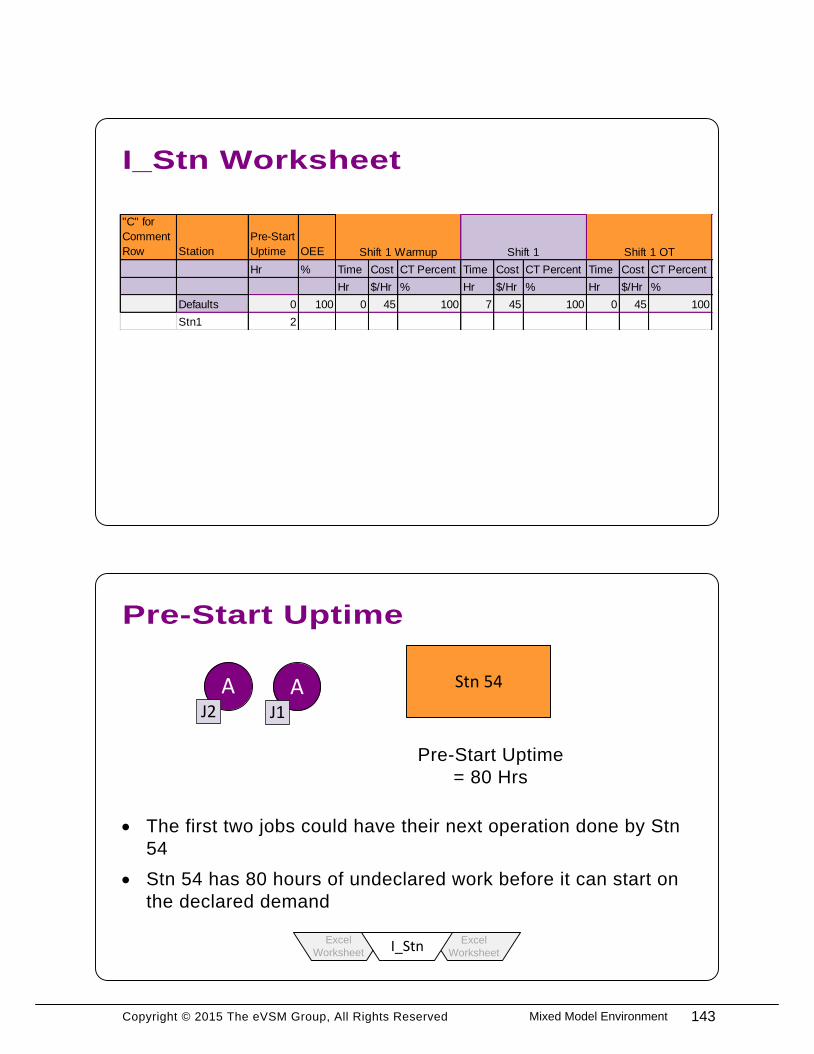
Copyright © 2015 The eVSM Group, All Rights Reserved
I_Stn Worksheet
Pre-Start Uptime
Stn 54AJ1
Pre-Start Uptime
= 80 Hrs
AJ2
· The first two jobs could have their next operation done by Stn
54
· Stn 54 has 80 hours of undeclared work before it can start on
the declared demand
"C" for
Comment
Row Station
Pre-Start
Uptime OEE
Hr % Time Cost CT Percent Time Cost CT Percent Time Cost CT Percent
Hr $/Hr % Hr $/Hr % Hr $/Hr %
Defaults 0 100 0 45 100 7 45 100 0 45 100
Stn1 2
Shift 1 Warmup Shift 1 Shift 1 OT
Excel
Worksheet
Excel
WorksheetI_Stn
143Mixed Model Environment

Copyright © 2015 The eVSM Group, All Rights Reserved
Shift Warmup
OEE
Stn 54A
J1
· Product A requires a Drilling Op at Stn 54 with a Cycle Time of
5 min
· If the OEE of Stn 54 = 85%, then the Effective Cycle Time is
taken as:
5/0.85 = 5.88 mins
OEE = 85%Op = Drilling
CT = 5 Mins
· Time at the beginning of a shift where there may be different
productivity levels
Shift 1 Warmup Shift 1
TimeHr1
Cost$/Hr45
CT%
120
TimeHr7
Cost$/Hr45
CT%
100
Excel
Worksheet
Excel
WorksheetI_Stn
Excel
Worksheet
Excel
WorksheetI_Stn
144

Copyright © 2015 The eVSM Group, All Rights Reserved
Cycle Time Percent
I_Ops Worksheet
Shift 1
Cost/Hr45
Cycle Time %100
Shift 2
Cost/Hr60
Cycle Time %85
Stn 50
· For Stn 50
· Shift 1 runs with the nominal resources and achieves the
nominal cycle time
· Shift 2 runs with extra resources and is able to achieve a
faster cycle time and hence a reduced cycle time %
"C" for
Comment
Row
Station Product Operation Op SeqCycle
Time
Qty Per
Cycle
Minimum
Lot Size
Preferred
Lot Size
Minimum Post-
Op Wait Time
Manual
Time
ID ID ID # Hr Item Item Item Hr Hr
C M1 SC Red Machine 1 5 1 1 1 0 5
Excel
Worksheet
Excel
WorksheetI_Stn
145Mixed Model Environment

Copyright © 2015 The eVSM Group, All Rights Reserved
Qty Per Cycle
Op Sequence
PrepareA
Mold
10 20
· Sequence of operations for a product
· “A” must go through the Op Sequence 10, 20 in that order
· Each operation name must have a unique operation sequence
number
· Number of items processed by a particular operation within a
single cycle at that station
Stn 5
Prepare A
Qty Per
Cycle = 1
Excel
Worksheet
Excel
WorksheetI_Ops
Excel
Worksheet
Excel
WorksheetI_Ops
146

Copyright © 2015 The eVSM Group, All Rights Reserved
Preferred Lot Size
Job Qty & Preferred Lot Size
Stn 54
· Preferred product lot size for an operation on a station
· Simulator accommodates by allowing same products to jump
the queue
· Contingent on input materials availability
AJ9
AJ5
AJ1
· Run Job 1: Ran 8 of A
· Run Job 3: Ran 8 (16 total) of A
· Run Job 2: Ran 5 of B
1
2
3
4
5
Job Product Job Qty
A
B
A
B
A
8
5
8
5
8
Stn 42
Drilling
Qty Per Cycle = 1
Preferred Lot Size = 10 for A
Preferred Lot Size = 5 for B
A8
Excel
Worksheet
Excel
WorksheetI_Ops
Excel
Worksheet
Excel
WorksheetI_Ops / I_Demand
147Mixed Model Environment

Copyright © 2015 The eVSM Group, All Rights Reserved
Manual Time
Minimum Post Op Wait Time
Stn 54 Stn 56
Stn 5
Drilling
AJ1
· A must wait a minimum 30 mins from exiting Stn 54 and before
entering Stn 56
· Used to model transfer times
10 Mins 30 Mins 42 Mins
· If desired Cycle Time for Drilling is the same for products A
and B = 10 hrs
· BUT: A needs 20 hrs of labor (Manual Time) and B needs only
10 hrs of labor
· THEN: We need a minimum 2 people on Stn 5 when
processing A and one person when processing B
AJ1
BJ1
Excel
Worksheet
Excel
WorksheetI_Ops
Excel
Worksheet
Excel
WorksheetI_Ops
148

Copyright © 2015 The eVSM Group, All Rights Reserved
I_Assy Worksheet
Assembly
· Run Job 1: Ran 8 of A
· Run Job 3: Ran 8 (16 total) of A
· Run Job 2: Ran 5 of B
Assemble ScissorsA
J1
A2
A1A1
"C" for Comment
RowProduct Operation
ID ID ID Qty Per Item ID Qty Per Item
C SC Red Machine Comp A 2 Comp B 1
Component A Component B
Excel
Worksheet
Excel
WorksheetI_Assy
149Mixed Model Environment

Copyright © 2015 The eVSM Group, All Rights Reserved
Alternatives and Tracks
I_Tracks & Alts
PrepareAJ1
· “A” is produced via First or Second Track
· Actual track selected during simulation based on preference
(First Only, Second Only, First If Available, Second If
Available)
Machine
Mold Sharpen
AssembleFirst Track
Second Track
"C" for Comment
Row Track ID Operation Operation
C T001 Machine Polish
Excel
Worksheet
Excel
WorksheetI_Tracks / I_Alts
150

Copyright © 2015 The eVSM Group, All Rights Reserved
45 Mins
Stn 3
Milling A
I_CO Worksheet
Changeover
Stn 3
Cut B
· Time and cost to go from product to product and operation to
operation at a particular station
· 45 Mins to have Station 3 ready to “cut” products of type “B”
when it is currently setup for “Milling” products of type “A”
"C" for
Comment
Row
StationFrom
Product
From
Operation
Changeover
Time
Changeover
CostTo Product To Operation
Hr $ / CO
C M1 SC Red Machine 0.2 30 SC Blue Machine
Excel
Worksheet
Excel
WorksheetI_CO
151Mixed Model Environment

Copyright © 2015 The eVSM Group, All Rights Reserved
S_Make – Virtual Factory
Sim_Stations
Pro
du
ct
Exp
ecte
d P
rod
uct
ion
Tim
e
Val
ue
Stre
am ID
Op
Nam
e
Op
Seq
uen
ce
ALT
:ID
ALT
:PR
EF
ALT
:TR
AC
K
Co
mp
ID
Co
mp
Qty
Wo
rkst
atio
n
Qty
Per
Cyc
le
Min
imu
m L
ot
Size
Pre
ferr
ed L
ot
Size
Min
Wai
t Ti
me
Pre
-Sta
rt U
pti
me
OEE
Shif
t
Shif
t D
ura
tio
n
Cyc
le T
ime
Man
ual
Tim
e
Co
st R
ate
Day Per Item Item Item Item Hr Hr % Hr Hr Hr $/Hr
A 1 Scissors
Drill1 1
Stn1 1 1 1 0 2 100
Shift 1 7 2 0 45
Stn2 1 1 1 0 4 100
Shift 1 7 3 0 45
Sharpen 2
Stn3 1 1 1 0 8 100
Shift 1 7 4 0 45
Station
Pre-Start
Uptime P/UT P/PDT I/UT I/PDT Start Day
Start
Time End Day
End
Time
ID Hr Hr Hr Hr Hr Day Hr Day Hr
Stn1 2 4 0 0 0 0 2 1 0 P/UT P/UT I/UT I/PDT
Stn1 -1 - Initial ProcessingJ1 - A
Stn1 Drill1 Drill1
Stn1 120 120 180 1020
Stn1 0.00
152

Copyright © 2015 The eVSM Group, All Rights Reserved
1.5 Hr
Idle for 1 Hr
4 Hr
Stn 3
Drilling BJ2
P/UT
P/PDT
· A station’s processing time (P) during uptime (UT)
· P/UT = 5.5 Hrs above
Stn 3
Milling CJ1
2 Hrs
Planned downtime
(PDT) = 3 Hrs
4 Hrs
Stn 1
Milling B
Stn 1
Milling B
· Product is in-station during planned downtime
· Product B starts, is stopped during planned downtime, and
then resumes
· P/PDT = 3 Hrs
Excel
Worksheet
Excel
WorksheetSim_Stations
Excel
Worksheet
Excel
WorksheetSim_Stations
153Mixed Model Environment

Copyright © 2015 The eVSM Group, All Rights Reserved
I/PDT
· Idle time (I) at a station during planned downtime (PDT)
2 Hrs
Stn 2
Milling B
Stn 3
Cutting A
I/UT
· Idle time (I) at station during uptime (UT)
· Stn 3 just finished Cutting Product A and has an idle time of 2
hrs until the next job
2 Hrs
Stn 2
Milling B
Stn 3
Cutting A
Excel
Worksheet
Excel
WorksheetSim_Stations
Excel
Worksheet
Excel
WorksheetSim_Stations
154

Copyright © 2015 The eVSM Group, All Rights Reserved
Sim_Products Worksheet
Q/UT
Stn 2 Stn 4
· Queue time (Q) of a product during uptime (UT)
· The Queue time during uptime of Job 1 is 2 Hrs
BJ1
30 Mins 90 Mins
Excel
Worksheet
Excel
WorksheetSim_Products
Job Product Job Qty
Started
After Op
Earliest
Release
Require
d By P/UT P/PDT Q/UT Q/PDT Start Day
Start
Time End Day
End
Time
ID ID Item Day Day Hr Hr Hr Hr Day Hr Day Hr
J1 A 1 0 1 6 0 21 0 0 2 1 5 P/UT Q/UT P/UT
J1 Stn1 Stn3
J1 Drill1 Sharpen
J1 120 1260 240
J1 0.00
155Mixed Model Environment

Copyright © 2015 The eVSM Group, All Rights Reserved
Summary
Product Summary
Product Demand P/UT Q/UT VSM Use On Time System Use
Item Hr Hr % % %
A 1 6.00 21.00 100.00 0.00 100.00
VSM Summary
Demand P/UT Q/UT Activity TimeSystem Use
Item/Day Hr Hr Hr/Day %
1 0.10 0.35 2.72 100.00
Station Summary
Station Demand Sum (P/UT)Sum (I/UT)VSM Use UtilizationSystem Use
Item Hr Hr % % %
Stn1 1.00 2 0.00 33.33 57.14 33.33
Stn2 0.00 0 0.00 0.00 57.14 0.00
Stn3 1.00 4 0.00 66.67 100 66.67
Sim_VSM Worksheet
Q/PDT
Stn 2 Stn 4
· Queue time (Q) during planned downtime (PDT)
BJ1
Excel
Worksheet
Excel
WorksheetSim_Products
Sharpen Summary
Product Family Product Summary
Q/UT Product Demand P/UT Op Use VSM Use System Use
Min Item Min % % %
0.00 A 1 240.00 100 66.67 66.67
VSM VSM Summary
Q/UT Demand P/UT OEE Cycle TimeAvail TimeVSM Use System Use
Min Item/Day Min % Min Hr/Day % %
0.00 1 240.00 100 240.00 2.33 66.67 66.67
Stations Station Summary
I/UT Station Demand P/UT OEE Avail TimeOp Use VSM Use System Use
Min Item Min % Hr/Day % % %
Stn1
Stn2
0 Stn3 1 240 100 2.33 100 66.67 66.67
156

Copyright © 2015 The eVSM Group, All Rights Reserved
Product Family
Stations
· Op Use: % of this operation’s P/UT hrs used for this product
type
· VSM Use: % of the value stream’s P/UT hrs used for this
product type
· System Use: % of the system (all value streams) P/UT hrs
used for this product type
· Op Use: % of this operation’s P/UT hrs supplied by this station
· VSM Use: % of the value stream’s P/UT hrs supplied by this
station for this operation
· System Use: % of the system (all value streams) P/UT hrs
supplied by this station for this operation
Product Family Product Summary
Q/UT Product Demand P/UT Op Use VSM Use System Use
Min Item Min % % %
0.00 A 1 240.00 100 66.67 66.67
Stations Station Summary
I/UT Station Demand P/UT OEE Avail TimeOp Use VSM Use System Use
Min Item Min % Hr/Day % % %
Stn1
Stn2
0 Stn3 1 240 100 2.33 100 66.67 66.67
Excel
Worksheet
Excel
WorksheetSim_VSM
Excel
Worksheet
Excel
WorksheetSim_VSM
157Mixed Model Environment

Copyright © 2015 The eVSM Group, All Rights Reserved
Product Summary
· On Time %: % of products that are predicted to be complete
ahead of user specified “Required By” time
VSM
· Q/UT: Average wait time for a product ahead of this operation
· Post WIP: Average WIP after this operation
· P/UT: Average processing time for products at this operation
· VSM Use: P/UT hrs used at this operation as a percent of P/
UT hrs used by the value stream
Product Summary
Product Demand P/UT Q/UT VSM Use On Time System Use
Item Hr Hr % % %
A 1 6.00 21.00 100.00 0.00 100.00
VSM VSM Summary
Q/UT Demand P/UT OEE Cycle TimeAvail TimeVSM Use System Use
Min Item/Day Min % Min Hr/Day % %
0.00 1 240.00 100 240.00 2.33 66.67 66.67
Excel
Worksheet
Excel
WorksheetSim_VSM
Excel
Worksheet
Excel
WorksheetSim_VSM
158

Copyright © 2015 The eVSM Group, All Rights Reserved
VSM Summary
Stations Summary
· Demand: Overall value stream demand
· P/UT: Average processing time per product for the value
stream
· Q/UT: Average wait time per product for the value stream
Station Summary
Station Demand Sum (P/UT)Sum (I/UT)VSM Use UtilizationSystem Use
Item Hr Hr % % %
Stn1 1.00 2 0.00 33.33 57.14 33.33
Stn2 0.00 0 0.00 0.00 57.14 0.00
Stn3 1.00 4 0.00 66.67 100 66.67
VSM Summary
Demand P/UT Q/UT Activity TimeSystem Use
Item/Day Hr Hr Hr/Day %
1 0.10 0.35 2.72 100.00
Excel
Worksheet
Excel
WorksheetSim_VSM
Excel
Worksheet
Excel
WorksheetSim_VSM
159Mixed Model Environment

Copyright © 2015 The eVSM Group, All Rights Reserved 160

Copyright © 2015 The eVSM Group, All Rights Reserved
Operation
Station
A50
J1
The following exercises will make you familiar with the terms and
calculations in using the mixed model capability in eVSM.
Hand Exercises
Job Quantity
Job Quantity
Product
161Mixed Model Environment

Copyright © 2015 The eVSM Group, All Rights Reserved
Drill
1. Product / Station / Operation / Op Sequence /
Job ID /Job Qty
Q1 : What are the Product names?
Q2 : What are the Job names?
Stn 1
ABJ2 Sharpen
Stn 2
5025
J1
Q3 : What are the Job Qtys associated with the two Jobs?
Q4 : What are the stations?
Q5 : What are the operations?
Q6 : What are reasonable operation sequence numbers to assign to the two operations?
162

Copyright © 2015 The eVSM Group, All Rights Reserved
Drill
CT= 5 Mins
2. Product: Processing, Production & Wait Time
Q1 : How long will it take to complete Job 4?
Q2 : What is the production time (Lead Time) for AJ4?
Q3 : What is the wait time for AJ4?
Stn 1
Sharpen
Stn 2
CT= 10 Mins
A A AJ1J2J3
AJ4
163Mixed Model Environment

Copyright © 2015 The eVSM Group, All Rights Reserved
3. Station Selection
Drill
Stn 1
CT= 5 Mins
Sharpen
Stn 2
CT= 10 Mins
Sharpen
Stn 3
CT= 15 Mins
A A
Q1 : What is the minimum processing time for AJ1?
Q2 : What is the minimum processing time for AJ2?
J1J2
164

Copyright © 2015 The eVSM Group, All Rights Reserved
Drill
CTA= 10 Mins
CTB= 20 Mins
4. Station: Processing Time, Idle Time
Q1 : What are the processing times for Stn 1 and Stn 2?
Q2 : What is the idle time for Stn 2?
Stn 1
Sharpen
Stn 2
AB
CTA= 5 Mins
CTB= 5 Mins
J1J2
165Mixed Model Environment

Copyright © 2015 The eVSM Group, All Rights Reserved
Drill
CTA= 2 Hrs
CTB= 4 Hrs
5. Product: Earliest Release, Start, End, &
Production Times
Q1 : What are the Production Times for A and B?
Q2 : What are the Start and End Times for A and B?
Stn 1
AB
Earliest
Release
= 2 Day
Earliest
Release
= 0 Day
J1J2
166

Copyright © 2015 The eVSM Group, All Rights Reserved
Drill
Stn 1
A: Min Lot Size = 1
B: Min Lot Size = 1
CT = 5 Mins
6. Product / Operation / Station: Min Lot Size
Q1 : In what sequence will jobs exit Stn 2?
Sharpen
Stn 2
A: Min Lot Size = 10
B: Min Lot Size = 3
CT = 10 Mins
A5
J1
B3
J2
B3
J3
A5
J4
167Mixed Model Environment

Copyright © 2015 The eVSM Group, All Rights Reserved
Drill
7. Product / Station / Operation: Preferred Lot Size
Q1 : Would B be processed at all?
Q2 : What Qty of A would be made at the Drill Operation before starting to B?
Stn 1
ABJ2
Sharpen
Stn 2
510
J1A
J3
5
A: Preferred Lot Size = 2
(Drill, Stn 1)
B: Preferred Lot Size = 12
(Drill, Stn 1)
168

Copyright © 2015 The eVSM Group, All Rights Reserved
Drill
8. Station: Pre-Start Uptime
Q1 : What route will J1 take?
Q2 : What will J1's Processing Time be?
Stn 1
A Sharpen
Stn 3
J1
Stn 1: Pre-Start Uptime = 2 Hrs
Stn 2: Pre-Start Uptime = 4 Hrs
Stn 3: Pre-Start Uptime = 8 Hrs
Drill
Stn 2
CT = 2 Hrs
CT = 4 Hrs
Q3 : What will J1's Wait Time be?
CT = 3 Hrs
169Mixed Model Environment

Copyright © 2015 The eVSM Group, All Rights Reserved
Drill
9. Available Time
Q1 : What is the station’s Available Time for Drill and Sharpen each day?
Stn 1
Sharpen
Stn 1
Stn 1 is used for both “Drill” and “Sharpen”. It spends about 50% of its time on each. If the
station runs 1 shift, 8 hours, then:
170

Copyright © 2015 The eVSM Group, All Rights Reserved
Drill
10. Activity Time
Q1 : What’s the total time available for the Drilling operation?
Q2 : How many stations can do drilling?
Stn 1
Drill
Stn 2
Available Time = 4
hrs/day
Available Time = 6
hrs/day
171Mixed Model Environment

Copyright © 2015 The eVSM Group, All Rights Reserved
11. Activity Demand
Q1 : Both A and B belong to the Scissors value stream. What is the daily demand for this value
stream?
Demand
A
Required By (Day)
20
B 40
1
2
Product
172

Copyright © 2015 The eVSM Group, All Rights Reserved
Drill
Stn 1
AJ1
CT = 8 Min
OEE = 80%
12. OEE
Q1 : What is the processing time for A at the Drill operation?
173Mixed Model Environment

Copyright © 2015 The eVSM Group, All Rights Reserved
Drill
Stn 1
AJ1
CT = 5 Mins
Min Wait Time = 60 Mins
13. Minimum Wait Time
Q1 : How long does J1 wait after “Drill” and before any next operation?
Sharpen
Stn 2
CT = 10 Mins
Q2 : What is the production time for J1?
174

Copyright © 2015 The eVSM Group, All Rights Reserved
Drill
Stn 1
AJ1
CT = 5 Mins
Manual Time = 10 Mins
14. Manual Time
Q1 : How many people are required to complete the “Drill” and “Sharpen” operations in their
“Cycle Time”?
Sharpen
Stn 2
CT = 10 Mins
Manual Time = 10 Mins
175Mixed Model Environment

Copyright © 2015 The eVSM Group, All Rights Reserved
Drill
Stn 1
CT = 5 Mins
15. WIP
Q1 : What is the “Last Operation” that J1 went through?
Sharpen
Stn 2
CT = 10 Mins
A2
J2A
4
J1
Q2 : When will J1 be complete?
Q3 : When will J2 be complete?
176

Copyright © 2015 The eVSM Group, All Rights Reserved
Drill
Stn 1
CTA = 10
CTB = 10
16. VSM Generation
Q1 : What percent of time will be used to process A as opposed to B at each of the two stations?
Sharpen
Stn 2
A10
J1
B20
J2
A10
J3
Q2 : What’s the daily demand for A and B?
Q3 : Extract and draw a VSM for the scissors value stream.
CTA = 5
CTB = 10
VS ID = Scissors
VS ID = Shears
Required in 1 Day
2 Shifts / 10 Hrs per shift
177Mixed Model Environment

Copyright © 2015 The eVSM Group, All Rights Reserved
Enter the values for the I_VS
worksheet. Note that entering a
“C” in the Comment Row will
ensure that row will not be used
for any computations
2
Station: Processing Time, Idle Time
Enter the values for
the I_Demand
worksheet
3
Enter the values for the I_Stn
worksheet. Verify the default
values for each category.
4
Click the Open button in the
eVSM Mix toolbar to open a
blank Mix template
1
Open
"C" for
Comment
Row Product
Expected
Production
Time
Value
Stream ID
Day
A 1 Scissors
B 1 Scissors
End Data
"C" for
Comment
Row Station
Pre-Start
Uptime OEE
Hr % Time Cost CT Percent Time Cost CT Percent
Hr $/Hr % Hr $/Hr %
Defaults 0 100 0 45 100 7 45 100
Stn1
Stn2
End Data
Shift 1 Warmup Shift 1
"C" for
Comment
Row Job Product Job Qty Earliest Release Required By Last Operation
Item Day Day
J1 A 1 0 0.5
J2 B 1 0 0.5
End Data
178

Copyright © 2015 The eVSM Group, All Rights Reserved
Enter the values for the I_Ops
worksheet. Make sure to change
the units for “Manual Time” to Min.
5
Click the Check button in the
eVSM Mix toolbar and fix any
errors flagged
6
Check
This will create the
“S_Make” worksheet
7
"C" for
Comment
Row
Station Product Operation Op SeqCycle
Time
Qty Per
Cycle
Minimum
Lot Size
Preferred
Lot Size
Minimum Post-
Op Wait TimeManual Time
ID ID ID # Min Item Item Item Hr Min
Stn1 A Drill 1 10 1 0 5
Stn2 A Sharpen 2 5 1 0 5
Stn1 B Drill 1 20 1 0 5
Stn2 B Sharpen 2 5 1 0 5
End Data
Pro
du
ct
Exp
ecte
d P
rod
uct
ion
Tim
e
Val
ue
Stre
am ID
Op
Nam
e
Op
Seq
uen
ce
ALT
:ID
ALT
:PR
EF
ALT
:TR
AC
K
Co
mp
ID
Co
mp
Qty
Wo
rkst
atio
n
Qty
Per
Cyc
le
Min
imu
m L
ot
Size
Pre
ferr
ed L
ot
Size
Min
Wai
t Ti
me
Pre
-Sta
rt U
pti
me
OEE
Shif
t
Shif
t D
ura
tio
n
Cyc
le T
ime
Man
ual
Tim
e
Co
st R
ate
Day Per Item Item Item Item Hr Hr % Hr Min Min $/Hr
A 1 Scissors
Drill 1
Stn1 1 0 0 100
Shift 1 7 10 5 45
Sharpen 2
Stn2 1 0 0 100
Shift 1 7 5 5 45
B 1 Scissors
Drill 1
Stn1 1 0 0 100
Shift 1 7 20 5 45
Sharpen 2
Stn2 1 0 0 100
Shift 1 7 5 5 45
179Mixed Model Environment

Copyright © 2015 The eVSM Group, All Rights Reserved
Using eVSM Mix
Opens a blank Excel template for inputting your data.
Checks input data for any errors and flags them before simulation can run.
Runs the simulation of the input data and creates output sheets in the Excel file.
Views a summary after the simulation has run for each operation and total summary for
the value stream.
Creates a production schedule for the various products entered.
View production time components.
View station time components.
Generate value stream map by value stream ID.
Floor layout showing summary output from simulation run.
180

Copyright © 2015 The eVSM Group, All Rights Reserved
ACME Mixed Model Case Study
181ACME Mixed Model Case Study
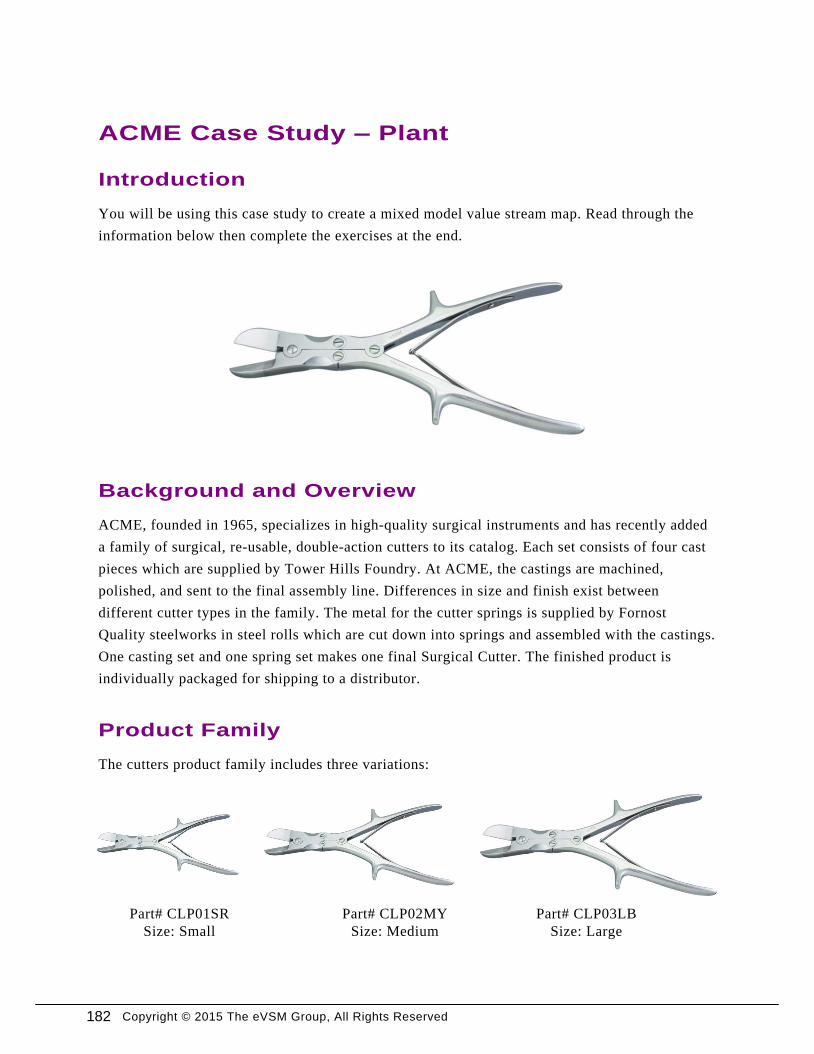
Copyright © 2015 The eVSM Group, All Rights Reserved
ACME Case Study – Plant
Introduction
You will be using this case study to create a mixed model value stream map. Read through the
information below then complete the exercises at the end.
Background and Overview
ACME, founded in 1965, specializes in high-quality surgical instruments and has recently added
a family of surgical, re-usable, double-action cutters to its catalog. Each set consists of four cast
pieces which are supplied by Tower Hills Foundry. At ACME, the castings are machined,
polished, and sent to the final assembly line. Differences in size and finish exist between
different cutter types in the family. The metal for the cutter springs is supplied by Fornost
Quality steelworks in steel rolls which are cut down into springs and assembled with the castings.
One casting set and one spring set makes one final Surgical Cutter. The finished product is
individually packaged for shipping to a distributor.
Product Family
The cutters product family includes three variations:
Part# CLP01SR
Size: Small
Part# CLP02MY
Size: Medium
Part# CLP03LB
Size: Large
182

Copyright © 2015 The eVSM Group, All Rights Reserved
Assemble
(ASSM01)
Package
(PACK01)
Machine
(MACH01)
Polish
(PLSH01)
Springs
&
Screws
Product Manufacturing Flow
Job Order List
Stations
The “Earliest Release” time is 0 days
and the “Required By” time is 3 days.
VSM
Product
CLP01SR
CLP02MY
CLP03LB
There is one operator per station and the manual time is the same as the cycle time.
Job # Product Job Qty
J1 CLP01SR 36
J2 CLP02MY 12
J3 CLP03LB 12
J4 CLP01SR 36
J5 CLP02MY 12
J6 CLP03LB 12
Station Product Operation Op SeqCycle
Time
Qty Per
Cycle
Minimum
Lot Size
Preferred
Lot Size
Minimum Post-
Op Wait Time
Manual
Time
ID ID ID # Min Item Item Item Hr Min
M1 SC Red Machine 1 5 1 1 1 0 5
MACH01 CLP01SR Machine 10 7 1 12 1 0 7
MACH01 CLP02MY Machine 10 10 1 12 1 0 10
MACH01 CLP03LB Machine 10 15 1 12 1 0 15
PLSH01 CLP01SR Polish 20 4 1 12 1 0 4
PLSH01 CLP02MY Polish 20 5 1 12 1 0 5
PLSH01 CLP03LB Polish 20 6 1 12 1 0 6
ASSM01 CLP01SR Assembly 30 8 1 12 1 0 8
ASSM01 CLP02MY Assembly 30 14 1 12 1 0 14
ASSM01 CLP03LB Assembly 30 20 1 12 1 0 20
PACK01 CLP01SR Packing 40 3 1 36 1 0 3
PACK01 CLP02MY Packing 40 5 1 24 1 0 5
PACK01 CLP03LB Packing 40 7 1 24 1 0 7
183ACME Mixed Model Case Study

Copyright © 2015 The eVSM Group, All Rights Reserved
Facility Time
Facility runs 5 days a week, 2 shifts per day, 7 production hours per shift. Labor rate runs at $45
per man-hour. Each station has an OEE of 80%.
Exercises
1. Create an eVSM Mix spreadsheet for the above.
2. Confirm that the Production Time for job J6 is 2.25 days.
3. Create a value stream map.
4. We have decided to remove the large cutters (CLP03LB) from this product family. Update the
spreadsheet to reflect this and draw a new value stream.
5. Create a spaghetti diagram showing the main material flows on a “layout” page in your eVSM
Visio file. Display the simulation results on the layout.
6. If the demand doubles, how much time will be needed (no change in resources) to complete
production?
7. Which station has the longest wait time?
8. To balance the line better, we have found ways to improve performance at the Assemble
operation. All cycle times there are reduced by 50%. How does this impact the production
time?
184

Copyright © 2015 The eVSM Group, All Rights Reserved
1. Create a new page and name it “Layout”
2. Turn it into a background page
3. Insert picture of floorplan
4. Open Spaghetti Wizard
5. Set up Spaghetti Scale
6. Drop a Spaghetti Place icon for each machine in the VS. Use the Machine ID for each name.
7. Click the “Layout” button in the eVSM Mix toolbar
Layout
185ACME Mixed Model Case Study

Copyright © 2015 The eVSM Group, All Rights Reserved 186

Copyright © 2015 The eVSM Group, All Rights Reserved
eVSM Wizards
187eVSM Wizards

Copyright © 2015 The eVSM Group, All Rights Reserved 188

Copyright © 2015 The eVSM Group, All Rights Reserved
This tutorial will guide you through the steps to generate a
spaghetti layout using the Spaghetti Wizard.
Spaghetti Wizard Tutorial
10
189eVSM Wizards

Copyright © 2015 The eVSM Group, All Rights Reserved 190

Copyright © 2015 The eVSM Group, All Rights Reserved
On your Desktop, click
the “Start eVSM” icon.
1
Click to enable
macros.Click “Trust all from
publisher” to avoid the
security notice in future.
3
4
If you see a message like this,
you must “Enable” macros.
2
Step 1: Start eVSM
191eVSM Wizards

Copyright © 2015 The eVSM Group, All Rights Reserved
Quick_eVSM
Learn eVSM BasicsStep 2:
Avoid re-sizing eVSM shapes. Instead
grow the drawing page when needed.
To resize the page, hold down the “Ctrl”
key, and then drag any page edge to the
required size. This method works on all
four edges of the page.
2
VSM
Save your Visio file and then
insert a new page via the right-
mouse menus on the page-tabs.
5
192

Copyright © 2015 The eVSM Group, All Rights Reserved
Learn eVSM Basics
Blue icons in the main stencil
represent families of shapes. Drag
out the Transport icon.
3
Use the shape’s
right-mouse menus
to turn it into a car
4
eVSM Help resources are available in the
Learn module of the toolbar. Hover over
each one to see what they do.
1
193eVSM Wizards

Copyright © 2015 The eVSM Group, All Rights Reserved
Click the Open button. Select
Spaghetti in the Wizard column
and click OK.
Drag out the
red icon first.
This is very
important!
3
1
Initiate the map for the Spaghetti WizardStep 3:
The Spaghetti Wizard
stencil will open on
the left.
2
eVSM Data
WizSpaghet
ti
7.30.0187.0
Spaghetti Data
Open
194

Copyright © 2015 The eVSM Group, All Rights Reserved
Initiate the map for the Spaghetti Wizard
195eVSM Wizards

Copyright © 2015 The eVSM Group, All Rights Reserved
Draw/Import Floor MapStep 4:
Draw or import a floor map. Visio can
import most bitmap formats as well as
AutoCAD drawings. Either use the
“Insert” tab in Visio or simply copy and
paste the picture into a new drawing.
1
Scale
eVSM Data
WizSpaghet
ti
7.30.0187.0
196

Copyright © 2015 The eVSM Group, All Rights Reserved
Draw/Import Floor Map
Drag out a Spaghetti Scale shape and stretch
it out to exactly fit a known dimension on the
map. The known dimension could be a map
scale if available, or a floor dimension you
have measured. Enter the actual dimension
value on the scale shape by double-clicking it.
2
10
197eVSM Wizards

Copyright © 2015 The eVSM Group, All Rights Reserved
Add Spaghetti PlacesStep 5:
eVSM Data
WizSpaghet
ti
7.30.0187.0
Place
198
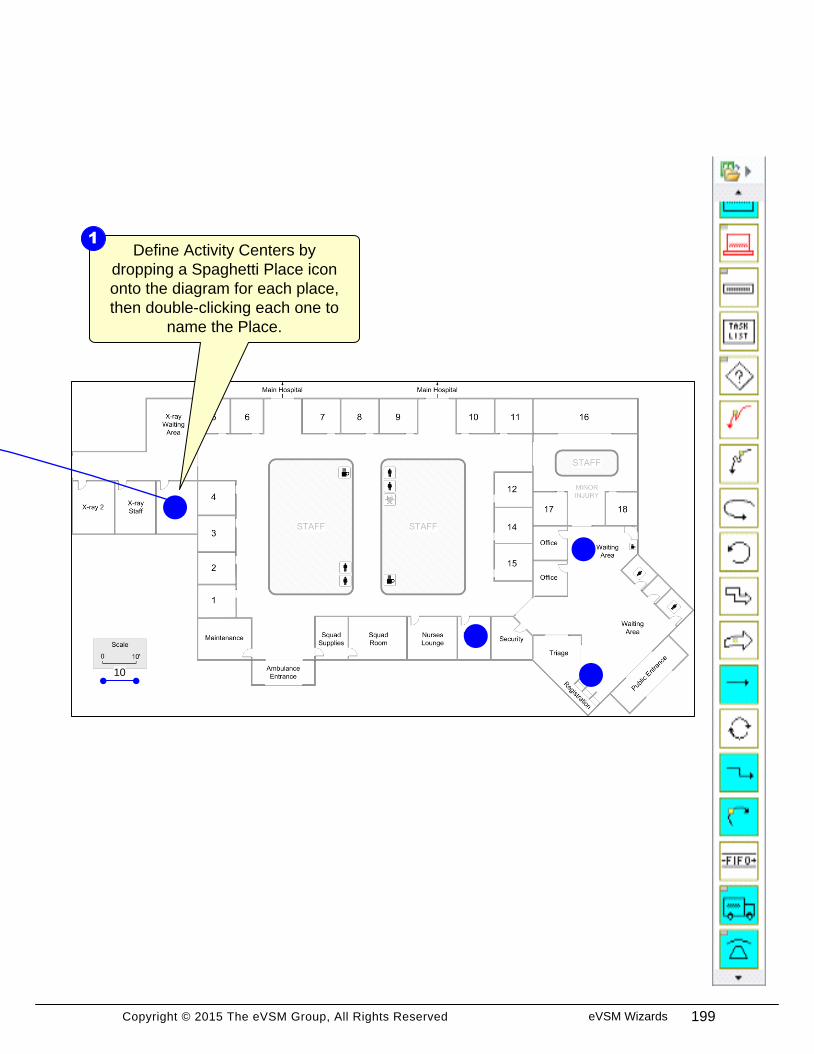
Copyright © 2015 The eVSM Group, All Rights Reserved
Add Spaghetti Places
Define Activity Centers by
dropping a Spaghetti Place icon
onto the diagram for each place,
then double-clicking each one to
name the Place.
1
10
199eVSM Wizards

Copyright © 2015 The eVSM Group, All Rights Reserved
Draw Spaghetti PathsStep 6:
eVSM Data
WizSpaghet
ti
7.30.0187.0
Any of the line tools in the
Drawing toolbar can be used
in Visio 2003/2007
Line tools in
Visio 2010
In Visio 2003/2007, the line drawing tools are
in the Drawing Toolbar. This can be opened
via the right-mouse menus on the Visio
Toolbars. In Visio 2010, the drawing tools are
near the center of the "Home" ribbon.
1
200

Copyright © 2015 The eVSM Group, All Rights Reserved
Draw Spaghetti Paths
Use the Visio line drawing tools to map the
paths. You must ensure that each path
starts and ends in a Spaghetti Place icon.
You can set color and line thickness of the
paths using standard Visio formatting.
2
10
201eVSM Wizards
Copyright © 2015 The eVSM Group, All Rights Reserved
Create Spaghetti ReportStep 7:
eVSM Data
WizSpaghet
ti
7.30.0187.0
202

Copyright © 2015 The eVSM Group, All Rights Reserved
Create Spaghetti Report
Click the Solve button. eVSM will create a
spreadsheet report of the paths. Note that
the Solve button recreates the Excel
report, it DOES NOT update it.
1
10
Solve
203eVSM Wizards

Copyright © 2015 The eVSM Group, All Rights Reserved 204

Copyright © 2015 The eVSM Group, All Rights Reserved
This tutorial will guide you through the steps to generate a
standard work chart using the Standard Work Wizard.
8
Day
Hr
60
Hr
Min
60
Min
Sec
eVSM Data
WizStandard
Work
7.20.0008.2
Demand
allA0010
DemandItemDay75
Takt Time Min6.40
Take Order
A00301
Manual Time
Min1
Machine Time
Min0
Manual Wait
Min0
Batch Size Item1
Pick Lemons
for Prep
A00401
Manual Time
Min0.5
Machine Time
Min0
Manual Wait
Min0
Batch Size Item1
Deliver to
Customer
A00501
Manual Time
Min1.5
Machine Time
Min0
Manual Wait
Min0
Batch Size Item1
Prep Lemons
A00701
Manual Time
Min2
Machine Time
Min0
Manual Wait
Min0
Batch Size Item1
Start Juicer
A00801
Manual Time
Min0.5
Machine Time
Min1.5
Manual Wait
Min1.5
Batch Size Item1
Unload Juicer
A00901
Manual Time
Min0.75
Machine Time
Min0
Manual Wait
Min0
Batch Size Item1
A0020
Server
1
Resource Takt
Min6.40
A0060
Maker
1
Resource Takt
Min6.40
Walk Time
Sec15
Walk Time
Sec1
Walk Time
Sec15
Walk Time
Sec10
Walk Time
Sec1
Walk Time
Sec1
SWCS Summary
Z0010all
CapacityItemDay
136.49
FTE Staff1.32
Standard Work Chart
Min0 1 2 3 4 5 6 7
Unload Juicer : A0090
Start Juicer : A0080
Prep Lemons : A0070
Maker : A0060
Deliver to Customer : A0050
Pick Lemons for Pre.. : A0040
Take Order : A0030
Server : A0020
Upstream Walk
Legend
Eff Manual Time
Eff Manual Wait
Eff Machine Time
Resource Time
Eff Act Takt Time
Operator Balance Chart
Min
0
1
2
3
4
5
6
7
A0020
Ser
ver
A0060
Mak
er
Resource Time
Legend
Resource Takt
Standard Work Wizard Tutorial
205eVSM Wizards

Copyright © 2015 The eVSM Group, All Rights Reserved
On your Desktop, click
the “Start eVSM” icon.
1
Click to enable
macros.Click “Trust all from
publisher” to avoid the
security notice in future.
3
4
If you see a message like this,
you must “Enable” macros.
2
Step 1: Start eVSM
206

Copyright © 2015 The eVSM Group, All Rights Reserved 207eVSM Wizards

Copyright © 2015 The eVSM Group, All Rights Reserved
Quick_eVSM
Learn eVSM BasicsStep 2:
Avoid re-sizing eVSM shapes. Instead
grow the drawing page when needed.
To resize the page, hold down the “Ctrl”
key, and then drag any page edge to the
required size. This method works on all
four edges of the page.
2
VSM
Save your Visio file and then
insert a new page via the right-
mouse menus on the page-tabs.
5
208

Copyright © 2015 The eVSM Group, All Rights Reserved
Learn eVSM Basics
Blue icons in the main stencil
represent families of shapes. Drag
out the Transport icon.
3
Use the shape’s
right-mouse menus
to turn it into a car
4
eVSM Help resources are available in
the Learn module of the toolbar. Hover
over each one to see what they do.
1
209eVSM Wizards

Copyright © 2015 The eVSM Group, All Rights Reserved
Click the Open button. Select
Standard Work in the Wizard
column and click OK.
Drag out the
red icons first.
This is very
important!
3
1
Enter the
amount of hours
per day.
4
Initiate the map Standard Work WizardStep 3:
The Standard Work
Wizard stencil will
open on the left.
2
8
Day
Hr
60
Hr
Min
60
Min
Sec
eVSM Data
WizStandard
Work
7.20.0008.2
StandardWork Data
Customer Center
Open
210

Copyright © 2015 The eVSM Group, All Rights Reserved
Initiate the map Standard Work Wizard
Demand
allA0010
DemandItemDay75
Takt Time MinAuto
Enter the
customer
demand
here.
5
211eVSM Wizards

Copyright © 2015 The eVSM Group, All Rights Reserved
Draw the FlowStep 4:
8
Day
Hr
60
Hr
Min
60
Min
Sec
eVSM Data
WizStandard
Work
7.20.0008.2
The green shapes are
called “Centers”. Use
the centers to represent
the flow.
1
Complete as shown
below, including
annotation and data
values.
2
Activity Center
Take Order
A00201
Manual Time
Min1
Machine Time
Min0
Manual Wait
Min0
Batch Size Item1
Pick Lemons
for Prep
A00301
Manual Time
Min0.5
Machine Time
Min0
Manual Wait
Min0
Batch Size Item1
Deliver to
Customer
A00401
Manual Time
Min1.5
Machine Time
Min0
Manual Wait
Min0
Batch Size Item1
Prep Lemons
A00501
Manual Time
Min2
Machine Time
Min0
Manual Wait
Min0
Batch Size Item1
Start Juicer
A00601
Manual Time
Min0.5
Machine Time
Min1.5
Manual Wait
Min1.5
Batch Size Item1
Unload Juicer
A00701
Manual Time
Min0.75
Machine Time
Min0
Manual Wait
Min0
Batch Size Item1
Resource Center
A0100
Server
1
Resource Takt
MinAuto
A0110
Maker
1
Resource Takt
MinAuto
Do not change
any of the “Auto”
fields. These will
calculated later.
3
212

Copyright © 2015 The eVSM Group, All Rights Reserved
Draw the Flow
Demand
allA0010
DemandItemDay75
Takt Time MinAuto
213eVSM Wizards

Copyright © 2015 The eVSM Group, All Rights Reserved
Sequence ArrowsStep 5:
8
Day
Hr
60
Hr
Min
60
Min
Sec
eVSM Data
WizStandard
Work
7.20.0008.2
Hold down the SHIFT key and
select the centers in the order
shown here. This is the
sequence in which the server
will perform their tasks. Do
NOT connect a sequence
arrow from the last task back
to the server
1
Take Order
A00201
Manual Time
Min1
Machine Time
Min0
Manual Wait
Min0
Batch Size Item1
Pick Lemons
for Prep
A00301
Manual Time
Min0.5
Machine Time
Min0
Manual Wait
Min0
Batch Size Item1
Deliver to
Customer
A00401
Manual Time
Min1.5
Machine Time
Min0
Manual Wait
Min0
Batch Size Item1
Prep Lemons
A00501
Manual Time
Min2
Machine Time
Min0
Manual Wait
Min0
Batch Size Item1
Start Juicer
A00601
Manual Time
Min0.5
Machine Time
Min1.5
Manual Wait
Min1.5
Batch Size Item1
Unload Juicer
A00701
Manual Time
Min0.75
Machine Time
Min0
Manual Wait
Min0
Batch Size Item1
A0100
Server
1
Resource Takt
MinAuto
A0110
Maker
1
Resource Takt
MinAuto
A
B
C
D
Click the Sequence
button to add sequence
arrows.
2
Sequence
214

Copyright © 2015 The eVSM Group, All Rights Reserved
Sequence Arrows
Demand
allA0010
DemandItemDay75
Takt Time MinAuto
215eVSM Wizards

Copyright © 2015 The eVSM Group, All Rights Reserved
Sequence Arrows Part 2Step 6:
8
Day
Hr
60
Hr
Min
60
Min
Sec
eVSM Data
WizStandard
Work
7.20.0008.2
Sequence arrows have
been added with data on it
as well. Enter the Walk
Time from each center.
Double-click the unit to
change it from Min to Sec.
1
Take Order
A00201
Manual Time
Min1
Machine Time
Min0
Manual Wait
Min0
Batch Size Item1
Pick Lemons
for Prep
A00301
Manual Time
Min0.5
Machine Time
Min0
Manual Wait
Min0
Batch Size Item1
Deliver to
Customer
A00401
Manual Time
Min1.5
Machine Time
Min0
Manual Wait
Min0
Batch Size Item1
Prep Lemons
A00501
Manual Time
Min2
Machine Time
Min0
Manual Wait
Min0
Batch Size Item1
Start Juicer
A00601
Manual Time
Min0.5
Machine Time
Min1.5
Manual Wait
Min1.5
Batch Size Item1
Unload Juicer
A00701
Manual Time
Min0.75
Machine Time
Min0
Manual Wait
Min0
Batch Size Item1
A0100
Server
1
Resource Takt
MinAuto
A0110
Maker
1
Resource Takt
MinAuto
A
B
C
D
Walk Time
Sec15
Walk Time
Sec1
Walk Time
Sec15
Hold down the SHIFT
key and select the
centers in the order
shown here for the
second resource and
associated set of
activities.
2
216

Copyright © 2015 The eVSM Group, All Rights Reserved
Sequence Arrows Part 2
Demand
allA0010
DemandItemDay75
Takt Time MinAuto
Click the Sequence button to add
sequence arrows.
3
Sequence
217eVSM Wizards

Copyright © 2015 The eVSM Group, All Rights Reserved
Perform CalculationsStep 7:
8
Day
Hr
60
Hr
Min
60
Min
Sec
eVSM Data
WizStandard
Work
7.20.0008.2
Take Order
A0030
Manual Time
Min1
Machine Time
Min0
Manual Wait
Min0
Batch Size Item1
Pick Lemons
for Prep
A0040
Manual Time
Min0.5
Machine Time
Min0
Manual Wait
Min0
Batch Size Item1
Deliver to
Customer
A0050
Manual Time
Min1.5
Machine Time
Min0
Manual Wait
Min0
Batch Size Item1
Prep Lemons
A0070
Manual Time
Min2
Machine Time
Min0
Manual Wait
Min0
Batch Size Item1
Start Juicer
A0080
Manual Time
Min0.5
Machine Time
Min1.5
Manual Wait
Min1.5
Batch Size Item1
Unload Juicer
A0090
Manual Time
Min0.75
Machine Time
Min0
Manual Wait
Min0
Batch Size Item1
A0020
Server
Resource Takt
MinAuto
A0060
Maker
Resource Takt
MinAuto
Walk Time
Sec15
Walk Time
Sec1
Walk Time
Sec15
Walk Time
Sec10
Walk Time
Sec1
Walk Time
Sec1
Fill in the
remaining Walk
Times.
1
SWCS Summary
1
1
1
1
2
2
2
2
218

Copyright © 2015 The eVSM Group, All Rights Reserved
Perform Calculations
Demand
allA0010
DemandItemDay75
Takt Time MinAuto
Click the Solve button
in the toolbar.
4
SWCS Summary
Z0010all
CapacityItemDay
Auto
FTE StaffAuto
Drag out the
Summary Center
3
Click the Auto Path button
and the Auto Tag button to
create path numbers and
tags for each resource.
This is a critical step to get
the standard work chart to
plot in the correct order
2
Auto Path Auto Tag
Solve
219eVSM Wizards

Copyright © 2015 The eVSM Group, All Rights Reserved
Visualize with ChartsStep 8:
8
Day
Hr
60
Hr
Min
60
Min
Sec
Take Order
A0030
Manual Time
Min1
Machine Time
Min0
Manual Wait
Min0
Batch Size Item1
Pick Lemons
for Prep
A0040
Manual Time
Min0.5
Machine Time
Min0
Manual Wait
Min0
Batch Size Item1
Deliver to
Customer
A0050
Manual Time
Min1.5
Machine Time
Min0
Manual Wait
Min0
Batch Size Item1
Prep Lemons
A0070
Manual Time
Min2
Machine Time
Min0
Manual Wait
Min0
Batch Size Item1
Start Juicer
A0080
Manual Time
Min0.5
Machine Time
Min1.5
Manual Wait
Min1.5
Batch Size Item1
Unload Juicer
A0090
Manual Time
Min0.75
Machine Time
Min0
Manual Wait
Min0
Batch Size Item1
A0020
Server
Resource Takt
Min6.40
A0060
Maker
Resource Takt
Min6.40
Walk Time
Sec15
Walk Time
Sec1
Walk Time
Sec15
Walk Time
Sec10
Walk Time
Sec1
Walk Time
Sec1
1
1
1
1
2
2
2
2
eVSM Data
WizStandard
Work
7.30.0000.1
220

Copyright © 2015 The eVSM Group, All Rights Reserved
Visualize with Charts
Demand
allA0010
DemandItemDay75
Takt Time Min6.40
All Auto fields are
now calculated.
1
SWCS Summary
Z0010all
CapacityItemDay
96.97
FTE Staff1.32
SWCS
Chart
Drag out the SWCS
chart shape and right-
click to Plot Chart.
3
Balance
Chart
Drag out the Balance
chart shape and right-
click to Plot Chart.
2
Standard Work Chart
Min0 1 2 3 4 5 6 7
Unload Juicer : A0090
Start Juicer : A0080
Prep Lemons : A0070
Maker : A0060
Deliver to Customer : A0050
Pick Lemons for Pre.. : A0040
Take Order : A0030
Server : A0020
Upstream Walk
Legend
Eff Manual Time
Eff Manual Wait
Eff Machine Time
Resource Time
Eff Act Takt Time
Operator Balance Chart
Min
0
1
2
3
4
5
6
7
A0020
Ser
ver
A0060
Mak
er
Resource Time
Legend
Resource Takt
221eVSM Wizards

Copyright © 2015 The eVSM Group, All Rights Reserved 222

Copyright © 2015 The eVSM Group, All Rights Reserved
eVSM Training Evaluation Form
Name:_____________________________ Title/Role:___________________
Email:_____________________________
Please indicate your impressions of the items listed below.
Strongly
Agree
Agree Neutral Disagree Strongly
Disagree
1. The training met my expectations
2. I will be able to apply the
knowledge learned.
3. The training objectives for each
topic were identified and followed.
4. The content was organized and easy
to follow.
5. The materials distributed were
pertinent and useful.
6. The trainer was knowledgeable.
7. The quality of instruction was good.
8. The trainer met the training
objectives.
9. Class participation and interaction
were encouraged.
10. Adequate time was provided for
questions and discussion.
11. How do you rate the training overall?
q q q q q
q q q q q
q q q q q
q q q q q
q q q q q
q q q q q
q q q q q
q q q q q
q q q q q
q q q q q
q q q q q
Excellent Good Average Poor Very Poor
12. What aspects of the training could be improved?
223eVSM Wizards

Copyright © 2015 The eVSM Group, All Rights Reserved
eVSM Training Evaluation Form
THANK YOU FOR YOUR FEEDBACK!
1. Describe the next VSM activity you are involved in. (Role, Training, Purpose, Team, Sponsor)
2. Do you plan to use the tools you have learned about in the workshop? If so, how?
3. What challenges do you envisage in applying these tools?
4. What advantages will you realize in applying these tools?
5. Other Comments?
224


