87
Improving Performance in Practice (IPIP) Change Package Coaching Practices Improving Healthcare State by State Martha Rome, RN, MPH Milwaukee, WI February 11, 2009
| Date post: | 13-Dec-2015 |
| Category: |
Documents |
| Upload: | ernest-evans |
| View: | 219 times |
| Download: | 1 times |

Improving Performance in Practice (IPIP)Change Package
Coaching PracticesImproving Healthcare State by State
Martha Rome, RN, MPHMilwaukee, WI
February 11, 2009

Aims of IPIP
• To dramatically improve patient outcomes by transforming the way we deliver primary care, focusing initially on measurable improvement in diabetes and asthma, but rapidly spreading to preventive services and other conditions
• To assist different types of practices in using practice redesign strategies to improve efficiency and implement best practices
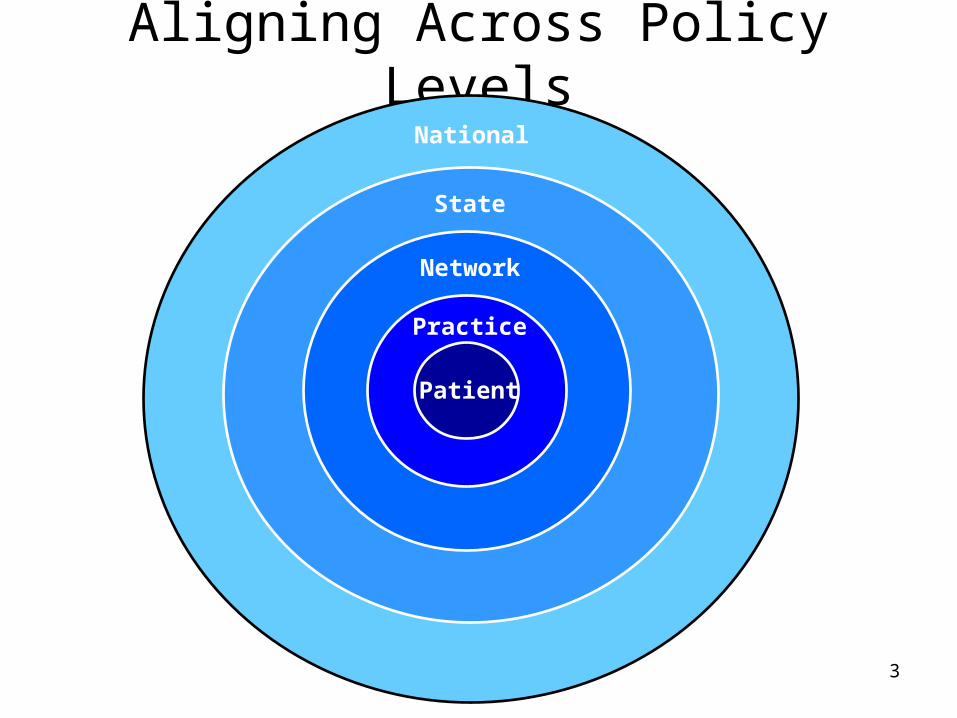
• To align efforts and motivate action at the national, regional, state, practice and patient level
3
Aligning Across Policy LevelsNational
State
Network
Practice
Patient

Build will on state level and create state infrastructure
• National specialty societies work through state chapters• Specialty Boards provide clear expectations for
maintenance of certification• Partner with other organizations in the state
– AHEC, QIO, payers, businesses, state government
• Aligning state efforts creates the IPIP model• National Team supports states with:
– Standard protocols– Decision support tools – Access to other practices who’ve done this work successfully– Access to experts in the field– Data aggregation and reports
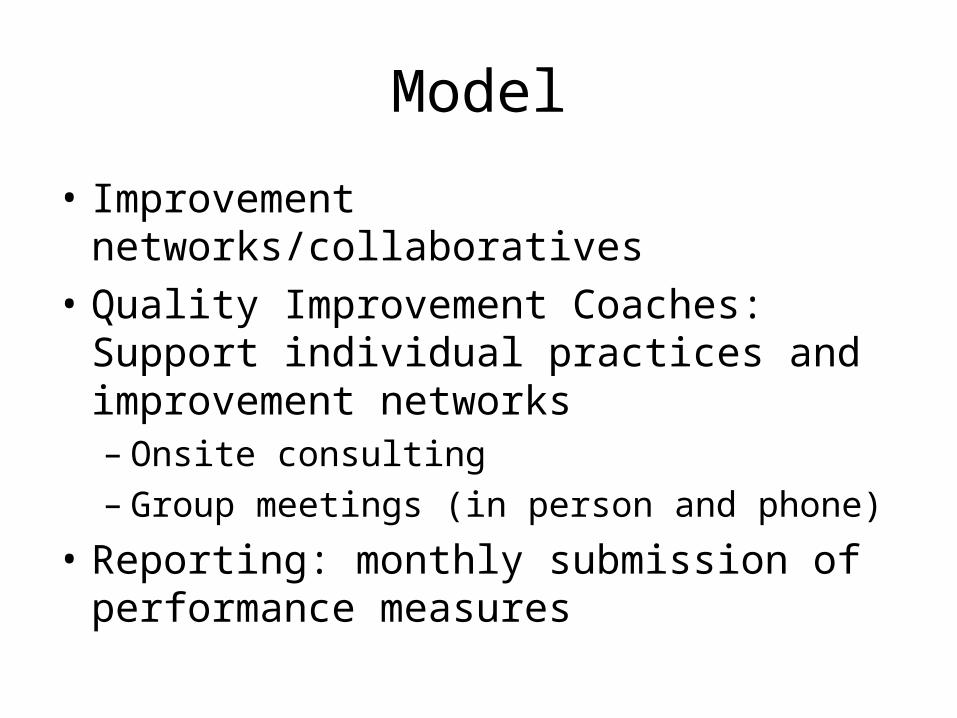
Model
• Improvement networks/collaboratives
• Quality Improvement Coaches: Support individual practices and improvement networks – Onsite consulting– Group meetings (in person and phone)
• Reporting: monthly submission of performance measures
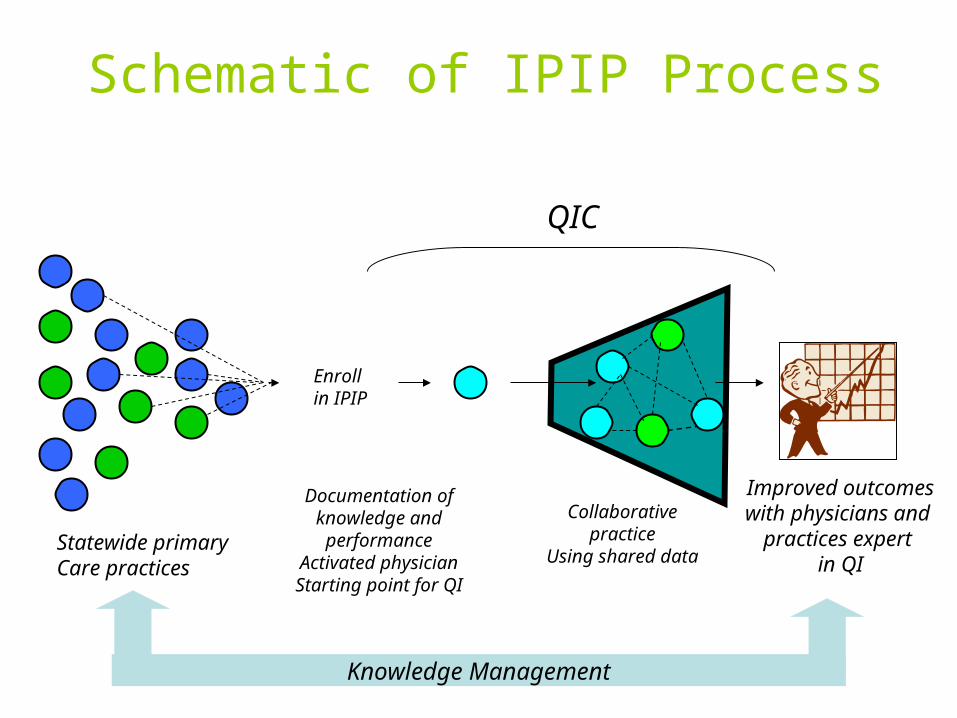
Documentation of knowledge and
performanceActivated physicianStarting point for QI
Collaborative practice
Using shared data
Improved outcomeswith physicians and
practices expert in QI
Schematic of IPIP Process
Enrollin IPIP
Statewide primaryCare practices
Knowledge Management
QIC
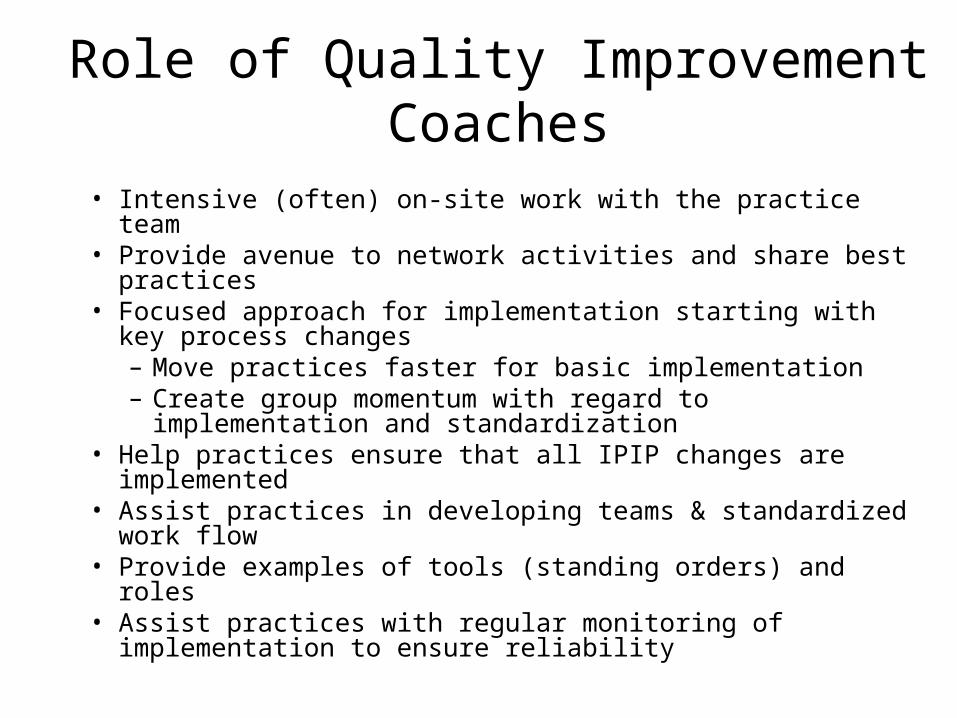
Role of Quality Improvement Coaches
• Intensive (often) on-site work with the practice team• Provide avenue to network activities and share best
practices• Focused approach for implementation starting with key
process changes– Move practices faster for basic implementation– Create group momentum with regard to implementation
and standardization• Help practices ensure that all IPIP changes are
implemented• Assist practices in developing teams & standardized work
flow• Provide examples of tools (standing orders) and roles• Assist practices with regular monitoring of implementation to
ensure reliability

8
Living with chronic illness is like piloting a small plane

9
To get safely to their destinationpilots need:
• Self-Management Support
• Effective ClinicalManagement
• Treatment Plan
• Close Follow-up
• Flight instruction
• Preventive Maintenance
• Safe Flight Plan
• Air Traffic ControlSurveillance

10
Usual care works well if your plane is about to crash

11
The IOM Quality Report:Selected Quotes
• “The current care systems cannot do the job.”
• “Trying harder will not work.”
• “Changing care systems will.”

12
Systems are perfectly designed to get the results they achieve
The Watchword

13
Evidence-basedClinical ChangeConcepts
A Recipe for Improving Outcomes
LearningModel
System ChangeConcepts
What are we trying toaccomplish?
How will we know that achange is an improvement?
What change can we make thatwill result in improvement?
Model for Improvement
Act Plan
Study Do
System change strategy
Select Topic
Planning Group
Identify Change
Concepts
Participants
Prework
LS 1
P
S
A D
P
S
A D
LS 3LS 2
Action Period Supports
E-mail Visits Web-site
Phone Assessments
Senior Leader Reports
Event
A D
P
S
(12 months time frame)

14
Advantages of a General System Change Model
• Applicable to most preventive and chronic care issues
• Once system changes in place, accommodating new guideline or innovation much easier
• Early participants in our collaboratives using it comprehensively

15
Essential Element of Good Chronic Illness Care
Informed,ActivatedPatient
ProductiveInteractions
PreparedPractice Team

16
What characterizes a “prepared” practice team?
PreparedPractice Team
At the time of the visit, they have the patient information, decision support, people,
equipment, and time required to deliver evidence-based clinical management and
self-management support

17
What characterizes a “informed, activated” patient?
Patient understands the disease process, and realizes his/her role as the daily self manager. Family and caregivers are engaged in the patient’s
self-management. The provider is viewed as a guide on the side, not the sage on the stage!
Informed,ActivatedPatient

18
•Assessment of self-management skills and confidence as well as clinical status•Tailoring of clinical management by stepped protocol•Collaborative goal-setting and problem-solving resulting in a shared care plan•Active, sustained follow-up
Informed,ActivatedPatient
ProductiveInteractions
PreparedPractice Team
How would I recognize aproductive interaction?

19
Informed,ActivatedPatient
ProductiveInteractions
Prepared,ProactivePractice Team
DeliverySystemDesign
DecisionSupport
ClinicalInformation
Systems
Self-Management
Support
Health System
Resources and Policies
Community
Health Care Organization
Chronic Care Model
Improved Outcomes
20
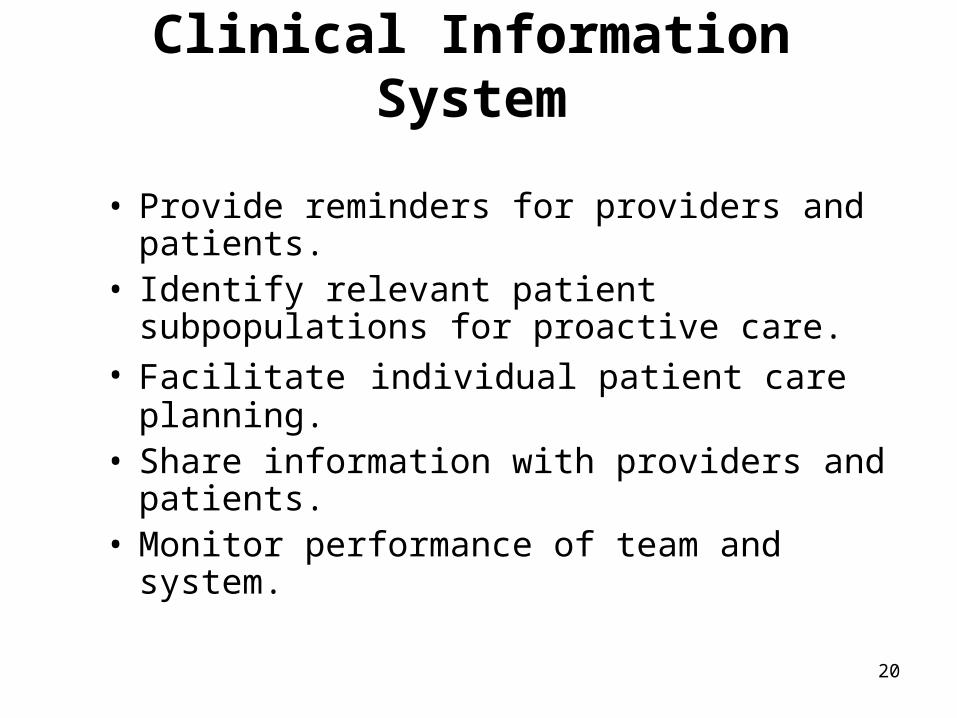
Clinical Information System
• Provide reminders for providers and patients. • Identify relevant patient subpopulations for
proactive care.• Facilitate individual patient care planning.• Share information with providers and patients.• Monitor performance of team and system.

21
Delivery System Design
• Define roles and distribute tasks amongst team members.
• Use planned interactions to support evidence-based care.
• Provide clinical case management services.• Ensure regular follow-up.• Give care that patients understand and that fits
their culture
22
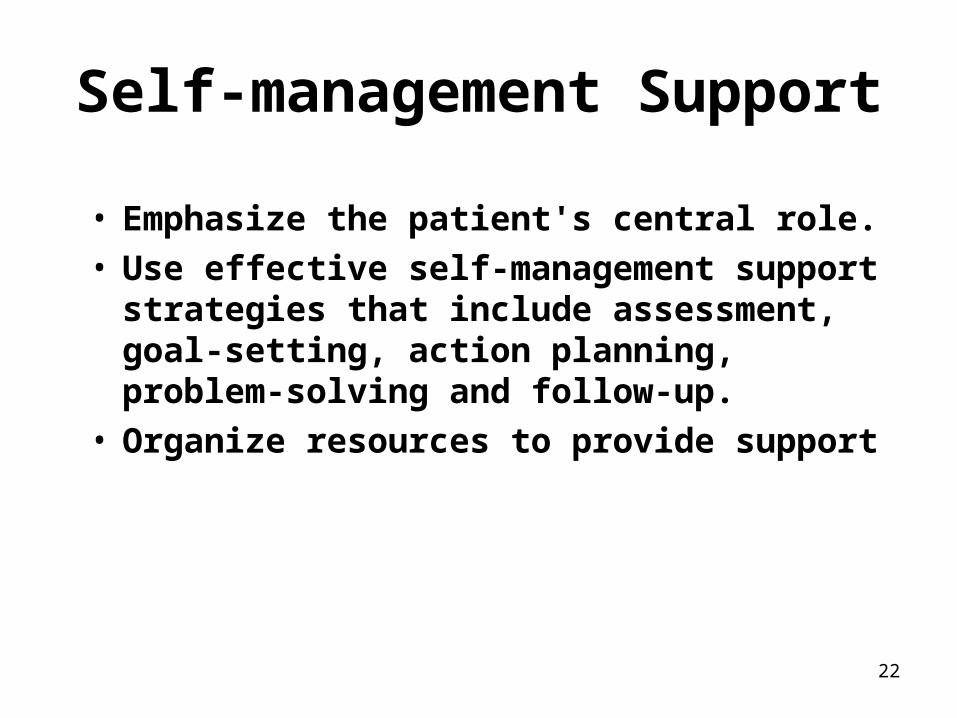
Self-management Support
• Emphasize the patient's central role.• Use effective self-management support
strategies that include assessment, goal-setting, action planning, problem-solving and follow-up.
• Organize resources to provide support

23
To Change Outcomes (e.g., HbA1c) Requires Fundamental Practice Change
• Interventions focused on guidelines, feedback, and role changes can improve processes
• Interventions that address more than one area have more impact
• Interventions that are patient-centered change outcomes.
Renders et al, Diabetes Care, 2001;24:1821

24
Templates Related to Better Performance and Less Variation (IPIP
practices)

25
IPIP Change Package
• High-leverage Changes– Implement Registry– Use Template for Planned Care– Use Protocols– Adopt Self-management Support Strategies

Implement IPIP Changes in Steps
1. Use Registry to identify asthmatics/diabetics prior to visit (this requires the work of implementing a registry or “fixing” the EHR)
2. Use condition-specific decision support tool (e.g., visit planner)
3. Create customized flow diagram and protocols to standardize the care process
• Nursing Standing Orders to increase reliable execution [examples]• Standard Protocol [example]• Specific Care Team roles: who does what in the protocol
4. Implement a self-management support system
Throughout: Frequent monitoring of reliability and investigation of failures for ideas about how to improve standard performance
27
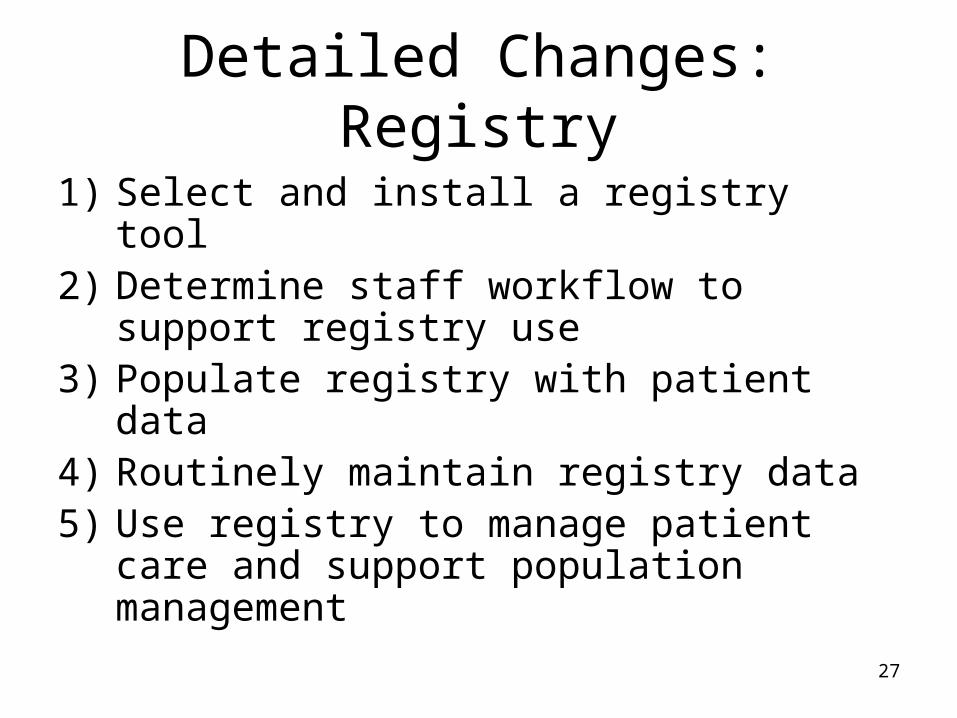
Detailed Changes: Registry
1) Select and install a registry tool2) Determine staff workflow to support
registry use3) Populate registry with patient data4) Routinely maintain registry data5) Use registry to manage patient care
and support population management

28
Detailed Changes: Templates
1) Select template tool from registry or create a flow sheet
2) Determine staff workflow to support use of template
3) Use template with all patients4) Ensure registry updated each time
template used5) Monitor use of template

29
Detailed Changes: Protocols
Step 3: Use Protocolsa. Select and customize evidence-based
protocols to officeb. Determine staff workflow to support
protocols, including standing ordersc. Use protocols with all patientsd. Monitor use of protocols

30
Protocols: Asthma-specific
• Assess and document asthma severity and control
• Prescribe appropriate asthma medications and monitor overuse of beta agonists
• Use Asthma Management plans• Establish visit frequency protocol• Assess and treat co-morbidities• Assess, counsel, and prevent exposure
to environmental triggers

31
Protocols: Diabetes
• Check and treat BP <130/80• Check and treat cholesterol • Check A1C and treat hyperglycemia• Assess aspirin and prescribe if not using• Assess need for eye exam and make
referral if needed• Assess nephropathy risk• Perform foot exam • Provide appropriate vaccines

32
Self-management Support
• Obtain patient education materials (e.g., asthma action plans)
• Determine staff workflow to support SMS
• Provide training to staff in SMS techniques
• Set patient goals collaboratively• Document and monitor patient progress
toward goals• Link with community resources (schools,
service organizations)

33
IPIP System Diagram
Intervention/Change ConceptsKey Drivers Outcomes
Implement Registry
Determine staff workflow to support registry
Populate registry with patient data
Routinely maintain registry data
Use registry to manage patient care & support population management
Use Templates for Planned Care
Select template tool from registry or create a flow sheet Determine staff workflow to support template Use template with all patients Ensure registry updated each time template used Monitor use of template
Employ Protocols
Select & customize evidence-based protocols for asthma and diabetes Determine staff workflow to support protocol, including standing orders Use protocols with all patients Monitor use of protocols
Provide Self-Management Support
Obtain patient education materials
Determine staff workflow to support SMS
Provide training to staff in SMS
Set patient goals collaboratively
Document & monitor patient progress toward goals
Link with community resources
Use Registry to Manage Population Identify each affected patient at every visit Identify needed services for each patient Recall patients for follow-up
Planned Care
Care Team is aware of patient needs and work together to ensure all needed services are completed
Standardized Care ProcessesPractice-wide guidelines implemented per condition (asthma, diabetes
Self Management Support
Realized patient and care team partnership
Improved clinical outcomes for patients with diabetes and asthma
Measures of success:Diabetes: >70% BP < 130/80 >70% LDL < 100 mg/dl <5% A1c greater than 9.0% >80% received dilated eye exam >90% tested (or treated) for nephropathy >90% counseled to stop tobacco use
Asthma: >90% control assessed >90% with persistent asthma on anti-inflammatory medication >90% with influenza vaccination >75% with: assessment of control + anti-inflammatory + influenza vaccination
34
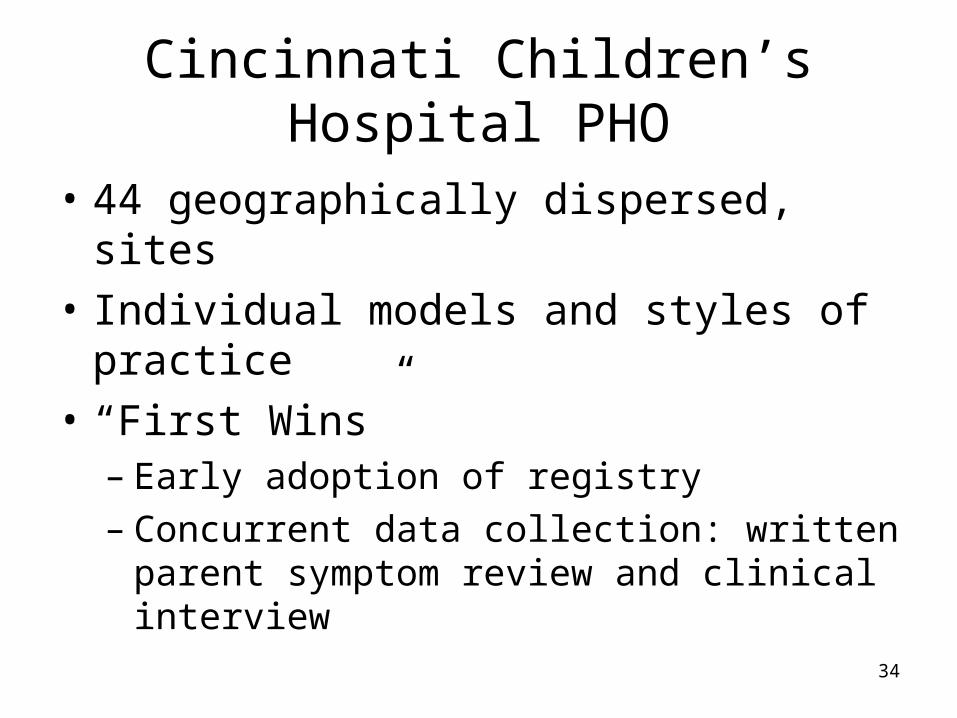
Cincinnati Children’s Hospital PHO
• 44 geographically dispersed, sites
• Individual models and styles of practice
• “First Wins”– Early adoption of registry– Concurrent data collection: written parent
symptom review and clinical interview

35
BMF Included
Cumulative Percent of Network Asthma Population Receiving "Perfect Care"
8/05Web Site
with RegistryLaunched
10/04Desktop PC
RegistryInstalled at Practices
3/05Self
ManagementCollaborative
8/04Pay for
PerformanceProgram
Announced
5/04Reliability
ImprovementCollaborative
1/04PerformanceFeedbackReports
10/03Project
InceptionRegistry
Established
1/05 Pay for Performance
Rewards Determined
3/31/06
"Perfect Care"
WITH Flu Shot
End 05-06 Season
3/31/05
"Perfect Care"
WITH Flu Shot
End 04-05 Season0%
10%
20%
30%
40%
50%
60%
70%
80%
90%
100%Oc
t 03
Dec
03
Feb
04
Apr 0
4
Jun
04
Aug
04
Oct 0
4
Dec
04
Feb
05
Apr 0
5
Jun
05
Aug
05
Oct 0
5
Dec
05
Feb
06
Apr 0
6
Jun
06
Aug
06
Oct 0
6
Dec
06
Feb
07
Apr 0
7
Jun
07
PHO practices achieve > 80% reliability (“perfect care”)

36
Percent of asthma population with 1 or more CCHMC asthma related admissions ( Monthly )
0.0%
0.1%
0.2%
0.3%
0.4%
10/0
3 n=
1192
5
12/0
3 n=
1192
5
02/0
4 n=
1192
5
04/0
4 n=
1192
5
06/0
4 n=
1192
5
08/0
4 n=
1192
5
10/0
4 n=
1192
5
12/0
4 n=
1192
5
02/0
5 n=
1192
5
04/0
5 n=
1192
5
06/0
5 n=
1192
5
08/0
5 n=
1192
5
10/0
5 n=
1192
5
12/0
5 n=
1192
5
02/0
6 n=
1192
5
04/0
6 n=
1215
3
06/0
6 n=
1240
1
08/0
6 n=
1244
3
10/0
6 n=
1263
1
12/0
6 n=
1264
3
02/0
7 n=
1258
2
04/0
7 n=
1272
0
06/0
7 n=
1272
3
08/0
7
Percent Center Line Control Limits
10/03 project initiation
Center Line has been recalculated based on data from 11/05 through 12/06.
80% of Patients Receive “Perfect Care”
Relationship between changing process and changing outcome

37
Impact of PHO Asthma Initiative
ED Visits per 1,000
0
0.5
1
1.5
2
2.5
3
Baseline Improvement Period
ED
Vis
its
Comparison
PHO
Asthma Admissions per 10,000 Children
0
2
4
6
8
10
Baseline Improvement Period
Ad
mis
sio
ns
/10
,00
0Comparison
PHO

38
UNITE HERE Health CenterUNITE HERE Health Center
Founded 1914 by ILGWU
Union mergers over the years, now UNITE HERE
Comprehensive Primary and Specialty Care
Serves predominantly UNITE HERE members, their families and retirees and SEIU 32BJ members
1000 office visits/week
12 PCP’s, 40 specialists, all staff bilingual
On Site Physical Therapy, Radiology and Pharmacy

39
Primary Care TeamsPrimary Care Teams High functioning multidisciplinary teams with 2 hours protected meeting time every other week
Huddles
–Led by MA who does chart reviews day before
–First 20 minute appointment blocked
–Identify patients for health coach interventions
Cell phones and walkie-talkies
Protocols developed & incorporated into EMR templates

40
TeamworkTeamwork
• PCAs trained in monofilament testing, glucose diaries and ABC cards
• Standing orders for Pneumovax and ophthalmology appointments
• Pharmacy gets A1C lists for medication review
• Health Coaches for DM education, self management goal setting, BP checks and blood glucose checks

41
Transforming Medical Assistants into Transforming Medical Assistants into Health CoachesHealth Coaches
Curriculum developed for in-house training
Didactic and observational testing
Promotion to “Health Coach” after competency evaluation
Supervision by Nurse Practitioner and RN coordinator

42
Evidence Based CareEvidence Based Care
• All providers use the DM template
• Review and discussion of data at provider meetings
• DM always on the agenda
• Provider educational seminars
• Provider chart reviews

43
Challenges Challenges
% of patients with BP <130/80
40
50
60
70
80
90
May-05
Aug-05
Nov-05
Feb-06
May-06
Aug-06
Nov-06
Feb-07
May-07
Aug-07
Nov-07
Feb-08
May-08
Aug-08
Nov-08
Months
Per
cen
tag
e .

44
Focus on HypertensionFocus on Hypertension
• Reinforced use of BP check visit – patient sees RN or Health Coach
• New protocol and training for MA to recheck BP if high prior to seeing PCP
• BP Loan Program
• Chart Reviews
• Discussion with PCPs at monthly meeting

45
CHART REVIEW FOR UNCONTROLLED CHART REVIEW FOR UNCONTROLLED HYPERTENSION IN PEOPLE WITH DIABETESHYPERTENSION IN PEOPLE WITH DIABETES
Number of patients: 122 BP at last PCP visit: <140/90 72 (59%) >140/90 50 (41%)
Was BP rechecked after first reading: Yes 37 (30%) No 86 (70%) Number of medications for HTN: 0- 14 (11%) 1- 28 (23%) 2- 34 (28%) 3- 26 (21%) 4- 13 (11%) >4- 6 (5%) 2 or fewer 76 (62%) 3 or fewer 102 (84%) Was uncontrolled HTN identified as a problem: Yes 82 (67%) No 40 (33%) Took medications for HTN on day of visit: Yes 33 (27%)
No 24 (20%) Not in note 51 ( 42%) N/A 8 (7%)

46
PCP DiscussionsPCP Discussions
• Monthly PCP meetings
• Results of chart reviews drive PCP discussion
• Discuss clinical management of HTN
• Ask PCP with best results – what do you do?
• Share best practices - start with combination drugs
47
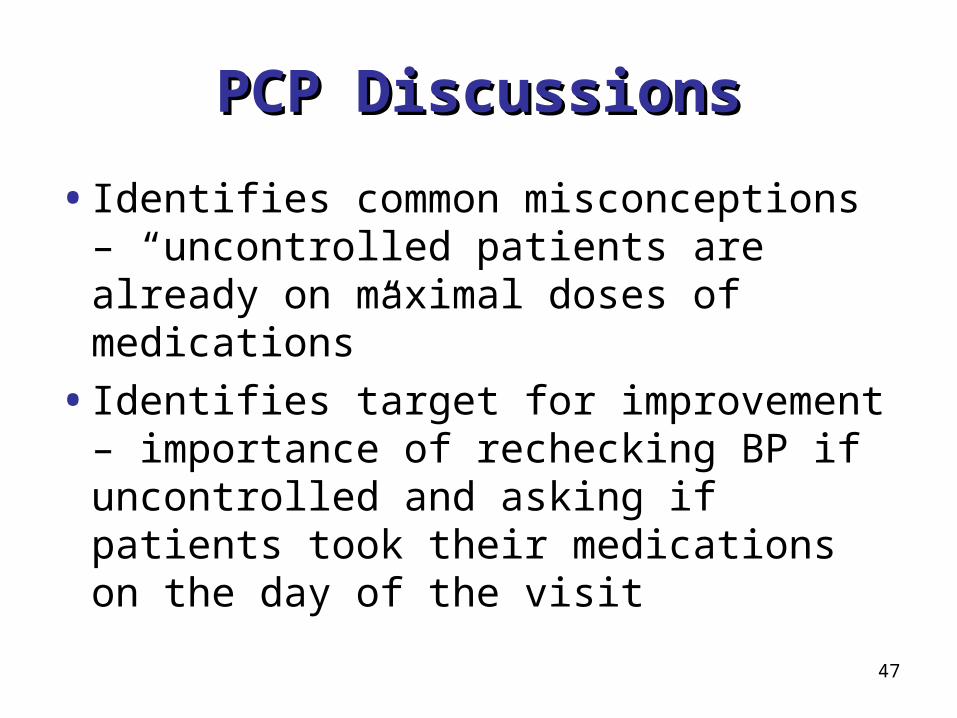
PCP DiscussionsPCP Discussions
• Identifies common misconceptions – “uncontrolled patients are already on maximal doses of medications”
• Identifies target for improvement – importance of rechecking BP if uncontrolled and asking if patients took their medications on the day of the visit

48
The Multidisciplinary Team: The key to successful planned
diabetes care and quality improvement in our practice
Robb Malone, PharmDUNC General Internal Medicine
January 20, 2009
49
Change is scaryChange is hardChange is an opportunity to improveChange is complicatedChange is necessaryChange requires leadershipSuccessful change requires a well designed, active team
Water cooler discussions

50
We assessed root causes and actionsRoot Causes Actions
Continuity of care is poor because providers have limited clinical time
Make clinical pharmacists available to patients daily
Patients often miss follow-up appointments
Call patients to remind them of appointments
Transportation barriers can hinder care Increase phone management; 1-800 number; transportation program
Physicians lack time and skill to provide proper diabetes education
Pharmacists provide individualized education
Patients have low education and literacy Design interventions that do not rely on literacy
Physicians contribute to clinical inertia by failing to escalate therapy
Need agreement on evidence-based treatment algorithms; Pharmacists use algorithms to escalate therapy with physician sign-off
Tracking of patient outcomes is poor Design registry to allow better tracking of patients

51
Everything tipped in late 2007:How did we hit ‘The Tipping Point’?
• “The level at which the momentum for change becomes unstoppable.“
• "Ideas and products and messages and behaviors spread like viruses do.“
– The Tipping Point: How Little Things Can Make a Big Difference. Malcolm Gladwell
Consensus driven growth that focused on the teamwork, contribution from all, and leadership development in QI
Acceptance from the late majority and laggards

52
What did we learn from What did we learn from the first 3 years?the first 3 years?
• ‘Every system is perfectly designed to get the results it gets’
• If we don't like the results we have to change the system- basically and radically
• Providers responded to data and information at the point of care– Addressed unanswered questions
• We must build consensus and standardize
• We must diversify
• We need to move more quickly
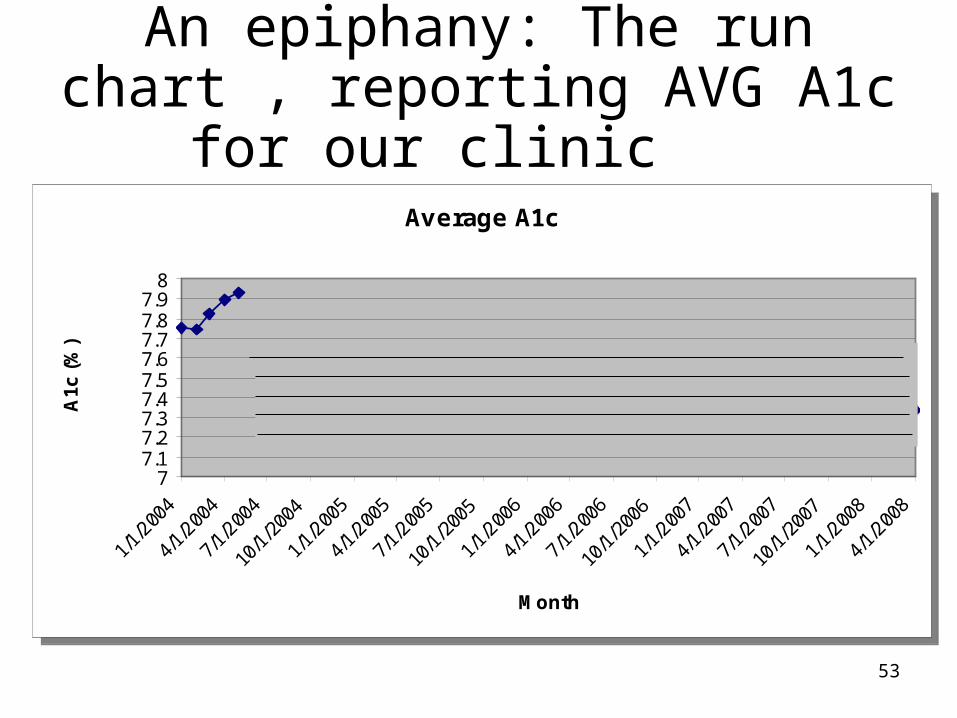
53
An epiphany: The run chart , reporting AVG A1c for our clinic
2004
Average A1c
77.17.27.37.47.57.67.77.87.9
8
1/1/
2004
4/1/
2004
7/1/
2004
10/1
/200
4
1/1/
2005
4/1/
2005
7/1/
2005
10/1
/200
5
1/1/
2006
4/1/
2006
7/1/
2006
10/1
/200
6
1/1/
2007
4/1/
2007
7/1/
2007
10/1
/200
7
1/1/
2008
4/1/
2008
Month
A1c
(%
)
Average A1c
77.17.27.37.47.57.67.77.87.9
8
1/1/
2004
4/1/
2004
7/1/
2004
10/1
/200
4
1/1/
2005
4/1/
2005
7/1/
2005
10/1
/200
5
1/1/
2006
4/1/
2006
7/1/
2006
10/1
/200
6
1/1/
2007
4/1/
2007
7/1/
2007
10/1
/200
7
1/1/
2008
4/1/
2008
Month
A1c
(%
)

54
Diabetes planned care• Patient registry• Robust decision support• Prompting and stratification of patients by risk
– Stepped care approach
• All patients eligible and recruited for care• Patient-centered education• Care coordination• Expanded standardization and algorithmic care• Extensive quality reporting• Adoption of the Model for Improvement (MFI)

55
What we learned from 2003 to 2006What we learned from 2003 to 2006• A successful program includes:
– A multidisciplinary team
– A registry with decision support for proactive care
– Consensus backed by evidence-based algorithms and standards
• Persistence and leadership are key
• Appropriately designed interventions or systems can overcome patient vulnerability
• We continually evolve, change is necessary and represents opportunity– Embrace rapid cycle change and the MFI
56
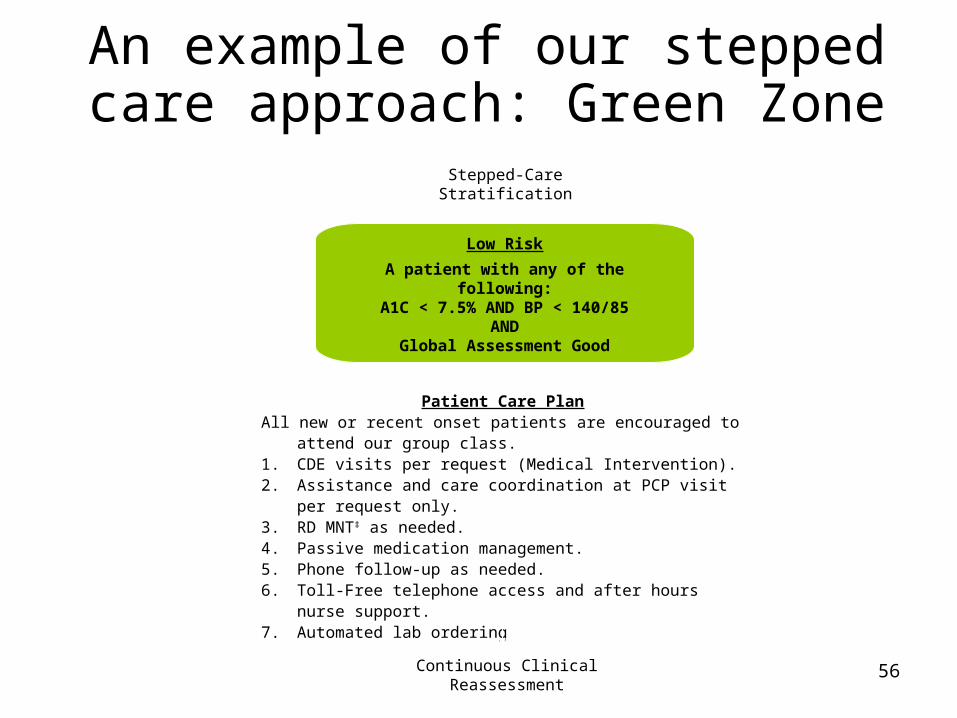
An example of our stepped care approach: Green Zone
Low Risk
A patient with any of the following:A1C < 7.5% AND BP < 140/85
ANDGlobal Assessment Good
Stepped-Care Stratification
Patient Care PlanAll new or recent onset patients are encouraged to attend our group
class.1. CDE visits per request (Medical Intervention).2. Assistance and care coordination at PCP visit per request only.3. RD MNT‡ as needed.4. Passive medication management.5. Phone follow-up as needed.6. Toll-Free telephone access and after hours nurse support.7. Automated lab ordering
Continuous Clinical Reassessment
~ 40% of our patients

57
An example of our stepped care approach: Yellow Zone
Moderate Risk**
A patient with any of the following:A1C 7.5 to 8.5% AND BP 140-160/85-90
ANDGlobal Assessment Fair
Stepped-Care Stratification
Patient Care PlanAll new or recent onset patients are encouraged to attend our group
class.
Quarterly CDE visits (Medical Intervention).1. Intense medication management.
If not on ASA, start.If not on Statin, start.
2. Assistance and care coordination at most PCP visits.3. Target 3 RD MNT‡ visits per year.4. Phone follow-up as needed.5. Toll-Free telephone access and after hours nurse support.6. Automated lab ordering and interpretation
Continuous Clinical Reassessment
~ 35% of our patients

58
An example of our stepped care approach: Red Zone
High Risk**
A patient with any of the following:A1C > 8.5% OR BP > 160/90 OR
Global Assessment PoorOR No ASA or Statin
Patient Care PlanAll new or recent onset patients are encouraged to attend our group class.
1. Bimonthly CDE visits (Medical Intervention).2. intense medication management.
If not on ASA, start.If not on Statin, start.
3. Assistance and care coordination at every PCP visit.4. Target 3 RD MNT‡ visits per year.5. Yearly Nutrition class referral.6. Monthly to biweekly phone follow-up.7. Toll-Free telephone access and after hours nurse support.8. Automated lab ordering and interpretation
Stepped-Care Stratification
Continuous Clinical Reassessment
~ 25% of our patients

59
Role of The Care Assistants• Consists of 4 care assistants
• Care assistants see patients during provider visits– Patient education
– Utilize the tools created by the database
– Assist the physician
– Facilitate proactive care, encourage intervention
– Address barriers, adherence, glucose monitoring, provide smoking cessation counseling, screen for depression

60
Average A1c in our clinic now
Average A1c
77.17.27.37.47.57.67.77.87.9
8
1/1/
2004
4/1/
2004
7/1/
2004
10/1
/200
4
1/1/
2005
4/1/
2005
7/1/
2005
10/1
/200
5
1/1/
2006
4/1/
2006
7/1/
2006
10/1
/200
6
1/1/
2007
4/1/
2007
7/1/
2007
10/1
/200
7
1/1/
2008
4/1/
2008
Month
A1c
(%
)
Average A1c
77.17.27.37.47.57.67.77.87.9
8
1/1/
2004
4/1/
2004
7/1/
2004
10/1
/200
4
1/1/
2005
4/1/
2005
7/1/
2005
10/1
/200
5
1/1/
2006
4/1/
2006
7/1/
2006
10/1
/200
6
1/1/
2007
4/1/
2007
7/1/
2007
10/1
/200
7
1/1/
2008
4/1/
2008
Month
A1c
(%
)

61
Example 1 Lipid screening & management:
A front desk intervention

62
Status of Lipid Management September 2004
• 55% of patients had total cholesterol tested annually
• Approximately 68% were prescribed statins• Average total cholesterol = 185 mg/dl• Average LDL = 99 mg/dl
• We set a goal that 90% of patients would be screened annually and prescribed a statin

63
Front Desk Process
• List of patients with diabetes• Whether or not labs need to be drawn
• We had patients that needed labs that were not getting triaged appropriately
• Looked at front desk logs and process
Plan/Do
Study
64
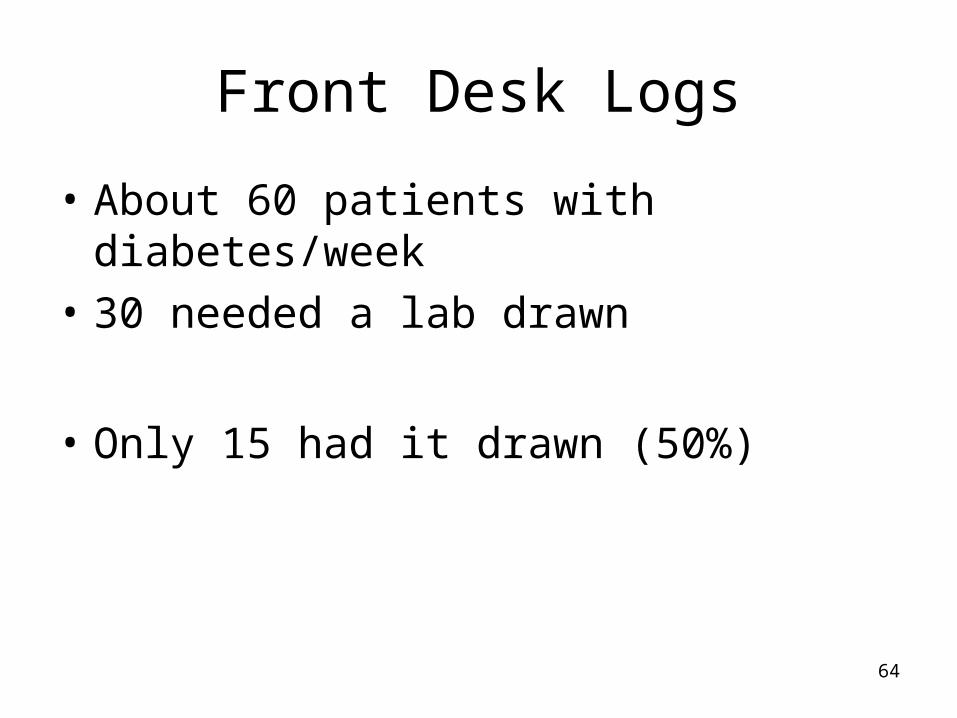
Front Desk Logs
• About 60 patients with diabetes/week
• 30 needed a lab drawn
• Only 15 had it drawn (50%)
Study

65
Pizza for 90% Fidelity
• 25/33 = 75% No pizza
• 34/36 = 94% PIZZA
Act-Plan
Study

66
Percent of Patients with Total Cholesterol Tested Yearly
0
20
40
60
80
100S
ep-0
4O
ct-0
4N
ov-0
4D
ec-0
4Ja
n-05
Feb
-05
Mar
-05
Apr
-05
May
-05
Jun-
05Ju
l-05
Aug
-05
Sep
-05
Oct
-05
Nov
-05
Dec
-05
Jan-
06F
eb-0
6M
ar-0
6A
pr-0
6M
ay-0
6Ju
n-06
Jul-0
6A
ug-0
6S
ep-0
6O
ct-0
6N
ov-0
6D
ec-0
6Ja
n-07
Feb
-07
Mar
-07
Apr
-07
May
-07
Jun-
07Ju
l-07
Aug
-07
Sep
-07
Oct
-07
Nov
-07
% T
ota
l C
ho
lest
ero
l T
este
d Start Automated
StopAutomated
StopAutomated
Re-Start Automated
Front desk fidelity

67
Average Lipid Results
75
100
125
150
175
200
Jul-
05
Au
g-0
5S
ep
-05
Oct
-05
No
v-0
5D
ec-
05
Jan
-06
Fe
b-0
6M
ar-
06
Ap
r-0
6M
ay-
06
Jun
-06
Jul-
06
Au
g-0
6S
ep
-06
Oct
-06
No
v-0
6D
ec-
06
Jan
-07
Fe
b-0
7M
ar-
07
Ap
r-0
7M
ay-
07
Jun
-07
Jul-
07
Au
g-0
7S
ep
-07
Oct
-07
No
v-0
7
Re
su
lts
(m
g/d
l)
Total Chol
LDL
Focus on testing and utilization led to improved lipids

68
Example 2Process measure improvement: Nurse-directed interventions,
improving the prompts
69
Process to engage nurses
• Solidified divisional support for utilizationof the intervention
• Developed educational session with nurses– Meeting introduction by medical director– Revisited intent of the yellow sheets– Reiterated the role of the nurse as an integral
member of our team– Reviewed evidence behind recommendations– Listened to nurses’ concerns
• Developed rapid means of feedback

70
Items to be included in nurse assessment
• Assess as indicated on the prompt– Depression screening
– Smoking assessment and intervention
– Eye referrals
– Monofilament testing
– Pneumococcal vaccination
71
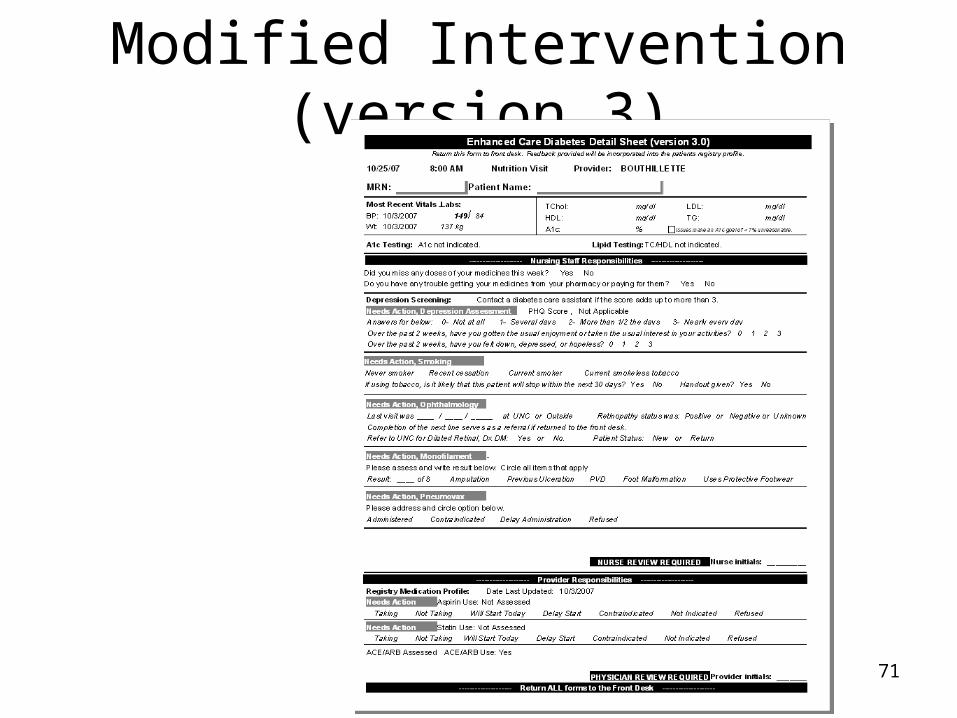
Modified Intervention (version 3)
Feedback and change in clinical focus led to significant revision of the yellow sheets
72
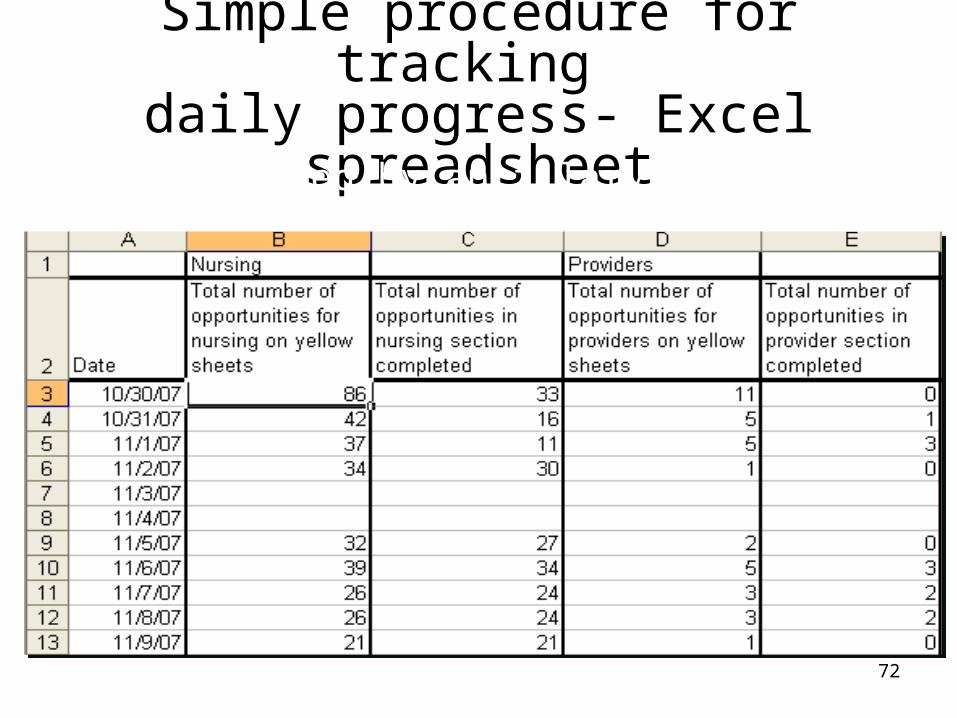
Simple procedure for tracking daily progress- Excel spreadsheet
Completed by ancillary staff

73
Bring on the pizza
Progress with mixed results

74
Widespread, significant improvement noted
75
Provider satisfaction has improved: How has this affected the
life of a physician?
• Delegating processes frees up time to focus on diagnostic and therapeutic issues
• A weight has been lifted
• Excellent to know how the practice performs
• Data has changed our conversations
• It is satisfying to show improved care

76
Diabetes Improvement Across the Practice--Lessons
• Just working harder doesn’t lead to better outcomes
• Just making a policy doesn’t mean the process gets done
• Doctors in our system don’t follow algorithms or policies very well– Other members of the health care team are
better…and that is OK
• Each member must function at their highest level of skill
• Distractions will arise, challenges will occur

77
In Summary: Change Package
• Includes details about making changes, measures, assessment scales and tools
• A resource for practices and QICs• Offers guidance and resources• Remember: Teams’ testing helps adapt
and adopt strategies in their office

IPIP Expectations
• Practices work on redesign of systems of care delivery
• Target improvement in diabetes or asthma
• This becomes how we practice healthcare —continuously tracking, sharing, and improving
• Participation in IPIP meets one requirement for maintenance of certification and qualifies for Continuing Medical Education (CME) credit

Expectations re: Data
• Collect data on performance measures (required)
• Submit numerators and denominators to IPIP via QIC, state program or directly
• Reliable, quality care is provided to the entire population by using registry (or EHR with population management functions)

What do we mean by data?
• Aggregate measures of quality– Based on national standards
(NCQA,AQA,HEDIS)– Physician or practice-based– Additional details enhance understanding of
context and meaning (levels of data quality)– Range of data sources (paper -> Electronic
Health Record)

81
Rely Upon Nationally Endorsed Measures
• Early in IPIP development, it became clear that the scope of determining “ideal” measures was beyond IPIP
• Other organizations exist to do this: NCQA, Physicians Consortium, National Quality Forum, Ambulatory Care Quality Alliance
• IPIP decided to only require measures that had been endorsed by a one or more of the above organizations

82
Benefits and Downsides
• Mitigates the debate about individual opinions
• Dramatically improves our ability to align• Reduces flexibility• Often leaves us with more “clunky” measures
(less sensitive to changes)• Measures sometimes change slower than we
would like (concerns about obsolete)

83
Required IPIP measures are not the only measures practices should be using
Use other measures to help ensure reliable processes and do small PDSAs

84
• The complete IPIP Change Package is in Word format on the Extranet. Look under Resources and then in the Change Package folder.

85

86
References
• www.improvingchroniccare.org
• http://www.med.unc.edu/medicine/generalm/documents/DiabetesResearch.pdf
• www.ihi/org/extranet.
87
• http://www.med.unc.edu/medicine/generalm/documents/DiabetesResearch.pdf


![MAG Service Configuration Mode Commands...Enteringtheabovecommandsequenceresultsinthefollowingprompt: [context_name]host_name(config-mag-service)# SyntaxDescription encapsulation{gre|ipip](https://static.documents.pub/doc/80x56/5fa64aa99b6e755f16468b28/mag-service-configuration-mode-commands-enteringtheabovecommandsequenceresultsinthefollowingprompt.jpg)


