Page 1
School readiness in rural areas of Indonesia. Summary Report 1 / 30
IMPROVING SCHOOL READINESS
THROUGH EARLY CHILDHOOD EDUCATION
IN RURAL AREAS OF INDONESIA
Commenced by:
The United Nations Children's Fund (UNICEF)
and
The Ministry of National Education, Republic of Indonesia
Faculty of Psychology
Atma Jaya Catholic University of Indonesia
Prof. Irwanto, PhD ([email protected] )
Dr. Weny Savitry Sembiring, M.Si., Psi. ([email protected] )
Yapina Widiawati, Psi., M.Psi. ([email protected] )
Ancilla Y. S. Irwan, MAppSocRes ([email protected] )
I. BACKGROUND
A World Fit for Children (May 10th
, 2002) has been set by the UN General Assembly as a
global movement to prioritize children in national development of all member states as an
integral part to achieve the Millennium Development Goals (MDGs). For that, the resolution
provides the following principles and objectives:
1. Put children first.
2. Eradicate poverty: Invest in children.
3. Leave no child behind.
4. Care for every child.
5. Educate every child.
6. Protect children from harm and exploitation.
7. Protect children from war.
8. Combat HIV/AIDS.
9. Listen to children and ensure their participation.
10. Protect the Earth for children.
The above principles and objectives clearly prescribe three important components in every
intervention or program that affect children. First, all interventions/programs should be
sensitive to what constitutes risks to child development. This includes poverty, discrimination
and inequality, violence (including gender-based), health/survival compromising factors such
as HIV epidemic, and ecological degradation. Second, protection of children should be a
mandate to be carried out by state and related parties, namely communities and families.
Third, children rights to be heard or listened to should be respected.
For many decades, Indonesian national development has been focusing on the improvement
of the quality of the Human Resources. But it is only during the political reform at the end of
the second millennium that explicitly focus on pre-school children (0-6 years old) based on
life-cycle approach was adopted in the national development plan. According to this
approach, to assure optimum benefits of early childhood intervention it is crucial to identify
needs and gaps in services since the child is in inception. Unfortunately, for many years early
childhood development programs have been managed and delivered by many sectors in the
Page 2
School readiness in rural areas of Indonesia. Summary Report 2 / 30
government that leads into inefficiency and ineffectiveness due to overlaps and lack of cross-
sectors integration and control. The most pressing problems with regard to Early Childhood
Development (ECD) in Indonesia are limited coverage of existing ECD services, low
participation and low quality of ECD services. The situation gets worse for the unreachable
children, those who are disadvantage and vulnerable.
Even though the National Education System Law 20/2003 recognizes early childhood
education as a stage preceding basic education, yet it is not part of the compulsory basic
education. The national EFA target is 75% coverage of early childhood education services for
0-6 year olds by 2015, with an interim target of around 60% by 2009. However, the majority
of pre-primary school age children do not have access to developmental and early learning
opportunities. Only about 37 per cent of 3-6 year old children participate in structured
developmental and early learning activities, with huge disparities between rural and urban
areas. The largest proportions (70%) of children who are not attending ECD are from rural
areas. Poverty and isolation as well as insufficient services limit the capacity of parents and
community to provide good early child care for their children. Lack of national level funding
for ECD is also another challenge for the improvement of ECD services at national level.
In 2006, the Indonesian Government (GoI) has started to develop a holistic ECD model that
is suitable for the context of rural and poor communities in Indonesia aiming for preparing
children go to primary school with sufficient level of school readiness. The program is also
intended to assist GoI to reduce repetition rate at early grade of primary school and dropout
rate at grade 1 and grade 2 of primary school, especially in rural and remote districts.
The ECD model has been developed from the Posyandu was originally established to provide
health and nutritional care and immunization for pregnant mothers, infants and young
children. The ECD center is now called Taman Posyandu, which integrates pre-school
children’s psycho-social and cognitive development with traditional Posyandu services.
A set of activities have been conducted at central level which include advocacy to ECD
stakeholders, Training of Trainers for Master Trainers, KAP researcher training, and
development of training and advocacy materials. In line with the decentralization policy, the
above mentioned activities were then followed by activities at provincial and district levels in
order to develop a comprehensive ECD model which provides ECD services to the children
of 0-6 years old. To date, 363 ECD centers have been established and run in 23 districts in 12
provinces, benefiting about 22,180 children of 0-6 years and 44,360 parents. In line with the
above introduction, and after four years implementing ECD program, there is a need to draw
conclusions on the key program successes and challenges to date. Series of evidence based
advocacy activities are still needed to be conducted in the coming years and the reliable
evidence is expected to be generated from this evaluation, so that ECD best practices may be
integrated into GoI’s ECD programming, planning and budgeting.
II. OBJECTIVES
1. To measure the impact of the current ECD activities on children’s school readiness when
children reach early grade of primary school (grade 1).
2. To address and evaluate contributing factors related to capacity of the family and the
school (teacher and school environment) which may affect school readiness.
3. To endorse the importance of equal rights for all children regardless their situation and
condition including demographic factors.
Page 3
School readiness in rural areas of Indonesia. Summary Report 3 / 30
III. Theoretical Framework
A. Early Childhood Development Programs and Education
To avoid confusion, it is important to distinguish Early Childhood Development (ECD)
Programs and Early Childhood Education. ECD program generally refers to any
interventions (e.g.: health, nutrition, and education) targeted at children in their earliest period
of development and before their 8th birthday as the remarkable period of brain development.
ECD practitioners are convinced that positive experiences and healthy nutritional input
during early childhood will constructively affect the child’s developing brain, general
physical health, and how children relate to others. Developing positive and constructive
intervention during early childhood has been empirically found to correlate with higher
school achievements, productive workforce, resilient and responsible community members
(National Scientific Council on the Developing Child - NSCDC, 2007). In many countries,
ECD program has been recognized as part of an effective policy to fight poverty. Studies
have repeatedly suggested that inequality of investment in health and education between
regions with scarce and abundant resources have resulted in the quality of input children
receive during their sensitive development period. Communities with lower investment are
associated with higher negative child development related outcomes such as child mortality,
school dropouts, juvenile delinquency, adolescent pregnancy, and soon (Jensen, 2009; Coley,
2007). In the national development perspective, it is important to view that ECD is an
important part of community and economic development strategy (NSCDC, 2007).
Early Childhood Education (ECE) is an important component of ECD. ECE brings children
very early in their development period into a semi-structured learning environment where
they learn various scholastic, social, and life related skills to prepare them going into the
world of formal education. In poor communities or nations, ECE has been an important part
of ECD program that receives support from development agencies and monetary authorities.
Investment in ECE has been recognized as the most promising and cost-effective
development initiatives. ECE program in poor communities have been found to deliver long-
term positive results in the quality of human resources (Barnett & Boocock, 1998). Coley
(2002) in his longitudinal study of a national (USA) representative sample of 1998-9
kindergarten children reported that early stimulation both at home and in pre-school program
is related to better reading proficiency and mathematical skills despites of SES and racial
variation. This is consistent with other previous studies such as Duncan, Brooks-Gunn, and
Klebanov (1994) and Essa (1996) who found that SES is a confounding factor in school
related outcomes. Poverty and SES have been found as strong predictors of lower intelligence
scores and problem behavior later in adolescents in the US, especially when coupled with
poor neighborhood and problematic families. Although we cannot generalize poverty across
states and nations, poverty always brings with it an ecology of uncertainty, frequent absences
of parents, problem behaviors of children, helplessness, and malnutrition that are
counterproductive to positive and constructive learning (Jensen, 2009). ECE program in poor
or resource scarce communities is a way to get children into a more nurturing, protective, and
stimulating environment as early as possible to counter balance the negative pressures of
poverty or deprivation. In fact, a review of investment in high-quality ECE yields promising
results, see the following article:
“At risk children who participate in high-quality, center-based programs have better
language and cognitive skills in the first few years of elementary school than do similar
children who did not have such experiences. They tend to score higher on math and
reading tests, and they are less likely to repeat a grade, drop out of school, need special
Page 4
School readiness in rural areas of Indonesia. Summary Report 4 / 30
education or remedial services, or get into trouble with the law in the future. They also
tend to complete more years of education and are more likely to attend a four-year
college. These and other studies also found the most significant benefits accrued to low-
income and minority children and those whose mothers had a high school education or
less” (American Education Research Association, Fall, 2005 – p. 01-2).
What constitute a high-quality ECE program? It is well-recognized that institutional based
program has a better chance of ensuring quality (than non-institutional based) through best-
fitting of the learning environment, recruitment of trained teachers, developing standardized
curriculum, packaging more comprehensive services, and ensuring transition and continuity.
Institutional-based ECE also tend to be easier to get recognition, hence needed assistance,
from local authorities and community leaders. Of course, quality of ECE should also come
from a good assessment of children needs and the capacity of the community. Quality ECE
program, however, should optimize the learning opportunity of children despite of existing
limitations in the community (Jansen, 2009; AERA, Fall, 2005). Essa (1996) also pointed out
that a quality ECE program should consider the ratio of adults who are able to give personal
attention to each child, appropriate and broad learning activities in line with children’s
development phases, and warm and respectful interaction between adults and children. It is
also important to pay attention to family participation as their support for their children
growth and development is the key to successful ECE program. Quality engagement of
parents in planning, implementation, and evaluation of ECE program should be encouraged
(Essa, 1996).
B. School Readiness
School readiness is an important outcome of quality ECD and ECE programs. School
readiness is a topic of interest for parents, teachers, and policy makers. The “school
readiness” concept usually refers to particular qualities or competencies/skills (language,
emotional adjustment and control, independence) physical fitness and well-being, and
attitudinal requirements that enable children to socialize with their friends and follow
instruction from a non-parental adult (Kagan & Rigby, 2003 cited in Centre for Community
Child Health, 2008). Once these are acquired or achieved, a child is considered mature or
ready for school. The UNICEF TOR refers to school readiness as comprising the following
five child qualities, each with measurable/ observable indicators:
a. Physical Health and Well-being
b. Social Competence
c. Emotional Maturity
d. Language and Cognitive Development
e. Communication Skills and General Knowledge
Such conceptualization assumes that “readiness” is only relevant to the developing child and
less to service providers, parents, community, and policy makers. Recent studies suggest that
school readiness is a systemic concept rather than an individual-developmental concept
alone. Parenting practices, cultural values and practices, and local or national policies do not
necessarily support children to learn skills and competencies beyond their own homes and
families. Therefore, school readiness constitutes (Centre for Community Child Health, 2008):
1. The children readiness for school
2. The school readiness for the children
3. The capacity and commitment of families and community to provide opportunities for
their young children.
Page 5
School readiness in rural areas of Indonesia. Summary Report 5 / 30
Through this conceptualization, it is not only parents and children, but the school,
community, and the state are accountable. This is especially important when we put
vulnerability, especially poverty, into the equation (Jensen, 2009). Children coming from
vulnerable families may have more factors affecting their readiness to school. Factors in
parenting, income, community norms and values and state laws may not be as supportive to
these children as compared to children in the mainstream society. In a study conducted in
Minnesota, USA (The Minnesota Department of Education, 2009) to assess school readiness
at Kindergarten entrance, they found that family characteristics, such as income, education
level, language used at home, race/ethnicity, and gender do have impacts on children’s
proficiency or maturity in the measured indicators (Brooks-Gunn & Markman, 2005).
C. The Characteristics of School Readiness
1. Children’s Readiness
Morrison (2009) and Community Pediatric Review (2005) argue that there are several
children’s characteristics when they have started to go to school which can illustrate their
school readiness. Those characteristics, relevant to the five dimension of school readiness
spelled out by the National Education Goals Panel (1999) to reform basic education in the
United States, are as follows:
a. Physical health and development: are consisting of children’s physical development,
health status and physical abilities alongside with age development. Children are expected to
have capabilities on using writing tools and other activities that need hand-eyes coordination.
Children are also ought to have good nutrition and physical health so they can optimally
participate in the learning processes. Children who have disabilities and get sick occasionally
would face difficulties in classes, thus these situations need to be considered as factors that
might contribute on the school readiness.
b. Social and emotional development: are consisting of how children feel about themselves
and others, their abilities to form relationships and the existence of interest and skills to have
positive relationships with adults and other children. These skills will support the learning
process in the class, as example learning through observation and to develop positive
attitudes toward schools.
c. Learning attitudes: these are including independency, abilities to self-control, have
curiosity, enjoy the learning processes, self-confidence and creativity. Children ought to be
able to do the academic tasks with minimum supervision from adults.
d. Language and communication development: these are children’s competencies to
acquire both receptive and expressive language, either verbal or non-verbal abilities. These
are important to understand conversations, follow any instruction and understand the
academic resources. Words recognition will be the foundation to reading skills while
vocabulary will be the foundation to communication skills and advanced cognitive skills.
e. Cognitive and general knowledge development: these are including general knowledge
on environment, basic mathematics and simple problem solving skills. The recognition
abilities on numeric, shapes, colors and sizes are parts of cognitive development. The
experiences that children have got will help them to form the framework of general
knowledge and advanced cognitive development.
In addition to the child-domain indicators, experts believe that school readiness also includes
systemic domain indicators such as the school, family, community, and government care and
education programs (Thompson & Goodman, 2009).
Page 6
School readiness in rural areas of Indonesia. Summary Report 6 / 30
2. The Readiness of Schools and Teachers
Morrison (2009) argued that school readiness is the capacity of schools to educate all
children, whatever their conditions are. There are times when children enter the next level of
education without adequate stimulation and experiences sufficient to continue the learning
process. Thus, the role of schools and teachers is to fulfill the gap between what children
brought to school (input behavior) with school’s upcoming demands and requirements for
further learning. Readiness in the school-domain requires teachers and school administrators
to understand and adapt demands and requirements of further learning with the strength and
interest of each child. In other words, school readiness necessities the school as a learning
institution to adapt their curriculum to the capacity of children and the teachers to help
students in the learning process to achieve the learning objectives (Centre for Community
Child Health, 2008).
3. The Readiness of Parents
Center for Community Child Health (2008) revealed that family and environmental context in
which children live can influence their school readiness. Parents need to have good parenting
skills, and provide learning experiences for children a home. McDevitt and Ormrod (2002)
states that the family environment is a learning place for children. Through the family,
children learn about relationships with other people, responsibilities, use of appropriate
language, gained knowledge about their environment, and other learning opportunities that
can be useful when they go to school. Van Steensel (2006) found that parents, who introduce
book reading in the early age, will have children with good vocabulary when they are in
grade 1 and 2. On the other hand, parents and their parenting practices may function as
barriers that prevent further learning outside of the home. Language competency,
development of child’s autonomy, and fear of separation are a few examples that children
may encounter in their own families that influence their chances to optimize opportunities for
learning outside of their homes (see also Sheridan, Clarke, Marti, Burt & Rohlk, 2005).
4. The Readiness of Local Communities and Government
School readiness can also be affected by the practices of local cultures and policies. Cultures
with certain language or livelihood practices may hinder their children to be integrated in
mainstream schools. In Indonesia, this is the case with indigenous communities such as
Baduy in West Java and Kerinci Tribe in Jambi, Sumatra and other such communities
throughout the Indonesian archipelago. In many societies, minority status, poverty or other
(stigmatized) factors may cause a child not being able to access important community and
government resources and services. Children with disabilities and affected by stigmatized
chronic illnesses such and HIV/AIDS and leprosy, for example, may have very hard times to
be admitted in school facilities. On the other hand, communities and government with active
and progressive early childhood care programs may provide advance learning activities and
health benefits that prepare children better for further learning and education.
In connection with the proposed evaluation to support UNICEF and the Government in
formulating strategies for developing ECE/D programs, the evaluation should consider the
broader parameters. Children will be ready to continue their learning and education if the
family, schools, communities and government provide environments and experiences that
support the development of physical abilities, emotions, language, reading, and cognition in
infants, toddlers and school age children (Barbarin & Wasik, 2009; Centre for Community
Child Health, 2008).
Page 7
School readiness in rural areas of Indonesia. Summary Report 7 / 30
IV. Methodology
In order to achieve the stated objectives, the assessment team used both quantitative and
qualitative research methodologies. The details are as follows:
A. Data Collection Instrument
This assessment used an instrument that was designed and constructed by the Indonesian
Educational Assessment Center (Pusat Penilaian Pendidikan - PUSPENDIK) from the
Ministry of National Education (Kementerian Pendidikan Nasional - Kemendiknas). This
instrument quantitatively measures scholastic and non-scholastic competencies of children in
the first grade of the elementary school. Specifically, the scholastic competencies consist of
six sub-scales, those are:
1. Pre-Reading: This subscale measures students’ ability to recognize different forms,
numbers, and different sounds in a language.
2. Pre-Writing: This subscale measures students’ ability to copy different forms,
alphabets, and to write simple words.
3. Pre-Mathematics: This subscale measures students’ ability to recognize numerical
concepts and counting.
4. Language Proficiency: This subscale measures students’ ability to master Indonesian
language (Bahasa) both in receptive and expressive manners.
5. Problem Solving: This subscale measures students’ ability to solve simple problems.
6. Gross Motor Skills: This subscale measures students’ ability to coordinate or control
large muscles in the body.
The Non-scholastic competencies are divided into the following four subscales:
1. Independence: Measuring to what extent the children do not need assistance,
especially when they are exploring the environment and doing things for themselves,
as well as the needs of parental assistance.
2. Communication: The ability to express their mind in an acceptable manner by others.
3. Relation: The ability to relate, share, and work together with others, including
indications of adequate self-adjustment.
4. Work ethics: The positive atitude that children demonstrate in completing task-
oriented assignments.
After a try-out in PAUD Sedap Malam at Depok, the UAJ assessment team found a number
of missing elements according to our model of school readiness. Those elements were:
1. Measurement on physical health.
2. Measurement on parents’ characteristics.
3. Measurement on teachers’ characteristics.
4. Indicators of a conducive learning environment.
Therefore, as affirmed by UNICEF and the sub-directorate of PAUD in MONE, the UAJ
assessment team added several variables into the instrument. Those were as follows:
1. Measurement on physical health:
- Anthropometric measurement through age, height and weight.
This measurement be calculated in accordance with WHO Child Growth Standard
(World Health Organization (WHO), 2006). Herewith, the UAJ team used body
mass index (BMI) by age that is differentiated by gender.
- Health notes in the last three months.
Page 8
School readiness in rural areas of Indonesia. Summary Report 8 / 30
- Class absence history in the last three months.
2. Measurement on parents’ characteristics:
- Parents’ marital status.
- Parents’ academic background.
- Total income.
- Total persons living in the same household.
- Siblings’ academic background.
- Language used at home.
- Total time spent with children (e.g.: leisure, ECE-related-activities).
3. Measurement on teachers’ characteristics:
- Teachers’ qualifications related to competency for teaching in PAUD and
elementary school.
- Teachers’ expectations of first-grade students input behavior.
4. Indicators of a conducive learning environment:
- Total students in the ES.
- Schools’ facilities to support the learning process.
- (In service) Trainings for teachers.
To enrich the analysis, everyday each assessor should make field-notes (observation notes).
The field-note should capture events or situation that may be related to school readiness but
have not been included in the instrument. Those are as follows:
- The Local Government Institutions, such as: Regional body for planning and
development (Badan Perencanaan Pembangunan Daerah - BAPPEDA), Technical
Service Centres (Unit Pelayanan Teknis - UPT).
- Applied data collection techniques.
- Challenges on data collection process, e.g.: limited access to targeted areas.
- Challenges on creating conducive learning environment in PAUD and ES.
- Supporting factors on creating conducive learning environment in PAUD and ES.
- Observed differences of children with and without ECD.
- Other related points.
Field notes should be discussed with team-mate in every assessment area and at the end of
assessment it was discussed across teams.
B. Sampling Sites
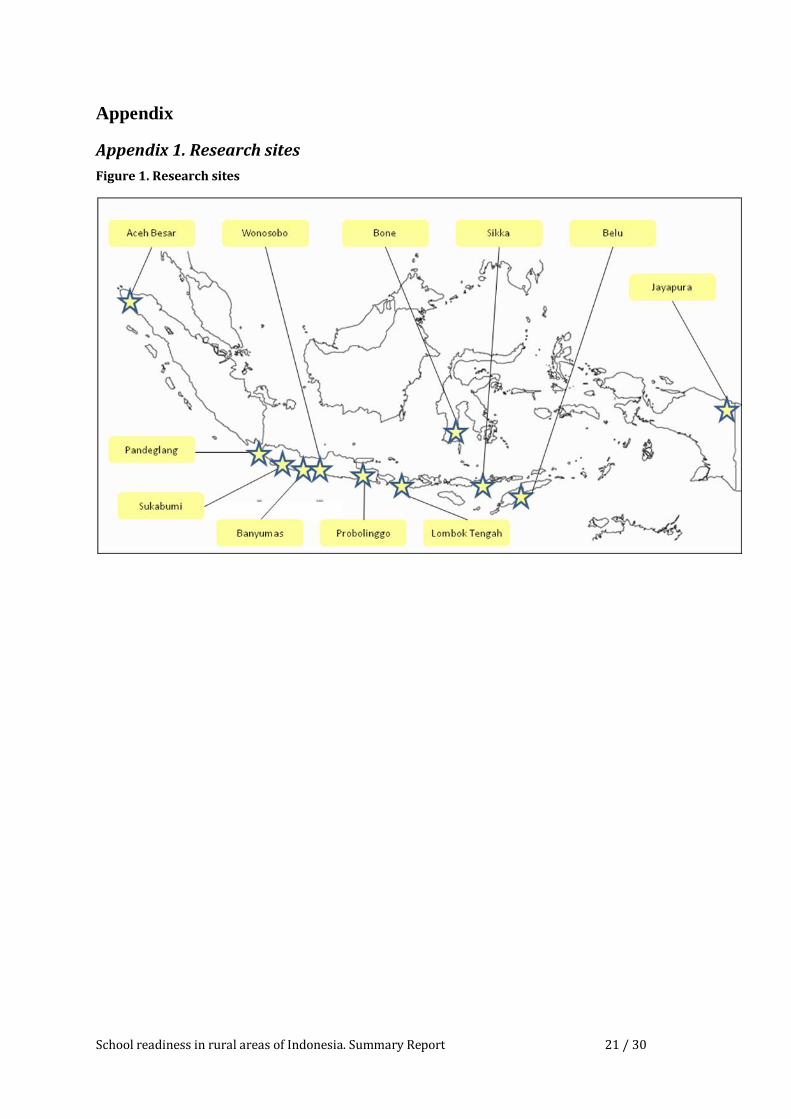
The sampling sites were 11 Districts in Indonesia. Those are (1) districts of Aceh Besar,
Nanggore Aceh Darussalam Province; (2) Pandeglang, West Java Province; (3) Sukabumi,
West Java Province; (4) Wonosobo, Central Java; (5) Banyumas, Central Java; (6)
Probolinggo, East Java Province; (7) Bone, South Sulawesi; (8) Lombok Tengah, West Nusa
Tenggara Province; (9) Sikka, East Nusa Tenggara Province; (10) Belu, East Nusa Tenggara
Province; and (11) Jayapura, . However, the targeted groups of respondents were in the rural
areas of these districts because Taman Posyandu and PAUD locate in the rural areas.
Page 9
School readiness in rural areas of Indonesia. Summary Report 9 / 30
The community in these districts faces many restrictions, not only geographically but also
financially. The UAJ team used more than one type of public transportations to reach those
areas. The location map can be seen in the Appendix 1.
C. Recruitment of Participants
There were two groups of children participated in the assessment. First was the intervention
group these were children who participated in ECD programs either from Taman Posyandu,
PAUD or other programs. The second or control group was composed of children who went
to first grade in elementary school without ever participating in any ECD programs. Children
who repeated first grade were not included in this assessment.
The UAJ team used a simple random sampling to recruit participants. Assessors were
expected to get a list of first grade children. The list should contain information on (1) sex
(female and male), and (2) interventions (Taman Posyandu, PAUD, TK or others, and no
participation). Each child on the list will be given a specific number for randomized selection.
Assessors then selected children randomly as many as needed for each Elementary School.
In practice, however, randomized selection was not possible due to several factors such as
unavailability of the list, limited number of children and demographic situation. In such
situation, assessor should try to get expected number of respondents proportionally. When
this happened, it should be noted in field notes and reported to the team coordinator.
This assessment targeted at least 10 children from each group in every site, so at least there
were 20 children participated in every site. Overall, we were able to recruit 269 first grade
students in 11 selected Districts in Indonesia (see appendix 2). From among them, 208
students had been participated in ECD programs (ECD group) and 61 students without prior
ECD programs exposures (Non-ECD group).
In addition, information data and information were collected from parents (fathers or mothers
of our respondents), teachers and cadres (each school was represented by one first grade
teacher and one cadres). Although we would like to have individual interviews with all of
them, often times we engaged in group interviews.
D. Data Analysis
Data analysis was performed in accordance to the types of data and information. Quantitative
data were analyzed descriptively through several statistical techniques. Means difference
analysis had been performed through two-way ANOVA and t-test. Multiple regressions with
stepwise technique had also been conducted subsequently to answer appropriate questions.
On every statistical analysis, the UAJ assessment team used 0.05 or 95% confidence/
significance level. A correlation analysis was employed to understand the contribution of
demographic data and characteristics of parents, teachers and schools to school readiness
scores. Interview data were analyzed using appropriate rules in qualitative analysis (Miles &
Huberman, 1994).
V. Results
A. School Readiness
In general, the students’ performances in this assessment were unexpectedly high especially
for Gross Motor Skills. Almost all students received maximum score. The Gross Motor Skills
Page 10
School readiness in rural areas of Indonesia. Summary Report 10 / 30
subtest is only represented by one item. Looking at the results, it is clear that the item does
not have a good discrimination power. Based on the data (see appendix 3), we may observe
that students in Sukabumi District have achieved higher scores in Total Scholastic, Total Non
Scholastic and Total Readiness, in contrast to Belu District. Overall, the data also suggests
that children in Java have relatively higher readiness scores than children outside of Java.
B. Objective 1: The Impact of ECD Activities on School Readiness
The first objective is to analyze the impact of ECD activities to school readiness of first grade
students. Thus, the UAJ team employed One-way ANOVA test to verify whether there are
differences among ECD group and Non-ECD group. Additionally, the UAJ team also
employed further analysis to significant factors that contribute to the School Readiness.
1. Means Differences on School Readiness between ECD group and Non-ECD group
Table 4 below shows the results of a t-test between the two groups of children. In all sub-tests
(Non-Scholastic, Scholastic, and Total Readiness) students who were part of ECD program
achieved significantly better scores than Non-ECD students. Further means analysis, their
scores on Language Proficiency and Gross Motor Skills were not significantly different.
Table 1. Results of t-test between ECD and Non-ECD students
Subtests df t-value Sig (two-tailed) p< 0.05
Total Readiness 267 3.730 0.000
Total Non Scholastic 267 2.838 0.005
Total Scholastic 267 3.402 0.001
Pre Reading 267 2.756 0.006
Pre Writing 267 2.260 0.026
Pre Mathematics 267 2.012 0.045
Language Proficiency 267 1.677 0.095 +
Problem Solving 267 2.286 0.023
Gross Motor Skills 267 -0.541 0.589 +
(+) not significant p < 0.05
The results from quantitative analysis are in accordance with qualitative observation by the
UAJ team as assessors. The differences between children who participated in ECD program
in a number of domains with those who never participated were easily observed. Table 2
displays observed differences in seven domains:
Table 2. Observed differences between ECD and Non-ECD students
Observed domains ECD Non-ECD
Interaction with new
strangers
More at ease – able to interact easily. Awkward - shy and timid
Fine motor skill Skillful in using and manipulating
scissors and pencil
Demonstrate some difficulties in using
scissors and pencil
Gross motor skill No differences – developing normally Developing normally
Instruction
comprehension
Ability to comprehend longer
instruction
Difficulties to comprehend longer
instruction. Instructions have to be
broken down into shorter statements.
Page 11
School readiness in rural areas of Indonesia. Summary Report 11 / 30
Comprehension of
Bahasa Indonesia
Ability to follow and understand
instruction in Bahasa Indonesia
Instruction has to be translated into
local dialect or language.
Work completion Driven to complete given task in given
period of time.
Not seriously motivated to complete
given tasks within given period of
time.
Observed domains ECD Non-ECD
Attachment with
parents
At ease being separated from parents –
able to complete tasks without seeking
help from parents (confident).
At ease without parents around but
when faced with challenging tasks
they started to lose self-confident.
Autonomy Quickly engaged in given tasks and
able to deal with problem on their
own.
Hesitation to deal with new tasks –
looking at what their friends are doing
before working on own tasks.
We may conclude, therefore, that there are significant contributions of ECD programs to
school readiness of students. Our quantitative analysis and observation suggest that students
who have been exposed to ECD programs are better prepared for school than those who have
never been exposed to any ECD activities and programs.
2. Means Differences of School Readiness by ECD Institution (PAUD, TK and RA, and Non-ECD)
In this assessment, there are three ECD institutions which are Taman Posyandu or PAUD,
Raudatul Athfal (RA) and Kindergarten (TK). However, as the number of students who had
got intervention from RA was very small, the UAJ team has put students from RA and TK
into one group. So there are two groups based on ECD institutions in this assessment, those
are (1) PAUD and (2) TK&RA.
The graphic in the Appendix 4 illustrates that student who had intervened by ECD programs
has more positive score distribution (top right) either in Scholastic or Non Scholastic.
Especially for those students who had intervened by TK&RA (see the symbol of red square).
To go into details, the UAJ team has run One Way ANOVA to see the differences between
students who had intervened from PAUD, TK and RA and also those who had not intervened
(Non-ECD group). The data shows that there were significant differences between those
groups (see appendix 5). The school readiness of students in ECD groups (PAUD and
TK&RA) was significantly different with Non-ECD group either in Scholastic and Non-
Scholastic domains. The significances were higher in TK&RA group.
Moreover, students in the TK&RA group had achieved significantly higher scores than Non-
ECD group in all subtests of school readiness except in Language Proficiency and Gross
Motor Skills. Similar results appear in the PAUD group. Students were achieved higher
scores than Non-ECD group in all subtests except in Pre Mathematics and Gross Motor
Skills.
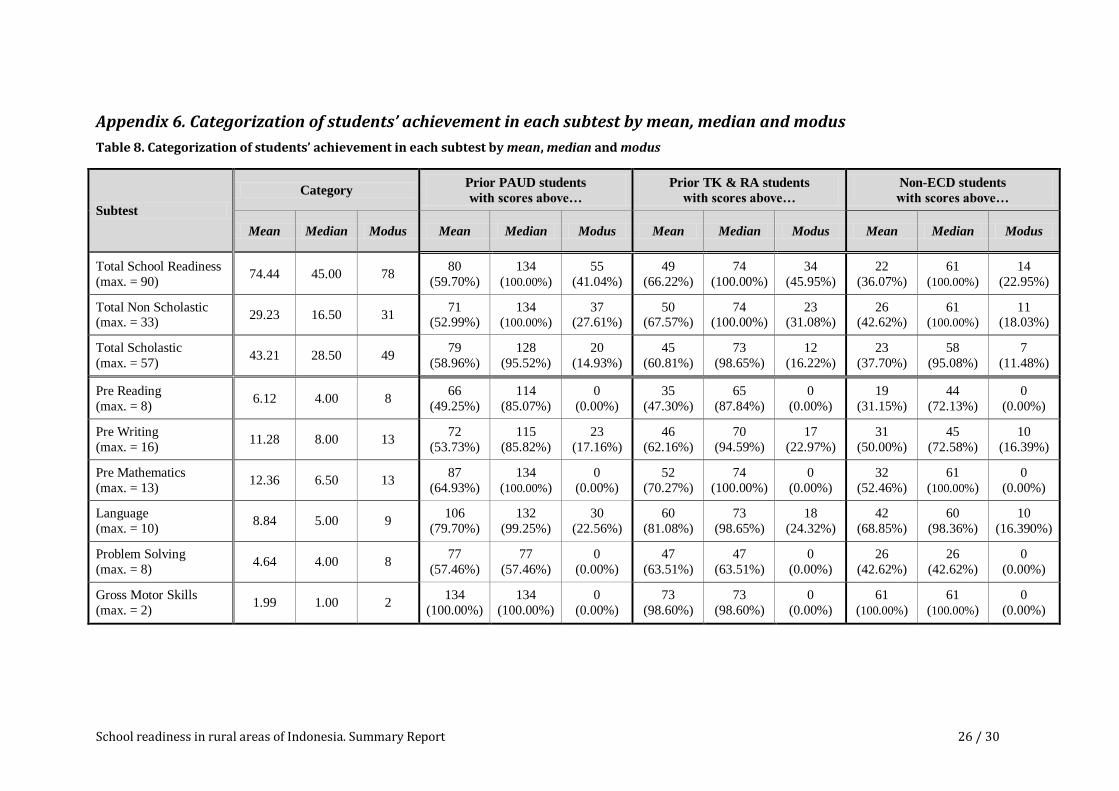
Those differences were more obvious after the UAJ team puts the scores into norm of each
subtest. Since the norm for school readiness has not been set out by PUSPENDIK the UAJ
team has classified the scores into three different norms –mean, median and modus. From the
three likely norms or passing grade for school readiness, we propose that for this report we
use the mean to be the norm because this score is more sensitive to the variation of scores of
Page 12
School readiness in rural areas of Indonesia. Summary Report 12 / 30
all students from different districts. In other words, the mean score would have greater
discriminating power than median or modus.
Based on descriptive comparison (see appendix 6), students from the ECD group had
achieved higher than scores of mean, median and modus. The percentages were greatly
different. As an example, there were more than 50% of students in PAUD and TK&RA
groups who had achieved scores above mean score, while there were only less than 40% from
Non-ECD group. There were 56.03% students from PAUD group and 69.57% students from
TK&RA group who were classified as ready to school. Meanwhile, there were only 36.07%
students from Non-ECD group who can be classified as ready to school. These differences
consistently appear in all subtests except Gross Motor Skills because this subtest has low
discriminate factor. The item could not differentiate students who had optimal motor
development with those who had not.
3. Contributing Factors on School Readiness
As explained earlier, school readiness is not only achieved by ECD programs. There are other
contributing factors which the UAJ team tried to identify. Morrison (2009) argues that ECE is
not only to prepare children to get ready with higher academic degree. It also to assist parents
to the basic of good parenting, improve reading ability of children and parents, develop
healthy and nutritious growth and development including health problems in daily life.
Therefore, the UAJ team has analyzed furthermore to find the contributing factors on school
readiness, those are:
1. Health status of students.
2. Period of exposure to ECD programs.
3. Proficiency to Bahasa Indonesia.
As a preliminary illustration, the demographic characteristics of students in each district are
quite different (see appendix 7). Wonosobo has the highest scores of Body Mass Index
(15.36) and Aceh Besar has the lowest (13.17). On complete immunization, Probolingo has
the highest percentage (96.3) and Belu was the lowest (4.0). Again, it seems children in Java
received better health services that those outside of Java.
a) Health status of children.
In this assessment, the health status of children was measured by BMI (Body Mass Index),
Immunization, and children absenteeism.
Based on the correlation analysis, it has been found that there is significant correlation
between BMI and Total Readiness. Total Scholastic, Pre Reading and Pre Writing (see Table
3 below).
Table 3. Correlation between BMI and school readiness
Subtests N Pearson
Correlation (r) Sig (two-tailed) p< 0.05
Total Readiness 269 0.123 0.044 *
Total Non Scholastic 269 0.019 0.758
Total Scholastic 269 0.144 0.018 *
Pre Reading 269 0.151 0.013 *
Pre Writing 269 0.155 0.011 *
Page 13
School readiness in rural areas of Indonesia. Summary Report 13 / 30
Pre Mathematics 269 0.115 0.060
Language Proficiency 269 0.084 0.170
Problem Solving 269 0.025 0.683
Gross Motor Skills 269 -0.073 0.234
( * ) significant p < 0.05
In addition to that, we also found that children who receive complete immunization (BCG,
DPT, polio, measles, and hepatitis) have significantly better scores on Total Readiness (p <
0.02) and Scholastic (p < 0.04) compared to children without complete immunization.
Especially on Problem Solving sub-tests. No significant differences were found in sub-test
scores based on children absenteeism (p > 0.05).
Although our analysis did not reveal much about the contribution of nutritional and health
status of school readiness, we found that children with complete immunization did better than
those who did not get complete immunization. We might assume that children with complete
immunization were healthier and more resilient and, therefore, were able to optimize their
learning opportunities (Santrock, 2010). We also believe that children who received complete
immunization represent more caring families and. especially parents. Our assessment was not
able to demonstrate that absenteeism negatively contributes to school readiness. However, we
should note that we used the number of days when children were absent from ECD program
in the past three months. The three months period may not long enough to capture indications
of vulnerability among children. Nonetheless, we also believe that any health and nutritional
input into ECD program would have positive and sustained impacts to readiness to school
and general well-being of children.
b) Period of exposure to ECD programs
School readiness can be affected by maturity and the number of years children are exposed to
ECD program. We tested our assumption that length of ECD exposure will significantly
affects all scores, especially Total Readiness in comparison with the scores of Non-ECD
students. The results were presented below in Table 13. Apparently we did not able to find
any significant differences between different categories of period of exposure to ECD with
the scores of Non-ECD students. When we look at the results, however, we noticed that the
means differences tend to be larger the longer children are exposed to ECD program.
We explored different cut-off point to look for the minimum period of exposure to have
meaningful impacts to school readiness. Through this analysis, it illustrates that student who
had exposure for at least 1.5 years did better significantly on Total Scholastic, Pre Writing,
Pre Math, and Language Proficiency than those who had never had any exposure to ECD
classes/programs. The results in details can be observed in the Appendix 8.
c) Proficiency to Bahasa Indonesia
A one way ANOVA is employed to examine mean differences in all sub-tests between those
did not understand Bahasa Indonesia and those who have workable understanding of the
language. The results are presented in Table 4 below. The test found that National language
proficiency is a discriminating factor in most sub-test scores except, understandably, for
Gross Motor skills.
Page 14
School readiness in rural areas of Indonesia. Summary Report 14 / 30
Table 4. Means differences by proficiency level to Bahasa Indonesia
Subtests df F-value Sig.
Total Readiness 267 11.048 0.000 *
Total Non Scholastic 267 5.883 0.003 *
Total Scholastic 267 10.309 0.000 *
Pre Reading 267 5.458 0.005 *
Pre Writing 267 5.368 0.005 *
Pre Mathematics 267 6.912 0.001 *
Language Proficiency 267 19.214 0.000 *
Problem Solving 267 2.789 0.000 *
Gross Motor Skills 267 0.566 0.569
( * )significant p < 0.05
Since the number of those who did not understand Bahasa Indonesia is small (n=15). Further
analysis is employed between those who have difficulties in Bahasa and those who have
workable mastery of the language. The results (see appendix 9) suggest that children who
were proficient in Bahasa Indonesia were significantly different (better) than the other two
groups of children especially on Readiness and Scholastic Total scores.
Proficiency to Bahasa Indonesia has positive impact to school readiness for both Scholastic
and Non Scholastic although the impact was higher in Scholastic. In many districts, Bahasa
Indonesia is not use in daily conversation therefore there were limitations on using Bahasa
Indonesia during the assessment even not in a crucial meaning. However, it is clear that
proficiency to Bahasa Indonesia as the language of the assessment was being the contributing
factor on school readiness.
Moreover, students with different proficiency levels to Bahasa Indonesia (not understand,
understand and proficient) were significantly different in four subtests, those are Pre Reading,
Pre Writing, Pre Mathematics and Language Proficiency. The reason is that in those subtests,
proficiency is very important to understand the instructions. Especially in Language
Proficiency subtest where children were asked to retell activities that they had been doing.
These results are in accordance with Morrison (2009) that to have language proficiency will
not only give broader access to knowledge from environment but also boost the self-
confidence to interact with others. In the end, it will not only improve their social emotional
skills but also their cognitive abilities.
C. Objective 2: Contributing Factors on Family and School Readiness
1. Role of Family
From the outset, this assessment assumes that school readiness which is observed in the
child’s domain characteristics as proposed by UNICEF would be affected by the readiness of
the family to support children in optimizing the benefits of learning activities in ECD
program. According to Epstein (2002). rearing practices at home that support children
learning in ECD program (such as the use of national language. repeating and exercising
activities learned at ECD program. keeping children healthy. etc.), good communication with
Page 15
School readiness in rural areas of Indonesia. Summary Report 15 / 30
ECD facilitators, and parents’ input into the development or improvement of ECD program
would help the program to develop and foster school readiness among children in the
program.
Specifically, there are three characteristics as contributing factors to school readiness those
are (1) parents’ years of education, (2) time spent with children, and (3) total number of
siblings. As described in following Table 13, on the average respondents had around 2 to 3
siblings and their parents only had 6 years of education. Meanwhile, most of fathers had 5 -
12 working hours per day and 3 - 6 hours per day for mothers. The detailed description of
those contributing factors is described in the Appendix 10.
a) Parents’ Education Level
Although school readiness is related to the numbers of year’s fathers were educated. The
overall level of education of parents was low. Many parents were not able to complete their
elementary education. This may influence their contribution to school readiness as they might
not be confident in helping children learning their ECD materials and delegated this
responsibility to older siblings or ECD facilitators (Desforges & Abouchaar, 2003). We
should note that, in spite of learning scholastic skills. they also need to learn customary and
other values as well as socio-emotional skills that may not be taken care of by older siblings
and non-parental care givers (Weiss, Caspe & Lopez, 2006). The significant contribution of
fathers’ years of education suggests that the higher the education of fathers, the higher the
likelihood that children were reared in more supportive family environment.
b) Time Spent with Children
This assessment indicates that the longer the mother works outside of their homes, the higher
the Non-scholastic scores of children. One of the interpretation of this result would be that
while mothers were working outside of the homes, children we able to optimize their social
and emotional learning opportunities under alternative caregivers such as extended family
members or neighbors (children are being cared collectively in closely knit communities such
as in most districts in Indonesia). They manage to deal with peers as well as with culturally
expected caregivers (Weiss, et al., 2006).
Another way of interpreting this result is that according to our observation, many parents
(mothers) took their children with them while working outside of their home. In the
workplace, children were able to play with his/her peers and being taken care of by their
mothers and other caregivers. It is also possible that parents (mothers) who were not able to
care for their children due to working outside of the home, tried to make up their time with
their children when they were home. Therefore, although working mothers have shorter time
to care for their children. They may have better quality of relationship with their children and
are more aware to review what their children have learned in ECD program. Working
mothers tend to have more concerns over their children achievements (Weiss, et al., 2006).
c) Number of Siblings
This assessment found that the higher the number of siblings at home, the lower the readiness
scores. This finding goes along with the time available for parents to process and facilitate
learning opportunities at home and from ECD program. More responsive parents are related
to more positive results in school readiness (Weiss, et al., 2006). Our interviews also revealed
that one of the reason that parents were not able to send their children to an ECD program
Page 16
School readiness in rural areas of Indonesia. Summary Report 16 / 30
was that they were busy taking care of many children at home. The higher the number of
siblings at home the busier the parents and the less likely parents will have time to take
children to ECD program. Spacing and controlling number of children may be an important
issue that affects parents’ readiness to send children to early stimulation.
d) Parents’ income
This study did not found any significant relationships between income of parents and school
readiness. This means that despite of how much parents earned for their livelihood, children
may be intrvened by the community such as through the early child development program to
gain positive skills that contribute to school readiness.
2. Role of School
Morrison (2009) argued that school readiness is the capacity of schools to educate all
children, whatever their conditions are. The UAJ team found out that qualified and well-
trained teachers have higher self-confidence on their works. It means training for teachers is
also a contributing factor of school readiness as it will fulfill the gap between what children
brought to school (input behavior) with school’s upcoming demands and requirements for
further learning. It is important for teachers to have the ability to identify students’ capacities
and facilitate them to be ready.
We also found that it is necessary to have highly-creative-cadres to improve the learning
module. It is also important that cadres need to allocate special time to assist the families
during the period of learning at ECD institutions. Non-integrated childhood education and
training for parents lead to minimum participation of parents to children’s education.
Enthusiasm and strong commitment to teaching children are very important contributing
factors. In several PAUD, several cadres tried to consider different alternatives learning
methods. The UAJ team observed that cadres and concerned community members were
continuously thinking about alternative learning processes as they realized that had only
limited facilities to maximize the output. Similarly, in the elementary schools, teachers and
headmasters were responsible for the learning programs. As an example, every evening first
grade students who still have difficulties on reading and writing will be assisted in a study
group with parental active involvement.
Language used either in PAUD or elementary school will impact students’ proficiency on
Bahasa Indonesia. Quantitative results show that students with proficient Bahasa Indonesia
will have higher readiness. Based on qualitative observation, only a few of cadres and
elementary teachers spoke Bahasa Indonesia during the learning process. Therefore, students’
proficiency on Bahasa Indonesia was not optimal and affected their readiness. Bahasa
Indonesia can be the second language. For example, teachers might give the instruction
bilingually, first with local language and then with Bahasa Indonesia so students can improve
their Bahasa Indonesia proficiency.
3. Role of Community
Earlier we posited that school readiness would also be related to certain characteristics of the
community where children live. In this assessment we were able to interview parents and
teachers on the role of the community. ECD facilitators (cadres) and community leaders
played very crucial role in the success of an ECD program and, hence, school readiness. We
found that community leaders in the districts for this assessment had been very pro-active in
Page 17
School readiness in rural areas of Indonesia. Summary Report 17 / 30
promoting ECD program in their respective communities. ECD cadres were not only
facilitating learning activities for children, but were also involved actively in promoting early
stimulation and care in the community.
Moreover, there were districts where the communities prohibit their children to participate in
ECD programs because some known activities, such as singing, are not in accordance with
certain religious practices. In this case, the role of cadres has been very important in
providing information to help parents understand certain activities and the importance of
education. In some other districts, UAJ team found that some parents were very concerned
that they won’t be able to provide a good and higher education for their children. This was
especially expressed by parents participated in the Posyandu program.
Beside cadres, involvement from religious leaders and community leaders are also expected
to assist parents and support education programs. Many parents acknowledged that they sent
their children to ECD program because they were invited by other parents and urged by
community leaders to participate in the program. In many instances we found stories of
children being picked up by cadres and community leaders and/or neighbors when parents
were not able to take their children to an ECD program by themselves. something that
happened elsewhere (Epstein, 2002).
4. Other Factors
We need to note that ECD is an integrated program targeted not only to children but also to
parents. It is also important to remember that early childhood program should be aimed at
helping children to develop all aspects of development (physical health and nutrition.
cognitive. social. emotional. moral and spiritual (Essa, 1996). As most Indonesian parents are
more familiar with the education component in early childhood intervention, there is a risk of
and ECD program to be easily turned into and Early Childhood Education program with very
limited, more cognitively oriented program. As such, and ECD program would not provide
extra benefits to children coming from poor communities. A good ECD program should be
able to help children in poor communities to get access to primary health care and treatment –
as currently delivered through Posyandu - as well as to early education stimulation. In other
words, children in poor communities need assistance to stay fit and healthy to be able to catch
up with their peers in more affluent communities. It is very crucial to educate parents and
community leaders about the true nature of an ECD program. In addition, it is also important
to keep ECD as an integrated and cross-sectors program.
Local policies have crucial impacts to ECD programs. In Probolinggo, for example, there was
a policy that PAUD is only for those below 4 years old and afterward students should
continue to TK. Therefore, there was a clear role differentiation between PAUD and TK to
minimize rivalry.
VII. CONCLUSION
Our analysis and discussion bring us to the following conclusions:
1. Exposure to early childhood development program significantly helps children with
developing psychosocial and cognitive competencies relevant to readiness to school.
2. Children need to be in an early childhood development program for at least 1.5 year to
gain significant benefits in school readiness.
3. School readiness is related to a number of important contextual factors. such as:
Page 18
School readiness in rural areas of Indonesia. Summary Report 18 / 30
a) Family support, including parents’ level of education, total time spent with children.
and number of siblings. These factors apparently can optimize learning activities of
children in any ECD program.
b) Community readiness: the participation of cadres, community leaders, and school
officers who play very crucial roles to bring children and sustain their participation in
ECD program.
c) Health and nutritional status of children, which suggests that Bina Keluarga Balita
Program (Parent-Child Program - BKB) should be integrated as a part of the early
childhood interventions.
4. Proficiency in Bahasa Indonesia influences significantly how children responded to the
school readiness measurement. However, the current instrument would need further
examination on its discriminating power, especially Gross Motor Skills and Language
Proficiency.
VIII. RECOMMENDATIONS
1. Early childhood intervention does bring positive consequences that help children ready
for school (formal education). Therefore, this intervention should be maintained,
improved, and scaled-up. It is important to note, however, that such intervention should
not lose perspective of its primary objective to help children to be ready to engage in
formal education but at the same time to prevent children from malnutrition and from
common childhood infectious diseases as well as to help develop psycho-social skills.
Considering that this early childhood intervention is targeted toward poor communities, it
should be considered that the Bina Keluarga Balita program be an integral part of the
intervention. This program has been initiated by community members and supported by
local authorities. Local investment in ECD program, therefore, should be encouraged and
scaled-up.
2. To enjoy the benefits of ECD intervention and to scale up its coverage. we would like to
note the following:
a. The program should maintain and sustain the primary health care component. This
is crucial for children and their families from poor communities.
b. Bahasa Indonesia should be encouraged as the language of communication early on
in ECD program. This is especially important because children are getting older and
expected to go to the formal education where the national language is used.
c. Parents’ participation should be appreciated but, at the same time, to be watched
carefully as they may forced ECD program to concentrate only on scholastic skills
(especially reading. writing. and mathematics) and disregard psycho-social
competencies.
3. As indicated by the results of this assessment, children have to participate in ECD
program for at least 1.5 years before they gain significant benefits in school readiness.
This means that children have to be in the program early (may start at 3 years old) to
actually benefit from the existing services.
4. It is crucial that ECD program be scaled-up to cover more children in poor communities.
Investment from local authorities should be encouraged because ECD program should be
viewed as integral part of community development. The long-term benefits will be
Page 19
School readiness in rural areas of Indonesia. Summary Report 19 / 30
enjoyed by no other than the community itself. To encourage optimal participation. ECD
facilities should be established in accessible and safe locations.
5. For future assessment, the School Readiness Instrument should examine its
discriminating power, especially the Gross Motor Skills and Language Proficiency Sub-
tests.
a. The Gross Motor Skills sub-tests should be able to include other activities as
suggested by The Minnesota Department of Education (2009), such as independent
self-care, coordinated movement in simple tasks, and eye-hand coordinated
movements.
b. Sub-test on Language Proficiency, should have simpler instructions in addition to
“Tell a story” to help assessors to distinguish between children who are struggling
with Bahasa Indonesia and those who are more proficient. Although story telling is
a good instruction, many children who are proficient in Bahasa Indonesia are
limited in their vocabularies.
c. On the Auditory part of Pre Reading sub-test, the instruction should be reconsidered
(“phrase”) to ensure that when children respond incorrectly the assessor could
assign with confident whether it is auditory or mere misunderstanding of the
instruction.
6. To scale-up ECD program, we should be able to establish a system of recruitment, in-
service training, and interesting remuneration/incentive for ECD cadres. Currently, there
is no such system. Many cadres did not receive any financial support from local
authorities or sectors’ programs. Without an established system. It would be very difficult
to scale-up and sustain the program.
VIII. RECOMMENDATIONS
Barbarin, O.A. & Wasik, B.H. (Eds.). (2009). Handbook of child development and early
education: Research to practice. New York: The Guilford Press.
Brooks-Gunn, J. & Markman, L.B. (2005). The contribution of parenting to ethnic and racial
gaps in school readiness. The Future of Children, Vol. 1(Spring 2005): pp.139-168.
Centre for Community Child Health. (2008). Policy brief No.10/2008: Rethinking school
readiness. Retrieved April 01st, 2010, from Centre for Community Child Health of
The Royal Children's Hospital:
http://www.rch.org.au/emplibrary/ccch/PB10_SchoolReadiness.pdf
Community Paediatric Review. (2005). School readiness: Parent information. Retrieved April
01st, 2010, from Center for Community Child Health:
http://www.rch.org.au/emplibrary/ccch/CPR_Vol14No3_PS_SchlRead.pdf#xml=http:
//www.rch.org.au/cgi-
bin/texis/webinator/search/pdfhi.txt?query=school+readiness&pr=rchmelb_ext&prox
=page&rorder=500&rprox=500&rdfreq=500&rwfreq=500&rlead=500&rdepth=0&su
fs=0&order=r&cq=&id=4caefa99c7
Page 20
School readiness in rural areas of Indonesia. Summary Report 20 / 30
Desforges, C. & Abouchaar, A. (2003). The impact of parental involvement, parental support
and family education on pupil achievement and adjustment: A literature review.
Cheshire: Department for Education and Skills.
Epstein, J.L. (2002). Center on school, family, and community partnerships. Retrieved
August 25th, 2010, from Board on Children Youth and Families: Division of
Behavioral and Social Sciences and Education:
http://www.bocyf.org/epstein_presentation.pdf
Essa, E. (1996). Introduction to early childhood education (2nd
ed.). Albany: Elmar Publ.
Jensen, E. (2009). Teaching with poverty in mind. Virginia: ASCD.
McDevitt, T.M. & Ormrod, J.E. (2002). Child development and education. New Jersey:
Prentice Hall.
Miles, M.B. & Huberman, A.M. (1994). An expanded sourcebook: Qualitative data analysis.
Thousands Oaks, California: Sage Publications.
Morrison, G.S. (2009). Early childhood education today (7th ed.). Singapore: Pearson Pub.
Santrock, J.W. (2010). Life-span development (7th ed.). Singapore: McGraw-Hill, Inc.
Sheridan, S.M., Clarke, B.L., Marti, D.C., Burt, J.D. & Rohlk, A.M. (2005). Conjoint
behavioral consultation: A model to facilitate meaningful partnerships for families
and schools. Cambridge, Massachusetts: Havard Graduate School of Education.
The Minnesota Department of Education. (2009). Minnesota school readiness study:
Developmental assesment at kindergarten entrance Fall 2008. Retrieved April 01st,
2010, from The Minnesota Department of Education (MDE):
http://archive.leg.state.mn.us/docs/2009/other/090649.pdf
Van Steensel, R. (2006). Relations between socio-cultural factors, the home literacy
environment and children's literacy development in the first years of primary
education. Journal of Research in Reding, Vol. 29(4): pp.367-382.
Weiss, H.B., Caspe, M. & Lopez, M.E. (2006). Family involvement in early childhood
education. Family Involvement Makes a Difference, Vol. 1(Spring 2006): pp.1-8.
World Health Organization (WHO). (2006). WHO chold growth standards: Backgrounder 1.
Retrieved September 07th, 2010, from WHO:
http://www.who.int/childgrowth/1_what.pdf
Page 21
School readiness in rural areas of Indonesia. Summary Report 21 / 30
Appendix
Appendix 1. Research sites
Figure 1. Research sites
Page 22
School readiness in rural areas of Indonesia. Summary Report 22 / 30
Appendix 2. Total Respondents per districts, sex and intervention programs
Table 5. Total Respondents per districts, sex and intervention programs (n)
Districts Sex Intervention Intervention
Total Male Female PAUD TK/RA Non-ECD ECD Non-ECD
Pandeglang 11 11 9 5 8 14 8 22
Sukabumi 11 10 11 4 6 15 6 21
Wonosobo 13 12 12 6 7 18 7 25
Banyumas 10 12 11 5 6 16 6 22
Probolinggo 13 14 18 7 2 25 2 27
Bone 14 7 12 5 4 17 4 21
Lombok
Tengah 12 15 10 16 1 26 1 27
Sikka 9 16 10 10 5 20 5 25
Belu 12 13 13 4 8 17 8 25
Jayapura 13 13 17 3 6 20 6 26
Aceh Besar 10 18 11 9 8 20 8 28
Total 128 141 134 74 61 208 61 269
Page 23
School readiness in rural areas of Indonesia. Summary Report 23 / 30
Appendix 3. Means differences of School Readiness subtests per Districts
Table 6. Means differences of School Readiness subtests per Districts
Districts
Pre Reading
(max. = 8)
Pre Writing
(max. = 16)
Pre
Mathematics
(max. = 13)
Language
Proficiency
(max. = 10)
Problem
Solving
(max. = 8)
Gross Motor
Skills
(max. = 2)
Total
Scholastic
(max. = 57)
Total
Non
Scholastic
(max. = 33)
Total
Readiness
(max. = 90)
Pandeglang 6.23 10.77 12.45 8.73 4.14 2.00 28.55 42.32 72.86
Sukabumi 7.14 13.14 12.67 8.81 5.29 2.00 31.19 47.05 80.24
Wonosobo 6.72 12.52 12.84 9.04 4.72 2.00 29.36 45.48 76.84
Banyumas 5.73 11.05 12.00 8.41 4.32 1.95 30.39 41.50 73.84
Probolinggo 6.96 12.26 12.44 9.26 5.22 2.00 28.96 46.15 77.11
Bone 6.33 11.05 12.76 9.00 5.81 2.00 29.86 44.95 76.81
Lombok Tengah 5.74 11.26 12.37 8.44 5.15 2.00 28.67 42.96 73.63
Sikka 5.48 11.08 12.64 8.36 4.04 2.00 28.28 41.60 71.88
Belu 5.16 11.44 12.28 9.20 2.96 2.00 27.58 41.04 70.62
Jayapura 6.00 10.19 12.04 9.19 4.81 2.00 29.53 42.23 73.76
Aceh Besar 5.93 9.68 11.61 8.79 4.71 2.00 29.70 40.71 72.41
= highest score
= lowest score
Page 24
School readiness in rural areas of Indonesia. Summary Report 24 / 30
Appendix 4. Scores distribution of Total Scholastic and Total Non Scholastic
Graphic 1. Scores distribution of Total Scholastic and Total Non Scholastic
Page 25
School readiness in rural areas of Indonesia. Summary Report 25 / 30
Appendix 5. Means differences of students who participated in ECD program by institutions
Table 7. Means differences of students who participated in ECD program by institutions
Subtest
Means Differences
PAUD TK & RA
Total (n) 134 74
Total Readiness
Means differences
(with Non-ECD) 3.620 * 5.499 *
Sig. 0.003 0.000
Total Non
Scholastic
Means differences
(with Non-ECD) 0.903 * 1.453 *
Sig. 0.028 0.002
Total Scholastic
Means differences
(with Non-ECD) 2.718 * 4.060 *
Sig. 0.007 0.000
Pre Reading
Means differences
(with Non-ECD) 0.608 * 0.688 *
Sig. 0.014 0.013
Pre Writing
Means differences
(with Non-ECD) 0.833 ^ 1.544 *
Sig. 0.058 0.002
Pre
Mathematics
Means differences
(with Non-ECD) 0.236 0.453 *
Sig. 0.153 0.015
Language
Proficiency
Means differences
(with Non-ECD) 0.262 ^ 0.209
Sig. 0.090 0.225
Problem
Solving
Means differences
(with Non-ECD) 0.845 ^ 1.166 *
Sig. 0.059 0.020
Gross Motor
Skills
Means differences
(with Non-ECD) 0.000 0.014
Sig. 1.000 0.201
( * ) significant p < 0.05 ( ^ ) significant p < 0.10
Page 26
School readiness in rural areas of Indonesia. Summary Report 26 / 30
Appendix 6. Categorization of students’ achievement in each subtest by mean, median and modus
Table 8. Categorization of students’ achievement in each subtest by mean, median and modus
Subtest
Category Prior PAUD students
with scores above…
Prior TK & RA students
with scores above…
Non-ECD students
with scores above…
Mean Median Modus Mean Median Modus Mean Median Modus Mean Median Modus
Total School Readiness
(max. = 90) 74.44 45.00 78
80
(59.70%)
134
(100.00%)
55
(41.04%)
49
(66.22%)
74
(100.00%)
34
(45.95%)
22
(36.07%)
61
(100.00%)
14
(22.95%)
Total Non Scholastic (max. = 33)
29.23 16.50 31 71
(52.99%) 134
(100.00%) 37
(27.61%) 50
(67.57%) 74
(100.00%) 23
(31.08%) 26
(42.62%) 61
(100.00%) 11
(18.03%)
Total Scholastic
(max. = 57) 43.21 28.50 49
79
(58.96%)
128
(95.52%)
20
(14.93%)
45
(60.81%)
73
(98.65%)
12
(16.22%)
23
(37.70%)
58
(95.08%)
7
(11.48%)
Pre Reading
(max. = 8) 6.12 4.00 8
66
(49.25%)
114
(85.07%)
0
(0.00%)
35
(47.30%)
65
(87.84%)
0
(0.00%)
19
(31.15%)
44
(72.13%)
0
(0.00%)
Pre Writing
(max. = 16) 11.28 8.00 13
72
(53.73%)
115
(85.82%)
23
(17.16%)
46
(62.16%)
70
(94.59%)
17
(22.97%)
31
(50.00%)
45
(72.58%)
10
(16.39%)
Pre Mathematics
(max. = 13) 12.36 6.50 13
87
(64.93%)
134
(100.00%)
0
(0.00%)
52
(70.27%)
74
(100.00%)
0
(0.00%)
32
(52.46%)
61
(100.00%)
0
(0.00%)
Language
(max. = 10) 8.84 5.00 9
106
(79.70%)
132
(99.25%)
30
(22.56%)
60
(81.08%)
73
(98.65%)
18
(24.32%)
42
(68.85%)
60
(98.36%)
10
(16.390%)
Problem Solving
(max. = 8) 4.64 4.00 8
77
(57.46%)
77
(57.46%)
0
(0.00%)
47
(63.51%)
47
(63.51%)
0
(0.00%)
26
(42.62%)
26
(42.62%)
0
(0.00%)
Gross Motor Skills
(max. = 2) 1.99 1.00 2
134
(100.00%)
134
(100.00%)
0
(0.00%)
73
(98.60%)
73
(98.60%)
0
(0.00%)
61
(100.00%)
61
(100.00%)
0
(0.00%)
Page 27
School readiness in rural areas of Indonesia. Summary Report 27 / 30
Appendix 7. Students’ characteristics
Table 9. Students’ characteristics
Districts Total
Sex Intervention BMI
(mean)
Completed
Immunization
Proficiency to
Bahasa Indonesia
Period of Exposure to ECD
(modus)
Male Female PAUD TK &
RA
Non-
ECD
Not
Understand Understand Proficient Duration Not known
Pandeglang 22 11 11 9 5 8 14.27 40.9% 0.0% 72.7% 27.3% 1.5- 2 year
(27.3%) 36.4%
Sukabumi 21 11 10 11 4 6 14.05 52.4% 4.8% 66.7% 28.6% 6 mo – 1 year
(28.6%) 28.6%
Wonosobo 25 13 12 12 6 7 15.36 76.0% 0.0% 24.0% 76.0% 1.5 – 2 year
(60.0%) 8.0%
Banyumas 22 10 12 11 5 6 15.18 45.5% 0.0% 100.0% 0.0% 2.5 – 3 year
(36.4%) 31.8%
Probolinggo 27 13 14 18 7 2 14.58 96.3% 0.0% 33.3% 66.7% >3 year
(51.9%) 7.4%
Bone 21 14 7 12 5 4 14.08 61.9% 0.0% 19.0% 81.0% 2.5 – 3 year
(28.6%) 19.0%
Lombok
Tengah 27 12 15 10 16 1 13.62 88.9% 40.7% 51.9% 7.4%
1.5 – 2 year
2 – 2.5 year
(25.9%)
3.7%
Sikka 25 9 16 10 10 5 13.52 92.0% 8.0% 16.0% 76.0% 6 mo – 1 year
(24.0%) 28.0%
Belu 25 12 13 13 4 8 13.42 4.0% 4.0% 32.0% 64.0% 6 mo – 1 year
(24.0%) 32.0%
Jayapura 26 13 13 17 3 6 13.76 61.5% 0.0% 42.3% 57.7% >3 year (26.9%)
19.2%
Aceh Besar 28 10 18 11 9 8 13.17 53.6% 0.0% 64.3% 35.7% 6 mo – 1 year
(28.6%) 32.1%
Total 269 128 141 134 74 61 14.14 62.1% 5.6% 46.8% 47.6% 1.5-2 year
(20.4%) 21.9%
Page 28
School readiness in rural areas of Indonesia. Summary Report 28 / 30
Appendix 8. Means differences by period of ECD and Non-ECD exposure
Table 10. Means differences by period of ECD and Non-ECD exposure
Subtests
Means Differences
<6mo 6mo-1yr 1-1.5yr 1.5-2yr 2-2.5yr 2.5-3yr >3yr
Total (n) 12 39 18 55 20 33 33
Total Readiness
Mean Difference (with Non-ECD)
0.751 3.033 3.751 5.928* 5.540* 4.688* 4.894*
Sig. 0.763 0.063 0.078 0.000* 0.007* 0.007* 0.005*
Non Scholastic
Mean Difference
(with Non-ECD) -0.121 1.430* 0.934 1.556* 1.367* 1.618* 0.521
Sig. 0.885 0.009* 0.190 0.002* 0.047* 0.005* 0.365
Total Scholastic
Mean Difference
(with Non-ECD) 0.873 1.604 2.817 4.373* 4.173* 3.100* 4.373*
Sig. 0.668 0.228 0.105 0.000* 0.013* 0.027* 0.002*
Pre Reading
Mean Difference
(with Non-ECD) -0.525 0.423 0.808 1.020* 1.075* 1.050* 0.656
Sig. -.287 0.189 0.055 0.001* 0.008* 0.002* 0.053
Pre Writing
Mean Difference
(with Non-ECD) 0.178 0.857 0.789 1.787* 0.978 1.193 1.557*
Sig. 0.843 0.145 0.303 0.001* 0.184 0.054 0.012*
Pre Mathematics
Mean Difference
(with Non-ECD) 0.465 -0.067 0.381 0.463* 0.431 0.275 0.336
Sig. 0.171 0.760 0.186 0.021* 0.120 0.237 0.149
Language
Proficiency
Mean Difference
(with Non-ECD) 0.056 0.210 0.612* 0.427* 0.390 -0.095 0.450*
Sig. 0.856 0.301 0.022 0.022* 0.127 0.657 0.036*
Problem Solving
Mean Difference
(with Non-ECD) 0.699 0.180 0.227 0.840 1.299 0.676 1.373*
Sig. 0.447 0.764 0.772 0.124 0.085 0.284 0.030*
Gross Motor Skills
Mean Difference
(with Non-ECD) 0.000 0.000 0.000 0.000 0.000 0.000 0.000
Sig. 1.000 1.000 1.000 1.000 1.000 1.000 1.000
( * ) significant p < 0.05
Page 29
School readiness in rural areas of Indonesia. Summary Report 29 / 30
Appendix 9. Mean Differences in Sub-tests between Children who were Proficient (n=128) with those Do Not Understand (n=15) and those who Understand (n=126) in Bahasa Indonesia
Table 11. Mean Differences in Sub-tests between Children who were Proficient (n=128)
with those Do Not Understand (n=15) and those who Understand (n=126) in Bahasa
Indonesia
Subtests Means Difference
Not Understand Understand
Total (n) 15 126
Total Readiness Means Difference (with proficient) 8.742 3.094
Sig. 0.000 * 0.002 *
Total
Non Scholastic
Means Difference (with proficient) 2.475 0.290
Sig. 0.001 * 0.383
Total Scholastic Means Difference (with proficient) 6.267 2.796
Sig. 0.000 * 0.001 *
Pre Reading Means Difference (with proficient) 1.352 0.344
Sig. 0.002 * 0.084
Pre Writing Means Difference (with proficient) 1.275 1.113
Sig. 0.100 0.002 *
Pre Mathematics Means Difference (with proficient) 0.668 0.443
Sig. 0.021 * 0.001 *
Language
Proficiency
Means Difference (with proficient) 1.545 0.317
Sig. 0.000 * 0.008 *
Problem Solving Means Difference (with proficient) 1.498 0.650
Sig. 0.058 0.074
Gross Motor Skills Means Difference (with proficient) 0.000 0.008
Sig. 1.000 0.301
( * ) significant < 0.05
Page 30
School readiness in rural areas of Indonesia. Summary Report 30 / 30
Appendix 10. Characteristics of Family
Table 12. Characteristics of Family
Districts n
∑ Siblings
(including
respondent)
∑ Years of
Education ∑ Working Hours / Day Bahasa Indonesia Proficiency
Time Spent
with Children Father Mother Father Mother
Not
Understand Understand Proficient
Pandeglang 22
2 people &
4 people (27.3%)
6 yr.
(72.7%)
6 yr.
(59.1%)
9 hours
(29.4%)
5 hours
(28.6%) 0.0% 63.6% 36.4%
1-2 hours &
2-3 hours (27.3%)
Sukabumi 21 2 people
(47.6%)
6 yr.
(45.0%)
6 yr. &
9 yr.
(23.8%)
6 hours
(41.7%)
3. 4 & 6 hours
(28.6%) 0.0% 61.9% 38.1%
1-2 hours
(42.9%)
Wonosobo 25 2 people
(56.0%)
6 yr.
(50.0%)
6 yr.
(56.0%)
9 hours
(37.5%)
5 & 16 hours
(22.2%) 8.0% 16.0% 76.0%
1-2 hours
(40.0%)
Banyumas 22 2 people
(31.8%)
6 yr.
(54.5%)
6 yr.
(31.8%)
5 hours
(19.0%)
9 hours
(20.0%) 4.5% 63.6% 31.8%
5-8 hours
(40.9%)
Probolinggo 27 2 people
(55.6%)
12 yr.
(48.1%)
12 yr.
(29.6%)
9 hours
(26.1%)
5 hours
(30.0%) 0.0% 37.0% 63.0%
>8 hours
(74.1%)
Bone 21
2 people &
3 people
(28.6%)
6 yr.
(28.6%)
6 yr. &
12 yr.
(23.8%)
5 hours
(50.0%)
6 hours
(42.9%) 14.3% 85.7% 0.0%
<1 hours
(76.2%)
Lombok
Tengah 27
2 people
(37.0%)
0 yr.
(37.0%)
0 yr.
(37.0%)
5 hours &
8 hours
(19.0%)
1 hours
(25.0%) 29.6% 40.7% 29.6%
<1 hours
(40.7%)
Sikka 25 3 people (36.0%)
6 yr. (28.0%)
3 yr. (20.0%)
6 hours (27.3%)
3. 7 & 8 hours (20.0%)
8.3% 25.0% 66.7% 1-2 hours (44.0%)
Belu 25 2 people
(44.0%)
6 yr.
(44.0%)
6 yr.
(60.9%)
6 hours
(30.0%)
6 hours
(33.3%) 8.0% 36.0% 56.0%
<1 hours &
1-2 hours
(32.0%)
Jayapura 26 3 people
(38.5%)
12 yr.
(30.8%)
9 yr.
(26.9%)
6 hours
(21.7%)
5 & 6 hours
(26.7%) 0.0% 42.3% 57.7%
1-2 hours
(46.2%)
Aceh Besar 28 2 people
(31.1%)
12 yr.
(59.3%)
12 yr.
(32.1%)
12 hours
(20.0%)
5 hours
(25.0%) 0.0% 64.3% 35.7%
>8 hours
(39.3%)
Total 269 2 people
(36.8%)
6 yr.
(34.2%)
6 yr.
(30.0%)
6 hours
(16.1%)
6 hours
(17.7%) 6.7% 47.8% 45.5%
1-2 hours
(26.0%)
Page 31
School readiness in rural areas of Indonesia. Summary Report 31 / 30