+ All Categories
Home > Documents > IMRG Capgemini Sales Index Report rate IMRG have tracked with the sector since we began reporting it...

IMRG Capgemini Sales Index Report rate IMRG have tracked with the sector since we began reporting it...

Date post: 14-Sep-2018
Category:
Upload: lenga
View: 221 times
Download: 0 times
Share this document with a friend
13
www.imrg.org IMRG Capgemini Sales Index Report March 2017 (reporting February 2017 results) What is the IMRG Capgemini e-Retail Sales Index? The IMRG Capgemini e-Retail Sales Index is the primary performance indicator of the UK online shopping industry, tracking 'hard' sales data from reputable e-retailers since April 2000. The participating merchants represent a significant proportion of the UK internet shopping market.
Transcript

www.imrg.org

IMRG Capgemini

Sales Index Report March 2017 (reporting February 2017 results)

What is the IMRG Capgemini e-Retail Sales Index? The IMRG Capgemini e-Retail Sales Index is the primary performance indicator of the UK online

shopping industry, tracking 'hard' sales data from reputable e-retailers since April 2000. The

participating merchants represent a significant proportion of the UK internet shopping market.

2 | www.imrg.org e-Retail Sales Index © - January 2017

Table of Contents

Executive Summary…………………………………………………………………………………….3

February 2017 e-Retail Index Results………..……….…………….………..…………….…4

High St / Multichannel vs Online-only / Catalogue…….…………………………..…...6

Average Basket Values………………………………..……………………………………………..7

Average Conversion Rates………………………………………………………………………….8

January 2017 m-Retail Index Performance………………………………………..9

Multichannel vs Pureplay M retail………………………………………………………….…11

Index Sector Classification…………………………………………………………………………12

3 | www.imrg.org e-Retail Sales Index © - January 2017

Executive Summary

Key Highlights

• UK online retail sales grew 14.5% in February.

• Month-on-month performance was minus 7.8%.

• Excluding Travel, the Index recorded annual growth of 13.7% and a monthly decline of 3.2% from January.

• Average basket value (excl. Travel) reached £85 in February 2017, level with January 2017.

• The average conversion rate (excl. Travel) in February was 4.7%, a small margin higher than Feb 2016 at 4.6%.

• The apparel sector grew 13.3% year on year in February 2017, a strong result given the high performance of February in 2016.

• The electricals market returned to positive growth after two consecutive periods of decline. In February the sector reported 1.5% growth.

• The gifts sector saw negative growth for the first time since December 2014 with minus 3.3%.

• Britons spent an estimated £10.21 bn shopping online during February.

• Mobile retail sales (tablets and smartphones) grew 12.1% year-on-year in February, and declined 15.1% from the previous month.

The latest results from the IMRG Capgemini Index reveal online sales grew 14.5% year-on-year in

February. Sales declined by 7.8% between January and February.

Online only retailers reported a return to form with 16.9% growth, the best performance since October

2016. Multichannel retailers reported a 12.8% year on year growth, which makes is the lowest growth

since June 2016. The anomaly we reported last month for online-only retailers has been resolved.

The clothing sector grew 13.3% year-on-year. Menswear continued its recent run of low performance

with 1.6% growth, by comparison February 2016 was 31.0%. Womenswear remained unchanged from

January with 6.5% year on year growth — February 2016 saw the womenswear sector grow by 18.8%

YoY.

The electricals sector saw a return to positive growth after two months of negative results. The sector

reported 1.5% year on year growth and the strongest average basket value of the last 4 months at £138.

The home and garden market reported a strong February with 23.2% year on year growth. By

comparison February 2016 reported 14.6%. Interestingly the H&G sector reported the lowest conversion

rate IMRG have tracked with the sector since we began reporting it in March 2009 — February

conversion was 1.3%

The gifts sector had a tough February with 3.3% negative growth. It’s the first time since December 2014

the sector saw a decline in year-on-year growth. The February average basket value of £45 was higher

than the 2016 average of £40. Britons spent an estimated £10.21 bn shopping online during February

(£8.17 bn excl. Travel).

4 | www.imrg.org e-Retail Sales Index © - January 2017

February 2017 Results

Chart 1: This table shows the e-Retail Index sector results in February 2017

Sector

% Change

Year-on-

Year

February

% Change

Month-on-

Month

(January

to

February)

Average

e-Retail

Basket

Value

February

Average

Conversion

Rate

February

Average

YOY

Growth

(12-month

rolling)

Actual

YoY

growth

YTD

2017

Total Online Retail Sales 14.5% -7.8% £137 4.6% 15.4% 13.1%

Total Online Retail (excl.

Travel)

13.7% -3.2% £85 4.7% 15.7% 12.7%

High St / Multichannel 12.8% -14.3% £174 3.6% 13.8% 13.5%

Online-only / Catalogue 16.7% 8.4% £107 5.6% 18.2% 10.6%

High St / Multichannel

(excl. Travel)

11.3% -9.9% £80 3.8% 13.8% 13.4%

Online-only / Catalogue

(excl. Travel)*

16.5% 9.1% £89 5.8% 18.2% 10.3%

Clothing (inc. Footwear

Accessories)

13.3% 2.6% £59 4.5% 16.9% 12.1%

Menswear 1.6% -13.0% £53 N/A 15.0% 0.3%

Womenswear 6.5% 0.1% £66 4.1% 13.4% 6.5%

Footwear 17.7% -11.6% £56 3.7% 20.6% 18.2%

Accessories 14.1% -5.1% £45 N/A 37.5% 24.1%

Electricals 1.5% -8.3% £138 1.6% 4.2% -4.0%

Gifts -3.3% -25.7% £45 N/A 23.2% 25.7%

Health & Beauty -5.7% -16.4% £40 N/A -3.6% -7.5%

Beauty -0.3% -13.6% £39 N/A N/A N/A

Lingerie 35.2% 11.8% £43 N/A 33.8% 28.8%

Beer, Wine & Spirits 3.4% -24.4% £164 N/A 5.8% 30.1%

Home & Garden 23.2% -4.6% £80 1.3% 20.7% 16.5%

Home 27.3% 0.5% £108 0.8% 20.2% 17.0%

Garden 16.3% 83.5% £63 N/A 15.8% 6.5%

Travel 17.6% -26.0% £1536 N/A 13.0% 14.6%

5 | www.imrg.org e-Retail Sales Index © - January 2017

February 2017 E-Retail Index Sector Results

Chart 2: This table shows the e-Retail Index sector results in February 2017

The accessories sector has seen a reduction in year-on-year growth for February. The sector was one of

the strongest performing during 2016 (it grew by 38% for 2016). February saw an uncharacteristically

low year-on-year growth of 14.1%.

Lingerie meanwhile was the highest performing sector in February with 35.2% which is more in line with

historical trends. Its overall growth for 2016 was 33% — the sector was regularly one of the best

performing areas of the IMRG index.

Health and Beauty continues to see negative growth — the sector has reported negative year on year

growth for 5 consecutive months. The actual year on year growth for the period October to February

now stands at minus 8.1%.

35.2%

27.3%

23.2%

17.7% 17.6%16.3%

14.5% 14.1% 13.3%

6.5%

3.4%1.6% 1.5%

-0.3%

-3.3%-5.7%

-10.0%

-5.0%

0.0%

5.0%

10.0%

15.0%

20.0%

25.0%

30.0%

35.0%

40.0%

Year on Year Growth for February 2017

6 | www.imrg.org e-Retail Sales Index © - January 2017

Total Market Year on Year Growth

Chart 3: This graph shows the YOY performance for the total E-Retail Index from March 2016 to Feb 2017

High Street / Multichannel Vs Online-only / Catalogue

During the spring months of 2016 online only retailers outperformed multichannel retailers by a

significant margin. Over the March to June period, online only retailers averaged 25% growth, whereas

multichannel retailers reported 8%.

However in more recent months of November to February 2017, fortunes have reversed. Multichannel

retailers reported an average of 17% and online only retailers 11%.

Chart 4: This chart shows the YoY online retail performance for Multichannel and online only retailers from March 2016 to Feb 2017.

10.8% 10.9%

17.2%16.1%

18.7%

16.3% 15.7%

18.9%

22.9%

11.3% 11.9%

14.5%

0.0%

5.0%

10.0%

15.0%

20.0%

25.0%

Mar-16 Apr-16 May-16 Jun-16 Jul-16 Aug-16 Sep-16 Oct-16 Nov-16 Dec-16 Jan-17 Feb-17

Total Market Year on year Growth

0%

5%

10%

15%

20%

25%

30%

35%

Mar-16 Apr-16 May-16 Jun-16 Jul-16 Aug-16 Sep-16 Oct-16 Nov-16 Dec-16 Jan-17 Feb-17

Year on Year growth - Online only Vs Multichannel retailers

Multichannel Online only

7 | www.imrg.org e-Retail Sales Index © - January 2017

Average Basket Values

The average basket value in total online retail (excl. Travel) was £85 in February, a reasonable increase

from February 2016 which reported £81.

The Beers, Wines and Spirits sector saw a rise in average basket values during February to £164, which is

the highest rate for the sector since September 2013. February traditionally sees retailers bring BWS

prices back up to regular market prices after significant discounting during the month of January.

The gifts sector reported the highest average basket value for the month of February in 6 years which

interestingly coincided with its worst year on year growth performance in 2 years.

Electricals saw a continued increase in the average basket value after Januarys return to expected

market levels. The sector saw a noticeable fall in average basket values during the festive season, but is

showing signs of returning towards previous market values above £140.

Graph 5: this graph shows the average basket values for different product sectors from Mar 16- Feb 17

0.00

20.00

40.00

60.00

80.00

100.00

120.00

140.00

160.00

180.00

Mar

-15

Ap

r-1

5

May

-15

Jun

-15

Jul-

15

Au

g-1

5

Sep

-15

Oct

-15

No

v-1

5

Dec

-15

Jan

-16

Feb

-16

Mar

-16

Ap

r-1

6

May

-16

Jun

-16

Jul-

16

Au

g-1

6

Sep

-16

Oct

-16

No

v-1

6

Dec

-16

Jan

-17

Feb

-17

Average Basket Value

Electricals Accessories Home and Garden Health and Beauty Beers Wines Spirits

8 | www.imrg.org e-Retail Sales Index © - January 2017

Average Conversion Rates The average conversion rate for the total market (excl. travel) was 4.7% in February 2017. In February

2016 it was also 4.7%

Graph 6: this graph shows the average conversation rate for different product sectors from Mar 16- Feb 17

The conversion rates between multichannel and online only retailers have historically reported parallel

trend lines. However during February, the two formats have gone in separate directions. Multichannel

retailers have seen a decrease in conversion rates, dropping by 0.45%, whereas the online only retailers

have increase conversion by 0.75%. It’s unusual for a difference of this size to occur between the two

formats.

Graph 7: this graph shows the average conversation rate for different product sectors from Mar 16- Feb 17

0.00%

1.00%

2.00%

3.00%

4.00%

5.00%

6.00%

7.00%

8.00%

Mar

-15

Ap

r-1

5

May

-15

Jun

-15

Jul-

15

Au

g-1

5

Sep

-15

Oct

-15

No

v-1

5

Dec

-15

Jan

-16

Feb

-16

Mar

-16

Ap

r-1

6

May

-16

Jun

-16

Jul-

16

Au

g-1

6

Sep

-16

Oct

-16

No

v-1

6

Dec

-16

Jan

-17

Feb

-17

Average Conversion rate for Multichannel Vs Online only

Multichannel Online Only

0.0%

1.0%

2.0%

3.0%

4.0%

5.0%

6.0%

Mar-16 Apr-16 May-16 Jun-16 Jul-16 Aug-16 Sep-16 Oct-16 Nov-16 Dec-16 Jan-17 Feb-17

Average Conversion Rate

Clothing Electricals Footwear Home and Garden

9 | www.imrg.org e-Retail Sales Index © - January 2017

M-Retail Sales Index – January 2017 Results.

FEBRUARY 2017

Average

YOY Growth

(12-month

rolling)

%

Change

YOY

%

Change

MOM

Average

ABV*

Average

Conversion

Rate

Total m-Retail** 12.1% -15.1% £79 3.4% 25.9%

Smartphone 57.0% -12.3% £78 2.2% 74.7%

Tablet 3.5% -16.9% £85 3.6% 5.0%

High St /

Multichannel m-

Retail**

21.5% -13.6% £87 3.1% 24.0%

Online-only /

Catalogue m-

Retail**

-30.8% 5.3% £66 4.7% 25.7%

Clothing m-

Retail**

-38.7% -8.4% £64 2.8% 23.3%

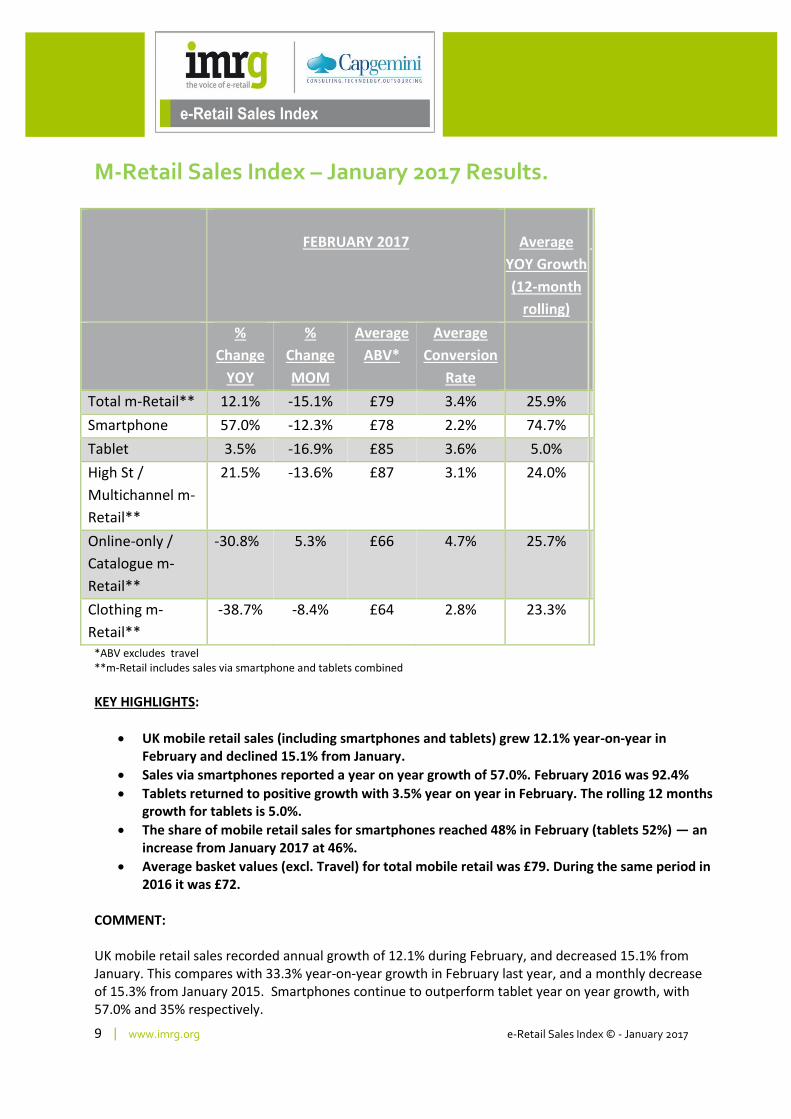
*ABV excludes travel **m-Retail includes sales via smartphone and tablets combined

KEY HIGHLIGHTS:

• UK mobile retail sales (including smartphones and tablets) grew 12.1% year-on-year in February and declined 15.1% from January.

• Sales via smartphones reported a year on year growth of 57.0%. February 2016 was 92.4%

• Tablets returned to positive growth with 3.5% year on year in February. The rolling 12 months growth for tablets is 5.0%.

• The share of mobile retail sales for smartphones reached 48% in February (tablets 52%) — an increase from January 2017 at 46%.

• Average basket values (excl. Travel) for total mobile retail was £79. During the same period in 2016 it was £72.

COMMENT: UK mobile retail sales recorded annual growth of 12.1% during February, and decreased 15.1% from January. This compares with 33.3% year-on-year growth in February last year, and a monthly decrease of 15.3% from January 2015. Smartphones continue to outperform tablet year on year growth, with 57.0% and 35% respectively.

10 | www.imrg.org e-Retail Sales Index © - January 2017

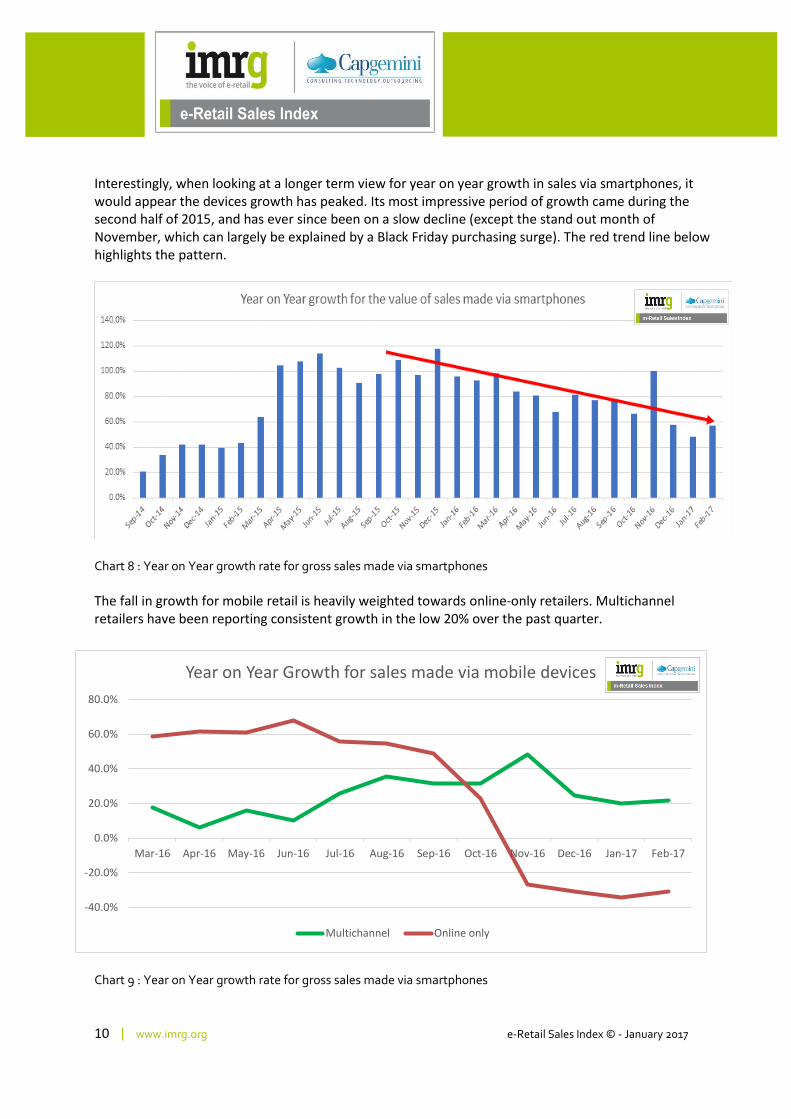
Interestingly, when looking at a longer term view for year on year growth in sales via smartphones, it would appear the devices growth has peaked. Its most impressive period of growth came during the second half of 2015, and has ever since been on a slow decline (except the stand out month of November, which can largely be explained by a Black Friday purchasing surge). The red trend line below highlights the pattern.

Chart 8 : Year on Year growth rate for gross sales made via smartphones

The fall in growth for mobile retail is heavily weighted towards online-only retailers. Multichannel retailers have been reporting consistent growth in the low 20% over the past quarter.

Chart 9 : Year on Year growth rate for gross sales made via smartphones

-40.0%

-20.0%

0.0%

20.0%

40.0%

60.0%

80.0%

Mar-16 Apr-16 May-16 Jun-16 Jul-16 Aug-16 Sep-16 Oct-16 Nov-16 Dec-16 Jan-17 Feb-17

Year on Year Growth for sales made via mobile devices

Multichannel Online only

11 | www.imrg.org e-Retail Sales Index © - January 2017

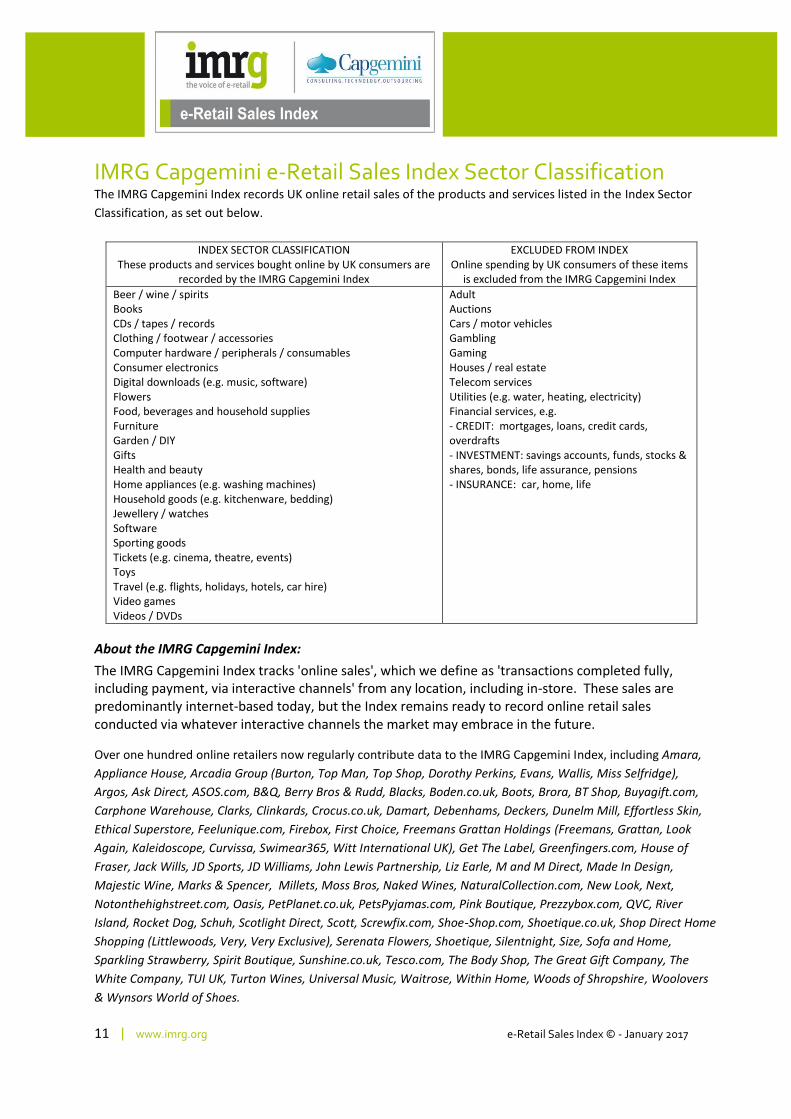
IMRG Capgemini e-Retail Sales Index Sector Classification The IMRG Capgemini Index records UK online retail sales of the products and services listed in the Index Sector

Classification, as set out below.

INDEX SECTOR CLASSIFICATION These products and services bought online by UK consumers are

recorded by the IMRG Capgemini Index

EXCLUDED FROM INDEX Online spending by UK consumers of these items

is excluded from the IMRG Capgemini Index

Beer / wine / spirits Books CDs / tapes / records Clothing / footwear / accessories Computer hardware / peripherals / consumables Consumer electronics Digital downloads (e.g. music, software) Flowers Food, beverages and household supplies Furniture Garden / DIY Gifts Health and beauty Home appliances (e.g. washing machines) Household goods (e.g. kitchenware, bedding) Jewellery / watches Software Sporting goods Tickets (e.g. cinema, theatre, events) Toys Travel (e.g. flights, holidays, hotels, car hire) Video games Videos / DVDs

Adult Auctions Cars / motor vehicles Gambling Gaming Houses / real estate Telecom services Utilities (e.g. water, heating, electricity) Financial services, e.g. - CREDIT: mortgages, loans, credit cards, overdrafts - INVESTMENT: savings accounts, funds, stocks & shares, bonds, life assurance, pensions - INSURANCE: car, home, life

About the IMRG Capgemini Index:

The IMRG Capgemini Index tracks 'online sales', which we define as 'transactions completed fully, including payment, via interactive channels' from any location, including in-store. These sales are predominantly internet-based today, but the Index remains ready to record online retail sales conducted via whatever interactive channels the market may embrace in the future.

Over one hundred online retailers now regularly contribute data to the IMRG Capgemini Index, including Amara,

Appliance House, Arcadia Group (Burton, Top Man, Top Shop, Dorothy Perkins, Evans, Wallis, Miss Selfridge),

Argos, Ask Direct, ASOS.com, B&Q, Berry Bros & Rudd, Blacks, Boden.co.uk, Boots, Brora, BT Shop, Buyagift.com,

Carphone Warehouse, Clarks, Clinkards, Crocus.co.uk, Damart, Debenhams, Deckers, Dunelm Mill, Effortless Skin,

Ethical Superstore, Feelunique.com, Firebox, First Choice, Freemans Grattan Holdings (Freemans, Grattan, Look

Again, Kaleidoscope, Curvissa, Swimear365, Witt International UK), Get The Label, Greenfingers.com, House of

Fraser, Jack Wills, JD Sports, JD Williams, John Lewis Partnership, Liz Earle, M and M Direct, Made In Design,

Majestic Wine, Marks & Spencer, Millets, Moss Bros, Naked Wines, NaturalCollection.com, New Look, Next,

Notonthehighstreet.com, Oasis, PetPlanet.co.uk, PetsPyjamas.com, Pink Boutique, Prezzybox.com, QVC, River

Island, Rocket Dog, Schuh, Scotlight Direct, Scott, Screwfix.com, Shoe-Shop.com, Shoetique.co.uk, Shop Direct Home

Shopping (Littlewoods, Very, Very Exclusive), Serenata Flowers, Shoetique, Silentnight, Size, Sofa and Home,

Sparkling Strawberry, Spirit Boutique, Sunshine.co.uk, Tesco.com, The Body Shop, The Great Gift Company, The

White Company, TUI UK, Turton Wines, Universal Music, Waitrose, Within Home, Woods of Shropshire, Woolovers

& Wynsors World of Shoes.

12 | www.imrg.org e-Retail Sales Index © - January 2017

Participation in the IMRG Capgemini Index is available to reputable online retailers of all sizes. For further details, or to participate in the survey, please contact:

Matthew Walsh IMRG Tel : +44 (0)203 696 0990 Email: [email protected]

*Estimate of Market Cash Value: 1 Index point currently = GBP £0.77 million

Please note that IMRG has rebased its Index-linked estimates of the UK online retail market size downwards by 24.9%, and will no longer use Forrester Research’s IMRG Capgemini E-retail Sales Index Multiplier, which we have previously used to estimate the size of the UK online retail market. IMRG’s own extensive research now provides the basis for the IMRG Index Multiplier, which has been rebased to: - 1 Index point = GBP 0.77 million.

The IMRG Capgemini Index is a trend line that represents the collective gross sales value of participating merchants. We attribute a cash value to an Index point — i.e. a 'multiplier', with which we estimate the market's cash value, month by month. To accommodate the fact that the overall internet shopping market's growth is greater than that of the Index group, as more merchants trade online, we have rebased the multiplier value from time to time:

- November 2008: 1 point = £0.77 million (IMRG) - May 2006: 1 point = £1.02 million (Forrester Research) - January 2005: 1 point = £0.87 million (Forrester Research) - February 2003: 1 point = £0.82 million (Forrester Research) - April 2000: 1 point = £0.8 million (Forrester Research)

We do not recalculate Index cash value estimates retrospectively, as this would skew the historical data.

13 | www.imrg.org e-Retail Sales Index © - January 2017

About IMRG: IMRG (Interactive Media in Retail Group) is the UK’s industry association for online retail. Formed in 1990, IMRG is setting and maintaining pragmatic and robust online retail standards to enable fast-track industry growth, and facilitates its community of members with practical help, information, tools, guidance and networking. Consumers can be confident when dealing with IMRG Members because all interact in an environment where they are encouraged to operate using methods that are Honest, Decent, Legal, Truthful and Fair, and have undertaken to not bring the industry into disrepute. The strength of IMRG is the collective and cooperative power of its members. For more information please visit http://www.imrg.org/ or email [email protected].

About Capgemini: With around 120,000 people in 40 countries, Capgemini is one of the world's foremost providers of consulting, technology and outsourcing services. The Group reported 2011 global revenues of EUR 9.7 billion. Together with its clients, Capgemini creates and delivers business and technology solutions that fit their needs and drive the results they want. A deeply multicultural organization, Capgemini has developed its own way of working, the Collaborative Business ExperienceTM, and draws on Rightshore®, its worldwide delivery model. Learn more about us at www.capgemini.com. Rightshore® is a trademark belonging to Capgemini.


Recommended