University of Kentucky University of Kentucky UKnowledge UKnowledge Theses and Dissertations--Animal and Food Sciences Animal and Food Sciences 2012 IN OVO SELENIUM (SE) INJECTION OF INCUBATING CHICKEN IN OVO SELENIUM (SE) INJECTION OF INCUBATING CHICKEN EGGS: EFFECTS ON EMBRYO VIABILITY, TISSUE SE EGGS: EFFECTS ON EMBRYO VIABILITY, TISSUE SE CONCENTRATION, LIPID PEROXIDATION, IMMUNE RESPONSE CONCENTRATION, LIPID PEROXIDATION, IMMUNE RESPONSE AND POST HATCH DEVELOPMENT AND POST HATCH DEVELOPMENT Lizza M. Macalintal University of Kentucky, [email protected]Right click to open a feedback form in a new tab to let us know how this document benefits you. Right click to open a feedback form in a new tab to let us know how this document benefits you. Recommended Citation Recommended Citation Macalintal, Lizza M., "IN OVO SELENIUM (SE) INJECTION OF INCUBATING CHICKEN EGGS: EFFECTS ON EMBRYO VIABILITY, TISSUE SE CONCENTRATION, LIPID PEROXIDATION, IMMUNE RESPONSE AND POST HATCH DEVELOPMENT" (2012). Theses and Dissertations--Animal and Food Sciences. 4. https://uknowledge.uky.edu/animalsci_etds/4 This Doctoral Dissertation is brought to you for free and open access by the Animal and Food Sciences at UKnowledge. It has been accepted for inclusion in Theses and Dissertations--Animal and Food Sciences by an authorized administrator of UKnowledge. For more information, please contact [email protected].
Transcript
University of Kentucky University of Kentucky
UKnowledge UKnowledge
Theses and Dissertations--Animal and Food Sciences Animal and Food Sciences
2012
IN OVO SELENIUM (SE) INJECTION OF INCUBATING CHICKEN IN OVO SELENIUM (SE) INJECTION OF INCUBATING CHICKEN
EGGS: EFFECTS ON EMBRYO VIABILITY, TISSUE SE EGGS: EFFECTS ON EMBRYO VIABILITY, TISSUE SE
Right click to open a feedback form in a new tab to let us know how this document benefits you. Right click to open a feedback form in a new tab to let us know how this document benefits you.
Recommended Citation Recommended Citation Macalintal, Lizza M., "IN OVO SELENIUM (SE) INJECTION OF INCUBATING CHICKEN EGGS: EFFECTS ON EMBRYO VIABILITY, TISSUE SE CONCENTRATION, LIPID PEROXIDATION, IMMUNE RESPONSE AND POST HATCH DEVELOPMENT" (2012). Theses and Dissertations--Animal and Food Sciences. 4. https://uknowledge.uky.edu/animalsci_etds/4
This Doctoral Dissertation is brought to you for free and open access by the Animal and Food Sciences at UKnowledge. It has been accepted for inclusion in Theses and Dissertations--Animal and Food Sciences by an authorized administrator of UKnowledge. For more information, please contact [email protected].
IN OVO SELENIUM (SE) INJECTION OF INCUBATING CHICKEN EGGS: EFFECTS ON EMBRYO VIABILITY, TISSUE SE CONCENTRATION, LIPID
PEROXIDATION, IMMUNE RESPONSE AND POST HATCH DEVELOPMENT
Studies were conducted to investigate the effects of in ovo injection of selenium
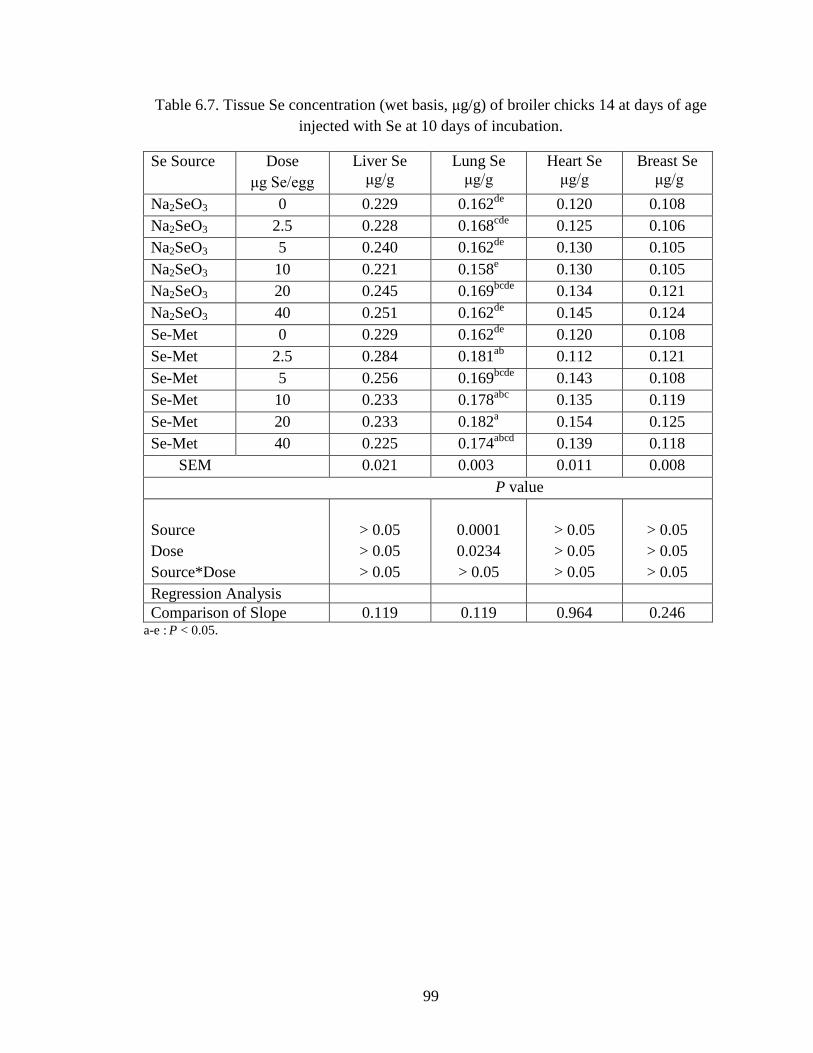
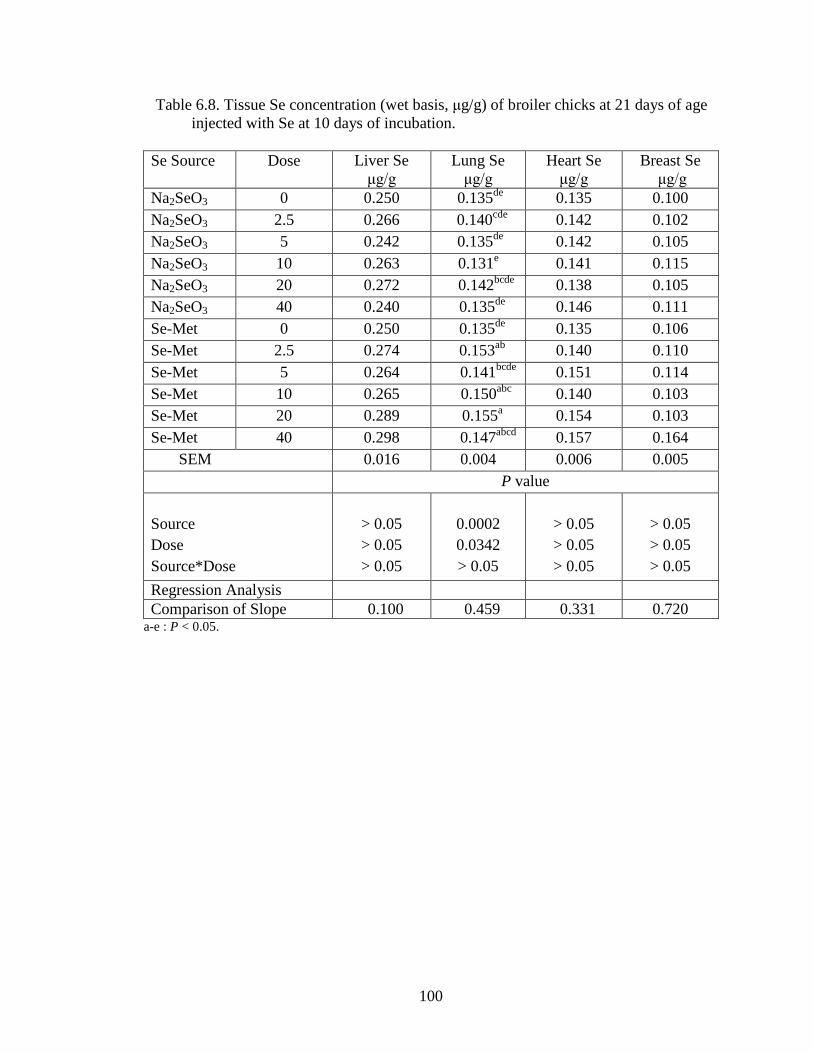
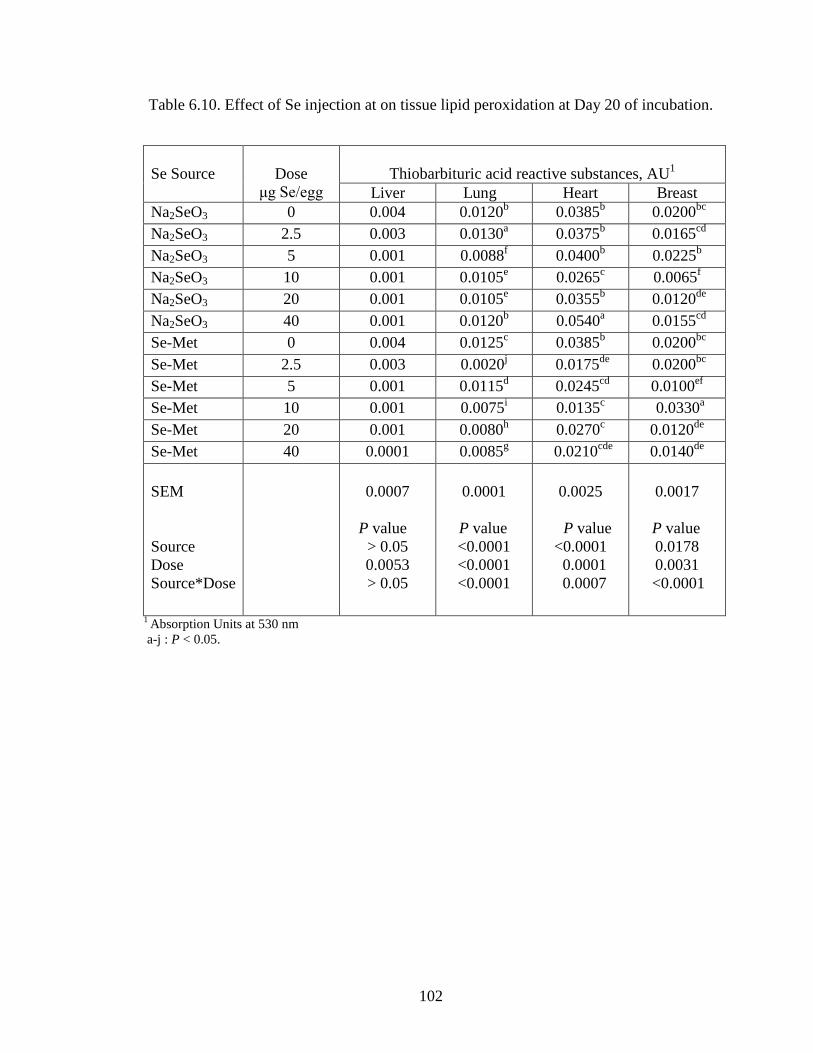
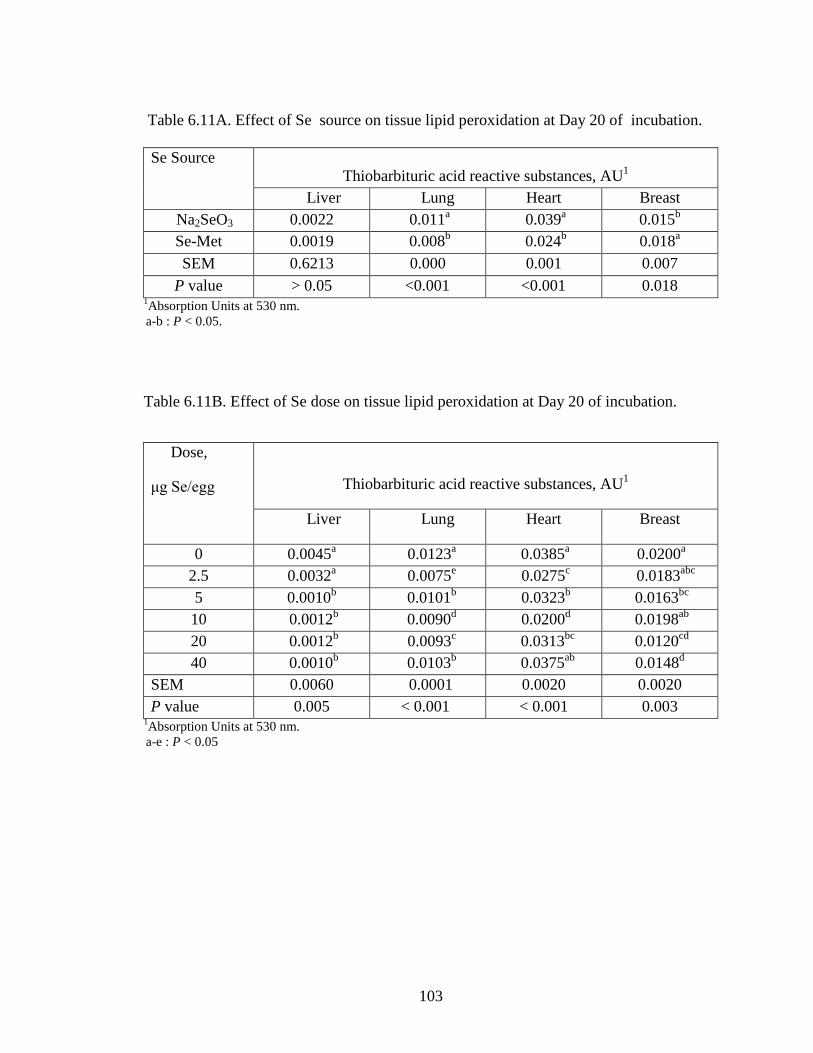
(Se) either as seleno-methionine (Se-Met) or sodium selenite (Na2SeO3) into the yolk of incubating eggs on tissue Se concentration, embryo livability, lipid peroxidation, immune response and growth performance. When white-shelled eggs were injected with 0.1ml of solutions providing 0, 2.5, 5, 10 or 20 μg Se/egg, no detrimental effects on embryo viability at 20 days of incubation were noted. The effects on tissue Se concentrations suggested that Se-Met and Na2SeO3 were metabolized differently by the chick embryo. In a subsequent study using injection doses up to 60 μg/egg, a greater linear response in tissue Se was obtained with Se-Met, compared with Na2SeO3 (P < 0.01). Minimal changes in heart and breast muscle Se concentrations were noted above the 40 µg dose when Na2SeO3 was used (P > 0.05). In a study with broiler eggs, injection doses of 0, 2.5, 5, 10, 20 and 40 μg Se/egg were used. Se-Met or Na2SeO3 at doses up to 40 μg Se/egg had little effect on embryo viability. Injecting Se-Met resulted in greater tissue Se accumulation than Na2SeO3 at 20 days of incubation. In another study with broiler eggs using injection doses up to 40 μg Se/egg, Se-Met injection resulted in higher hatchability, reduced lipid peroxidation in the lung and heart muscle of the embryos after 20 days incubation and higher Se concentrations in heart and breast muscle of hatched chicks through 7 days and in lung through 21 days of growth. In a feeding trial with broiler breeder hens, adding 0.3 mg/kg of Se as Se yeast or Na2SeO3 to the diet improved tissue Se status at hatching of progeny chicks. Taken together, these results indicate that injection of Se into the yolk of incubating eggs may be useful for enhancing Se status during embryonic and early post-hatch development. Therefore, the improvement in Se status using this method in conjunction with dietary Se supplementation of breeder hens would be much greater than with only using dietary supplementation.
Key words: in ovo injection, selenium, embryo, lipid peroxidation, sheep red blood cell
Lizza M. Macalintal __________________________________
April 26, 2012 ___________________________________
IN OVO SELENIUM INJECTION OF INCUBATING CHICKEN EGGS: EFFECTS ON EMBRYO VIABILITY, TISSUE SE CONCENTRATION, LIPID PEROXIDATION,
IMMUNE RESPONSE AND POST HATCH DEVELOPMENT
By
Lizza M. Macalintal
Dr. Austin H. Cantor
Director of Dissertation
Dr. David L. Harmon
Director of Graduate Studies
April 26, 2012
(Date)
RULES FOR THE USE OF DISSERTATION
Unpublished dissertations submitted for the Doctor’s degree and deposited in the University of Kentucky Library are as a rule open for inspection, but are to be used only with due regard to the rights of the authors. Bibliographical references may be noted, but quotations or summaries of parts may be published only with the permission of the author, and with the usual scholarly acknowledgements.
Extensive copying or publication of the dissertation in whole or in part also requires the consent of the Dean of Graduate School of the University of Kentucky.
A library that borrows this dissertation for use by its patrons is expected to secure the signature of each user. Name Date ________________________________________________________________________________________________________________________________________________________________________________________________________________________________________________________________________________________________________________________________________________________________________________________________________________________________________________________________________________________________________________________________________________________________________________________________________________________________________________________________________________________________________________________________________________________________________________________________________________________________________________________________________________________________________________________________________________________________________
DISSERTATION
Lizza M. Macalintal
The Graduate School University of Kentucky
2012
IN OVO SELENIUM (SE) INJECTION OF INCUBATING CHICKEN EGGS: EFFECTS ON EMBRYO VIABILITY, TISSUE SE CONCENTRATION, LIPID
PEROXIDATION, IMMUNE RESPONSE AND POST HATCH DEVELOPMENT
DISSERTATION
An abstract of a dissertation submitted in partial fulfillment of the
requirements for the Degree of Doctor of Philosophy in the College of Agriculture at the University of Kentucky
by
Lizza M. Macalintal
Lexington, Kentucky
Director: Dr. Austin H. Cantor, Associate Professor of Animal Sciences
RESULTS AND DISCUSSION ....................................................................................... 61
vii
CHAPTER 5: EFFECT OF IN OVO SE INJECTION OF BROILER BREEDER EGGS AT 10 DAYS OF INCUBATION ON TISSUE SE CONCENTRATION AND EMBRYO VIABILITY .................................................................................................... 68
RESULTS AND DISCUSSION ....................................................................................... 71
CHAPTER 6: EFFECT OF IN OVO SELENIUM INJECTION OF BROILER BREEDER EGGS ON TISSUE SE CONCENTRATION, LIPID PEROXIDATION, IMMUNE RESPONSE AND POST HATCH DEVELOPMENT ................................... 83
VITA ............................................................................................................................... 154
ix
LIST OF TABLES
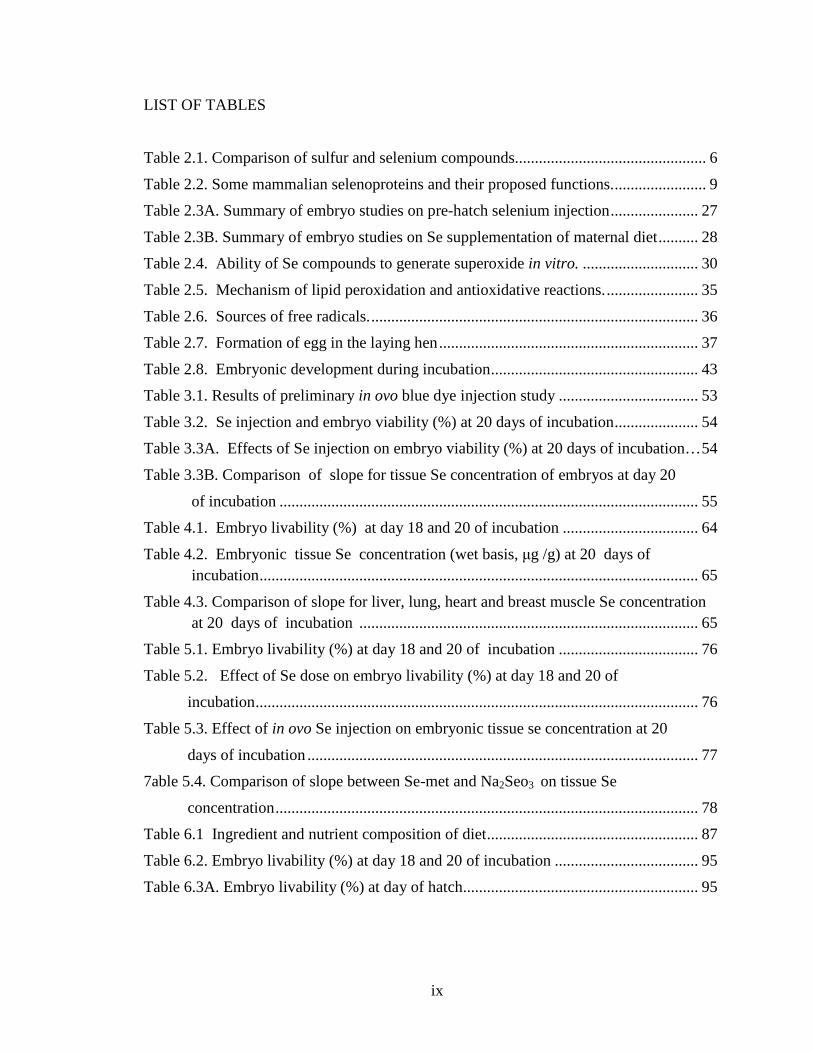
Table 2.1. Comparison of sulfur and selenium compounds................................................ 6
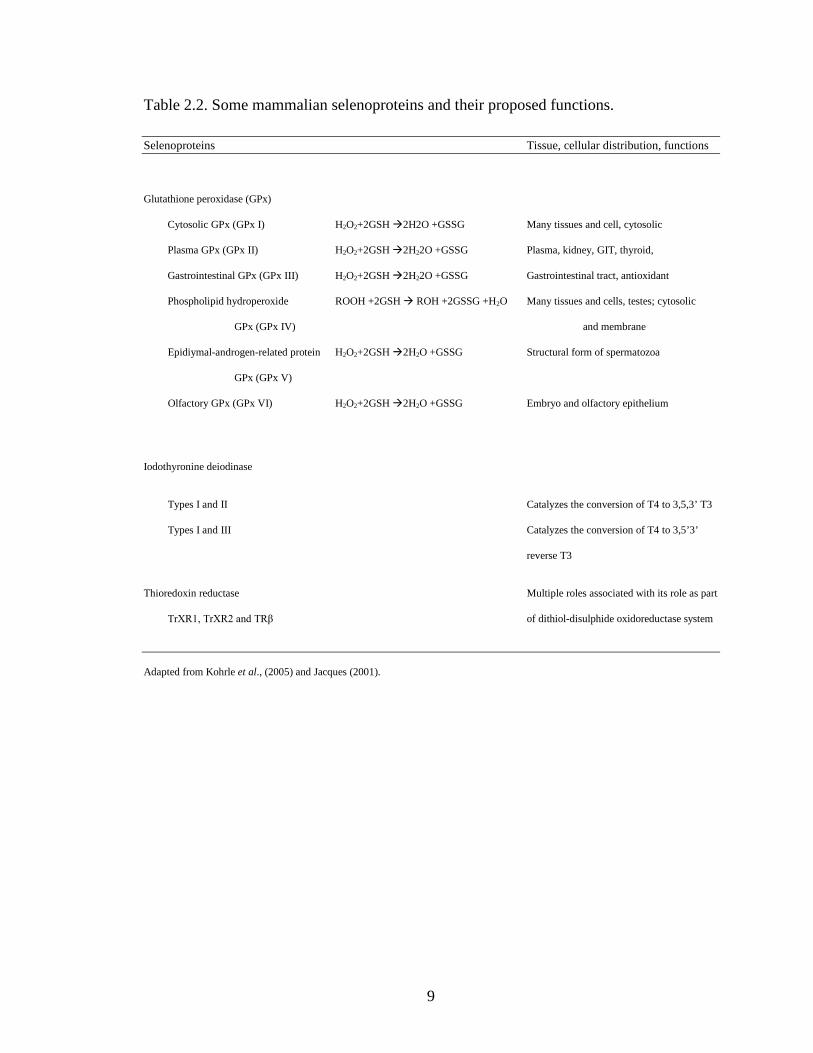
Table 2.2. Some mammalian selenoproteins and their proposed functions. ....................... 9
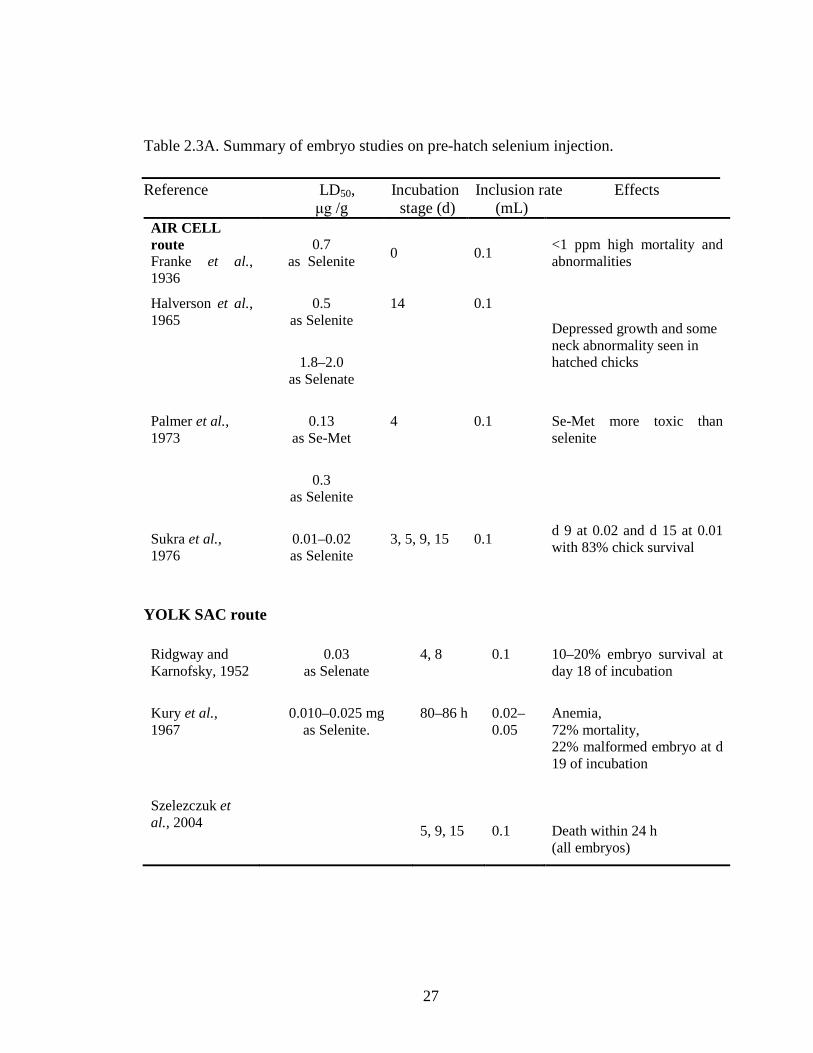
Table 2.3A. Summary of embryo studies on pre-hatch selenium injection ...................... 27
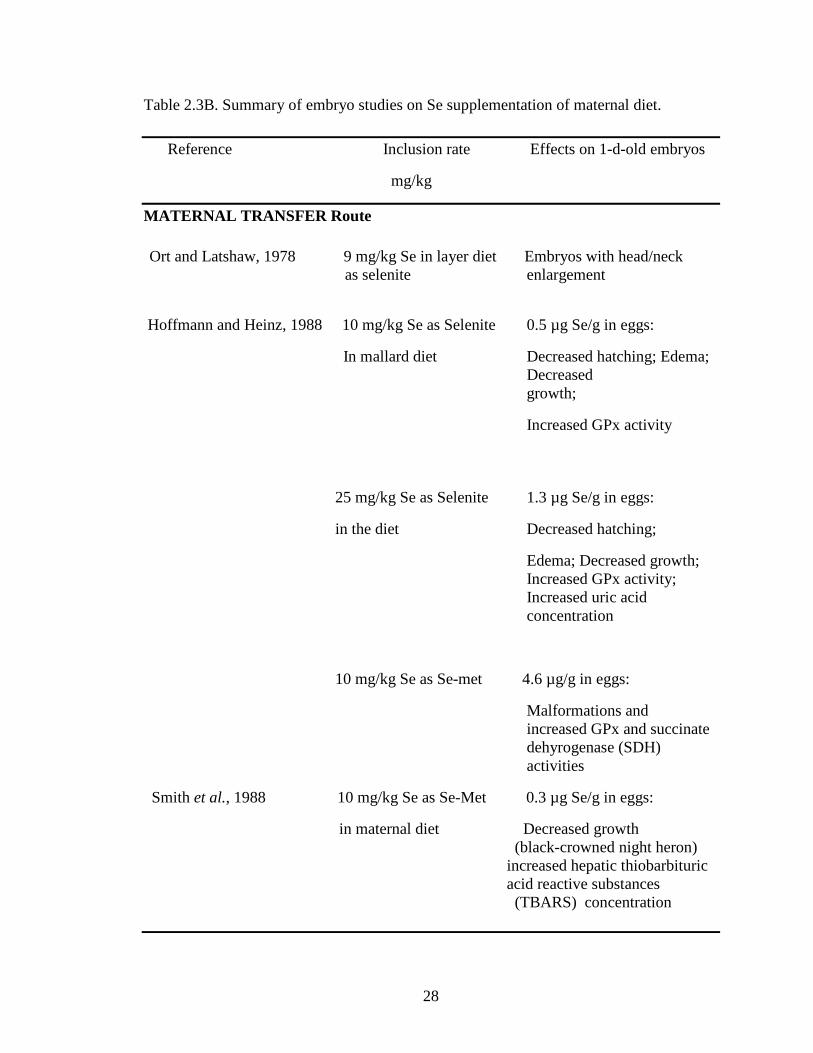
Table 2.3B. Summary of embryo studies on Se supplementation of maternal diet .......... 28
Table 2.4. Ability of Se compounds to generate superoxide in vitro. ............................. 30
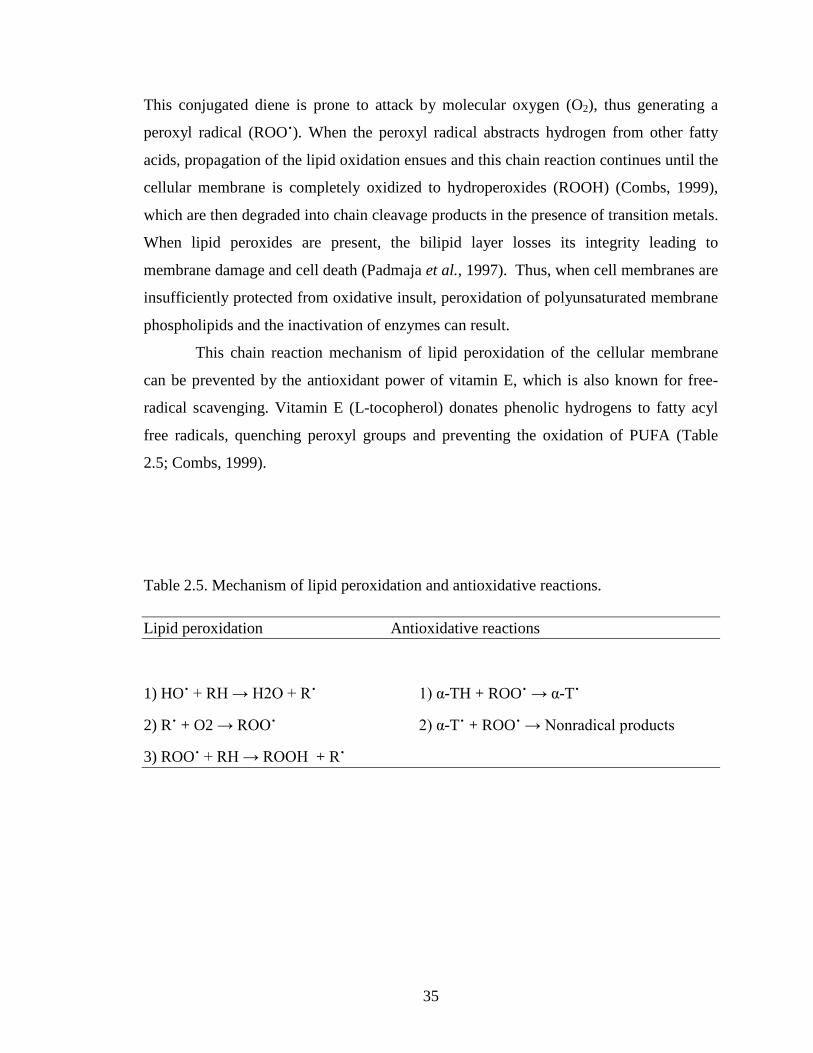
Table 2.5. Mechanism of lipid peroxidation and antioxidative reactions. ....................... 35
Table 2.6. Sources of free radicals. .................................................................................. 36
Table 2.7. Formation of egg in the laying hen ................................................................. 37
Table 2.8. Embryonic development during incubation .................................................... 43
Table 3.1. Results of preliminary in ovo blue dye injection study ................................... 53
Table 3.2. Se injection and embryo viability (%) at 20 days of incubation ..................... 54
Table 3.3A. Effects of Se injection on embryo viability (%) at 20 days of incubation… 54
Table 3.3B. Comparison of slope for tissue Se concentration of embryos at day 20
of incubation ......................................................................................................... 55
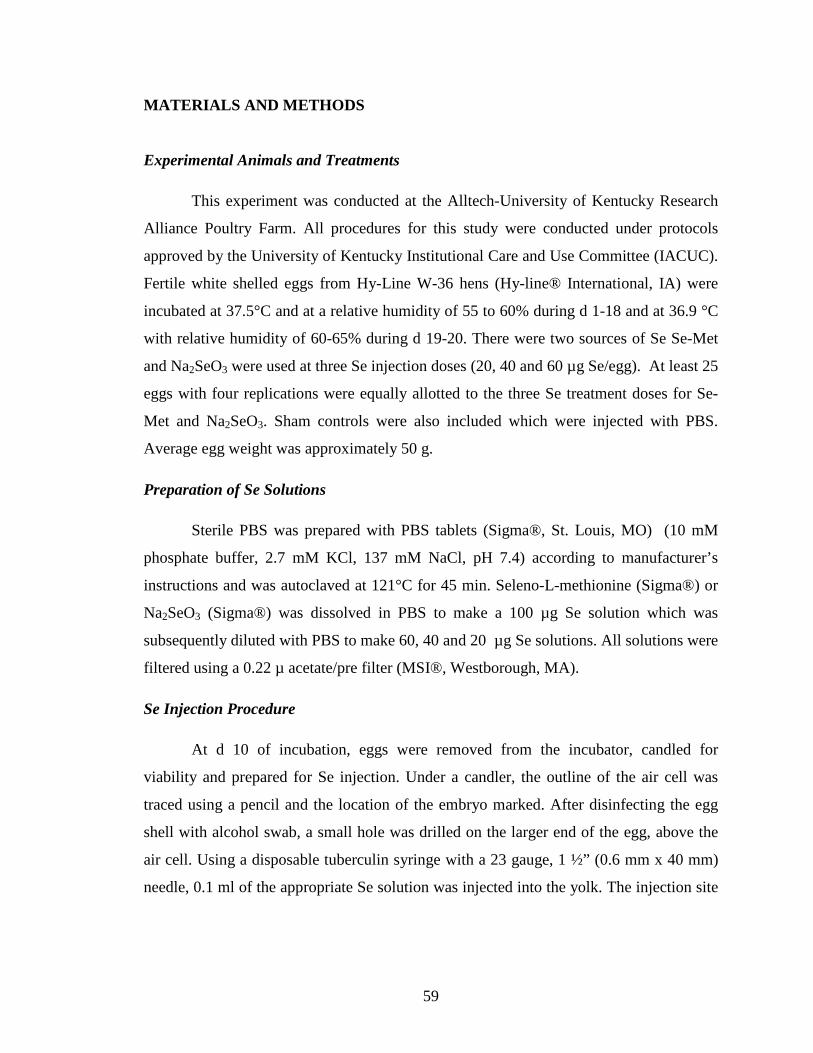
Table 4.1. Embryo livability (%) at day 18 and 20 of incubation .................................. 64
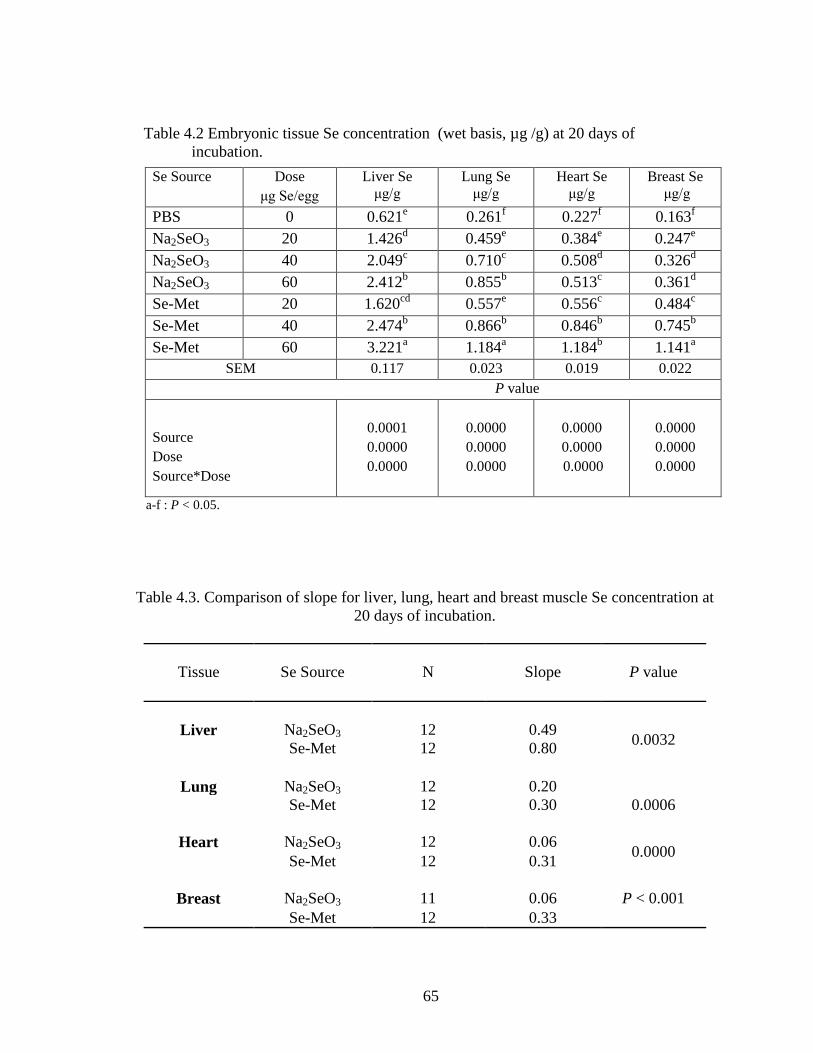
Table 4.2. Embryonic tissue Se concentration (wet basis, μg /g) at 20 days of incubation .............................................................................................................. 65
Table 4.3. Comparison of slope for liver, lung, heart and breast muscle Se concentration at 20 days of incubation ..................................................................................... 65
Table 5.1. Embryo livability (%) at day 18 and 20 of incubation ................................... 76
Table 5.2. Effect of Se dose on embryo livability (%) at day 18 and 20 of
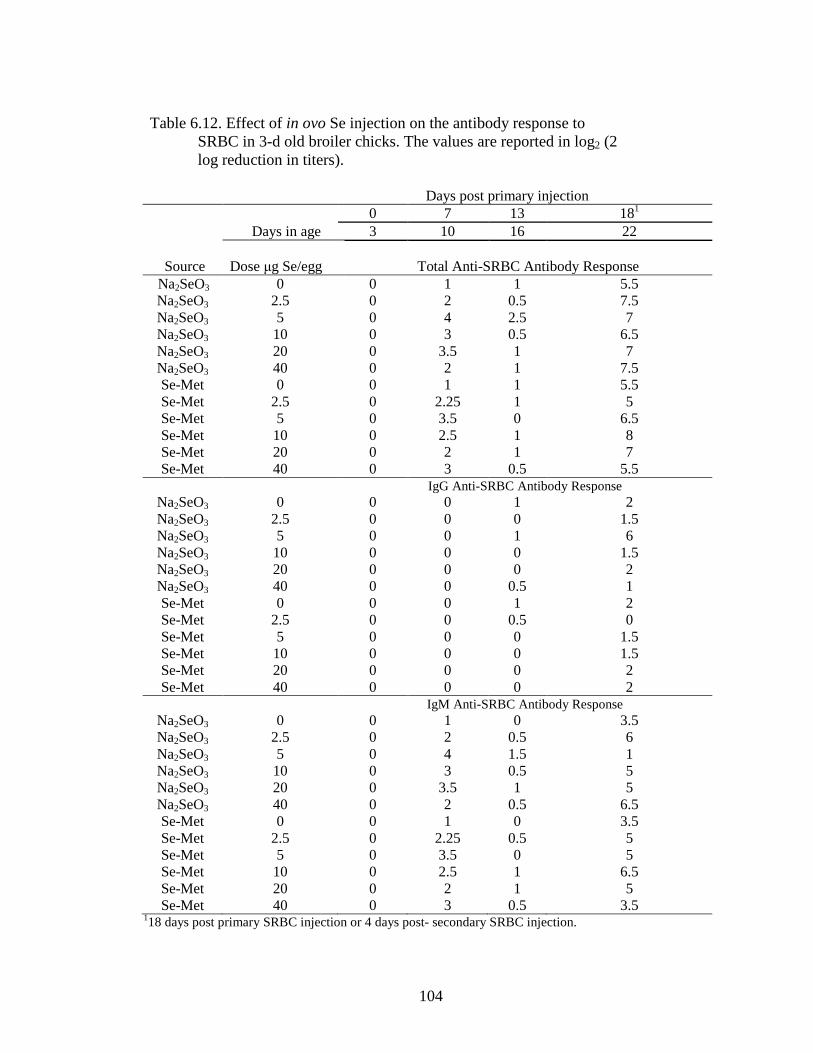
Table 6.12. Effect of in ovo Se injection on antibody response to
SRBC in 3-d old broiler chicks. ........................................................................... 104
Table 6.13A. Effect of in ovo Se injection at 7 days post primary injection, SRBC immune challenge ............................................................................................... 105
Table 6.13B. Effect of in ovo Se Injection at 13 days post primary injection, SRBC immune challenge ............................................................................................... 105
Table 6.13C. Effect of in ovo Se injection at 4 days post secondary injection, SRBC immune challenge ............................................................................................... 105
Table 7.1. Composition of broiler starter diet fed to all chicks ...................................... 115
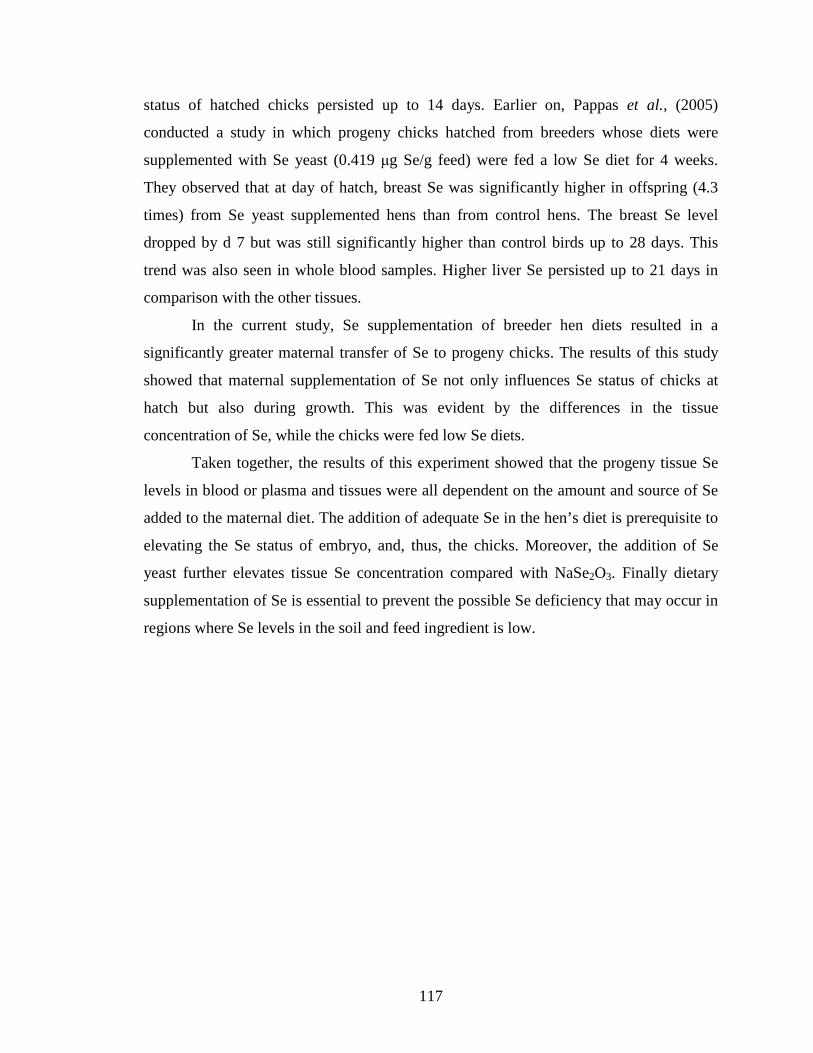
Table 7.2. Effect of Se supplementation of breeder hen diets on egg Se levels ............. 118
xi
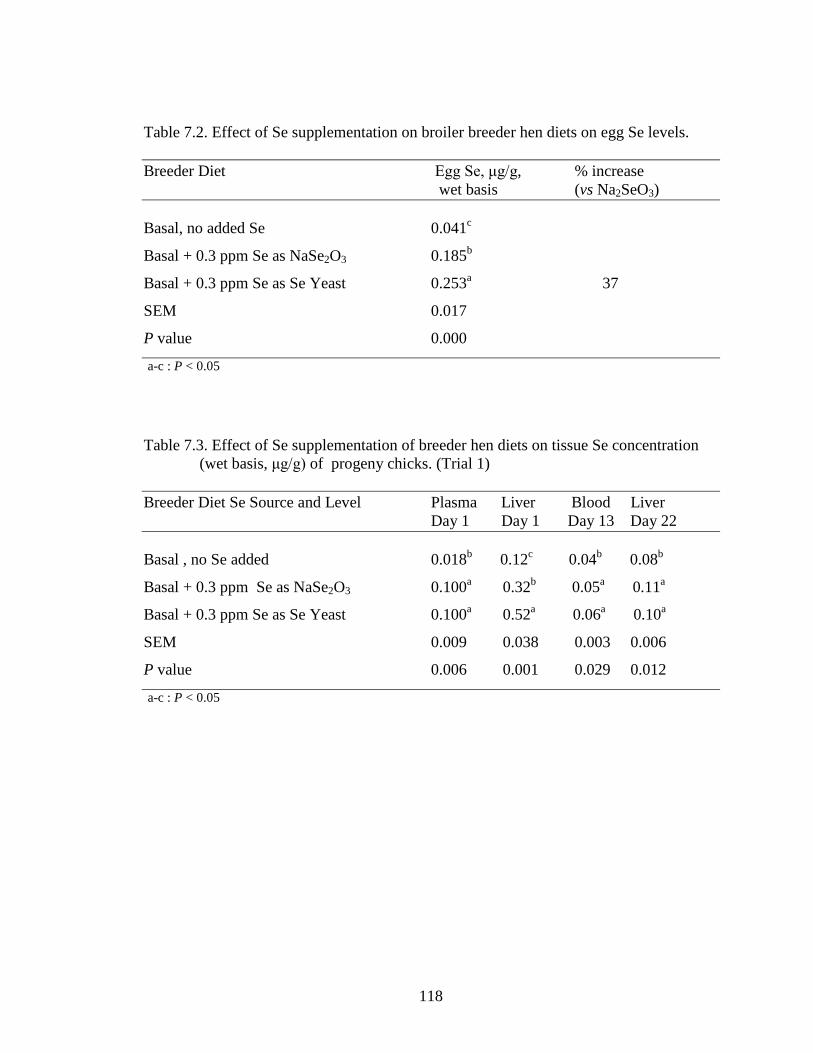
Lizza M. Macalintal Lizza M. MacalintalTable 7.3 Effect of Se supplementation of breeder hen diets on tissue Se concentration (wet basis, μg/g) of progeny chicks. (Trial 1) ............................................................................................................... 118
xii
LIST OF FIGURES
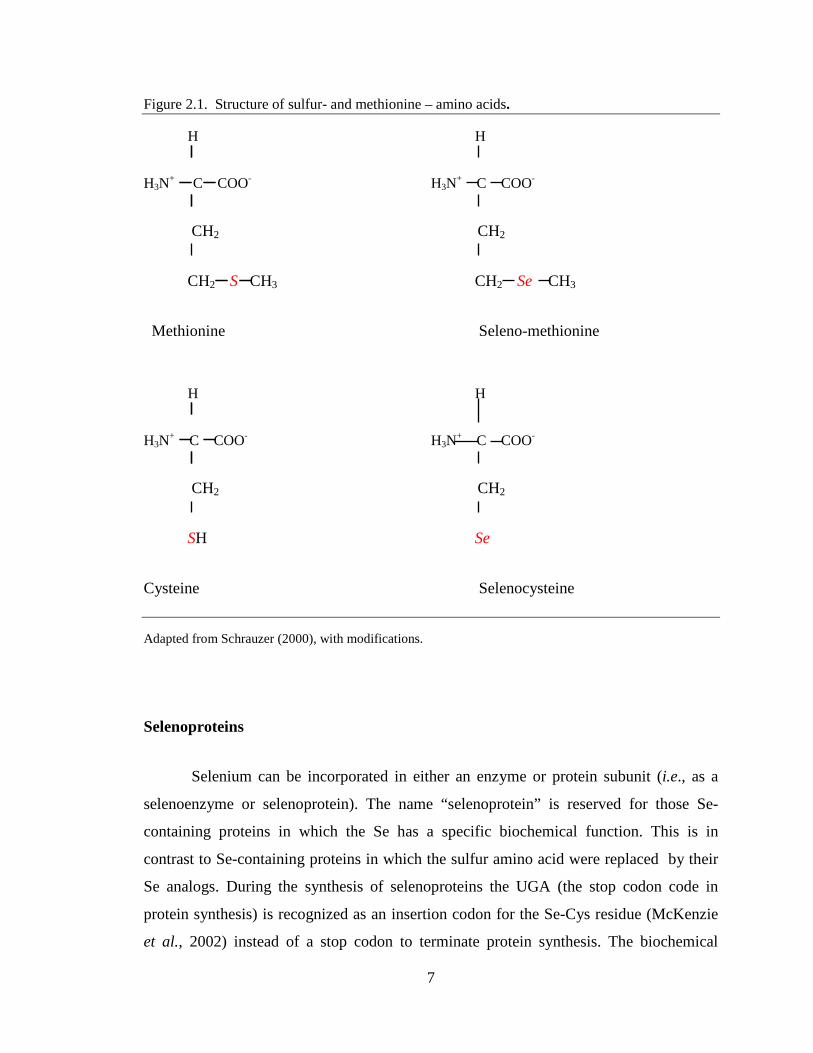
Figure 2.1. Structure of sulfur- and methionine – amino acids. ........................................ 7
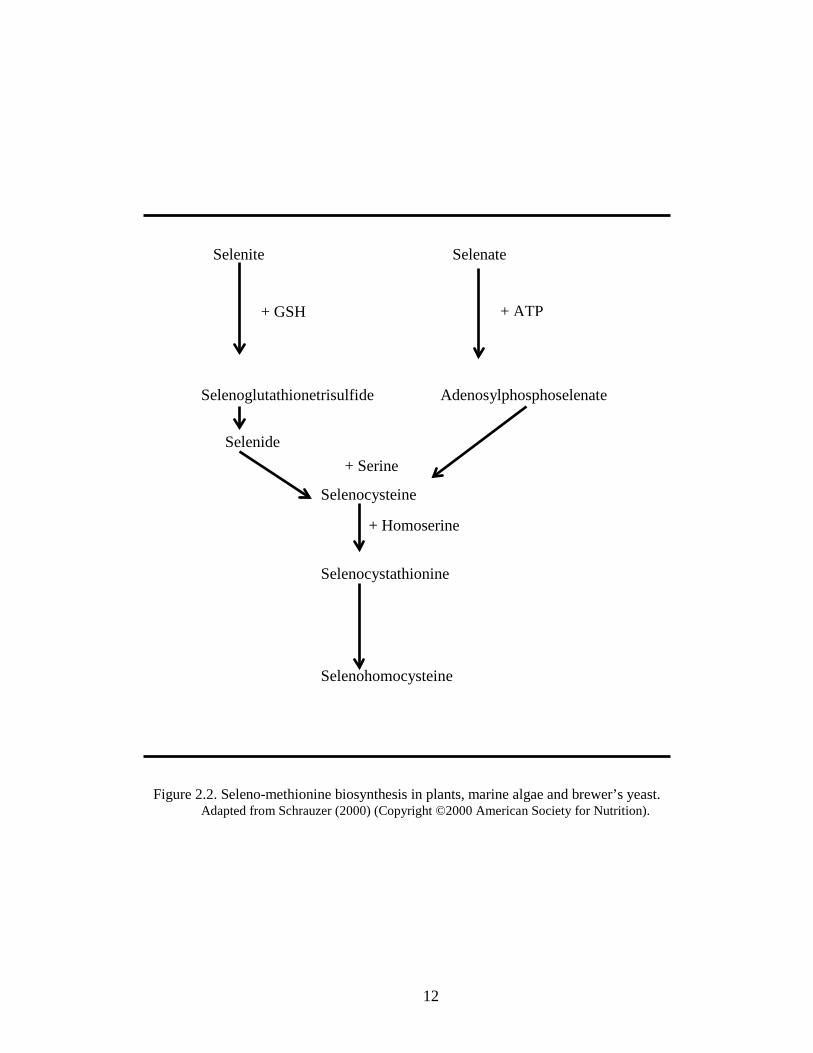
Figure 2.2. Seleno-methionine biosynthesis in plants, marine algae and
Figure 2.5. Reaction of selenite to produce superoxide. .................................................. 30
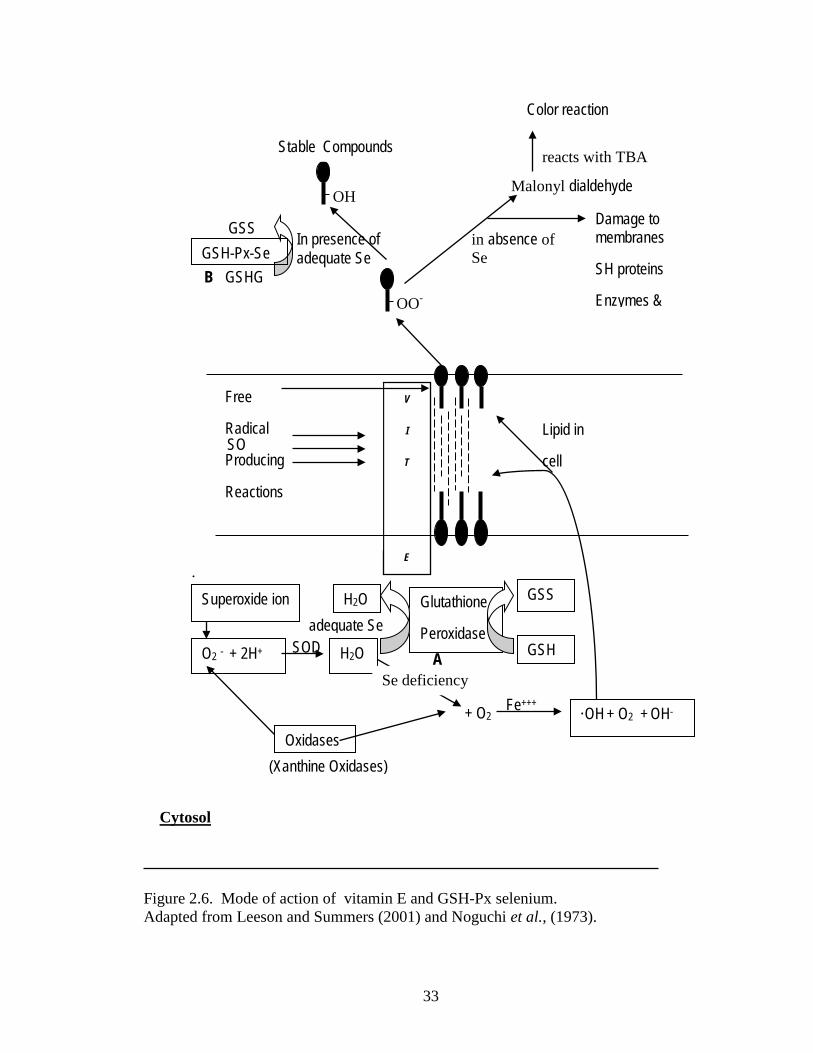
Figure 2.6. Mode of action of vitamin E and GSH-Px selenium. .................................... 33
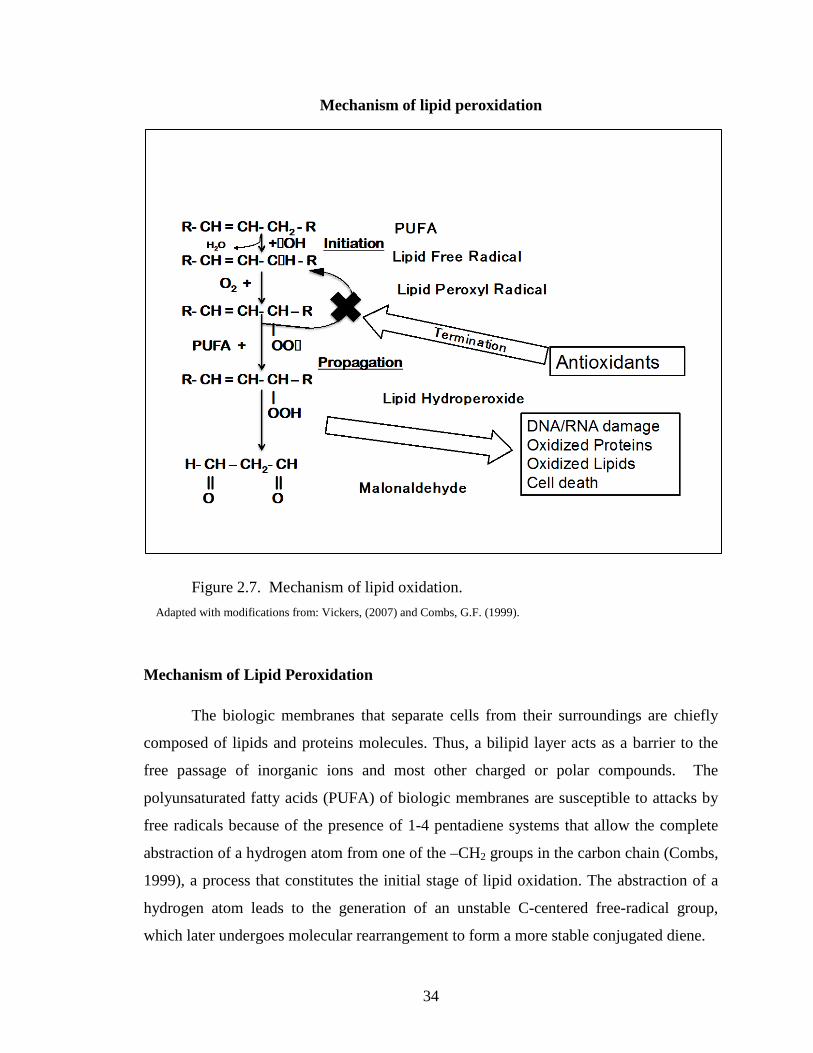
Figure 2.7. Mechanism of lipid oxidation ........................................................................ 34
Figure 3.1A. Schematic diagram showing the location of the yolk .................................. 53
Figure 3.1B Photograph showing the presence of blue dye in the yolk .......................... 53
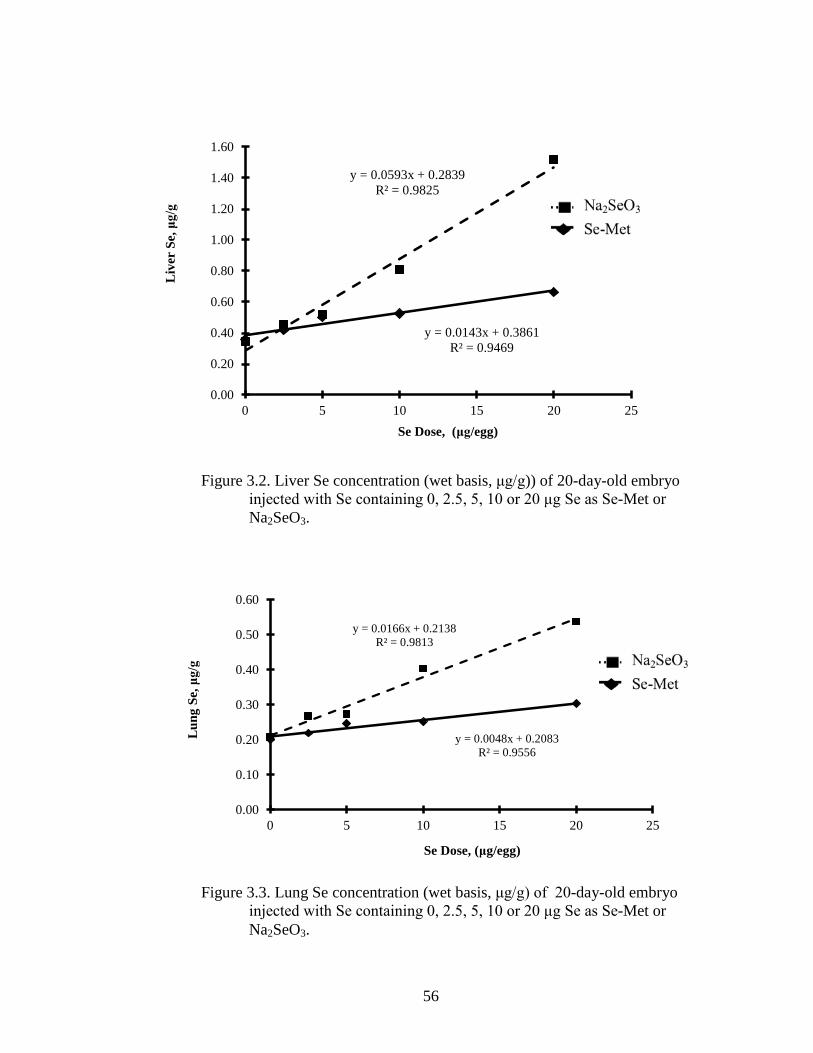
Figure 3.2. Liver Se concentration (wet basis,μg/g) of 20-day-old embryo injected
with Se containing 0, 2.5, 5, 10 or 20 μg Se as Se-Met or Na2SeO3 ................. 56
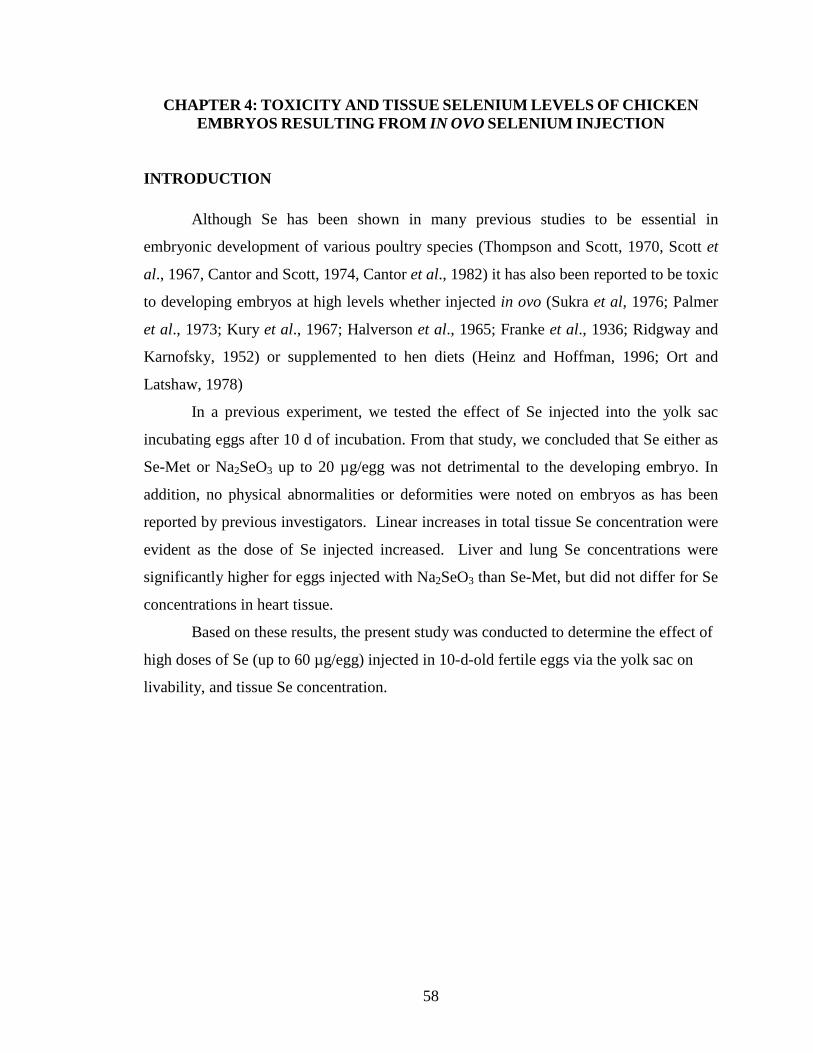
Figure 3.3. Lung Se concentration (wet basis, μg/g)) of 20-day-old embryo injected
with Se containing 0, 2.5, 5, 10 or 20 μg Se as Se-Met or Na2SeO3 ................ 56
Figure 3.4. Heart Se concentration (wet basis,μg/g)) of 20-day-old embryo injected
with Se containing 0, 2.5, 5, 10 or 20 μg Se as Se-Met or Na2SeO3 ................ 57
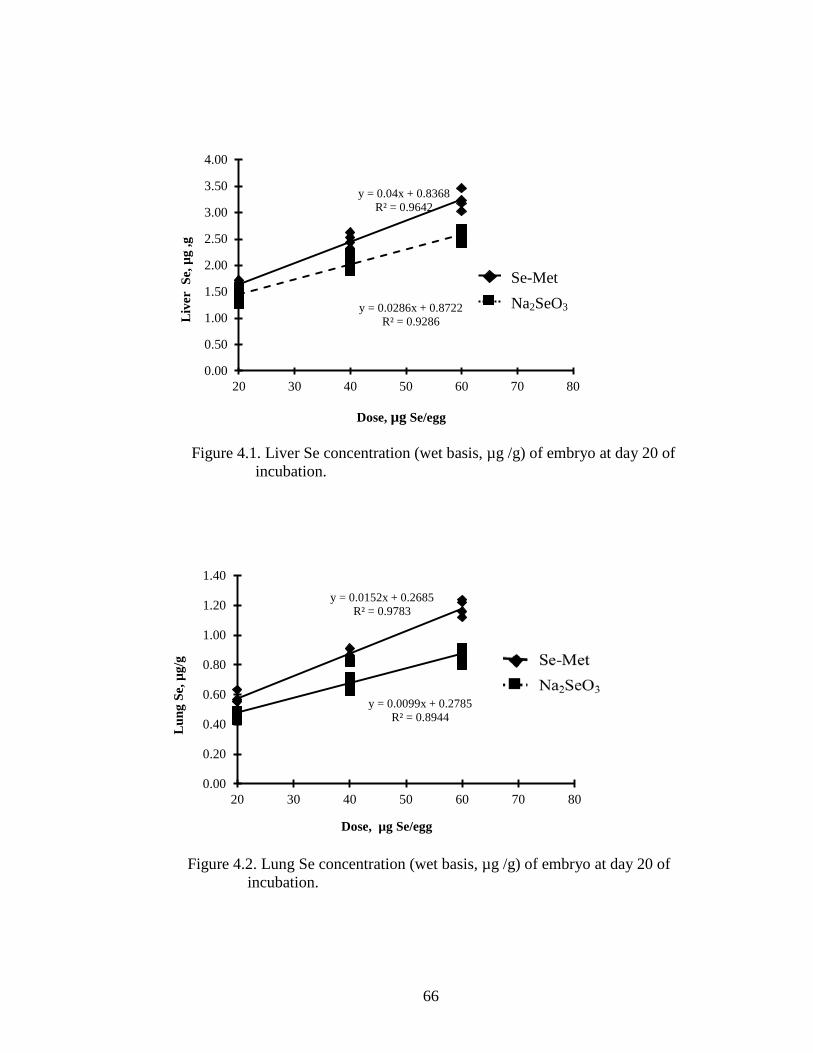
Figure 4.1. Liver Se concentration (wet basis μg/g) of embryo at day 20 of incubation .. 66
Figure 4.2. Lung Se concentration (wet basis μg/g) of embryo at day 20 of incubation .. 66
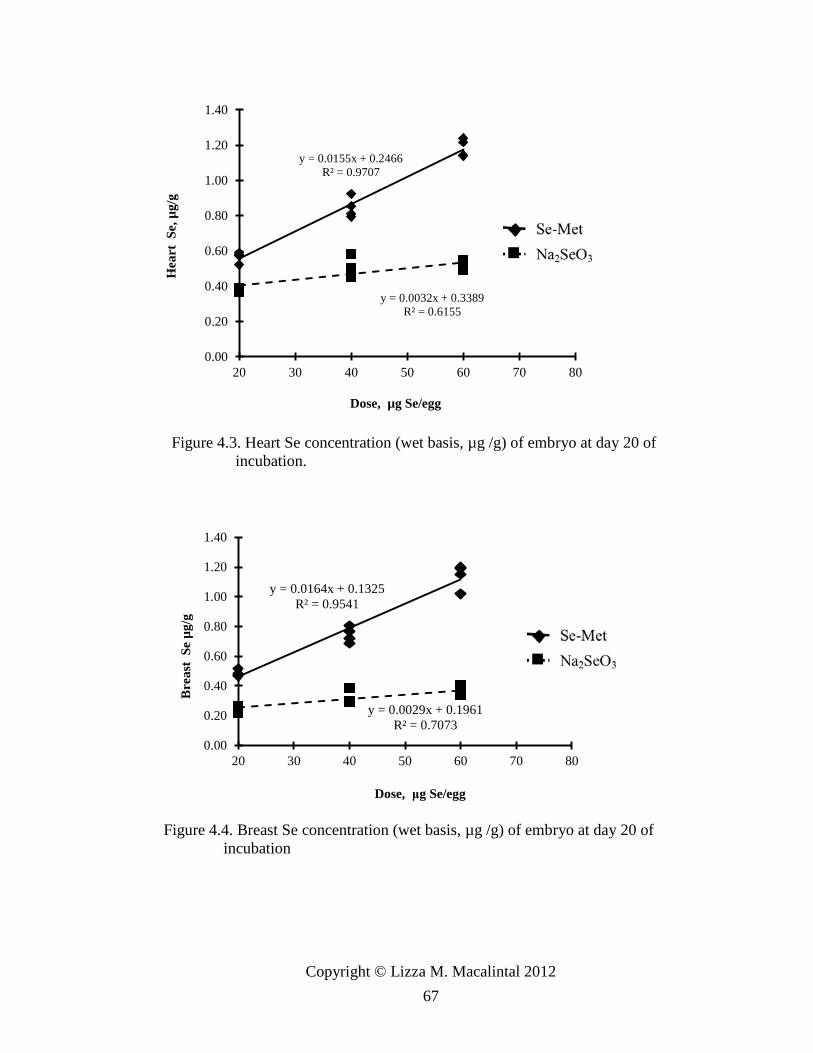
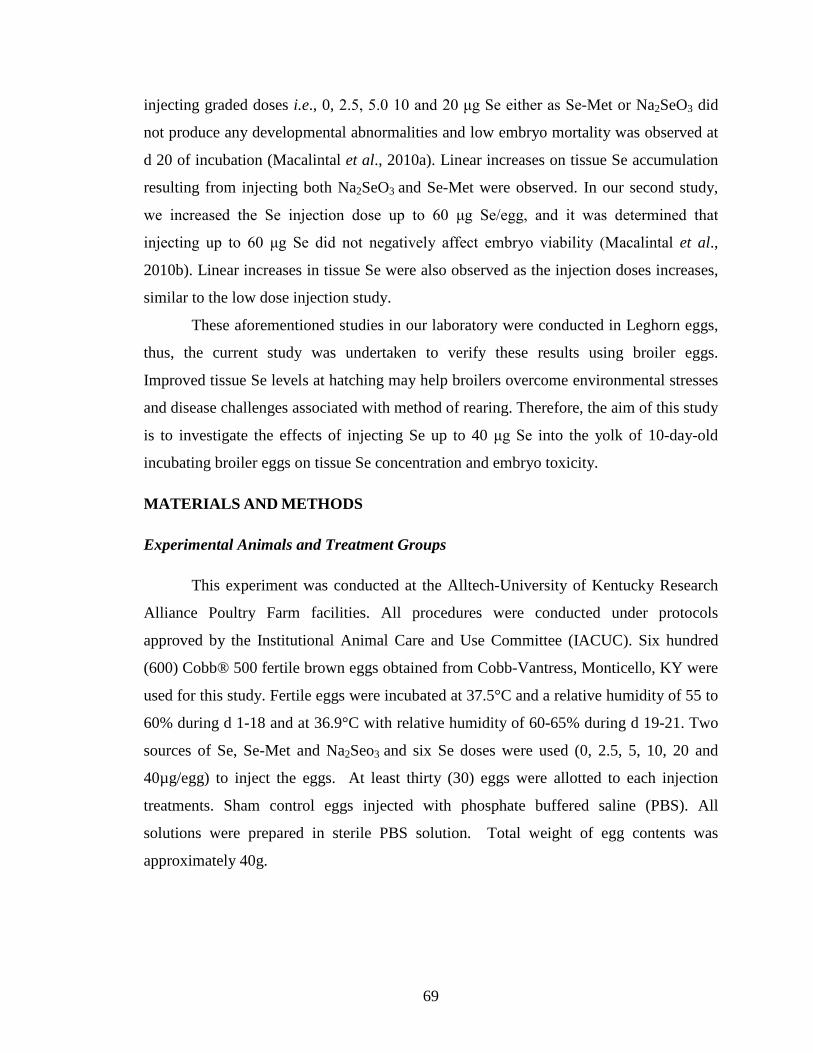
Figure 4.3. Heart Se concentration (wet basis μg/g) of embryo at day 20 of incubation. .... ............................................................................................................................... 67
Figure 4.4. Breast Se concentration (wet basis μg/g) of embryo at day 20 of incubation .... ............................................................................................................................... 67
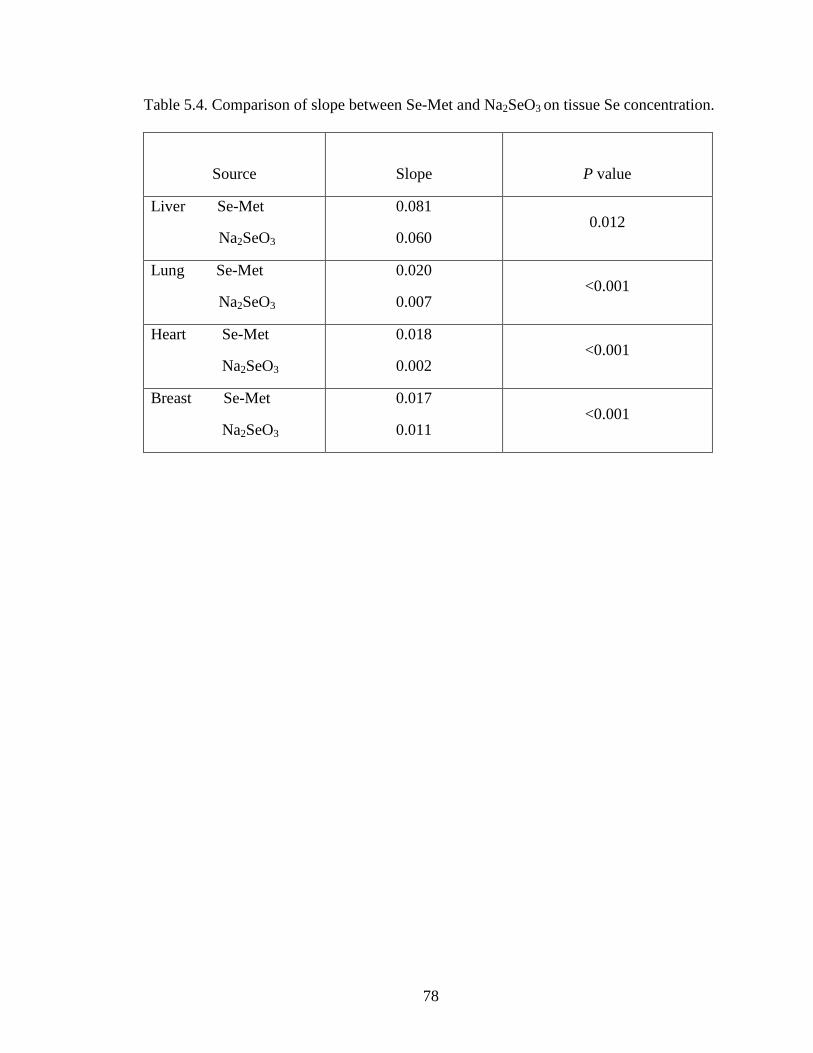
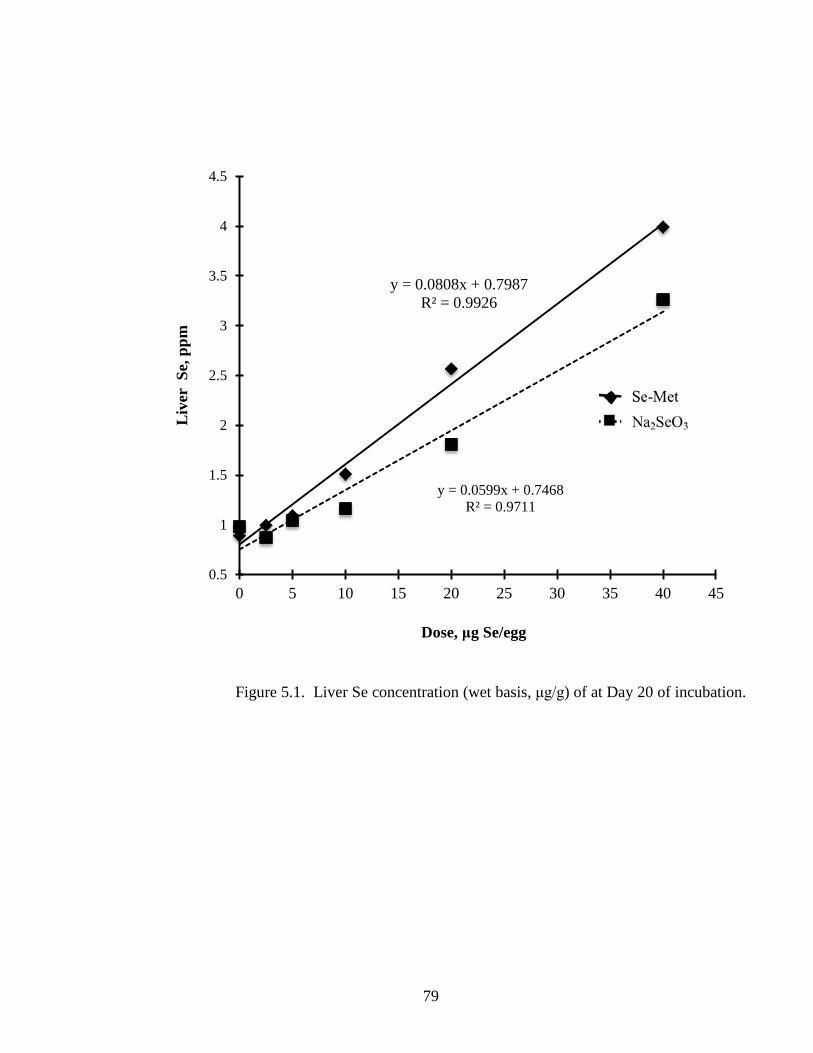
Figure 5.1. Liver Se concentration (wet basis, μg/g) of embryo at day 20 of incubation............................................................................................................................... 79
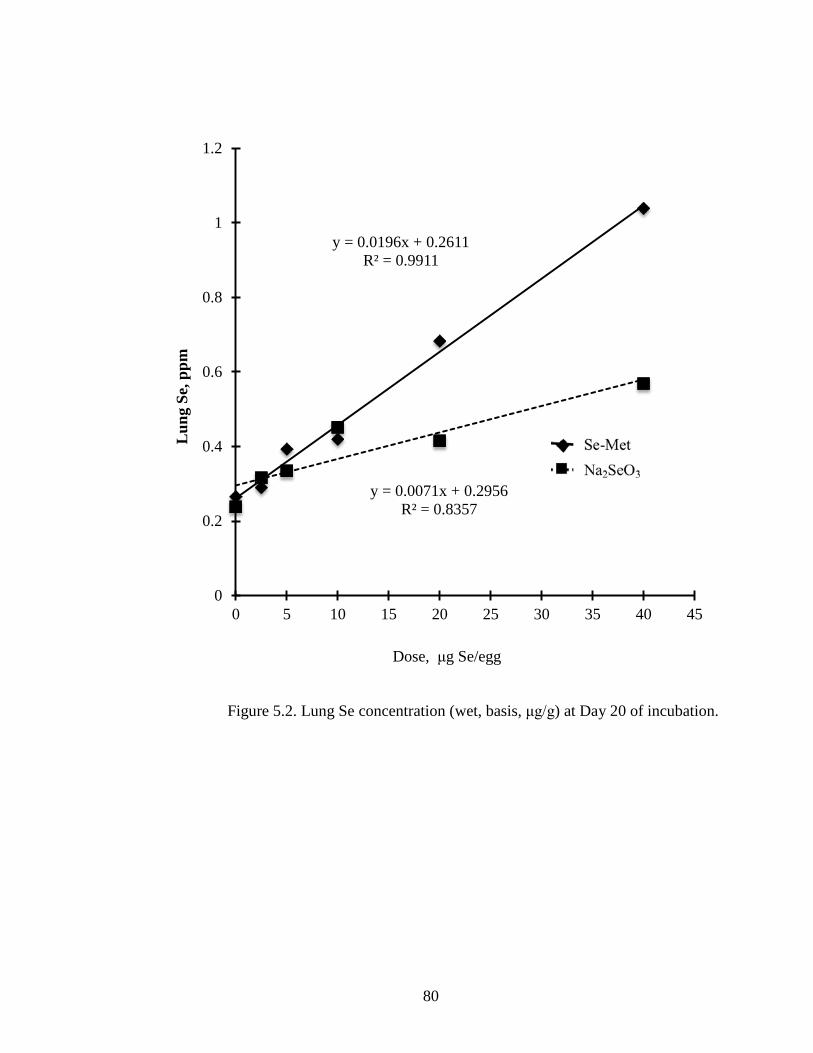
Figure 5.2. Lung Se concentration (wet basis, μg/g) of embryo at day 20 of incubation............................................................................................................................... 80
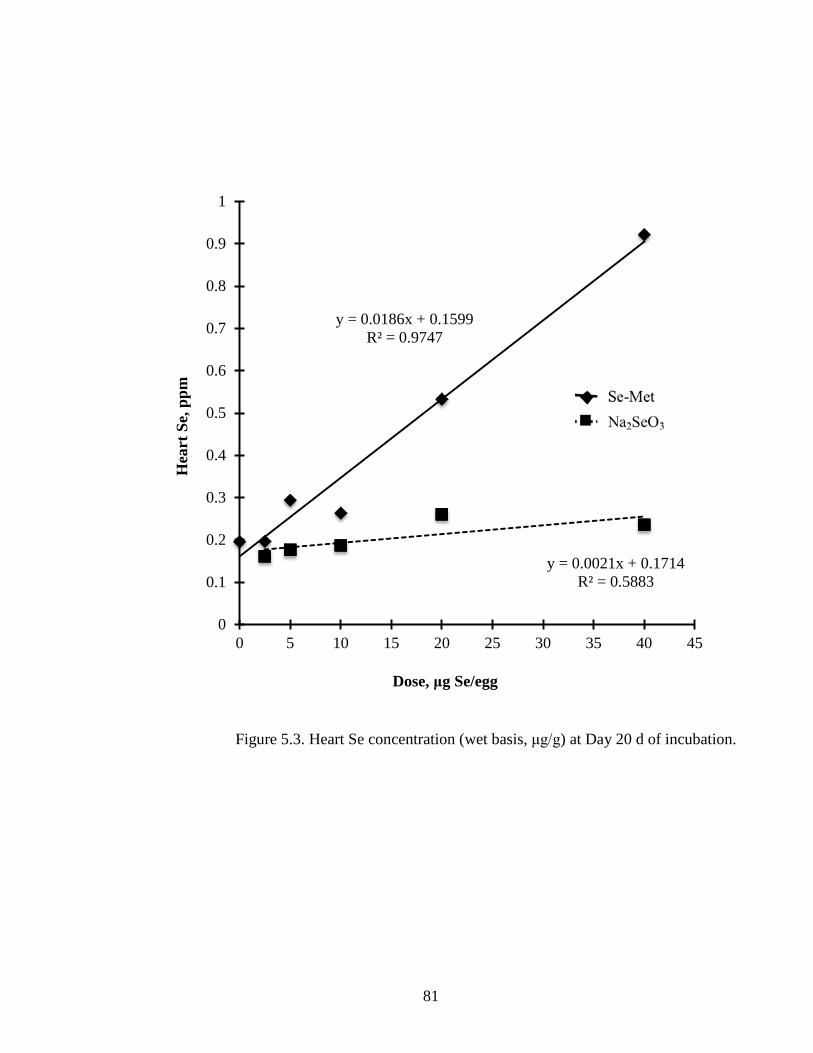
Figure 5.3. Heart Se concentration (wet basis, μg/g) of embryo at day 20 of incubation .... ............................................................................................................................... 81
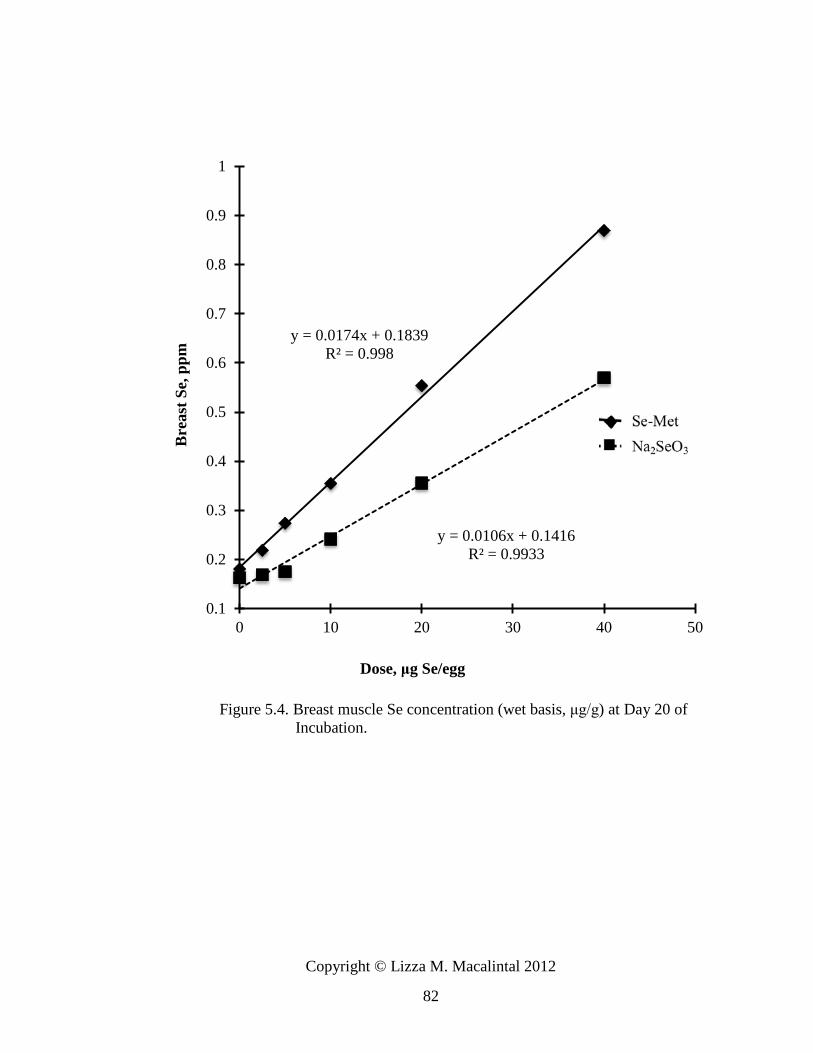
Figure 5.4. Breast muscle Se concentration (wet basis, μg/g) of embryo at day 20
of incubation ........................................................................................................ 82
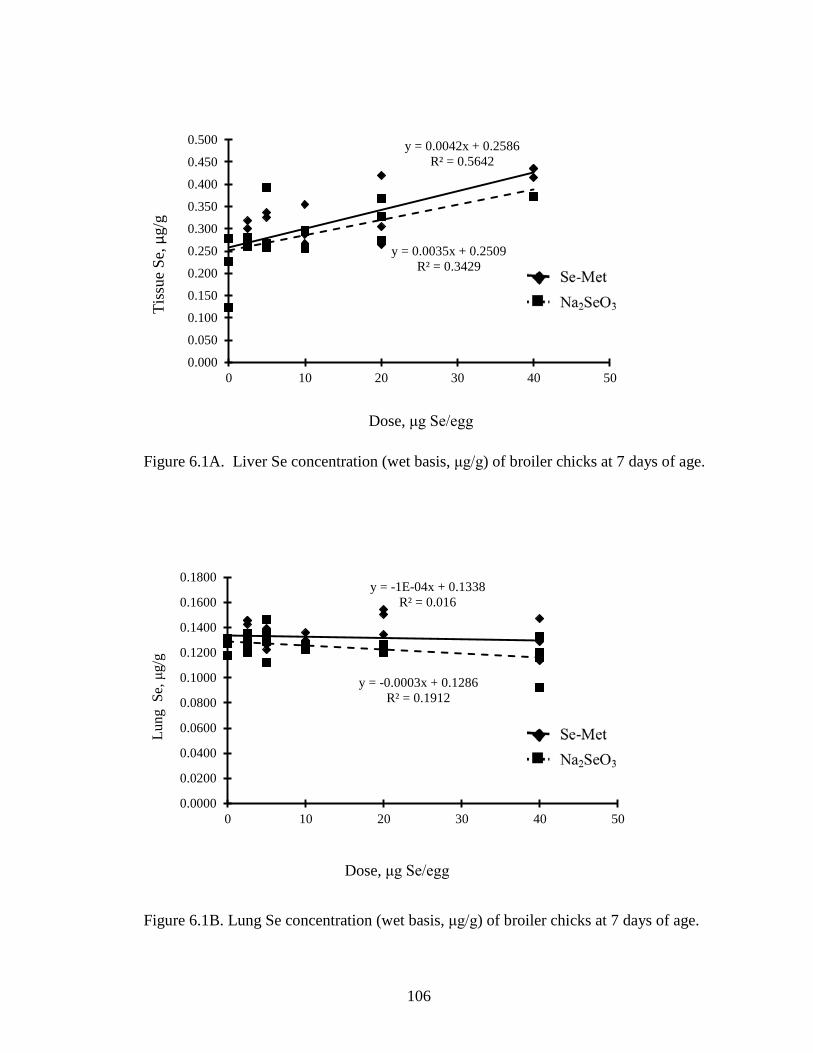
Figure 6.1A. Liver Se concentration (wet basis, μg/g) of broiler chicks at 7 days of age ............................................................................................................................. 106
Figure 6.1B. Lung Se concentration (wet basis, μg/g) of broiler chicks at 7 days of age ............................................................................................................................. 106
xiii
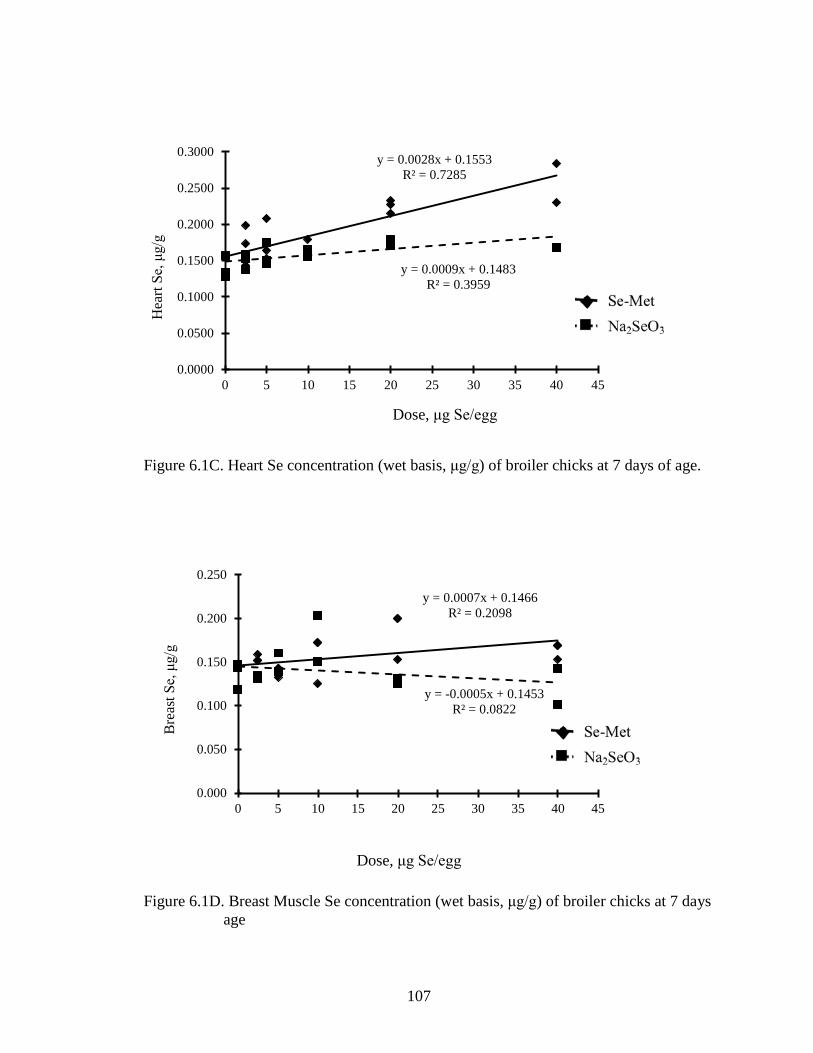
Figure 6.1C. Heart Se concentration (wet basis, μg/g) of broiler chicks at 7 days of age ............................................................................................................................. 107
Figure 6.1D. Breast Muscle Se concentration (wet basis, μg/g) of broiler chicks at 7 days of age ................................................................................................................... 107
Figure 6.2A. Liver Se concentration (wet basis, μg/g) of broiler chicks at 14 days
of age ................................................................................................................... 108
Figure 6.2B. Lung Se concentration (wet basis, μg/g) of broiler chicks at 14 days
of age ................................................................................................................... 108
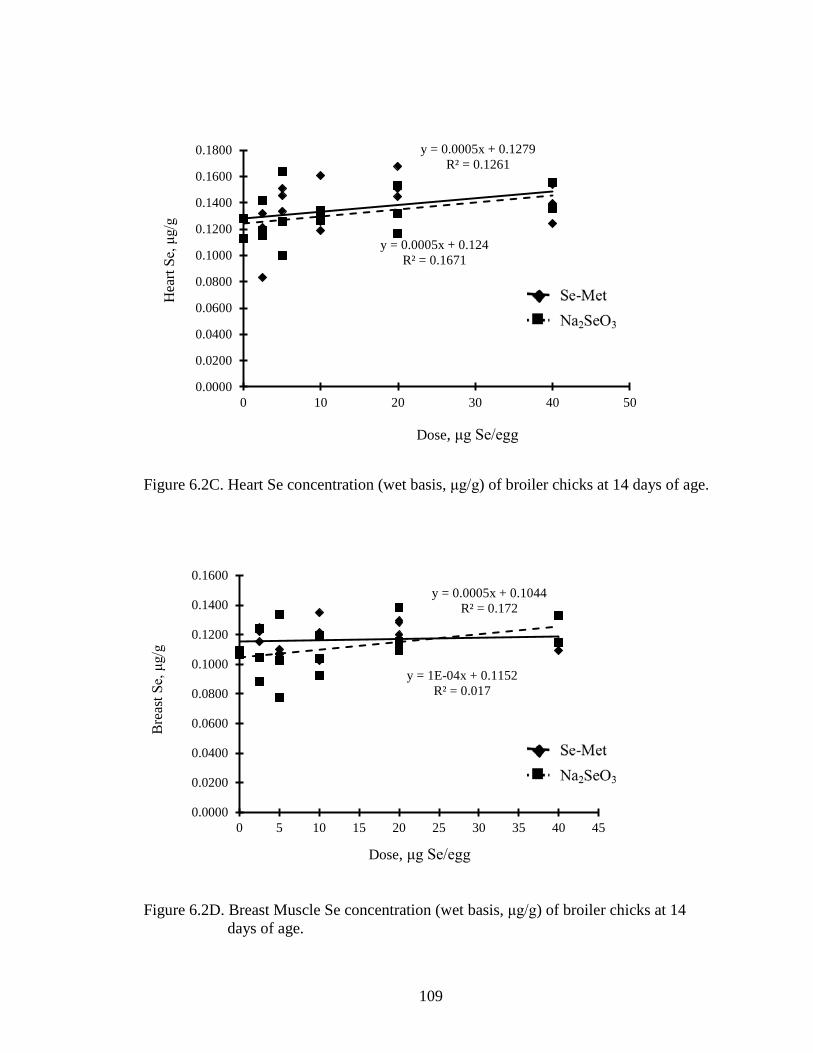
Figure 6.2C. Heart Se Concentration (wet basis, μg/g) of Broiler Chicks at 14 Days
of Age ................................................................................................................. 109
Figure 6.2D. Breast muscle Se concentration (wet basis, μg/g) of broiler chicks
at 14 days of age ................................................................................................ 109
Figure 6.3A. Liver Se concentration (wet basis, μg/g) of broiler chicks at 21 days
of age ................................................................................................................... 110
Figure 6.3B. Lung Se concentration (wet basis, μg/g) of broiler chicks at 21 days
of age .................................................................................................................. 110
Figure 6.3C. Heart Se concentration (wet basis, μg/g) of broiler chicks at 21 days
of age .................................................................................................................. 111
Figure 6.3D. Breast muscle Se concentration (wet basis, μg/g) of broiler chicks at 21
days of age .......................................................................................................... 111
Figure 7.1. Effect of Se supplementation of breeder hen diets on blood Se concentration (wet basis, μg/g) of progeny chicks fed a low se diet (Trial 2)........................... 119
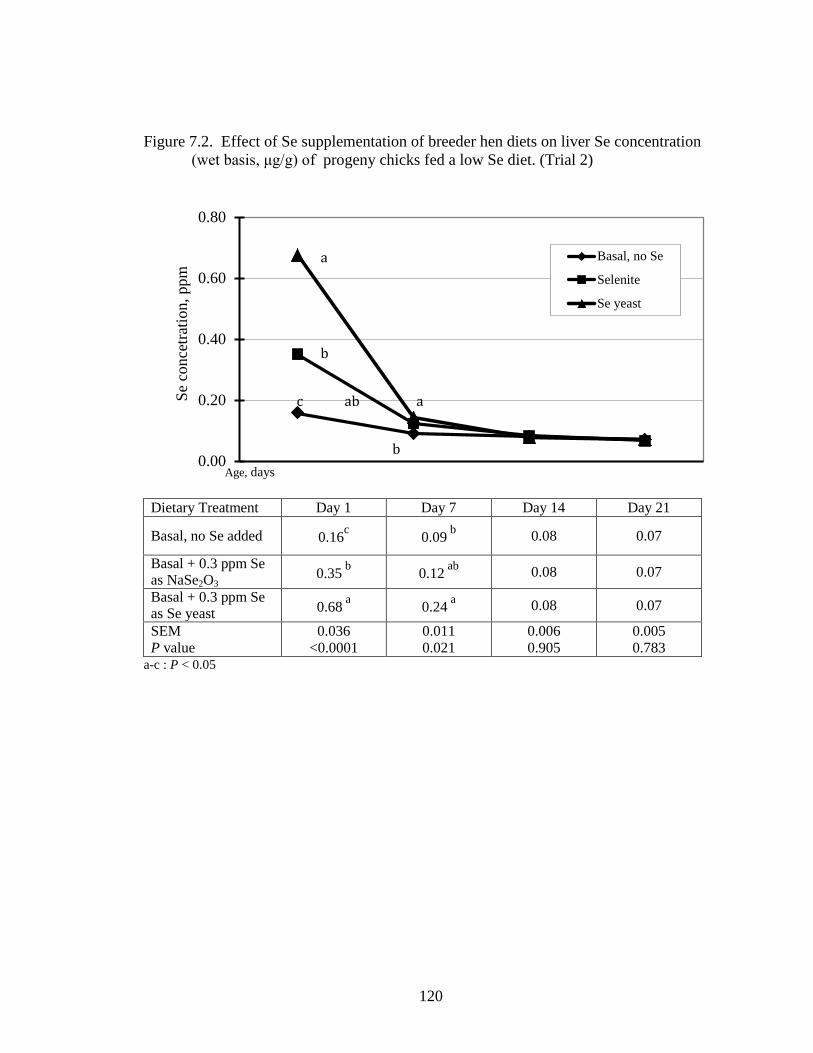
Figure 7.2. Effect of Se supplementation of breeder hen diets on liver Se concentration (wet basis, μg/g) of progeny chicks fed a low Se diet (Trial 2) .......................... 120
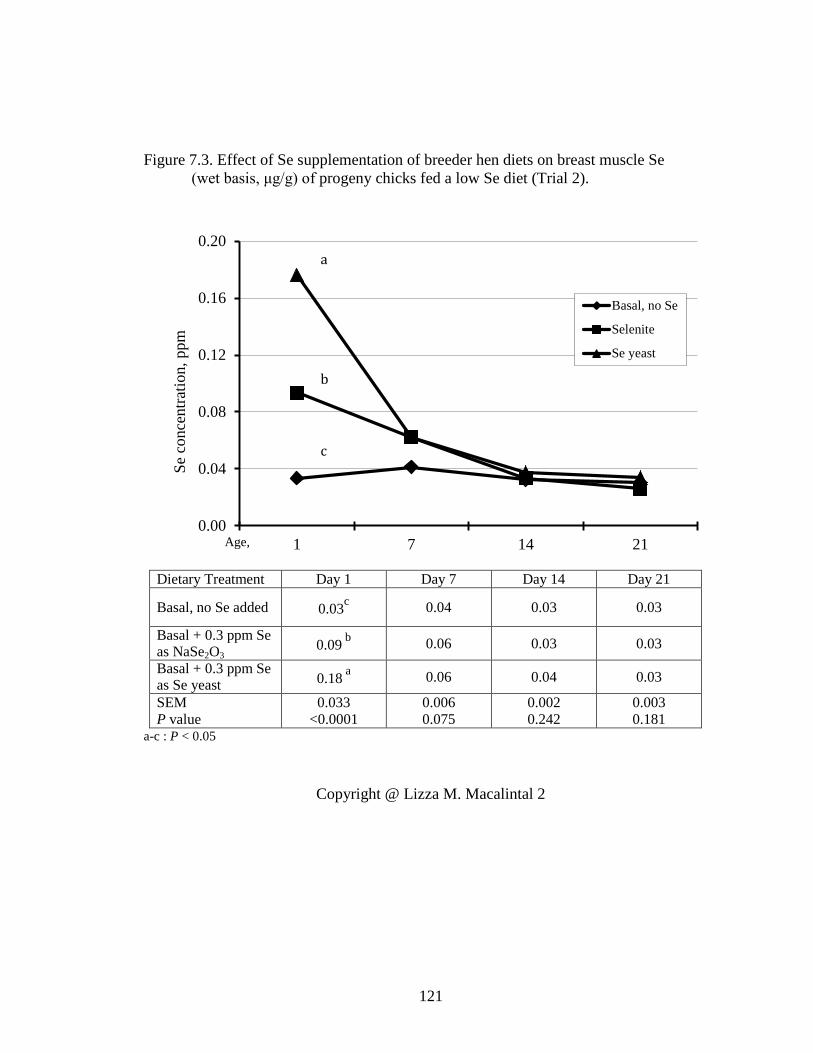
Figure 7.3. Effect of Se supplementation of breeder hens on breast Se concentration (wet basis, μg/g) of progeny chicks fed a low Se diet (Trial 2). ................................. 121
1
CHAPTER 1: INTRODUCTION
Selenium’s role in animal health and nutrition was first recognized in the 1930’s
as a toxic principle that occurred in feed ingredients. Consumption of seleniferous plants
from certain areas in South Dakota has caused major problems to poultry raisers as
hatchability and growth performance were affected. Franke and Tully (1935) first
described the toxic effects of selenium in chickens grown in certain localities in South
Dakota, USA. Farmers raising these chickens complained of low chick hatchability,
hatched chicks had greasy down that never became fluffy and when higher hatchability
was obtained, chick livability was lower. Tully and Franke (1935) attributed the inhibited
growth of chicks and reduced egg production from toxicants that naturally occur in grains
grown from “alkalied” areas. In a related study, Franke and Tully (1936), induced the
teratogenic effects in chick embryos using selenite injected into the aircell with a reported
lethal dose of 50% (LD50) at 0.7 ppm. However, even at a low concentration of 0.01 ppm,
embryonic abnormalities were observed. In 1958, Gruenweld described the histologic
changes that occurred in embryos <5 d of incubation hatched from hens fed a diet
containing 45% wheat and supplemented with Se at 17 ppm. The primary visible effect in
the embryo was necrosis of the cells in the brain, spinal cord, optic cups and lens vesicles
and in the mesenchyme of the limb buds and somites of the tail region.
Subsequent studies included injecting incubating eggs using different routes of
administration, Se compounds and stages of development. The toxic effects of Se
included high mortality and developmental defects. Depending on Se compounds used,
route and days of injection, these experiments led to different estimates of the LD50.
Aircell injection resulted in higher death than the yolk sac route. Organic (Se-Met,
selenocysteine) as well as inorganic (selenite, selenate) forms of Se were used as Se
sources, however, Se-Met was observed to be more toxic than Na2SeO3 (Palmer et al,
1973). Dietary addition of Se at toxic levels to hen diets resulted in decreased in
hatchability, egg weight and egg production. Eggs that did not hatch after 21 days
showed embryos with head and neck enlargement (Ort and Latshaw, 1978).
2
Se toxicity occurs when the body’s ability to excrete excess Se is compromised.
However, “since the physiological basis of selenosis has been defined and the
biochemical indicators have not been identified, it is difficult to distinguish levels of Se
that are safe and beneficial from those that are potentially harmful to health” (Ralston et
al, 2008).
Although Se was first associated with toxicity, in 1950’s, the importance of
selenium in the diet was elucidated when it was deemed essential in the prevention of
liver necrosis in rats. Hence, its essentiality was established. This was further
strengthened in the 1970’s when Se was found to be an essential component of the
enzyme glutathione peroxidase (Rotruck et al, 1973). Since the essentiality of Se in the
animal diet had been established, more research was then focused on the requirement to
prevent deficiency effects. Deficiency of Se in the poultry diets has shown to cause
several pathological conditions that can impact growth and development.
Normally, Se is added to the animal’s diet using inorganic Se (Na2SeO3 or
Na2SeO3). However, in 2000, the United States Food and Drug Administration (FDA)
approved the use of Se yeast as an organic Se source of which the major Se component is
Se-Met. It has been reported that Se is readily transferred from breeder hens to the eggs
and, thus, to the embryo (Cantor et al., 1974; Paton et al., 2002). However, the amount of
Se that can be derived from the hen’s diet is limited, because the maximum level of
dietary Se supplementation is limited to 0.3 ppm by the FDA.
One unique way of introducing nutrients to the incubating embryo is through in
ovo injection. Studies have shown that in ovo injection of nutrients, such as carbohydrate,
proteins, vitamins and amino acids as well as vaccines, can enhance growth and
development of the embryo, improve energy status, promote early gut development and
improve immune status, as well as alleviate the stress of hatching (Foye et al, 2007; Tako
et al, 2005; Gore and Qureshi, 1987; Ohta et al., 2001; Johnston et al., 1997; Sharma and
Burmester, 1984).
The objective of this research was to study the effects of in ovo injection of high
levels of Se either as Se-Met or Na2SeO3 in fertile eggs at 10 d of incubation on tissue Se
concentrations in both embryos and hatched chicks, embryo viability, lipid peroxidation
3
and immune responses during post-hatch development.
4
CHAPTER 2: REVIEW OF LITERATURE
Historical Background of Selenium
Records of selenium-related illnesses in animals date back to Marco Polo’s travels
to western China (1271–1295) (Spallholz, 1994). Polo attributed the loss of hooves and
hair in horses to the consumption of poisonous grasses that researchers now believe
contained high concentrations of Se. However, the element Se was not discovered until
1817 when Swedish scientist, Jons Jakob Berzelius isolated and identified it “in the sulfur
obtained by sublimation from the iron pyrites of Fahlun” (Turner, 1835). Se is named
after the Greek goddess of the moon, Selene, because chemically it is similar to the
element tellurium, a name derived from the Latin tellus meaning Earth.
In the 1800s, “alkali disease” was documented in grazing livestock that had
access to alkali seeps and high salt concentrations in the U.S. upper Midwest (e.g.,
Nebraska, South Dakota). Symptoms included emaciation, loss of hair and hooves, signs
of anemia, liver cirrhosis, and skeletal erosion. Not until 1935 was the underlying cause
of “alkali disease” identified as Se toxicity. Franke and Potter (1934) proved this
association by experimentally reproducing similar symptoms in rats by feeding them
selenite or selenate. Separately, Moxon (1937) reported another disease affecting the
nervous system of cattle and sheep, which he called “blind staggers,” since affected
animals tend to exhibit unsteady gait. He further suggested that these animals had
ingested plants that were accumulators of high concentrations of Se.
Selenium was considered to be a toxic element until 1957, when Schwarz and
Foltz showed it was an essential trace element based on experimental evidence that liver
necrosis in rats can be prevented when their diets contain brewer’s yeast but not torula
yeast. Brewer’s yeast differentially contains Se, which together with vitamin E and
cysteine, can prevent liver necrosis, Se being what is now known as Factor 3. In separate
studies Schwarz et al. (1957) and Patterson et al. (1957) also showed that Se can prevent
exudative diathesis (ED) in chicks. In addition, Se therapy was shown to prevent diseases
like muscular degeneration, which occurs naturally in lambs (Schubert et al., 1961) and
calves (Muth et al., 1958; Schubert et al., 1961). In relation to these, Thompson and Scott
(1970) concluded that Se is essential for growth of chickens independent of its function
5
as a substitute for vitamin E. Concurrently, Rotruck et al. (1973) and Flohé et al. (1973)
discovered the selenoprotein glutathione peroxidase (GSH-Px), the activity of which is
dependent upon tissue Se uptake. This discovery confirmed the essentiality of Se in
animal and human health. To date more than 20 selenoproteins (Arthur and Beckett,
1994) have been discovered, each of which is tissue specific and dependent on Se
availability.
Extensive studies have been conducted to investigate the metabolic effects of Se
in both animals and humans, but it was not until 1974 that the FDA approved the
inorganic Se (sodium selenite) for use as a dietary feed supplement for poultry and
livestock (Leeson and Summers, 1991). In 2000, the FDA approved the use of organic
selenium in the form of Se yeast (Sel-Plex®, Alltech Inc., Nicholasville, KY), the
primary Se component of which is seleno-methionine (Se-Met).
Biochemistry of Selenium
Selenium is classified as a metalloid, having the characteristics of both the non-
metal and metal elements. With an atomic number of 34 and a molecular weight of 78.96,
it is a member of Group VIA on the periodic table together with oxygen, sulfur, tellurium
and polonium. Of these elements, sulfur is very similar to Se both in its chemical and
physical natures (Table 2.1, Figure 2.1), nevertheless in vivo there are differences and one
cannot always substitute for the other (Shamberger, 1983). For example, in mammals Se
tends to be reduced, whereas sulfur is usually oxidized. In terms of its relative acidity,
hydrogen selenide (H2Se) is more acidic than hydrogen sulfide (H2S). Under physiologic
pH, cysteine is protonated, whereas selenocysteine (Se-Cys) is usually in a dissociated or
deprotonated form.
Currently, both inorganic and organic Se are widely studied and used as feed
supplements. Substances are classified as inorganic if after combustion of live tissues the
remaining ash is predominantly in the form of oxides, carbonates, or sulfate (Underwood
and Suttle, 1999). Inorganic minerals were traditionally added to feed, but because of the
antagonism that exists between salts and other components of the digesta its
bioavailability is often compromised leading to lesser absorption of specific minerals.The
6
organic form of minerals implies that they are bound principally to an organic substrate
(Radcliffe et al., 2007). Organic Se in the form of Se-Met (Combs and Combs, 1986) is
the natural form of Se normally ingested by animals from plant-based ingredients.
Furthermore, Se-Met is the predominant Se species present in the organic Se yeast.
Selenium exists in four oxidative states: selenide (Se-2), elemental Se (Se0),
selenite or selenous acid (Se+4, SeO3-2) and selenate or selenic acid (Se+6, SeO4
-2). These
valance states are important because they affect both selenium’s solubility in water and
its absorption in the intestine.
Table 2.1. Comparison of sulfur and Se compounds.
Sulfur Selenium
Oxidation State --------------------- Inorganic forms -----------------------------
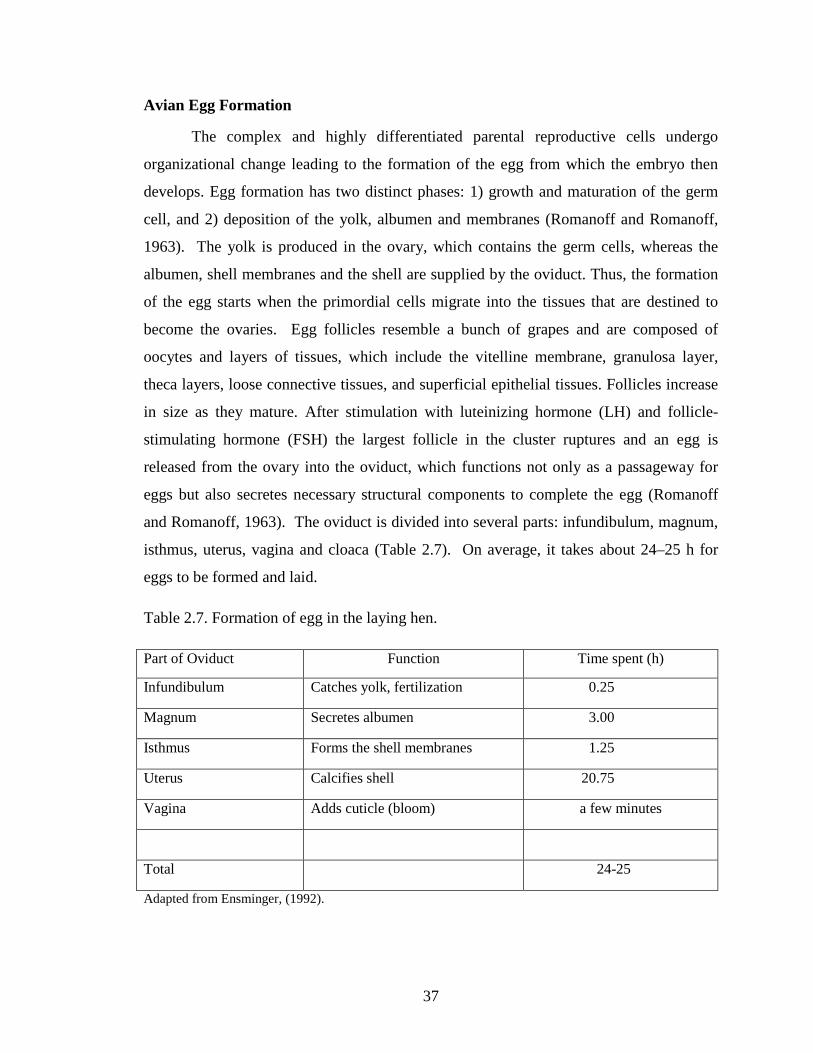
in size as they mature. After stimulation with luteinizing hormone (LH) and follicle-
stimulating hormone (FSH) the largest follicle in the cluster ruptures and an egg is
released from the ovary into the oviduct, which functions not only as a passageway for
eggs but also secretes necessary structural components to complete the egg (Romanoff
and Romanoff, 1963). The oviduct is divided into several parts: infundibulum, magnum,
isthmus, uterus, vagina and cloaca (Table 2.7). On average, it takes about 24–25 h for
eggs to be formed and laid.
Table 2.7. Formation of egg in the laying hen.
Part of Oviduct Function Time spent (h)
Infundibulum Catches yolk, fertilization 0.25
Magnum Secretes albumen 3.00
Isthmus Forms the shell membranes 1.25
Uterus Calcifies shell 20.75
Vagina Adds cuticle (bloom) a few minutes
Total 24-25
Adapted from Ensminger, (1992).
38
Yolk Formation
Yolk formation in chickens begins before the end of incubation and can continue
for several months or years. Substances that are needed for yolk synthesis are generally
derived from the liver of the laying hen and are then passed to the chick via the blood
vessels in the ovary. Yolk formation can be classified into three distinct phases: early,
intermediate, and final (Romanoff, 1960); it ceases when the oocytes reached 60–80 µ in
diameter (Romanoff, 1960). During this early phase of yolk development, oocytes are
encapsulated in a thin membrane or sac called the follicle. A series of cell-restructuring
and morphologic changes occur, until the follicular cells increase in height such that they
are pseudostratified. At this point, yolk formation takes place peripheral and central areas
of the oocyte. Several changes occur in the cytoplasm that leads to increased
mitochondrial size. Mitochondria spread out within the cytoplasm and primarily occupy
the periphery of the oocyte, whereas fat spheres appear in the cytoplasm. The yolk then
collects towards the center of the ovum. Clear vacuole-containing fluid proteins appear
underneath the layer of fat spheres when the oocytes are about 1 mm in diameter
(Romanoff, 1960).
The intermediate phase of yolk formation soon follows which lasts about 60 d.
This is the phase is characterized by slow growth of the oocyte and a gradual increase in
globule growth. Finally, a rapid oocyte growth ensues during the final phase of yolk
formation, which is about 6–14 d before ovulation. The final phase is also characterized
by the appearance of latebra, the concentric white yolk at the center of the alternating
ring of white and yellow yolk. After the follicle ruptures and releases the ovum, the very
thin clear vitelline membrane, once completely attached to the follicle, detaches from it
and totally encapsulates the yolk. The yolk is then released into the oviduct and
transported via peristaltic action. Along the way the albumen, shell membrane and shell
are added consecutively, and thus the egg is ready to be laid.
39
Embryo Formation
Fertilization of the egg occurs in the infundibulum when the sperm penetrates the
vitelline membrane and directly enters into the germinal disc, which signals the
completion of second maturation division of the egg nucleus (Romanoff and Romanoff,
1963) after which both the egg nucleus and spermatozoon undergo distinctive changes to
become the female and male pronucleus. In contrast to mammals, in the avian egg,
polyspermy occurs. Thus, many male pronuclei are found floating within the cytoplasm.
Only that sperm that penetrates the center of the germinal disc will eventually fertilize the
egg, leading to a lone male pronucleus. Male pronuclei that do not enter the germinal disc
eventually disperse, degenerate, and disappear (Stepinska and Bakst, 2006). Mori et al.
(1991) suggested that in quails, the center point of the germinal disc contains the highest
level of maturation-promoting factor (MPF), whereas the area in which the remaining
spermatozoa degenerate and die has no MPF.
The union of the parent nuclei results in the formation of the segmentation
nucleus. Segmentation (i.e., cleavage) of the cells marks the beginning of embryonic
development. Avian eggs undergo meroblastic (partial) segmentation, thus they are
classified as telolecithal eggs, in which a relatively large amount of yolk is concentrated
at one protoplasmic pole while living cells are confined to the opposite pole (Romanoff
and Romanoff, 1963). The first cleavage when egg is in the isthmus. This cleavage leads
to the two-cell stage until the cells reach the 16-cell stage when the shell membrane
becomes opaque and arrives in the uterus. By this time, the blastodisc has differentiated
into central and marginal zones. The central area is separated from the yolk by the
segmentation cavity or blastocoele. The formation of the blastoderm occurs when cells
are at the 64-celled stage division. Soon after, the marginal area disappears and
cellularization of the periblast begins. The blastoderm differentiates into area pellucida
and area opaca. It is at the central part of area pellucida, that the primitive streak develops.
After about 12 h of incubation the primitive streak has increased in length and there is a
marked growth on the posterior direction (medium streak); at 16–24 h the primitive
streak is fully developed (definitive streak). The primitive streak regresses after reaching
its definitive length in relation to the size of the area pellucida, and the “head-process”
40
begins (Romanoff and Romanoff, 1963). The primordial embryonic body begins to
develop and the egg is then laid. At this time the blastoderm contains about 20,000 cells
(Gilbert, 2000). Due to cellular development in mesodermal tissues and the establishment
of the notochord (the primitive axis of the embryo), the avian embryo exhibits a distinct
anterior-to-posterior gradient developmental maturity (Gilbert, 2000). In brief, cells of
the anterior end of the embryo are already differentiating into various organs while the
cells of the posterior end are undergoing the gastrula phase.
The formation of primary endoderm (or hypoblast) extends throughout the entire
area pellucida and into the region of the germ cell. The blastoderm covers the yolk and
differentiates into two layers during gastrula phase. The first layer is the ectoderm which
gives rise to the skin, feathers, beak, claws, nervous system, lens and retina of the eye and
the lining of the beak. The second layer is the endoderm, which produces the lining of the
digestive tract, the respiratory and the secretory organs (Ensminger, 1992). Therefore, the
embryo develops within the area pellucida, whereas the cells of the area opaca nourish
the embryo.
Extra Embryonic Membranes
Within 48 h of embryo development after fertilization, the extra embryonic
membranes begin to develop. Four membranes grow out of the embryo: 1) chorion, 2)
allantois, 3) amnion, and 4) yolk sac (Romanoff and Romanoff, 1963). The amnion and
chorion arise from the dorsal folding of extra embryonic somatopleure, whereas the yolk
sac is derived from the extra embryonic splancnopleure (McGeady et al., 2006). As for
the allantois, it is derived from tissues that are transferred from the yolk sac to the
hindgut, probably as a diverticulum of the intestine. The allantois rapidly enlarges and
occupies a space between the chorion and amnion (McGeady et al., 2006). As the embryo
develops, it completely detaches from the extra embryonic tissues except at the umbilicus,
where the body wall and intestine do not yet close.
By the fifth day of incubation the yolk sac completely surrounds the yolk (Speake
et al., 1998). Because the yolk sac is highly vascularized, it produces blood until the
hematopoietic system of the embryo is in place, and it absorbs nutrients from the yolk,
which it transfers to the developing embryo. Although open communication exists
41
between the yolk sac and the intestines, no yolk passes to the gut during incubation
(Romanoff and Romanoff, 1963). Enzymatic products produced by the yolk sac
endoderm are transferred from the endodermal cells to the blood vessels of the yolk sac
and then to the embryo. Thus, the yolk sac is mainly responsible for the transfer of
nutrients needed for energy and tissue growth (Noble and Cocchi, 1990).
Yolk lipid uptake begins as a rather slow process during the first 2 weeks of
incubation; on the third week and final week very rapid uptake ensues. Aside from yolk
components, other nutrients enter the yolk through the umbilicus, such as albumin
proteins and water during the last 7 d of embryo development. According to Noble
(1986), proteins are transported through transmembrane transport, whereas lipids are
absorbed via phagocytosis. During the final period of incubation, nutrients enter the
embryo via the intestines after the embryo swallows the amniotic fluid. On average the
yolk is composed of 48% water, 17% protein, 33% fat, and 2% carbohydrates (Johnson,
2000), however these nutrient distributions are widely affected by egg weight, genetic
strain and hen age (Vieira and Moran 1998). With only 2% of the yolk composed of
carbohydrates, 90% of the energy needs of the embryo during incubation period are met
by the β oxidation of fatty acids in the mitochondria and peroxisomes to produce acetyl
coenzyme A (CoA) (Vieira and Moran 1998; Freeman and Vince, 1974). Before the
embryo is hatched, the energy produced by β oxidation is mainly used to regulate body
temperature (Speake et al., 1998), the opposite of what happens during the start of
embryo development, at which time most energy is spent on tissue growth rather than
maintenance.
The amnion is the fluid-filled milieu where the embryo floats; it acts as a
protective cushion and keeps the embryonic tissues from drying out. In the latter stage of
embryonic development before pipping, the amniotic fluid, which contains the egg
albumin, is swallowed by the embryo for nourishment (Romanoff, 1960) essential to the
first days of life since this internalized yolk serves as an energy reserve.
The last of the extra embryonic membrane to appear is the allantois (Romanoff,
1960), which serves as the embryo’s respiratory organ as well as the storage area for
nitrogenous waste (Smith, 2007). The size of the allantois increases as the size of the
embryo increases. As for the chorion, its importance is apparent only after it fuses with
42
the allantois forming the highly vascular chorioallantois (Romanoff, 1960), which
functions in gas exchange.
43
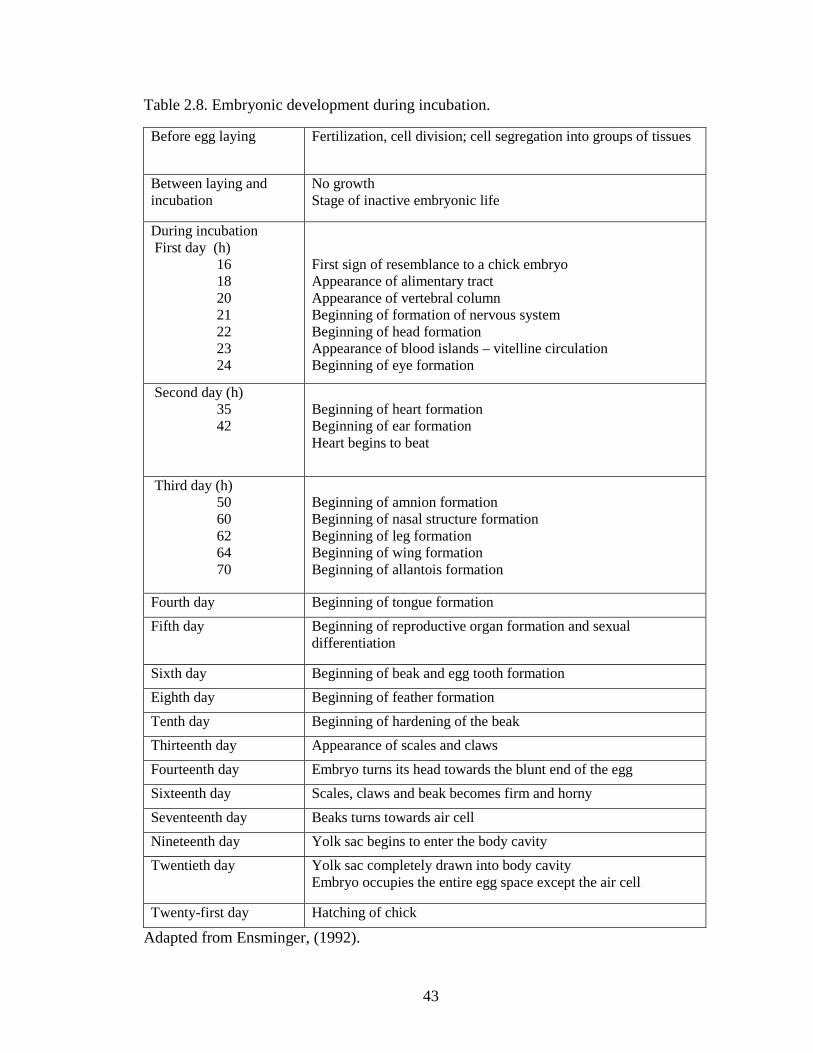
Table 2.8. Embryonic development during incubation.
Before egg laying Fertilization, cell division; cell segregation into groups of tissues
Between laying and incubation
No growth Stage of inactive embryonic life
During incubation First day (h)
16 18 20 21 22 23 24
First sign of resemblance to a chick embryo Appearance of alimentary tract Appearance of vertebral column Beginning of formation of nervous system Beginning of head formation Appearance of blood islands – vitelline circulation Beginning of eye formation
Second day (h) 35 42
Beginning of heart formation Beginning of ear formation Heart begins to beat
Third day (h) 50 60 62 64 70
Beginning of amnion formation Beginning of nasal structure formation Beginning of leg formation Beginning of wing formation Beginning of allantois formation
Fourth day Beginning of tongue formation Fifth day Beginning of reproductive organ formation and sexual
differentiation
Sixth day Beginning of beak and egg tooth formation Eighth day Beginning of feather formation Tenth day Beginning of hardening of the beak Thirteenth day Appearance of scales and claws Fourteenth day Embryo turns its head towards the blunt end of the egg Sixteenth day Scales, claws and beak becomes firm and horny Seventeenth day Beaks turns towards air cell Nineteenth day Yolk sac begins to enter the body cavity Twentieth day Yolk sac completely drawn into body cavity
Embryo occupies the entire egg space except the air cell
Twenty-first day Hatching of chick
Adapted from Ensminger, (1992).
44
Preparation for Emergence
The chick embryo emerges from its shell after 21 d of incubation. High
hatchability rates are achieved when the incubation conditions are optimum. Emergence
of the chick begins when internal pipping commences, which is characterized by the
embryo breaking the chorioallantoic membrane and the inner shell membrane adjacent to
the air cell. Wittmann and Weissenbeck (1980) suggested that the increase in CO2/O2
ratio in the air cell at the end of incubation acts as a stimulus for pipping. At this point,
the embryo switches from chorioallantois respiration to pulmonary respiration. A great
deal of energy from the yolk is utilized in preparing for emergence (i.e., pipping
movement, body rotation). Pipping is achieved through the coordinated action of the
twitching of the pipping muscle (muscularia complexus) located at the base of the back of
the neck and the “egg tooth” of the beak. Between 15–19 d of incubation the relative
weights of the pipping muscle and liver increase as the result of increased concentrations
of glucose, glycogen, and protein in the pipping muscle, a crucial metabolic profile
change as the embryo prepares for emergence (Pulikanti et al., 2010). The embryo then
proceeds to break out of its shell by twisting its leg muscle (Moran, 2007). After the
blood vessels that connect the umbilicus to the shell membranes are completely
obliterated, the hatching process is complete, and the chick is free.
Early Nutritional Manipulation
There is an increasing interest in ways to improve the developing embryo through
early nutritional manipulation, such as i.e., in ovo administration of nutrients. This
technique is used to enhance early gut development and may abate the challenges chicks
encounter during the first few hours post-hatch when delay in feeding or long periods of
fasting are experienced. Although the amount of research on supplementing breeder diets
with different nutrients has been increasing, perinatal nutrition has also been gaining
recognition and is the subject of current studies.
During the early 1980s and 1990s most in ovo studies focused on the delivery of
vaccines to the developing embryo. Sharma and Burmester (1984) showed that in ovo
technology could be successful in vaccinating embryos against Marek’s virus. These
investigators developed the basis of the in ovo injection procedures in use today. From
45
the early work of Uni and Ferket (2003) there has been an increased interest in pre-hatch
feeding. To date sources of protein, carbohydrates, vitamins and minerals (Foye, et al.,
2007; Tako et al., 2005; Ohta and Kidd, 2001) have been administered to the developing
embryo via the amnion, air cell or yolk sac to improve embryo energy status, hatchability,
BW and post-hatch performance. In addition, early feeding may help prepare the chick
gut transition from yolk-derived nutrition to external diet. Also the enhancement of
intestinal transporters due to in ovo administration of nutrients, such as HMB, may aid in
early gut maturation leading to the increased nutrient absorptive capacity of intestinal
CHAPTER 3: EFFECTS OF IN OVO SELENIUM INJECTION ON CHICK EMBRYO VIABILITY AND TISSUE SELENIUM
CONCENTRATIONS
INTRODUCTION
Selenium (Se) has been shown to be an essential trace mineral in poultry
nutrition. Thus, a dietary Se deficiency in poultry can lead to symptoms such as
exudative diathesis (Scott et al., 1957; Schwarz et al., 1957; Patterson et al., 1957;
Noguchi et al., 1973), pancreatic fibrosis (Thompson and Scott, 1969; Gries and Scott
1972), gizzard and heart myopathies in turkeys (Scott et al., 1967; Cantor et al., 1982b),
reduced fertility (Combs, 1994), reduced hatchability as well as reduced egg production
(Latshaw and Osman, 1974; Cantor and Scott, 1974). When dietary Se is supplemented to
hen diets, it can increase the transfer of Se to eggs (Cantor et al., 2000) and consequently
to the embryo (Paton et al., 2002), and thus potentially prevent conditions associated with
selenium deficiency.
Previous studies have also shown that Se injected into the egg is potentially toxic
to chick embryos. Franke et al. (1936) reported lethal doses for 50% (LD50) of embryos
of 35 µg Se as selenite injected into air cell of eggs before incubation. This dose also led
to a high incidence of embryo abnormalities. Ridgway and Karnofsky (1952) found an
LD50 of 20 µg Se /egg as selenite when injected via the yolk sac at d 4 and 8 of
incubation. Halverson et al. (1965) performed an air cell injection of selenite at d 14 of
incubation and reported an LD50 of 25 µg Se/egg. Palmer et al. (1973) injected fertile
eggs with Se via the air cell at d 4 of incubation and found that Se-Met was more toxic
than selenite, with Se-Met having an LD50 of 6.5 µg/egg compared with selenite with an
LD50 of 15 µg Se/egg. Sukra et al. (1976) also used selenite in a chick embryo study and
reported an even lower LD50 of 1.5 µg Se/egg when injected via the air cell at d 3, 5, 9
and 15 of incubation.
The goals of this experiment were 1) to determine if using in ovo injection at 10d
of incubation could enhance se status of the embryo 2) if Se could safely be injected and
3) if Se-Met or Na2SeO3 were metabolized differently by the embryo. Therefore the
current study was undertaken to investigate the effects of injecting graded level of Se as
Se-Met or Na2SeO3 on embryo viability and tissue selenium concentrations.
47
MATERIALS AND METHODS
Preliminary Research Study
Site and Time of Injection
There are different sites in which an avian egg can be injected through the
eggshell to gain access to the embryo, including the air cell, the yolk sac, the extra-
embryonic coelom, and the amnion. However, previous Se injection studies showed two
of these four sites were most commonly used, i.e., the yolk sac and air cell. However,
since during embryonic development, yolk is the primary source of energy and nutrients
including selenium, i.e., until the digestive tract is functional, the yolk sac was the most
logical route to use for this study. In addition, Ohta et al. (2001) showed that the yolk and
the extra embryonic coelom were the best injection site for nutrients such as amino acids.
Paton et al. (2002) demonstrated that the greatest increase in Se concentration in the
chick embryo occurred between 10-15 days of incubation. From a practical standpoint,
the outline of the yolk at 10 d of incubation is large enough to seen through the shell
during candling, in addition, identifying the embryo becomes easier then.
Location of the Yolk
To deliver the nutritive solution into the yolk by injection without the risk of
hitting the embryo or any major blood vessel it was necessary to candle each egg to
locate the embryo, which appeared as a dark floating silhouette and the head as a dark
spot. Usually under the candling light, healthy embryos move in response to the light.
However, there are some embryos that tend to be sluggish and take a little bit more time
to start moving. The egg was turned about a quarter turn away from the head, to locate
the yolk, the target site of injection.
Preliminary Research Study - Verification of Injection Procedure
One of the most critical point in this experiment was to determine that yolk was
the site where the solution is being delivered. Therefore to, ascertain this, a food grade
blue dye diluted in PBS was injected into the yolk of 85 fertile eggs after 10 days of
48
incubation. Sterile water and PBS were also included as injection control solutions, using
15 eggs for each. The blunt end of the egg was held under the candler and the position of
the embryo as well as the yolk was determined as described above. The outline of the air
cell was traced around the shell and a small hole was drilled onto the egg shell. Eggs
were injected with 0.5ml food grade dye in PBS, sterile water or PBS alone. Holes were
sealed using glue and eggs were then returned to the incubator. At Day 18 of incubation,
eggs were candled prior to transfer to the hatcher. At the same time, five eggs from the
dye-injected group were sampled for inspection of the correctness of injection site.
Day of Hatch
At day of hatch, baskets containing the chicks were pulled out of the incubator
and the numbers of chicks alive and dead were recorded.
Study 1 - In Ovo Injection of Graded Levels of Se
This experiment was conducted at the University of Kentucky Poultry Farm. All
procedures were conducted under protocols approved by the Institutional Animal Care
and Use Committee (IACUC). Fertile white eggs from Hy-Line W-36 hens (Hy-Line
International, IA) fed a low-Se diet were used for this study. Fertile eggs were incubated
at 37.5°C and a relative humidity of 55 to 60% during d 1-18 and at 36 °C with relative
humidity of 60-65% during d 19-21. Two sources of Se, Se-Met and Na2SeO3, were used
at five injection doses each (0, 2.5, 5, 10 or 20 µg Se/egg). At least 30 eggs were allotted
to each injection treatment. Sham-control eggs injected with phosphate buffered saline
(PBS) and non-injected eggs were also included. Average egg weight was approximately
50 g.
Preparation of Se Solutions
Sterile phosphate buffered saline (PBS) was prepared with Sigma® PBS tablets
(Sigma®, St. Louis, MO) (10 mM phosphate buffer, 2.7 mM KCl, 137 mM NaCl, pH
7.4) according to manufacturer’s instructions and was autoclaved at 121°C for 45 min.
Seleno-L-methionine (Sigma®) or Na2SeO3 (Sigma®) was dissolved in PBS to make a
200 µg Se/ml stock solution which was subsequently diluted with PBS to make
49
solutions containing 100, 50 and 25 µg Se/ml. All solutions were filtered using a 0.22 µ
acetate/pre filter (MSI®, Westborough,MA).
Se Injection
At d 10 of incubation, eggs were removed from the incubator and candled for
viability. Under the candler, the outline of the air cell was traced using a pencil and the
location of the embryo marked. After disinfecting the shell with an alcohol swab, a small
hole was drilled on the larger end of the egg, above the air cell. Using a 23 gauge, 1 ½”
(0.6mm x 40mm) needle, 0.1 ml of the Se solution was injected into the yolks to provide
doses of 20, 10, 5, 2.5 and 0 µg Se. The injection site on the shell was sealed with glue
and eggs were returned to the incubator.
Tissue Sample Collection
After 20 d of incubation eggs were removed from the incubator and the embryos
were euthanized through cervical dislocation for liver, lung and heart tissue collection.
For each treatment group, three pooled samples of 10 tissues were collected. Samples
were frozen at -20°C until analysis.
Analytical Procedures
Liver, lung and heart samples were analyzed for Se content according to the
fluorometric assay following nitric-perchloric acid digestion described by Olson et al.
(1975) with modifications by Cantor and Tarino (1982).
Statistical Analyses
Results were analyzed using the general linear model for ANOVA procedures,
there was a factorial arrangement of treatments using two Se sources and 5 injection
doses. Se source x dose treatment means were separated by the test of least significance
difference (LSD). Linear regression was performed to analyze the relationship between
tissue Se concentration in response to the doses injected (Statistix 9.0). Comparison of
slope was performed to test the difference between the two regression lines.
50
RESULTS AND DISCUSSION
Preliminary Research Study
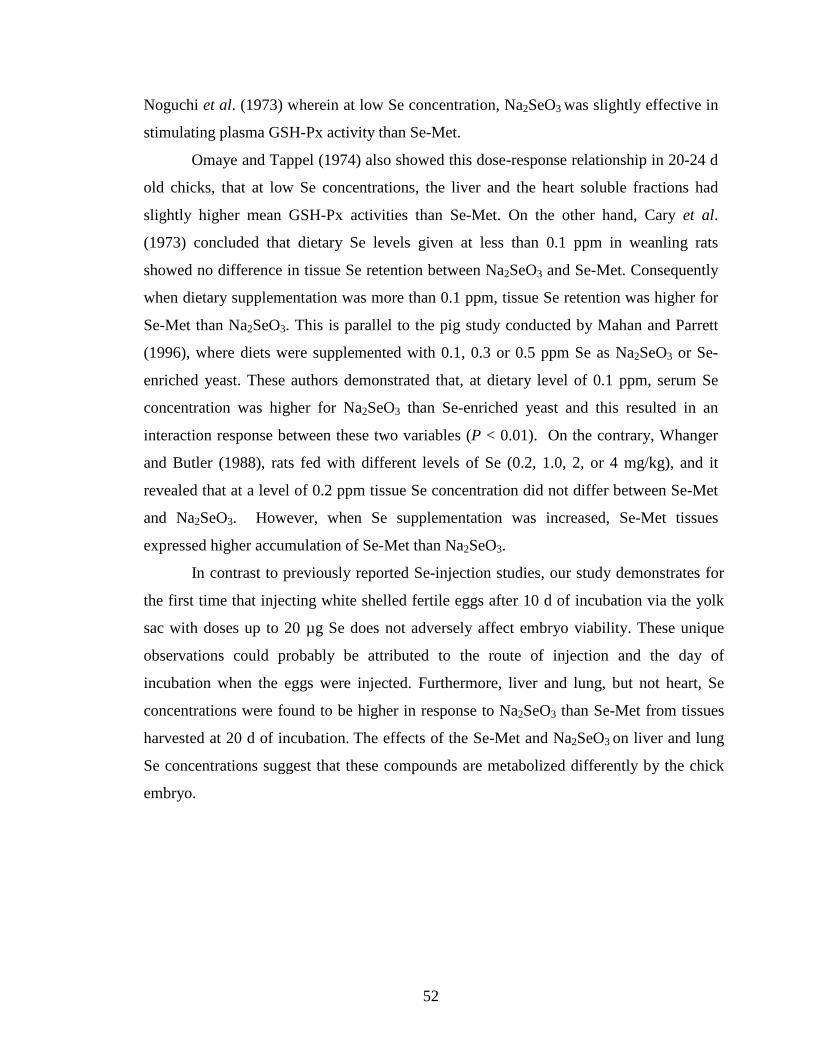
For the preliminary study, Figure 3.1,A, depicts the location of the embryo in
relation to where the yolk was located. At day 18 of incubation, upon opening the five
eggs injected with blue dye, it was noted that color of the yolks had a greenish tinge
compare with the normal yellow color of uninjected eggs (Figure 3.1,B), probably the
combination of yellow yolk and blue food grade dye that was injected. At day of hatch,
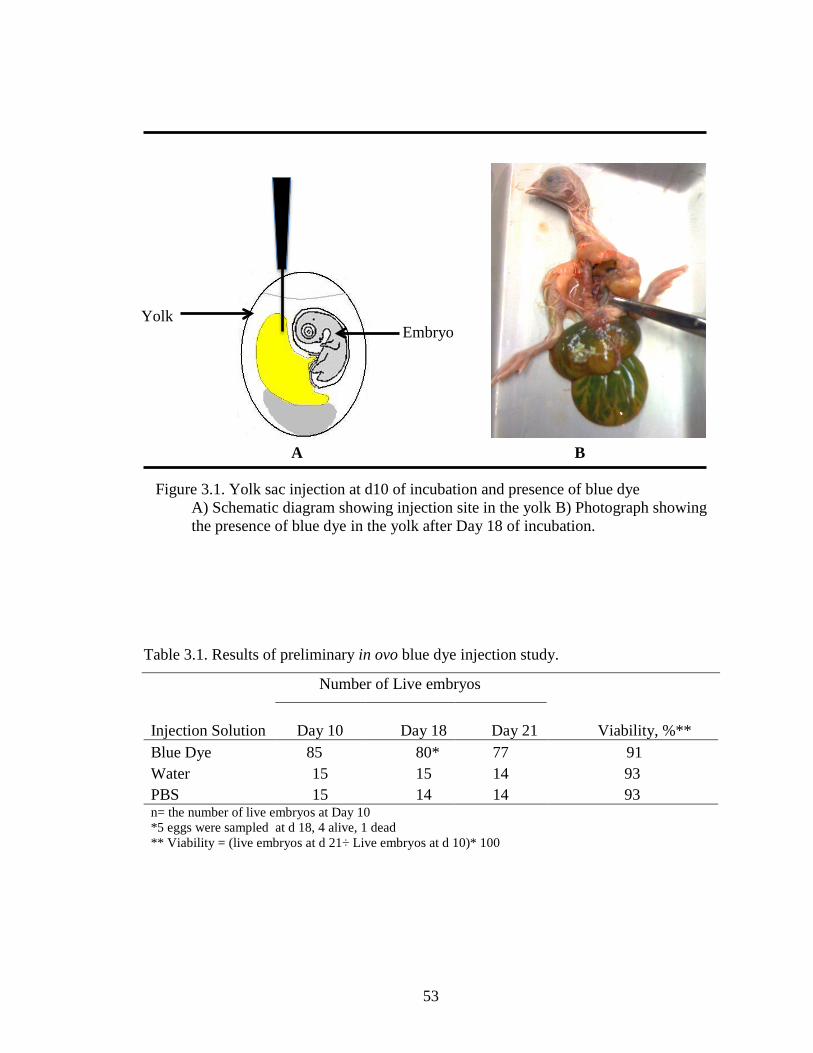
the newly hatched chicks also possessed bluish tinged-down. Viability is shown in Table
3.1. The dye injected fertile eggs had 91% viability, which wad similar to the values for
PBS or water injected fertile eggs with 93%. The preliminary results indicated that the
injection technique had minimal effect on embryo viability and mortality attributed to
injection trauma was very limited. Therefore, the subsequent research study on in ovo
injection of Se could be carried out using the procedures of the preliminary trial.
Study 1 – In Ovo Injection of Graded Levels of Se
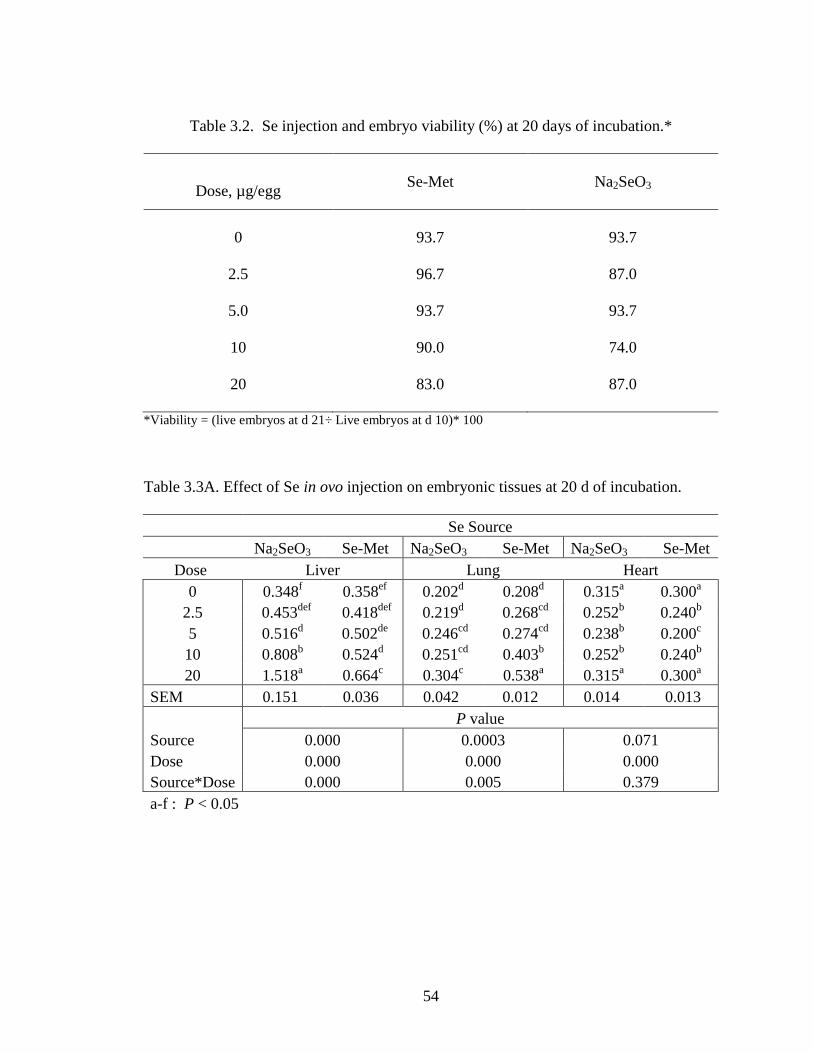
The effects of graded doses (0, 2.5, 5, 10 and 20 µg/egg) of Se either Se-Met or
Na2SeO3 injection on embryo viability 10 d post-Se injection is summarized in Table 3.2.
Embryo viability ranged from 84 to 97% for eggs injected with graded doses of Se-Met
and from 74 to 94% for those injected with Na2SeO3. The viability of embryos for PBS-
injected and the non-injected eggs was 90 and 100%, respectively. The Se-Met-injected
eggs had higher embryo viability (percentage of live embryos of injected eggs) compared
with the Na2SeO3 group. Upon opening each egg, the presence of any signs of
abnormalities, such as inflammation of the neck and head region, as well as beak, leg and
toe deformities (Franke et al., 1936), were noted and embryo deaths were recorded. For
this study, neither the injection of Se-Met nor the Na2SeO3 produced any untoward
abnormalities in the embryo, in contrast to reports from previous Se injection studies.
Our finding may indicate that both Se sources up to 20 µg Se/egg (based on 50-g egg
weight) did not affect the development of the embryo enough to produce abnormal
growth.
51
The LD50 of Se injected in chicken eggs at 9 d of incubation has been reported as
approximately 0.030 ppm when given via the air cell (Sukra et. al., 1976). In contrast,
when injected via the yolk sac at 8 d of incubation, investigators found the LD50 to be 0.4
ppm (20 µg/egg) (Ridgway and Karnofsky, 1952) and between 0.01 to 0.025 mg/egg (18
µg/egg) when administered at 4 d of incubation (Kury et al., 1973). Survival rate in the
Ridgway and Karnofsky (1952) study was 10-20% compared with 28% livability (or 72%
mortality) in the study by Kury et al. (1967). In a study by Palmer et al. (1973), the
toxicity of Se as Se-Met was similar to that as selenate (LD50 = 0.13 µg/ml or 5.46
µg/egg), but greater than that as selenite (LD50 = 0.3 µg/ml or 12.6 µg/egg). They found
that the ratio of live chicks to total fertile eggs injected decreased from 16/17 to 2/18
when the injected Se concentration increased from 0.1 to 0.4 ppm. However, in the
current study, we observed that injecting up to 20 µg Se/egg did not negatively affect
embryo viability and, therefore, was not found to be a toxic dose.
The overall effect of Se in ovo injection on liver, lung and heart muscle Se
concentrations is shown on Table 3.3A. Regardless of Se source, the Se content of the
liver was higher than that of the lung and heart muscle. This result is consistent with
previously reported studies on Se distribution and retention in the liver (Leeson et al.,
2008; Pan et al., 2007; Payne and Southern, 2005).
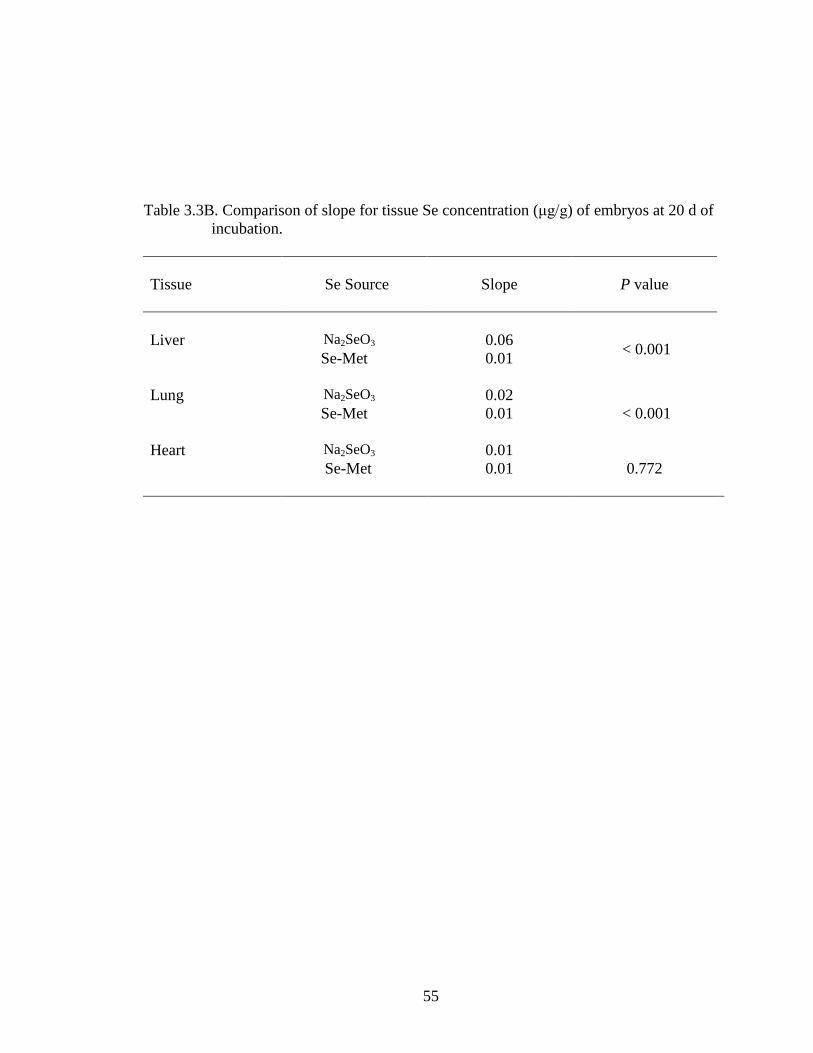
Selenium concentrations in the liver linearly increased with graded levels of Se
injected for both the Na2SeO3 and Se-Met (Figure 3.2). However, the regression
coefficient (Table 3.3B) was significantly greater for Na2SeO3 than for Se-Met (0.06 vs
0.01).
The effect of Se injections also resulted in linear increases in tissue Se in lung,
except resulting concentrations were lower compared with liver. For example, injecting
20 µg Se as Na2SeO3 resulted in a Se concentration of 1.517 µg/g in liver but only 0.664
in lung (wet basis) (Figure 3.3). The regression coefficient for the Na2SeO3 was
significantly higher than that for Se-Met (P < 0.001) (0.02 for Na2SeO3 vs 0.01 for Se-
Met). Figure 3.4 depicts the effect of Se injection on the heart muscle.
Linear increases for tissue Se concentrations were observed in this experiment
however Na2SeO3 was higher than Se-Met. These result were also demonstrated by
52
Noguchi et al. (1973) wherein at low Se concentration, Na2SeO3 was slightly effective in
stimulating plasma GSH-Px activity than Se-Met.
Omaye and Tappel (1974) also showed this dose-response relationship in 20-24 d
old chicks, that at low Se concentrations, the liver and the heart soluble fractions had
slightly higher mean GSH-Px activities than Se-Met. On the other hand, Cary et al.
(1973) concluded that dietary Se levels given at less than 0.1 ppm in weanling rats
showed no difference in tissue Se retention between Na2SeO3 and Se-Met. Consequently
when dietary supplementation was more than 0.1 ppm, tissue Se retention was higher for
Se-Met than Na2SeO3. This is parallel to the pig study conducted by Mahan and Parrett
(1996), where diets were supplemented with 0.1, 0.3 or 0.5 ppm Se as Na2SeO3 or Se-
enriched yeast. These authors demonstrated that, at dietary level of 0.1 ppm, serum Se
concentration was higher for Na2SeO3 than Se-enriched yeast and this resulted in an
interaction response between these two variables (P < 0.01). On the contrary, Whanger
and Butler (1988), rats fed with different levels of Se (0.2, 1.0, 2, or 4 mg/kg), and it
revealed that at a level of 0.2 ppm tissue Se concentration did not differ between Se-Met
and Na2SeO3. However, when Se supplementation was increased, Se-Met tissues
expressed higher accumulation of Se-Met than Na2SeO3.
In contrast to previously reported Se-injection studies, our study demonstrates for
the first time that injecting white shelled fertile eggs after 10 d of incubation via the yolk
sac with doses up to 20 µg Se does not adversely affect embryo viability. These unique
observations could probably be attributed to the route of injection and the day of
incubation when the eggs were injected. Furthermore, liver and lung, but not heart, Se
concentrations were found to be higher in response to Na2SeO3 than Se-Met from tissues
harvested at 20 d of incubation. The effects of the Se-Met and Na2SeO3 on liver and lung
Se concentrations suggest that these compounds are metabolized differently by the chick
embryo.
53
A B Figure 3.1. Yolk sac injection at d10 of incubation and presence of blue dye
A) Schematic diagram showing injection site in the yolk B) Photograph showing the presence of blue dye in the yolk after Day 18 of incubation.
Table 3.1. Results of preliminary in ovo blue dye injection study.
Number of Live embryos
Injection Solution Day 10 Day 18 Day 21 Viability, %** Blue Dye 85 80* 77 91 Water 15 15 14 93 PBS 15 14 14 93 n= the number of live embryos at Day 10 *5 eggs were sampled at d 18, 4 alive, 1 dead ** Viability = (live embryos at d 21÷ Live embryos at d 10)* 100
Yolk Embryo
54
Table 3.2. Se injection and embryo viability (%) at 20 days of incubation.*
Dose, µg/egg Se-Met
Na2SeO3
0
93.7
93.7
2.5
96.7
87.0
5.0
93.7
93.7
10
90.0
74.0
20
83.0
87.0
*Viability = (live embryos at d 21÷ Live embryos at d 10)* 100
Table 3.3A. Effect of Se in ovo injection on embryonic tissues at 20 d of incubation.
CHAPTER 6: EFFECT OF IN OVO SELENIUM INJECTION OF BROILER BREEDER EGGS ON TISSUE SE CONCENTRATION, LIPID PEROXIDATION,
IMMUNE RESPONSE AND POST HATCH DEVELOPMENT
INTRODUCTION
Lipid hydroperoxides when left unchecked can potentially damage the integrity of
the cellular membrane and can lead to cell death. These peroxides are the preliminary
oxidation products and are further decomposed to secondary products which are
aldehydes including malonaldehyde. It has been shown that chick embryo has substantial
levels of polyunsaturated fatty acids in the lipid fraction (Speake et al., 1998), which are
susceptible to oxidation, and therefore needs antioxidant defense system (Surai, 1999).
The tissues of the newly hatched chicks contain a variety of natural antioxidants
including vitamins A, C, E and antioxidant enzymes such as superoxide dismutase (SOD),
catalase (CAT) and Se containing glutathione peroxidase (GSH-Px). According to Combs
(1981) α-tocopherol and Se are the primary factors in the modulation of oxidant
protection. Selenium is a micronutrient that is essential to the nutrition of animals and
certain pathologic conditions has been associated with deficiency in diet. However, the
effect of Se deficiency in animals was not completely explained until Rotruck et al.
discovered the biochemical function of Se in 1973. Se is an integral and necessary
component of glutathione peroxidase (Glutathione: H2O2 oxidoreductase E.C. 1.11.1.9),
an enzyme that is responsible in the reduction of hydrogen peroxides (Mills et al., 1958)
or fatty acid hydroperoxides (O’brien et al., 1969) and responsible for maintenance of
sulfhydryls in the reduced state (Srivastava et al., 1970). Noguchi et al. (1973)
demonstrated that day old chicks fed control diets without Se had higher lipid
peroxidation than chicks fed a Se supplemented diet. The addition of Se and vitamin E in
the chick diet also inhibited the development of exudative diathesis.
84
Se-dependent-GSH-Px is found in the different cellular compartments (e.g.,
cytosol, extracellular space, cell membranes). Therefore, the antioxidant properties of
selenium are present throughout the cell as well, participating in immune signaling. Se is
essential for optimum activity of the immune system (Arthur et al., 2003). Deficiency in
dietary Se impacts the competence of both the innate non-adaptive and the acquired
adaptive immune system (Spallholz, 1990; Turner and Finch, 1991; Kiremidjian-
Schumacher and Roy, 1998; Brown and Arthur, 2001).
Biswas et al. (2006) reported that dietary Na2SeO3 at 0.5 and 1 ppm increased
antibody response against inoculated (sheep red blood cell) SRBC and mitogen response
to phytohemagglutinin (PHA) measured as foot web index at 4 weeks compared with the
basal diet (0.2 ppm Se) in Japanese quail; Se treatments had no effect on performance. In
contrast, Gowdy and Edens (2003) reported that broilers fed organic selenium showed
less T-cell-mediated wing web reaction to PHA compared with Na2SeO3-fed birds. In a
related study, supplementation of Na2SeO3 in broiler produced no inhibitory effects on
antibody production; however, all antibody titers for Se-supplemented broilers were
significantly higher compared with the broilers fed a no Se-supplementation (Gowdy,
2004). However, it was demonstrated by several investigators that addition of higher
levels of Se improved the immune functions in young chicks (Biswas et al., 2006; Panda
and Rao, 1994; Marsh et al., 1981). Larsen et al (1997) demonstrated that the addition of
Se in diet enhanced the immune response of broiler against antigen challenge and
reduced the effects of cold stress, 4.9 vs 2.4 log2 titers. The possible mechanism for the
depressed immune function could be related to the effect of inadequeate Se and or
vitamin E in the diets resulting to the primary lymphoid organ denegenaration which
consequently led to the depletion of lymphocytes (Marsh, 1986, Peng et al., 2011a,b).
The present study was undertaken to evaluate the effects of in ovo selenium
injection on broiler breeder eggs on tissue Se concentration, lipid peroxidation, immune
response and post hatch development.
85
MATERIALS AND METHODS
Experimental Animals and Treatment Groups
This experiment was conducted at the Alltech-University of Kentucky Research
Alliance Poultry Farm facilities at the Coldstream Experimental Unit in Kentucky. All
procedures were conducted under protocols approved by the Institutional Animal Care
and Use Committee (IACUC). Six hundred (600) Cobb 500 fertile brown eggs obtained
from Cobb-Vantress, Monticello, KY were used for this study. Fertile eggs were
incubated at 37.5°C and a relative humidity of 55 to 60%. Two sources of Se, 1) Se-Met
2) Na2SeO3 and six Se doses were used (0, 2.5, 5, 10, 20 and 40µg/egg) to inject eggs.
Two groups of 25 eggs were allotted to each injection treatments. Sham control eggs
injected with phosphate buffered saline (PBS). All solutions were prepared in sterile PBS
solution. Total weight of egg contents was approximately 40g.
Preparation of Se Solutions
Phosphate buffered saline (PBS) was prepared with Sigma PBS (10mM phosphate
buffer, 2.7 mM KCl, 137 mM NaCl, pH 7.4) tablets according to manufacturer’s
instructions and was autoclaved at 121°C for 45 min. Seleno-L-methionine (Sigma) or
Na2SeO3 (Sigma®) was dissolved in PBS to make up a 600 ppm Se solution which was
subsequently diluted with PBS to make up 400, 200,100, 50 and 25 ppm solutions. All
solutions were filtered using a 0.22µ acetate/pre filter (MSI®).
Se Injection Procedure
At day-10 of incubation, eggs were removed from the incubator and candled for
viability. Under the candler, the outline of the air cell was traced using a pencil and the
location of the embryo marked. After disinfecting the eggshell with an alcohol swab, a
small hole was drilled on the larger end of the egg, above the air cell. Using a 23 gauge, 1
½” needle, 0.1ml of respective Se solution was injected into the yolk. The injection site
on the eggshell was sealed with glue and eggs were placed back into the incubator with
settings according to standard hatchery practices.
86
Transfer to Hatcher at Day 18
At day 18 of incubation eggs were carefully candled for viability prior to transfer
to the hatcher.
Day 20 Tissue Sample Collection
At 20 days of incubation, eggs were pulled out of the incubator and cracked open
for liver, lung, heart and breast muscle tissue collection. For each treatment groups, 5
pooled samples of each tissue were collected according to each Se level injected. Samples
were frozen at -20°C until analysis.
Analytical Procedures
Liver, lung and heart samples were analyzed for selenium content according to
fluorometric assay by Olson et al. (1975) with modifications by Cantor and Tarino (1982).
Three pooled samples of 5 tissues were used per treatment group.
Birds and Diets
At day of hatch, chicks were pulled out of the hatcher for pen placement. Two
hundred and eighty eight Cobb® 500 broiler chicks were placed, allotting six birds per
cage in a mesh wire-floored standard pullet starter cages (61 cm x 51 cm x 36 cm) in an
environmentally controlled room. The temperature in the room was set at 31°C for the
first week and adjusted to 27° for the remainder of the study. Continuous light was
provided for 22h/day. Each cage was equipped with a one feeder, which is removable for
weighing purposes and two adjustable nipple drinkers. Feed and water were supplied ad
libitum. This experiment used a randomized complete block design. Blocks were based
on cage locations within the room. Each experimental unit was composed of one cage per
six birds. Four replicate cages were assigned to each of the 12 injection doses used.
Treatment doses were randomly distributed to cages within each of the four blocks.
All birds were fed a low-Se corn-soybean meal diet with no Se or vitamin E
supplementation. The ingredient composition and the calculated nutrient analysis of the
basal diet are given in Table 6.1. This experiment was conducted up to 21 days. Birds
87
and feed was weighed initially and then on a weekly basis. At the end of each week, 2
birds per cage were euthanized by argon gas asphyxiation followed by cervical
dislocation. Liver, lung, heart and breast muscle were collected weekly and stored at
-20C until analysis.
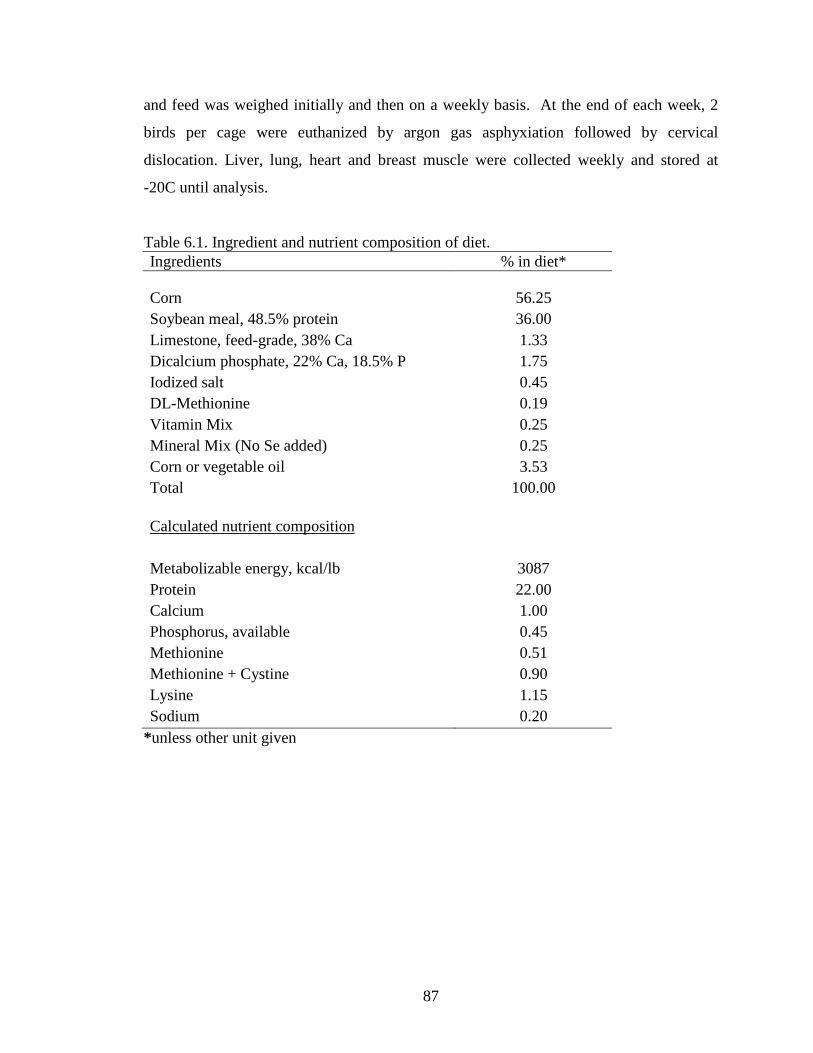
Table 6.1. Ingredient and nutrient composition of diet. Ingredients % in diet*
Corn 56.25 Soybean meal, 48.5% protein 36.00 Limestone, feed-grade, 38% Ca 1.33 Dicalcium phosphate, 22% Ca, 18.5% P 1.75 Iodized salt 0.45 DL-Methionine 0.19 Vitamin Mix 0.25 Mineral Mix (No Se added) 0.25 Corn or vegetable oil 3.53 Total 100.00
CHAPTER 7: EFFECT OF SELENIUM SUPPLEMENTATION OF BREEDER HEN DIETS ON TISSUE SE CONCENTRATIONS IN PROGENY
INTRODUCTION
Selenium is an essential trace mineral that is required by animals including
poultry (NRC, 1994) for overall health and growth performance. The essentiality of Se
was established when Schwarz and Foltz (1957) reported that Se is required nutrient that
can prevent liver necrosis in rats. Then in 1973, (Rotruck et al.) defined the specific role
of Se as being part of the structural component of glutathione peroxidase (GSH-Px). It
has been shown that GSH-Px prevent lipid peroxidation by converting lipid
hydroperoxides to non-toxic alcohol and water. As free radicals are normally produced
by the biological system, it is imperative that these radicals be quenched to prevent
potential cellular damage. Cellular damages if left unchecked can often lead to
pathological conditions. In poultry diets, Se is reportedly added to prevent exudative
diathesis, pancreatic fibrosis, gizzard and heart myopathies, immune deficiency, reduced
hatchability, reduced fertility and poor feathering among others (Cantor et al., 1975a,
Scott et al., 1957; Schwarz et al., 1957; Patterson et al., 1957; Noguchi et al., 1973;
Cantor et al., 1975b; Thompson and Scott, 1969; Gries and Scott 1972; Cantor et al.,
1982b, Scott et al., 1967; Arthur et al., 2003; Combs, 1994; Latshaw and Osman, 1974;
Cantor and Scott, 1974; Edens, 1996).
The use of Se supplements for poultry diets was approved by the US FDA in 1974. The
only two compounds of Se that were permitted were sodium selenite and sodium selenate.
Then, in 2000, the FDA approved the use of an organic form of Se in chicken diets,
namely selenium yeast which was described by Kelly and Power (1995). The major Se
component of Se yeast is in the form of seleno-methionine, which is also chiefly found in
cereals and grain used as feed ingredients. With the approval of the use of organic Se in
poultry as well as other livestock, research studies have shown the effect of feeding
organic Se as being superior in tissue Se accumulation than when NaSe2O3 is added to
the diet. Although, the concentration of Se found in cereals and grain varies according to
geographical location in the US (Kubota et al., 1967). Similarly, Cantor (1997)
conducted a survey on Se levels of corn and soybean meal used as feed ingredient from
113
several US states. He reported that the average Se levels of corn ranged from 0.024 to
0.42 ppm while the average Se levels for soybean meal was 0.06 to 0.08 ppm. Thus, the
concentration of Se from corn and soybean meal varies from state to state.
The essentiality of Se in the hen’s diet is important for egg production and
hatchability as well as for the overall performance of progeny chicks as shown by Cantor
and Scott (1974). Thus, maternal nutrition is critical to the growth and development of
the incubating embryo. Chickens are considered as precocial species; such that all the
required nutrients must be supplied to the egg prior to lay. Since embryos develop outside
of the hen after the egg has been laid, it no longer has access to maternal nutrition except
to what has been transferred to the yolk prior to lay.
In a study conducted by Paton et al. (2002), it was shown that organic Se (Se
yeast) as well as inorganic Se when added to the maternal diet could be transferred to the
egg and subsequently to the embryo. This study showed that 0.3 mg/kg Se as Se yeast
was transferred to the egg and the embryo significantly higher than NaSe2O3 on equal
amount. These authors showed that deposition of selenium linearly increases with
increasing Se concentration particularly with organic selenium. Furthermore, the greatest
increase in the Se embryo concentration was between days 10-15 of incubation. Surai
(2000) conducted a similar study showing that addition of Se yeast in the broiler breeder
diet increased the Se status of progeny tissues. These results lead us to the question on
what happens to the tissue Se levels of embryo when they are hatched and grown for at
least three weeks and fed a low Se diet.
The objective of this experiment was to evaluate the effect of dietary Se
supplementation of broiler breeder hens on the tissue concentration of progeny chicks fed
a low Se diet. In addition, it was determined how long will enhanced tissue Se levels be
observed in chicks-fed low Se levels when their dams are fed Se yeast.
114
MATERIALS AND METHODS
Chicks and Diet
Chick Study
Chicks (straight run) used for this experiment were obtained from broiler breeders
that were fed the following experimental diets; basal diet with no Se added and basal diet
with 0.3 ppm Se either as NaSe2O3 or Se yeast. Chicks were housed in mesh wire-
floored pullet starter cages (61 cm x 51 cm x 36 cm) with temperature of 31oC for the
first week and 27oC for the remainder of the study. Each cage was provided with one
feeder and two adjustable nipple drinkers. For the duration of the study, all chicks were
fed a low Se broiler starter diets shown in Table 6.1. Water and feed were provided ad
libitum.
A completely randomized treatment arrangement was used for this experiment
For Trial 1, there were 16 replicates of five chicks/cage based on maternal dietary
treatment and for Trial 2, four replicates cages of five chicks per maternal dietary
treatment were used.
Animal Welfare
This experiment was approved by the University of Kentucky Institutional
Animal Care and Use Committee.
Tissue Sampling
Blood was collected via wing vein puncture and the collected blood was
transferred to a vaccutainer containing heparin to prevent coagulation. For plasma
extraction, blood samples were centrifuged for 15 mins at 2500 x g. Tissues samples such
as liver and breast muscle as well as the blood were collected at days 7,14 and 21 or 22.
Tissue samples were collected from two birds (pooled) from each of the four replicates
per treatment whereas blood samples were collected intravenously from three birds from
each of the four replicates/treatment. Samples were stored at -20C until analysis.
115
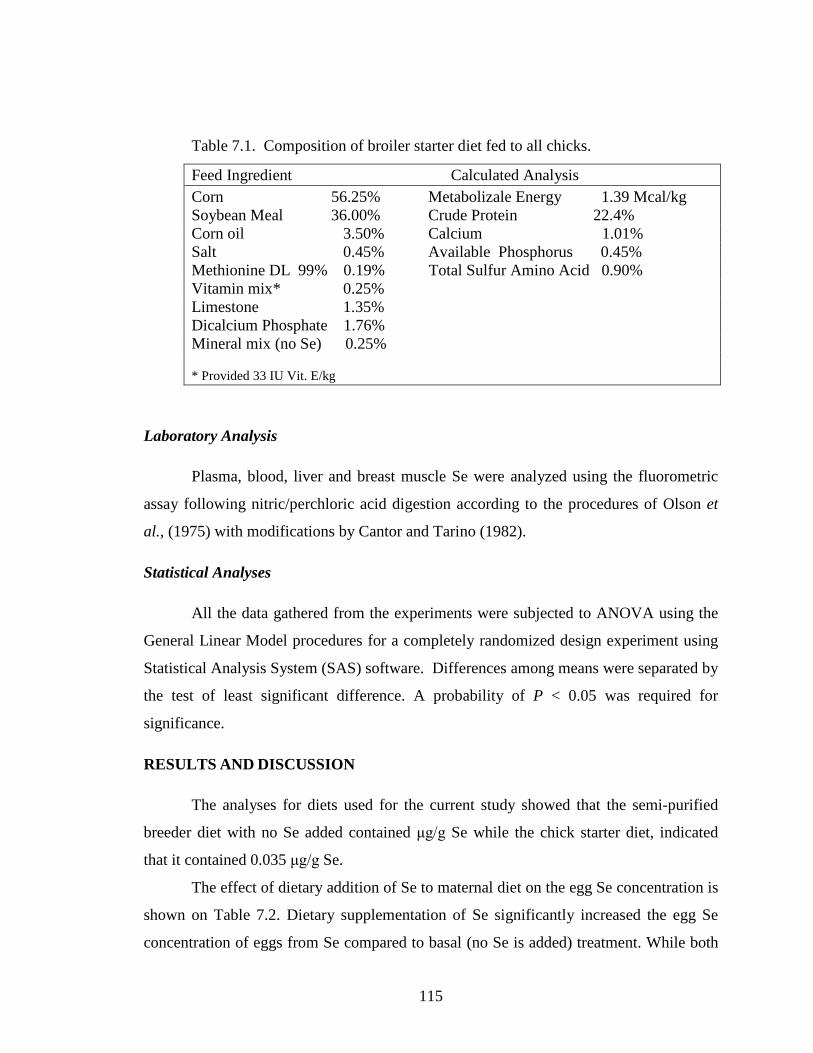
Table 7.1. Composition of broiler starter diet fed to all chicks.
Feed Ingredient Calculated Analysis Corn 56.25% Metabolizale Energy 1.39 Mcal/kg Soybean Meal 36.00% Crude Protein 22.4% Corn oil 3.50% Calcium 1.01% Salt 0.45% Available Phosphorus 0.45% Methionine DL 99% 0.19% Total Sulfur Amino Acid 0.90% Vitamin mix* 0.25% Limestone 1.35% Dicalcium Phosphate 1.76% Mineral mix (no Se) 0.25% * Provided 33 IU Vit. E/kg
Laboratory Analysis
Plasma, blood, liver and breast muscle Se were analyzed using the fluorometric
assay following nitric/perchloric acid digestion according to the procedures of Olson et
al., (1975) with modifications by Cantor and Tarino (1982).
Statistical Analyses
All the data gathered from the experiments were subjected to ANOVA using the
General Linear Model procedures for a completely randomized design experiment using
Statistical Analysis System (SAS) software. Differences among means were separated by
the test of least significant difference. A probability of P < 0.05 was required for
significance.
RESULTS AND DISCUSSION
The analyses for diets used for the current study showed that the semi-purified
breeder diet with no Se added contained μg/g Se while the chick starter diet, indicated
that it contained 0.035 μg/g Se.
The effect of dietary addition of Se to maternal diet on the egg Se concentration is
shown on Table 7.2. Dietary supplementation of Se significantly increased the egg Se
concentration of eggs from Se compared to basal (no Se is added) treatment. While both
116
Se sources increased the egg Se, the addition of resulting egg Se level from Se yeast was
37% greater than from NaSe2O3 (P < 0.001). This result is in agreement with earlier
studies on Se transfer to eggs (Paton et al., 2002), in which graded additions of Se as Se
yeast or Na2SeO3 linearly increased egg Se concentrations, Surai (2000) also reported
similar findings, wherein the addition of 0.02 or 0.04 mg/kg Se as Se yeast to a breeder
diet led to increase Se transfer to the yolk and albumen. This is important because, more
Se in the yolk may be available for transport to embryonic tissues, hence, possibly
improving antioxidant capacity.
Results for Trial 1 are shown on Table 7.3 Adding Se as NaSe2O3 or Se yeast to
the breeder diet significantly increased plasma Se and liver Se at Day 1, blood Se at Day
13 and liver Se at Day 22 in chicks, compared to the control treatment. Compared with
NaSe2O3, supplementing Se yeast resulted in significantly higher liver Se at Day1 (0.52
vs 0.32 μg/g).
In Trial 2, Se supplementation of the breeder diet with either NaSe2O3 or Se yeast
significantly elevated blood, liver and breast muscle Se of chicks at Day 1. Se yeast
resulted in significantly greater Se levels compared with NaSe2O3 (Figures 7.1, 7.2 and
7.3). Se yeast but not NaSe2O3 also elevated blood and liver Se in chicks at Day 7. By
Day 14, Se levels in blood, liver and breast muscle of chicks were similar for all
treatments. Seleno-methionine is major component of Se yeast (Kelly and Power, 1995),
Cantor and Tarino (1982) compared the effects of supplementing turkey diets with Se-
Met and NaSe2O3 on tissue Se. Seleno-methionine resulted in higher blood and
erythrocyte Se concentrations. Payne and Southern (2005b) reported that feeding broiler
chicks with organic Se and Na2SeO3 resulted plasma Se levels of 0.160 and 0.137 μg/g
respectively. Our results for breast muscle Se concentration (Figure 7.3) are comparable
with several earlier studies showing a significant increase in tissue Se accumulation due
to supplements of Se yeast (Payne and Southern 2005b) or Se-Met (Cantor et al., 1982),
compared with Na2SeO3.
The highest increase in Se concentration was observed on d 1 when breast muscle
Se for Se yeast treatment was 2x higher than that for NaSe2O3 (0.18 vs 0.09 μg/g). This is
comparable to the results obtained by Pappas et al. (2006), who concluded that broilers
breeders fed a high Se diet had progeny with higher liver and brain Se. Increased Se
117
status of hatched chicks persisted up to 14 days. Earlier on, Pappas et al., (2005)
conducted a study in which progeny chicks hatched from breeders whose diets were
supplemented with Se yeast (0.419 μg Se/g feed) were fed a low Se diet for 4 weeks.
They observed that at day of hatch, breast Se was significantly higher in offspring (4.3
times) from Se yeast supplemented hens than from control hens. The breast Se level
dropped by d 7 but was still significantly higher than control birds up to 28 days. This
trend was also seen in whole blood samples. Higher liver Se persisted up to 21 days in
comparison with the other tissues.
In the current study, Se supplementation of breeder hen diets resulted in a
significantly greater maternal transfer of Se to progeny chicks. The results of this study
showed that maternal supplementation of Se not only influences Se status of chicks at
hatch but also during growth. This was evident by the differences in the tissue
concentration of Se, while the chicks were fed low Se diets.
Taken together, the results of this experiment showed that the progeny tissue Se
levels in blood or plasma and tissues were all dependent on the amount and source of Se
added to the maternal diet. The addition of adequate Se in the hen’s diet is prerequisite to
elevating the Se status of embryo, and, thus, the chicks. Moreover, the addition of Se
yeast further elevates tissue Se concentration compared with NaSe2O3. Finally dietary
supplementation of Se is essential to prevent the possible Se deficiency that may occur in
regions where Se levels in the soil and feed ingredient is low.
118
Table 7.2. Effect of Se supplementation on broiler breeder hen diets on egg Se levels. Breeder Diet Egg Se, μg/g, % increase wet basis (vs Na2SeO3)
Basal, no added Se 0.041c
Basal + 0.3 ppm Se as NaSe2O3 0.185b
Basal + 0.3 ppm Se as Se Yeast 0.253a 37
SEM 0.017
P value 0.000
a-c : P < 0.05
Table 7.3. Effect of Se supplementation of breeder hen diets on tissue Se concentration (wet basis, μg/g) of progeny chicks. (Trial 1) Breeder Diet Se Source and Level Plasma Liver Blood Liver Day 1 Day 1 Day 13 Day 22
Basal , no Se added 0.018b 0.12c 0.04b 0.08b
Basal + 0.3 ppm Se as NaSe2O3 0.100a 0.32b 0.05a 0.11a
Basal + 0.3 ppm Se as Se Yeast 0.100a 0.52a 0.06a 0.10a
SEM 0.009 0.038 0.003 0.006
P value 0.006 0.001 0.029 0.012
a-c : P < 0.05
119
Figure 7.1. Effect of Se supplementation on of breeder hen diets on blood Se concentration (wet basis, μg/g) of progeny chicks fed a low Se diet. (Trial 2)
Dietary Treatment Day 1 Day 7 Day 14 Day 21
Basal, no Se added 0.03c 0.04 b 0.03 0.01
Basal + 0.3 ppm Se as NaSe2O3 0.11 b 0.04 b 0.03 0.01
Basal + 0.3 ppm Se as Se yeast 0.16 a 0.06 a 0.03 0.02
SEM P value
0.004 <0.0001
0.004 0.012
0.002 0.140
0.001 0.079
0.00
0.04
0.08
0.12
0.16
0.20
1 7 14 21
Basal, no Se
Selenite
Se yeast
Se c
once
ntra
tion
, ppm
Age, days
a
a
b
c b
b
a-c: P < 0.05
120
Figure 7.2. Effect of Se supplementation of breeder hen diets on liver Se concentration (wet basis, μg/g) of progeny chicks fed a low Se diet. (Trial 2)
Dietary Treatment Day 1 Day 7 Day 14 Day 21
Basal, no Se added 0.16c 0.09 b 0.08 0.07
Basal + 0.3 ppm Se as NaSe2O3 0.35 b 0.12 ab 0.08 0.07
Basal + 0.3 ppm Se as Se yeast 0.68 a 0.24 a 0.08 0.07
SEM P value
0.036 <0.0001
0.011 0.021
0.006 0.905
0.005 0.783
a-c : P < 0.05
0.00
0.20
0.40
0.60
0.80
Basal, no Se
Selenite
Se yeast
Se c
once
tratio
n, p
pm
Age, days
a
b
c a ab
b
121
Figure 7.3. Effect of Se supplementation of breeder hen diets on breast muscle Se
(wet basis, μg/g) of progeny chicks fed a low Se diet (Trial 2).
Dietary Treatment Day 1 Day 7 Day 14 Day 21
Basal, no Se added 0.03c 0.04 0.03 0.03
Basal + 0.3 ppm Se as NaSe2O3 0.09 b 0.06 0.03 0.03
Basal + 0.3 ppm Se as Se yeast 0.18 a 0.06 0.04 0.03
SEM P value
0.033 <0.0001
0.006 0.075
0.002 0.242
0.003 0.181
a-c : P < 0.05
Copyright @ Lizza M. Macalintal 2
0.00
0.04
0.08
0.12
0.16
0.20
1 7 14 21
Basal, no Se
Selenite
Se yeast
Se c
once
ntra
tion,
ppm
Age,
a
b
c
122
CHAPTER 8: CONCLUSIONS
The purpose of this research was to investigate the effects of in ovo Se injection
of incubating White Leghorn and broiler eggs as a possible means of enhancing Se status
of chicks during embryonic and post-hatch development. In the experiments, graded
doses of Se-Met and Na2SeO3 were used to inject the yolk of fertile eggs after 10 d of
incubation and determine the fate of Se once it has been absorbed and deposited into
different embryonic tissues; its effects on embryo viability, lipid peroxidation, immune
response and post hatch development.
The first study (Chapter 3), using a solution containing 2.5, 5, 10 or 20 µg Se/g Se
as Se-Met or Na2SeO3 dissolved in PBS were injected into the yolk of White Leghorn
fertile eggs. Embryo viability values for Se-Met were 97, 94, 90 and 83%, respectively,
whereas the respective values for eggs treated with Na2SeO3 were 87, 94, 74 and 87%.
Sham-control eggs injected with PBS had 94% embryo viability. Tissue Se levels
increased as Se dose injected increased. Embryonic liver and lung from eggs injected
with Na2SeO3 had higher Se concentration than from eggs injected with Se-Met. There
was no difference observed in the heart Se levels from eggs injected with either Se.
In the second study (Chapter 4), White Leghorn fertile eggs were injected with 0,
20, 40 or 60 µg Se/egg Se-Met or Na2SeO3 dissolved in PBS. Injecting fertile eggs up to
60 µg Se did not negatively affect embryo livability. Embryos from eggs injected with
Se-Met had higher viability than from eggs injected with Na2SeO3. Linear increases in all
tissues were obtained with increasing doses of Se. However, the change in heart and
breast muscle Se concentrations was minimal above the 40 µg dose when Na2SeO3 was
used. Linear regression coefficients for tissue Se vs. dose for all tissues were significantly
greater for Se-Met than Na2SeO3.
In the third study (Chapter 5), 2.5, 5, 10, 20 or 40 µg Se/g Se as Se-Met or
Na2SeO3 were injected into the yolk of broiler eggs to verify the results of the White
Leghorn egg studies. Embryo livability at d 18 of incubation was significantly affected by
dose. Livability ranged from embryo livability injected eggs ranged from 78-98 and 78-
100% for Na2SeO3 and Se-Met treatments, respectively. Injecting eggs with 20 or 40 µg
123
Se/ egg resulted in decreased livability at both 18 and 20 d of incubation. However, no
embryonic abnormalities were observed. Linear increases in all tissues were obtained
with increasing doses of Se. Injecting broiler breeder eggs with Se as Se-Met or Na2SeO3
up to 40 μg Se/egg at day 10 of incubation has little effect on embryo viability and
injecting Se-Met results in greater tissue Se accumulation than injecting the same amount
of Se as Na2SeO3.
In the fourth study (Chapter 6), the same injection doses as Experiment 3 were
used. In addition, hatched chicks were grown for 21 days. Mean body weights at 1, 7, 14
and 21 days of age were not affected by treatments. At 7 days of age, chicks from the Se-
Met injection treatments showed higher lung, heart, but not liver, Se concentrations in
contrast to those from the Na2SeO3 treatments. A significant elevation in tissue Se due to
injecting Se-Met was also seen after 14 and 21 days in the lung, but not in other tissues.
Induced lipid peroxidation observed in the lung and heart was significantly lower for Se-
Met than for Na2SeO3. There was no difference seen in the liver except for the dose effect.
Tissue homogenates from embryos that received the 0 μg Se had the highest
concentration of TBARS, compared with other treatments. Immune response was
measured following SRBC injection of chicks at 3 (primary) and 18 (secondary) days of
age. Antibody titers were not significantly different at 7 days post primary and 4 days
post secondary SRBC injection.
In the fifth study (Chapter 7), chicks were hatched from broiler breeder hens fed a
corn-soybean meal diet without Se supplementation or with 0.3 ppm Se as either
Na2SeO3 or Se yeast. The Se status, as measured by tissue Se concentrations of progeny
chicks was improved at hatching by supplementing breeder hens with either forms of Se.
However, the improvement was greater with Se yeast, compared with Na2SeO3.
The objective of this research was to study the effects of in ovo injection of
graded levels of Se either as Se-Met or Na2SeO3 in fertile eggs after 10 d of incubation
and determine the fate of Se once it has been absorbed and deposited into different
embryonic tissues; its effects on embryo viability, lipid peroxidation, immune response
and post hatch development. Previous studies on avian Se toxicity in the literaturee
124
reported that injecting Se in ovo resulted in high mortality and embryos with craniofacial
and limb defects but this is not the case in the data presented in this dissertation. We
cannot directly correlate Se injection with embryo lethality and abnormality since
exposure to higher Se doses in our experiment did not result in such observations. The
quality of solutions injected, the route and timing of injection as well as the quality of
injection techniques can possibly explain the differences in the results gathered.
The results of these experiments indicate that in ovo injection of Se up to 60 μg
Se/egg did not prove to be detrimental to the developing embryos enough to produce
developmental defects. Injecting graded doses of Se as either Se-Met or Na2SeO3 resulted
in linear increases in tissue Se concentration. However, increasing the dose of Na2SeO3,
above 20 μg Se resulted in minimal increase in heart and breast se concentration,
compared with Se-Met. The effects on tissue Se concentrations suggest that these
compounds are metabolized differently by the chick embryo. Se-Met injection,
compared with Na2SeO3, resulted in higher hatchability, reduced lipid peroxidation in the
lung and heart muscle and Se concentrations in heart and breast muscle through 7 days
and lung though 21 days of growth.
The results of these studies indicate that injection of Se into the yolk of incubating
eggs may be useful for enhancing Se status during embryonic and early post-hatch
development. Thus, the improvement in Se status using this method in conjunction with
dietary Se supplementation of breeder hens would be much greater than with only using
dietary supplementation.
Copyright @ Lizza M. Macalintal 2012
125
APPENDIX 1: Flourometric Determination of Selenium Reference: Olson et al., 1975 and Cantor and Tarino, 1982 Principle: Samples undergo nitric/perchloric acid digestion, titration, reaction with 2,3 diaminonaplthalene and extraction with cyclohexane. Cyclohexane layer is used to read relative fluorescence Using regression procedures, slenium conncetration in (micrograms) is determined. Apparatus: Analytical balance (readability to 0.0001g) Perchloric hood Glass Culture tubes with caps (200 x 25 mm) Turner Fluorometer Model 450 equipped with excitation filter #NB520 and emission filter #NB360 and apperture slides 1X,3X,10X and 30X Boiling water bath 50C water bath Reagents: Nitric acid – certified ACS plus grade Perchloric acid 70%- reagent grade Ammonium hydroxide – certified ACs grade Hydrochloric acid – trace mineral grade 1:4 concentration 1:9 concentration 0.1N Hydroxylamine-EDTA solution
In 1000 ml volumetric flask, dissolve 9 g disodium ethylene tetracetate in 900 ml water. Add 25 mg hydroxylamine hydrochloride, mix until dissolved. Dilute to 1 L with water.
Cresol Red Dissolve 0.05g cresol red in 1 ml water and add 1 drop ammonium hydroxide. Add 249 ml water; mix until dissolved.
2,3 diaminonapthalene (DAN) solution Concentration needed is 1 mg/100 ml of 0.1N HCl. 5 ml is needed for each sample, standard and blank. Use 99% purity DAN. Prepare in amber bottle mix slowly with magnetic stirrer. Extract 3x with cyclohexane in separatory funnel prior to use; discard the cyclohexane layer. Note: DAN is light sensitive. When weighing DAN,turn off fluorescent light, yellow light may be used.
126
Procedures Sample preparation
1. Weigh approximately 1 g of homogeneous sample into the culture tubes. Prepare samples in duplicate.
2. Add about 3 glass beads to each sample. 3. Add 15 ml nitric acid to tissue samples. 4. Add 2.5 ml perchloric acid. 5. For the nitric acid blanks ( prepare three), add 15 ml nitric acid and 2.5 ml
perchloric acid to the culture tube. 6. Cover with plastic wrap. Let stand overnight in fumehood.
Standard preparation Standards do not undergo digestion and do not contain nitric acid.
1. Prepare a selenium standard in triplicate. Curve should cover expected sample range. For the 0, use 1 ml of water and 2.5 ml perchloric acid.
Digestion Fumehood with capacity to accommodate nitric acid and perchloric acid must be used in the procedure.
1. Heat on Labconco digestors on low heat until deep orange (nitric acid) fumes disappear.
2. Increase heat when samples becomes transparent. 3. The nitric acid is gone when sample volume reduses and clears. Perchloric fumes
are dense and white and recirculate at the base of the flask. Once the perchloric fumes appear, heat sample 30 minutes to ensure nitric acid is completely gone.
4. Cool sample in fumehood until fuming ceases. Boiling to titration
1. Add 2.5 ml 1:9 HCl to all samples., standards and blanks; vortex. 2. Heat uncoverd samples in boiling water bath for 25 minutes. 3. Cool completely and add 100 ul of cresol red to each sample. 4. In fumehood, add ammonium hydroxide dropwise to yellow point. Rinse inside of
flask/tube with water. 5. Add 1:4 HCl dropwise to orange endpoint (pH 1.5)
127
DAN reaction
1. Add 5 ml DAN solution to each sample. 2. Cover sample tubes with plastic wrap and heat in 50C water bath for 25 minutes. 3. Remove from water bath and place in cool water bath. Cool completely. 4. Add 8 ml cyclohexane. 5. Tighly cap tubes and mix by slowly inverting covered racks for 1 minute. 6. Bring cyclohexane level up in the tubes by adding 0.1N HCl. 7. Using disposable tranfer pipet, transfer cyclohexane layer to borosilicate glass
tubes, 12 x 75 mm. Fluorometer
1. Install NB360 filter for excitation and NB520 fro emission wavelengths and aperture slides.
2. Adjust to zero using black rod. Adjust to zero each time aperture slides are changes.
3. Wipe each tube with Chemwipe. Read the standard curve, samples and blanks. Se determination Using regression procedures, generate the regression equation and calculate selenium concentration of samples.
128
APPENDIX 2: Protocol for Lipid Peroxidation of Liver Whole Cell Fractions
Using Ascorbic Acid Stimulation
Reference: modified from Noguchi T, Cantor AH, Scott ML. (1973). Mode of action of selenium and vitamin E in prevention of exudative diathesis in chicks. J Nutr. 103(10):1502-11
Principle:
Samples are incubated with ascorbic acid to stimulate lipid peroxidation, presence of glutathione peroxidase inhibit the formation of lipid peroxides. Oxidation is measured by the formation of thiobarbituric acid reactive substances i.e., malonaldehyde.
Apparatus:
Tekmar® Homogenizer Pipets Mistral® 2000, refrigerated centrifuge Pipette tips Water bath Filter paper # 541 Hot plate Culture tubes (12 x 75 mm) Beaker (4L) Volumetric flask (2L) Digital thermometer Wire baskets/ wire racks
Reagents:
0.025M Tris-HCl (157.6 g/mole) Weigh 7.88 g Tris-HCl and dissolve in 1700 ml deionized water. Adjust pH to 7.4. Transfer to 2 L volumetric flask and dilute to 2 L.
0.174M KCl (74.56 g/mole) Dissolve 12.97 g KCl in 1L 0.025M Tris-HCl buffer. Adjust pH to 7.4 0.67% Thiobarbituric acid (TBA)
Dissolve 0.67g TBA in 100 ml deionized water. Do not refrigerate. Store in amber bottle with stirring bar.
20% Trichloroacetic acid (TCA) Dissolve 20 g TCA in 100 ml deionized water 1.5mM ascorbic acid ( 176.13 g/mole)in Tris-KCL buffer Dissolve 0.0528 g ascorbic acid in 200 ml Tris-KCl buffer
129
Procedure:
Sample Preparation*
1. Homogenize 2g of tissue sample (liver, lung, heart, breast muscle) in 20ml 0.174M KCl in 0.025M Tris-HCl buffer (buffer pH7.4) using a Tekmar® homogenizer.
2. Centrifuge homogenate at 400 X g for 10 mins. (Mistral® 2000 refrigerated centrifuge)
3. Transfer supernatant into a new 20ml conical tube and discard the precipitate. Note: samples and reagent should be on ice while performing the assay
Lipid Peroxidation Stimulation Using Ascorbic Acid
1. For time 60 samples, mix 0.5ml of the whole cell fraction in 1ml of 1.5mM ascorbic acid solution in Tris-KCl buffer + 1.5ml Tris-KCl buffer (use a 12 x 75 mm borosilicate tube)
2. For time 0 samples, pipet 0.5ml of the whole cell fraction and add 1ml of 20% TCA, vortex. Then add 1ml of 1.5mM ascorbic acid solution in Tris-KCl buffer + 1.5ml Tris-KCl buffer
3. Incubate samples at 37C for 1 hour in a water bath. 4. Stop the reaction by adding 1ml of 20% (w/v) TCA in the time 60 samples.
TBA (thiobarbituric acid) Lipid Peroxide Formation Test
1. Filter samples using a whatman #541 filter paper (use the 16 X 125 mm borosilicate tubes)
2. Transfer 2 ml of filtrate in a fresh clean 16 X 125 mm tubes then add 1 ml of 0.67% TBA,
3. Boil samples (100C) for 35 mins. 4. Cool completely in water for 5 mins 5. Read absorption at 530 mu
130
APPENDIX 3: Antibody Response to Sheep Red Blood Cell (SRBC)
Reference:
Gore, A.B. and M. A. Qureshi 1997. Poult. Sci. 76:984-991. Yamamoto, Y., and B. Glick. 1982. Poult. Sci. 61:2129-2132. Grimes S.E. 2002. ISBN 974-7946-26-2.
Principle:
At 3 d of age, birds fro each treatment groups will be injected, intravenously with 1 ml of 7% SRBC, collect blood prior to inoculation. Blood collection will be at 7 and 14 d post primary injection. At 14 d post primary challenge, all birds will be challenged with a secondary SRBC injection; blood will be collection will be at 4 d post-challenge. Anti-SRBC injection titer will be calculated using micro hemagglutination and titers are expressed as log2 of the reciprocal of the highest dilution showing visible agglutination.
Washed Sheep Red Blood Cell (100%) 2-Mercaptoethanol (ME) To 0.7 ml ME, add 99.3 ml deionized water Sterile PBS Dissolve 2 PBS tablet in 250 ml deionized water.
Procedure:
Note: Heat inactivate samples at 56°C one day prior to analysis.
For Total plate (PBS)
1. Add 50 μl of PBS in the first row of the wells of the microtiter plate. 2. Add 50 μl of serum sample in each well with PBS. 3. Cover plates and incubate for 30 mins. at 37°C. 4. Remove plates from incubator and add 50 μl PBS in the remaining well. 5. Dilute samples, using multichannel pipetor, aspirate 50 μl from the first well and
transfer into the second well.
131
6. Mix 4-5x by pipetting up and down and then transfer 50 μl to the next well and do the same till the last well, discard the last 50 μl.
7. Add 50 μl of 2% SRBC to all the wells. 8. Cover and incubate for 30 mins at 37°C. 9. Read immediately.
For ME-titer (PBS/Mercaptoethanol)
1. Add 50 μl on 0.01 ml merccaptoethanol in PBS in the first row of the wells of the microtiter plate.
2. Add 50μl of serum sample in each well with ME/PBS. 3. Cover plate and and incubate for 30 mins. at 37°C. 4. Remove plates from incubator and add 50 μl PBS in the remaining well. 5. Dilute samples, using multichannel pipettor, aspirate 50 μl from the first well and
transfer into the second well. 6. Mix 4-5x by pipetting up and down and then transfer 50 μl to the next well and do
the same till the last well, discard the final 50 μl. 7. Add 50 μl of 2% SRBC to all the wells. 8. Cover and incubate for 30 mins at 37°C. 9. Read immediately.
Titers are read and recorded as ME-resistant (IgG). The ME-sensitive (IgM) is the difference between the PBS (Total) and ME-R readings. Total-ME-R=ME-S
Note: Photograph of positive and negative titer readings can be found at www. fao.org/docrep/005/ac802e/ac802e0a.html
132
APPENDIX 4: Blood Collection Through Venipuncture References: www. fao.org/docrep/005/ac802e/ac802e0a.html Principle:
1. To obtain serum which will be tested SRBC antibodies, no anticoagulant is required and the blood is allowed to clot. The levels of antibody detected in individual birds give an indication of the response to SRBC challenge.
Wing vein bleeding
Materials
• 2.5 mL syringes • 25 gauge needles for small chickens • 23 gauge needles for larger chickens • Cotton wool • 70 percent alcohol solution • Labels or marking pen to label each syringe
Method
1. Hold the chicken horizontally on its back. Hold the legs and place the other hand under the back to support the chicken. (Assistant)
2. Pull a wing of the chicken out towards you. (Bleeder)
3. Note the wing vein, clearly visible running between the biceps and the triceps muscles. The wing vein forms a V (bifurcates). Note the tendon of the pronator muscle that runs across the V.
4. Pluck away any small feathers that obscure the vein.
5. Disinfect the area around the bleeding site by swabbing with 70 percent alcohol.
6. Insert the needle under the tendon. Direct the needle into the wing vein in the direction of the flow of blood. Do not insert the needle too deeply. Keep clear of the ulnar nerve.
7. Once the tip of the needle is in the vein, gently pull the plunger of the syringe. Blood will flow into the syringe. If blood does not flow, release the plunger and make a very
133
slight adjustment to reposition the end of the needle.
8. Use a gentle suction to withdraw the blood to prevent the veins from collapsing.
9. After removing the needle, apply pressure to the vein for a few seconds to discourage further bleeding.
10. Transfer the collected blood into a vaccutainer and place it an angle in a rack facilitate clotting Note: Chicken wing vein collection photograph can be viewed at www. fao.org/docrep/005/ac802e/ac802e0b.jpg
Blood collection via the jugular vein
1. Hold the chicken horizontally on its back. Hold the legs and place the other hand under the back to support the chicken.(Assistant)
2. Stretch out the neck with one hand away from you, remove some feathers along the neck area. The jugular vein is now visible. (Bleeder)
3. Place the needle at an angle, bevel up, against the vein. 4. Insert the needle through the skin. Direct the needle into the jugular vein in
the direction of the flow of blood. Do not insert the needle too deeply. Keep clear of the trachea.
5. Puncture the vein and slowly withdraw blood. 6. Use a gentle suction to withdraw the blood to prevent the veins from
collapsing. 7. After removing the needle, apply pressure to the vein for a few seconds to
discourage further bleeding.
8. Transfer the collected blood into a vaccutainer and place it an angle in a rack facilitate clotting
134
REFERENCES
Adams, W. J., K. V. Brix, M. Edwards, L. M. Tear, D. K. DeForest, and A. Fairbrother. 2003. Analysis of field and laboratory data to derive selenium toxicity thresholds for birds. Environmental Toxicology and Chemistry 22:2020–2029.
Apsite, M., Pitrans, B., and Atlavin, A., 1994. Absorption of 75Se-Selenate and 75Se-
Selenite in chicks. In: Mengen- und Spurenelemente, Edited by Anke, M. and Meissener, D., Arbeitstagung, Jena. P. 188
Arthur, J. R., and G. J. Beckett. 1994. New metabolic roles for selenium. Proc Nutr Soc.
53:615- 624.
Arthur, J.R., R.C McKenzie and G.J. Beckett. 2003. Se in the immune system. J. Nutr. 133:1457S-1459S.
Beckett, G. J., S. E. Beddows, P. C. Morrice, F. Nicol and J. R. Arthur. 1987. Inhibition
of hepatic deiodination of thyroxine is caused by selenium deficiency in rats. Biochem J. 248:443-447.
Behne, D., H. Hilmert, S. Scheid, H. Gessner and W. Elger. 1988. Evidence for specific selenium target tissues and new biologically important selenoproteins. Biochem. Biophys. Acta. 966:12-21.
Beilstein, M. A., and P. D. Whanger. 1992. Selenium metabolism and glutathione
peroxidase activity in cultured human lymphoblasts. Effects of transsulfuration defects and pyridoxal phosphate. Biol Trace Elem Res. 35:105-118.
Bendich, A. 1987. Role of antioxidant vitamins on immune function. In "Proc. Roche
Technical Symposium: The Role of Vitamins on Animal Performance and Immune Response." RCD 7442. Hoffmann-La Roche Inc., Nutley, New Jersey.
Biswas, A., J. Mohan and K. V. H. Sastry. 2006. Effect of higher levels of dietary selenium on production performance and immune responses in growing Japanese quail. Brit Poult Sci. 47:511-515.
Blodgett, D.J. and R.F. Bevill. 1987. Acute selenium toxicosis in sheep. Vet. Human
Toxicol. 29:233-236. Bohn, H. L., B. L. McNeal, and G. A. O'Connor. 1985. Soil Chemistry. New York, John
Wiley & Sons. Brown JG, P.C. Bates, M.A. Holliday and D.J. Millward. 1981. Thyroid hormone and
muscle protein hypophysectomized rats. Biochem J. 194:771-782. Brown, K. M., and J. R. Arthur. 2001. Selenium, selenoproteins and human health: A
135
review. Public Health Nutr. 4:593-599.
Bruzual, J.J., S.D. Peak, J. Brake and E.D. Peebles. 2000. Effects of relative humidity
during incubation on hatchability and body weight of broiler chicks from young breeders flocks. Poult. Sci. 79: 827-830.
Buescher, R.G., M.C. Bell and R.K. Berry. 1960. Effect of Excessive Calcium on Selenium-75 in Swine. J An Sci. 19:1251-1252.
Cantor A.H. and J.Z. Tarino. 1982. Comparative effects of inorganic and organic dietary
sources of selenium on selenium levels and selenium-dependent glutathione peroxidase activity in blood of young turkeys. J. Nutr. 112:2187-2196.
Cantor A.H. and M.L. Scott. 1974. The effect of selenium in the hen’s diet on egg
production, hatchability, performance of progeny and selenium concentration in eggs. Poult. Sci. 53:1870-1880.
Cantor A.H., P.D. Moorhead, and M.A. Musser. 1982. Comparative effects of sodium
selenite and seleno-methionine upon nutritional muscular dystrophy, selenium-dependent glutathione peroxidase, and tissue selenium concentrations of turkey poults. Poult Sci. 61(3):478-484.
Cantor, A.H., M.L. Straw, M.J. Ford, A.J. Pescatore, and M. K. Dunlap. 2000. Effect of
feeding organic selenium in diets of laying hens on egg selenium content. Page 473 in: Egg Nutrition and Biotechnology. J. S. Sim, S. Nakai, and W. Guenter, ed. CABI Publishing, New York, NY.
Cantor, A. H., P.D. Moorhead, K. I. Brown. 1978. Influence of dietary selenium upon
reproductive performance of male and female breeder turkeys. Poult. Sci.57:1337-1345.
Cantor, A.H. 1997. The role of Se in poultry nutrition. In: Science and Technology in the
Feed Industry, Proceedings of Alltech’s 13th Annual Symposium (K.A. Jacques and T.P Lyons, eds). Nottingham University Press, UK, pp. 155-164.
Cantor, A.H., M.L. Scott and T. Noguchi. 1975a. Biological availability of Se in
foodstuffs and Se compounds for prevention of exudative diathesis in chicks. J. Nutr. 105:96-105.
Cantor, A.H., M.L. Langevin, T. Noguchi and M.L. Scott. 1975b. Efficacy of Se in Se
compounds and foodstuffs for prevention of pancreatic fibrosis in chicks. J. Nutr. 105:106-111.
Caravaggi, C., F.L. Clark and A.R.B. Jackson. 1970. Acute Selenium Toxicity in Lambs
Following Intramuscular Injection of Sodium Selenite. Res Vet Sci. 11:146-151.
136
Cary, E.E., W.H. Allaway and M. Miller. 1973. Utilization of different forms of dietary selenium. J. Anim. Sci. 36: 285-292.
Chen X.S., G.L. Yang, J.O. Chen, X.C., Chen, Z.M. Wen and K.Y. Ge. 1980 Studies on
the relations of selenium and Keshan disease. Biol. Trace Elem. Res. 2:91-107 (in English).
Cho, D.Y., U. Jung, and A.S. Chung. 1999. Induction of apoptosis by selenite and selenodiglutathione in HL-60 cells: correlation with cytotoxicity. Biochem Mol Biol Int. 47:781-793.
Colnago, G.L., L.S. Jensen and P.L. Long. 1984. Effect of selenium on peripheral blood
leucocytes of chickens infected with Eimeria. Poult. Sci. 63:896-903. Combs G.F. and G.M. Pesti. 1976. Influence of ascorbic acid on selenium nutrition in the
chick. J. Nutr. 106:958-96. Combs G.F. Jr. 1999. The Vitamins, Second Edition: Fundamental Aspects in Nutrition
and Health.
Combs, G. F. and S.B. Combs. 1984. The nutritional biochemistry of selenium. Annu. Rev. Nutr. 4:257-280.
Combs, G. F. Jr., M. L. Scott. 1977. Nutritional interrelationships of vitamin E and
selenium. Bio. Sci. 27:467-73. Combs, G.F. Jr. 1976. Differential effects of high dietary levels of vitamin A on the
vitamin E-selenium nutrition of young and adult chickens. J. Nutr. 106:967-75. Combs, G.F. Jr. 1994. Clinical implications of selenium and vitamin e in poultry nutrition.
Vet. Clin. Nutr. 1:133-140. Combs, G.F., and M.M. Hady. 1991. Selenium involved with vitamin E in preventing
encephalomalcia in the chick. FASEB J. 5:A714. Combs, Jr., G.F. and S.B. Combs. 1986. The Role of Selenium in Nutrition. Academic
Donaldson W.E. and C. McGowan.1989. Lead toxicity in chickens: interaction with toxic
dietary levels of selenium. Biol Trace Elem Res. 20:127-133.
137
Echevarria, M.G., P.R. Henry, C.B. Ammerman, P.V. Roa and R.D. Miles. 1988a. Estimation of the relative bioavailability of inorganic selenium sources for poultry. 1. Effect of time and high dietary selenium on tissue selenium uptake. Poult. Sci. 67:1295-1301.
Estimation of the relative bioavailability of inorganic selenium sources for poultry. 2. Tissue uptake of selenium from high dietary selenium concentrations. Poult. Sci. 67:1585-1592.
Edens, F.W. 1996. Organic Se: From feathers to muscle integrity to drip loss. Five years
onward: No more selenite! In: Biotechnology in the Feed Industry, Proceedings of Alltech’s 12th Annual Symposium (K.A. Jacques and T.P Lyons, eds). Nottingham University Press, UK, pp. 165-185.
Edens, F.W. 2001. Involvement of Sel-Plex in physiological stability and performance of
broiler chickens. In: Science and Technology in the Feed Industry, Proceedings of Alltech’s 17th Annual Symposium (K.A. Jacques and T.P Lyons, eds). Nottingham University Press, UK, pp. 349-376.
Edens, F.W. 2002. Practical Applications for Selenomethionine: Broiler Breeder
Reproduction. In: Nutritional Biotechnology in the Feed and Food Industry, Proceedings of Alltech’s 18th Annual Symposium (K.A. Jacques and T.P Lyons, eds). Nottingham University Press, UK, pp. 29-42.
Edens, F.W. and A.E. Sefton. 2002. Selenomethionine supplementation to diets of broiler
breeders improves performance. Poult. Sci. 80(Suppl.1): 91. Edens, F.W., C.R. Parkhurst and A.E. Sefton. 2002. Selenomethionine from selenized
Fairbrother, A., K.V. Brix, D.K. DeForest, and W.J. Adams. 2000. Egg selenium thresholds for birds: a response to J. Skorupa's critique of Fairbrother et al 1999. Human and Ecological Risk Assessment 6:203-212.
Fairweather-Tait, S.J., R. Collings and R. Hurst. 2010. Selenium bioavailability: current
knowledge and future research requirements. Am J Clin Nutr. 91:1484S-1491S. Fasenko, G.M., R.T. Hardin and F.E. Robinson. 1992. Relationship of hen age and egg
sequence position with fertility, hatchability, viability and pre-incubation embryonic development in broiler breeders. Poult. Sci. 71: 1374-1383.
FDA. 1974. Food additives: Selenium in animal feed. Federal Register 39:1355 (Jan. 8).
138
FDA. 1981. Food additives permitted in feed and drinking water of animals: Selenium. Final Rule. Federal Register 46:43415 (August 28).
FDA. 2000. Food additive permitted in feed and drinking water: Selenium yeast. Federal
Register 65(109): 35823-35824 (June 6). FDA. 2002. Food additive permitted in feed and drinking water of animals: Selenium
yeast. Federal Register 67(137): 46850-46851 (July 17). Ferm, V.H., D.P. Hanlon, C.C. Willhite, W.N. Choy, and S.A. Book. 1990.
Embryotoxicity and dose-response relationship of selenium in hamster. Reprod. Toxicol. 4: 183-190.
Fessler A.J., G. Moller , P.A. Talcott and Exon J.H. 2003, Selenium toxicity in sheep
grazing reclaimed phosphate mining sites. Vet Hum Toxicol. 45:294-298.
Flohé, L., W.A. Gunzler and H.H. Schock. 1973. Glutathione peroxidase. A selenoenzyme. FEBS Lett. 32:132-134.
Foye, O.T., P.R. Ferket and Z. Uni. 2007. The effects of in ovo feeding arginine, beta-
hydroxy-beta-methyl-butyrate, and protein on jejunal digestive and absorptive activity in embryonic and neonatal turkey poults. Poult Sci. 86:2343-9.
Franke, K.W., A.L. Moxon, W.E. Poley and W.C. Tully. 1936. Monstrosities produced
by the injection of selenium salts into hens' eggs. Anat. Record. 65:15–22. Franke, K.W. and W.C. Tully. 1936. A new toxicant occurring naturally in certain
samples of plant foodstuffs. VII. Low hatchability due to deformities in chicks produced from eggs obtained from chickens of known history. Poult Sci. 15: 316-318.
Franke, K.W. and W.C. Tully. 1935. A new toxicant occurring naturally in certain
samples of plant foodstuffs. V. Low hatchability due to deformities in chicks. Poult Sci. 14: 273.
Franke, K.W., and V.R. Potter. 1934. A new toxicant occurring naturally in certain
samples of plant foodstuffs. III Hemoglobin levels observed in white rats which were fed toxic wheat. J. Nutr. 8: 615-624.
Freeman, B.M. and M.A. Vince. 1974. Development of the avian embryo. John Wiley &
Sons, New York, NY. Gaál, T., M. Mézes, R.C. Noble, J. Dixon and B.K. Speake. 1995. Development of
antioxidant capacity in tissues of the chick embryo. Comparative Biochemistry and Physiology Part B: Biochem. Mol. Biol. 112(4): 711-716.
139
Gabbedy, B. J. 1970. Toxicity in sheep associated with the prophylactic use of selenium. Aust. Vet. J. 46:223-226.
Gabbedy, B.J. and J. Dickson. 1969. Acute selenium poisoning in lambs. Aust. Vet. J. 45:470-472.
Ganther, H.E. 1968. Selenotrisulfides Formation by Reaction of Thiols with Selenious Acid. Biochem. 7: 2898-2905.
Gissel-Nielsen G. 1976. Selenium in soils and plants. In: Proceedings of the symposium on Se-Te in the environment, Pittsburg, PA, Industrial Health Foundation, pp. 10-25.
Goehring, T.B., I.S. Palmer, O.E. Olson, G.W. Libal and R.C. Wahlstrom. 1984. Toxic effects of selenium on growing swine fed corn-soybean meal diets. J Anim Sci. 59:733-7.
Golubkina, N.A. and T.T. Papazyan. 2006. Selenium distribution in eggs of avian species. Comp Biochem Physiol B: Biochem Mol Biol.145:384-88.
Gore, A.B. and M.A. Qureshi. 1997. Enhancement of humoral and cellular immunity by
vitamin e after embryonic exposure. Poult. Sci. 76:984-991. Gowdy, K.M. 2004. Selenium Supplementation and Antioxidant Protection in Broiler
Chickens. Thesis. Gowdy, K.M. and F.W. Edens. 2003. Organic selenium affects broiler responses to
immunostimulation. Poult. Sci. 82(Suppl. 1): 10. Grasman, K.A. 2009. Immunotoxicity Testing: Methods and Protocols In: Methods in
Molecular Biology, R.R. Dietert (ed.). 598: 387-398. Gries CL and M.L. Scott. 1972. Pathology of selenium deficiency in the chick. J. Nutr.
102(10):1287-1296. Gruenwald, P. 1958. Malformations caused by necrosis in the embryo. Illustrated by the
effect of selenium compounds in chick embryos. Am J Pathol. 34 (1): 77–103.
Hale, F. 1937. The relation of maternal vitamin A deficiency to microphthalmia in pigs. Tx State. J. Med. 33: 228-232.
Halliwell, B. 1994. Free radicals and antioxidants: A personal view. Nutr. Rev. 52 (8):
253-265.
140
Halverson A.W., L.G. Jerde and C.L. Hills. 1965. Toxicity of inorganic salts to chick embryos. Toxicol. Appl. Pharmacol. 7:675-679.
Halverson AW, and K.J. Monty. 1960, An effect of dietary sulfate on selenium poisoning
in the rat. J. Nutr. 70:100-102. Halverson AW, P.L. Guss, and O.E. Olson. 1962. Effect of sulfur salts on selenium
poisoning in the rat. J. Nutr. 77:459-464. Harrison, L.H., B.M. Colvin, B.P. Stuart, L.T. Sangster, E.J. Gorgacz and H.S. Gosser.
1983. Paralysis in swine due to focal symmetrical poliomalacia: possible selenium toxicosis. Vet Pathol. 20:265-73.
Hassan, S. 1986. Effect of dietary selenium on the prevention of exudative diathesis in chicks, with special reference to selenium transfer via the egg. J. Vet. Med. A 33: 689-697.
Heinz G.H. and D.J. Hoffman. 1996. Comparison of the effects of seleno-L-methionine,
seleno- DL-methionine, and selenized yeast on reproduction of mallards. Environ. Pollut. 91(2):169-75.
Heinz, G.H., D.J. Hoffman, and L.G. Gold. 1989. Impaired reproduction of mallards fed
an organic form of selenium. J. Wildlife Manage. 53:418-428. Henry, P.R. and C.B. Ammerman. 1995. Selenium bio-availability. In: Bio-availability of
Nutrients for Animals: Amino Acids, Minerals, and Vitamins, Edited by: Ammerman, C.B., Baker, D.H., Lewis, A.J., Academic Press, San Diego, California, pp 303-36.
Herigstad, R.R., C.K. Whitechair and O.E. Olson. 1973. Inorganic and organic selenium
toxicosis in young swine: comparison of pathologic changes with those in seine with vitamin E-selenium deficiency. Am J Vet Res. 34:1227-1238.
Hoffman, D.J. and G.H. Heinz. 1988. Embryotoxic and teratogenic effects of selenium in the diet of mallards. J Toxicol Environ health. 24:477-490.
Hoffman, D.J., Ohlendorf, H.M. and T.W. Aldrich. 1988. Selenium teratogenesis in natural populations of aquatic birds in Central California. Arch. Environ. Contam. Toxicol. 17:519-525.
Hulet, R., G. Gladys, D. Hill, R. Meijerhof and T. El-Shiekh. 2007. Influence of Egg
Shell Embryonic Incubation Temperature and Broiler Breeder Flock Age on Posthatch Growth Performance and Carcass Characteristics Poult. Sci. 86:408-412.
Ip, C. 1998. Lessons from basic research in selenium and cancer prevention. J Nutr.
128:1845-1854.
141
Jacques, K.A. 2001. Selenium metabolism in animals: the relationship between dietary
selenium form and physiological function. In: Science and Technology in the Feed Industry, Proceedings of Alltech’s 17th Annual Symposium (K.A. Jacques and T.P Lyons, eds). Nottingham University Press, UK, pp. 319-348.
Janeway, C., P. Travers, M. Walport and M.Shlomchik. 2001. Janeway's Immunobiology.
4th ed. Garland Science. Taylor and Francis Publishing,NY. Jensen, L. S. 1975. Modification of a selenium toxicity in chicks by dietary silver and
copper. J. Nutr. 105:769-75. Jensen, L.S., and C.H. Chang. 1976. Fractionation studies on a factor in linseed meal
protecting against selenosis in chicks. Poult Sci. 55: 594-599.
Jianhua, H., A. Ohtsuka and K. Hayashi. 2000. Selenium influences growth via thyroid hormone status in broiler chickens. Brit. J. Nutr. 84:727- 732.
Johnson, C.M., C.J. Asher, and T.C. Broyer. 1967. Distribution of selenium in plants, p.
57-75. In: O.H. Muth, J.E. Oldfield, and P.H. Weswig (eds.). Selenium in biomedicine. AVI Publ., rights now owned by Van Nostrand Reinhold, 115 Fifth Ave., New York, N.Y. 10003.
Johnston, P. A., H. Liu, T. O'Connell, P. Phelps, M. Bland, J. Tyczkowski, A. Kemper, T.
Harding, A. Avakian, E. Haddad, C. Whitfill, R. Gildersleeve, and C. A. Ricks. 1997. Applications in ovo technology. Poult Sci 76:165-178
Kaur, R., S. Sharma and S. Rampal. 2003. Effect of sub-chronic selenium toxicosis on
lipid peroxidation, glutathione redox cycle and antioxidant enzymes in calves. Vet Human Toxicol. 45:190-192.
Kelly, M.P. and R.F. Power. 1995. Fractionation and identification of the major Se compounds in selenized yeast. J. Dairy Sci. 78(Suppl. 1):237.
Kiremidjian-Schumacher, L. and M. Roy. 1998. Selenium and immune function.
Zeitschrift Fur Ernahrungswissenschaft. 37:50-56. Kiremidjian-Schumacher, L., M. Roy, H. I. Wishe, M. W. Cohen and G. Stotzky. 1992.
Regulation of cellular immune responses by selenium. Biol Trace Elem Res. 33:23-35.
Kirk, S., G. C. Emmans, G.C., R. Mcdonald, R. and D. Arnot. 1980. Factors affecting the
hatchability of eggs from broiler breeders. Brit. Poultry Sci. 21: 37-53.
Kitahara J., Y. Seko Y, N. Imura.1993. Possible involvement of active oxygen species in selenite toxicity in isolated rat hepatocytes. Arch Toxicol. 67:497–501.
142
Kohrle, J., F. Jakob, B. Contempre and J. E. Dumont. 2005. Selenium, the thyroid, and the endocrine system. Endoc Rev. 26:944-984.
Kubota, J., W.H. Allaway, D.L. Carter, E. E. Cary and V.A. Lazar. 1967. Se in Crops in United States in Relation to Se-Responsive Diseases of Animals. J. Agr Food Chem. 15:448-453.
Kury G, L.H. Rev.-Kury, and R.J. Crosby. 1967. The effect of selenous acid on the
hematopoietic system of chicken embryos. Toxicol. Appl. Pharmacol. 11(3):449-458.
Lambourne D.A. and R.W. Mason. 1969. Mortality in lambs following overdosing with sodium selenite. Aust Vet. J. 45:208.
Larsen, C.T., F.W. Pierson and W.B. Gross. 1997. Effect of dietary selenium on the response of stressed and unstressed chickens to Escherichia coli challenge and antigen. Biol Trace Elem. Res. 58:169-176.
Latshaw, J.D., and M. Osman. 1975. Distribution of selenium in egg white and yolk after
feeding natural and synthetic selenium compounds. Poult Sci 54:1244-1252. Latshaw, J.D. and M. Osman. 1974. A selenium and vitamin E responsive condition in
the laying hens. Poult. Sci. 53:1704-08. Latshaw, J.D., J.F. Ort, and C.D. Diesem. 1977. The selenium requirements of the hen
and effects of a deficiency. Poult Sci. 56:1876-1881. Latshaw, J.D. and M. Osman. 1974. A selenium and vitamin E responsive condition in
the laying hens. Poult. Sci. 53:1704-1708. Leblondel, G., Y. Mauras, A. Cailleux and P. Allain. 2001. Transport measurements
across Caco-2 monolayers of different organic and inorganic selenium: influence of sulfur compounds. Biol Trace Elem Res. 83:191-206.
Leeson, S. and J.D. Summers. 1991. Commercial Poultry Nutrition. University Books, Guelph, Ontario, Canada.
Leeson, S. H., Namkung, L. Caston, S. Durosoy and P. Schleg. 2008. Comparison of
Selenium Levels and Sources and Dietary Fat Quality in Diets for Broiler Breeders and Layer Hens Poult. Sci. 87:2605-2611.
Leng L., R. Bobcek, S. Kuricova, K. Boldizarova, L. Gresakova, Z. Sevcikova, V. Revajova, M. Levkutova and M. Levkut. 2003. Comparative metabolic and immune responses of chickens fed diets containing inorganic selenium and Sel-Plex® organic selenium. In: Nutritional Biotechnology in the Feed and Food Industry, Proceedings of the 19th Alltech Annual Symposium, Ed. Lyons TP and KA Jacques. Nottingham University Press, Nottingham UK. Pp. 131-145.
143
Levkut, M., V. Revajova, M. Levkutova, Z. Sevcikova, R. Herich, R. Borutova & L. Leng. 2009. Leukocytic responses of broilers following dietary contamination with deoxynivalenol and/or treatment by dietary selenium supplementation. Brit Poultry Sci. 50: 181-187.
Li G., F. Wang, D. Kang, C. Li. 1985. Keshan disease: An endemic cardiomyopathy in
China. Human Pathol. 16(6): 602-609. Lowry, K.R. and D.H. Baker. 1989. Amelioration of selenium toxicity by arsenicals and
cysteine. J. Anim. Sci. 67:959-965.
Macalintal, L.M., A.H. Cantor, A.J. Pescatore, M.J. Ford, H.D. Gillespie, J.L. Pierce, K.A. Dawson and R.F. Power. 2010a. Effect of in ovo selenium injection on chick embryo viability and tissue selenium levels. Poultry Science 89 (E-suppl. 1): 543. Abstract.
Gillespie and A.N. Meredith. 2010b. Toxicity and tissue selenium levels of chicken embryos resulting from in ovo selenium injection. Poultry Science 90 (Suppl.): SPSS Abstract.
Mahan, D and N.A. Parrett. 1996. Evaluating the efficacy of selenium-enriched yeast and
sodium selenite on tissue selenium retention and serum glutathione peroxidase activity in grower and finisher swine. J. Anim. Sci. 74:2967-2974.
Mahan, D.C. 1994. Organic selenium sources for swine. How do they compare with inorganic selenium sources? In: Biotechnology in the Feed Industry, Proceedings of Alltech’s 10th Annual Symposium (T.P. Lyons and K.A. Jacques, eds). Nottingham University Press, UK, pp. 323-333.
Marsh J.A., R.R. Dietert and G.F. Combs. 1981. Influence of dietary selenium and
vitamin E on the hummoral immune response of the chick. Proc. Soc. Exp. Biol. Med.166:228-236.
Marsh, J.A., G.F. Combs, M.E Whitacre and R.R. Dietert. 1986. Effect of selenium and
vitamin E dietary deficiencies on chick lymphoid organ development. Proc. Soc. Exp. Biol. Med.182:425-436.
Matte, J.J. 2007. Selenium metabolism, glutathione peroxidase system and their
interaction with B vitamins in pigs. 2007. In: Biotechnology in the Feed Industry, Proceedings of Alltech’s 23rd Annual Symposium (T.P. Lyons and K.A. Jacques, eds). Nottingham University Press, UK, pp.87-96.
Mauldin, J.M. 1989. An analysis of reproductive efficiency in Georgia hatcheries.
Proceedings from 22nd World’s Poultry Science Association Symposium on Avian Embryology and Incubation, Scotland, p.319.
144
McConnell, K.P. and G. Cho. 1965. Transmucosal movement of selenium. Am. J. Physiol. 208:1191-1195.
McConnell, K.P. and R.S. Levy. 1962. Presence of selenium-75 in lipoproteins. Nature.
McKenzie, R.C., J.R. Arthur and G.J. Beckett. 2002. Selenium and the regulation of cell signaling, growth and survival; Molecular and Mechanistic aspects. Antioxid. Redox Signal. 4: 339-351.
McNabb, F.M.A. 2000. Thyroids. Pages 461–471 in Sturkie’s Avian Physiology. G. Whittow, ed. Academic Press, New York, NY.
Mezes, M. and K. Balogh. 2007. Prooxidant mechanisms of selenium toxicity – a review.
Acta Biol. Szeged. 3(1):15-17.
Mills, G.C., and H.P. Randall. 1958. Hemoglobin catabolism. II. The protection of hemoglobin from oxidative breakdown in the intact erythrocyte. J. Biol. Chem. 232; 589-598.
Mills, G.C. 1957. Hemoglobin catabolism. I. Glutathione peroxidase, an erythrocyte
enzyme which protects hemoglobin from oxidative breakdown. J Biol Chem. Mitchell, A.D., and N.J. Benevenga. 1978. The role of transamination in methionine
oxidation in the rat. J. Nutr. 108:67-78. Moak MA, M.J. Christensen. 2001. Promotion of lipid oxidation by selenate and selenite
and indicators of lipid peroxidation in the rat. Biol Trace Elem Res. 79:257-269. Moran, E.T., Jr. 2007. Nutrition of the developing embryo and hatchling. Poult Sci.
86:1043-1049
Mori M, M. Yamashita, M. Yoshikuni, S. Fukada, Y. Nagahama. 1991. Maturation-promoting factor and p34cdc2 kinase during oocyte maturation of the Japanese quail. Dev Biol. 146(1):246-9.
Moxon, A.L. 1937. Alkali disease or selenium poisoning. S. Dak. Agric. Exp. Sta. Tech. Bull. No. 311:91.
Muth, O.H., J.E. Oldfield, L.F. Remmert and J.R. 1958. Effects of selenium and vitamin
e on white muscle disease. Science.128(3331):1090. Mykkanen, H.M. and R. H. Wasserman. 1989. Uptake of 75Se-selenite by brush border
membrane vesicles from chick duodenum stimulated by vitamin D. J. Nutr. 119:242-247.
Nakamuro, K., T. Okuno and T. Hasegawa. 2000. Metabolism of selenoamino acids and
contribution of selenium methylation to their toxicity. J Health Sci. 46: 418-421. Nickel, A., G. Kottra, D. Schmidt, J. Danier, T. Hofmann, and H. Daniel. 2008.
Characteristics of transport of selenoamino acids by epithelial amino acid transporters. Chem. Biol. Interact. 177:234-41.
Noble, R. C. and M. Cocchi. 1990. Lipid metabolism and the neonatal chicken. Prog
Lipid Res. 29:107-140.
Noble, R.C., F. Lonsdale, K. Conner and D. Brown. 1986. Changes in the lipid metabolism of the chicks with parental age. Poult. Sci. 65: 409–416.
Noble, R.C. 1986. Lipid metabolism in the chick embryo, Proc. Nutr. Soc. 45:17–25. Noguchi, T., A.H. Cantor and M.L. Scott. 1973. Mode of action of selenium and vitamin
E in prevention of exudative diathesis in chicks. J. Nutr. 103:15021511. NRC (National Research Council), 1983. Selenium in nutrition. Rev. ed. Subcommittee
on Selenium. National Academy Press. Washington, DC. Nutrient Research Council.1994. Nutrient Requirement of Poultry: 9th rev. ed. National
Academy Press, Washington, DC. O’brien, P.J. and C. Little. 1969. Intracellular mechanisms for the decomposition of lipid
peroxide. II. Decomposition of lipid peroxide by fractions. Can. J. Biochem. 47:485-491.
O’Sullivan, N.P., E.A. Dunnington, and P.B. Siegel. 1991. Relationships among age of
dam, egg components, embryo lipid transfer and hatchability of broiler breeder eggs. Poult. Sci. 70: 2180-2185.
Ohta, Y., N. Tsushima, K. Koide, M.T. Kidd and T. Ishibashi. 1999. Affect of amino acid injection on broiler breeder eggs on embryo growth and hatchability of chicks. Poult. Sci. 78:1493-1498.
Olson O.A., and I.S. Palmer. 1976. Selenoamino acids in tissues of rats administered
inorganic selenium. Metabolism. 25:299-306. Olson, O.E., I.S. Palmer and E.E. Cary. 1975. Modifications of the official fluorometric
method for selenium in plants. J. Assoc. Off. Anal Chem. 58:117-121. Omaye, S.T. and A.L. Tappel. 1974. Effect of dietary selenium on glutathione peroxidase
in the chick. J. Nutr. 104: 747-753. Ort, J.F. and J.D. Latshaw. 1978. The toxic level of sodium selenite in the laying diet. J.
Nutr. 108:114-1120. Padmaja, K., B.V. Somasekharaiah and A. R. Prasad. 1997. Inhibition of lipid
peroxidation by selenium in chick embryos. Drug Chem Toxicol. 20:79-98. Painter, E.P. 1941. The chemistry and toxicity of selenium compounds, with special
reference to the selenium problem. Chem Rev. 28:179-213.
Palmer, I.S., R.L. Arnold and C.W. Carlson. 1973. Toxicity of various selenium derivatives to chick embryos. Poult Sci. 52:1841-1846.
Pan, C., K. Huang, Y. Zhao, S. Qin, F. Chen and Q. Hu. 2007. Effect of selenium source
and level in hen's diet on tissue selenium deposition and egg selenium concentrations. J Agr Food Chem. 55:1027-1032.
Panda, S.K. and A.T. Rao. 1994. Effect of vitamin E and selenium combination of
chicken infected with infectious bursal disease virus. Veterinary Record, 134:242-243.
Panter, KE, W.J. Hartley, L.F.James. 1996. Comparative toxicity of selenium from
seleno-DL-methionine, sodium selenate, and Astragalus bisulcatus in pigs. Fundam Appl Toxicol. 32: 217-223.
Pappas, A.C., F. Karadas, P.F. Surai and B.K. Speake. 2005. The selenium intake of the
female chicken influences the selenium status of her progeny. Comp Biochem Physiol B: Biochem Mol Biol. 142:465-474.
Pappas, A.C., T. Acamovic, P.F. Surai and R.M. McDevitt. 2006. Maternal organo-Se
compounds and polyunsaturated fatty acids affect progeny performance and levels of Se and docosahexaenoic acid in the chick tissues. Poult Sci. 85:1610-1620.
147
Paton, N.D., A.H. Cantor, A.J. Pescatore, M.J. Ford and C.A. Smith. 2002. The effect of dietary selenium source and level on the uptake of selenium by developing chick embryos. Poult Sci. 81: 1548-1554.
Patterson, E.L., R. Milstrey and E.L.R. Stokstad. 1957. Effect of selenium in preventing
exudative diathesis in chicks. Proc. Soc. Exp. Biol. Med. 95:617. Patterson, O.A. Levander, C. Veillon, P.R. Taylor, K. Helzlsouer, P.A. McAdam and L.A.
Zech. 1991. Human [74Se] selenomethionine metabolism: kinetic model. Am. J. Clin. Nutr. 54: 917-926.
Payne R.L. and L.L. Southern. 2005a. Changes in glutathione peroxidase and tissue
selenium concentrations of broilers after consuming a diet adequate in selenium. Poult. Sci. 84(8):1268-1276.
Payne, R.L. and L.L. Southern. 2005b. Comparison of inorganic and organic selenium
sources for broilers. Poult Sci. 84:898-902. Peng, X., H. Cui, J. Deng, Z. Zuo and W. Cui. 2011. Low Dietary Selenium Induce
Increased Apoptotic Thymic Cells and Alter Peripheral Blood T Cell Subsets in Chicken . Biol. Trace Elem. Res. 142:167-173.
Peng, X., Y. Cui, W. Cui, J. Deng, H. Cui and F. Yang. 2011. The Cell Cycle Arrest and
Apoptosis of Bursa of Fabricius Induced by Low Selenium in Chickens. Biol. Trace Elem. Res. 139:32-40.
Peterson, P.J. and G.W. Butler. 1967. Significance of selenocystathionine in an
Australian selenium-accumulating plant Neptunia amplexicaulis. Nature. 213:599-600.
P.D.Gerard. 2010. Pipping muscle and liver metabolic profile changes and relationships in broiler embryos on days 15 and 19 of incubation. Poult Sci 89(5): 860-865.
Radcliffe, J.S., B.E. Aldridge and K.L. Saddoris. 2007. In: Biotechnology in the Feed
Industry, Proceedings of Alltech’s 23rd Annual Symposium (T.P. Lyons and K.A. Jacques, eds). Nottingham University Press, UK, pp. 103-108.
Raharjo, S. and J.N. Sofos. 1993. Methodology for measuring malonaldehyde as a
product of lipid peroxidation in muscle tissues: A review. Meat Sci. 35:145-69. Ralston, N.V.C., J. Unrine, and D. Wallschlager. 2008. Biogeochemistry and Analysis of
Selenium and its Species. www.namc.org/docs/00043673.PDF.
148
Raza, F.K., S.A. Khan, A. Raza, M.A. Saeed and I.N. Bashir. 1997. Effect of vitamin E deficiency and excess on immune system of broiler chickens. Intl. J. Anim. Sci. 12:39-41.
Ridgway L.P. and D.A. Karnofsky. 1952. The effects of metals on the chick embryo:
toxicity and production of abnormalities in development. Ann. N. Y. Acad. Sci. 8:55(2):203-215.
Romanoff, A.L., and A.V. Romanoff. 1963. The avian egg. John Wiley & Sons, New
York, NY.
Romanoff, A.L. 1960. The avian embryo. The Macmillan Company, New York, NY.
Rosenfeld, I. 1947. Congenital malformations of eyes of sheep. J. Agric. Res. 75: 93-103. Rotruck, J.T., A.L. Pope, H.E. Ganther, A.B. Swanson, D.G. Hafeman and W.G.
Hoekstra. 1973. Selenium biochemical role as a component of glutathione peroxidase. Science. 179:588-590.
SAS Institute Inc. 2001. The SAS system for windows. Release 8.2. SAS Institute Inc.
Cary, NC. Schamberger, TJ. 1983. Metabolism of selenium. In Biochemistry of Selenium (ed. E.
Frieden) Vol. 2. Pp. 59-75. Plenum, NY/London. Schrauzer, G.N. 2000. Selenomethionine: A Review of Its Nutritional Significance,
Metabolism and Toxicity. J. Nutr. 130:1653-1656. Schubert, J.R., O.H. Muth, J.E. Oldfield and L.F. Remmert. 1961. Experimental results
with selenium in white muscle disease of lambs and calves. Fed Proc. 20:689.
Schwarz, K. 1954. Influence of food supply and fat intake on dietary necrotic liver degeneration. Fed. Proc., Fed. Amer. Soc. Exp. Biol. 13:477 (abstr).
Schwarz, K. and C.M. Foltz. 1957. Selenium as an integral part of factor 3 against dietary
necrotic liver degeneration. J. Am. Chem. Soc. 79:3292- 3293. Schwarz, K., J.G. Bieri, G.M. Briggs and M.L. Scott. 1957. Prevention of exudative
diathesis in chicks by Factor 3 and selenium. Proc. Soc. Exp. Biol. Med. 95:621-625.
Scott M.L., G. Olson, L. Krook and W.R. Brown. 1967. Selenium-responsive myopathies
of myocardium of smooth muscle in the young poult. J Nutr. 91(4):573-583.
Scott M.L. and J.N. Thompsom. 1971. Selenium content of feedstuffs and effects of dietary selenium levels upon tissue selenium in chicks and poults. Poult Sci 50(6): 1742-1748.
149
Scott, M.L., J.G. Bieri, G.M. Briggs and K. Schwarz. 1957. Prevention of exudative diathesis by factor 3 in chicks on vitamin E-deficient torula yeast diets. Poult. Sci. 36: 1155.
Seko, Y., Y. Saitoh and N. Imura. 1989. Active Oxygen Generation by the Reaction of Selenite with Reduced Glutathione In vitro. J Pharm Sci. 76:S135-S35.
Shamberger, R.J. 1983. Selenium deficiency diseases in animals. In: Biochemistry of
Selenium. Plenum Press, New York, NY 10013, pp. 31-58. Shanawany, M. 1984. Inter-relationship between egg weight, parental age and embryonic
development. Br. Poult. Sci., 255: 449-455.
Sharma, J.M., and B.R. Burmester. 1984. Disease control in avian species by embryonal vaccination. U.S. Patent no. 4,458,630.
Shennan, D.B. 1988. Selenium (selenate) transport by human placental brush border membrane vesicles. Brit J. Nutr. 59:13-19.
Singh, H., S. Sodhi and R. Kaur. 2006. Effects of dietary supplements of selenium,
vitamin E or combinations of the two on antibody responses of broilers. Brit Poult Sci. 47:714 -719.
Reproduction in black-crowned night-herons fed selenium. Lake Reservoir Manage. 4:175-180.
Smith, T.W. 2007. Avian embryo: stages of embryonic development in Book Avian
embryo: stages of embryonic development. Mississippi State University, City.
Spallholz J.E. 1994. On the nature of selenium toxicity and carcinostatic activity. Free Radic Biol Med. 17:45-64.
Spallholz, J.E., L.M. Boylan, and H.S. Larsen. 1990. Advances in understanding
selenium's role in the immune system. Ann N Y Acad Sci 587:123-139. Spallholz, J.E., J.L. Martin, M.L. Gerlach and R.H. Heinzerling. 1973. Enhanced
immunoglobulin M and immunoglobulin G antibody titers inmice fed selenium. Infect Immunity. 8:841-842.
Speake, B.K., R.C. Noble and A.M.B. Murray.1998. The utilization of yolk lipids by the
chick embryo. World's Poult Sci J. 54:319-334. Srivastava, S. K., and E. Beutler. 1970. Glutathione metabolism of the erythrocyte: The
enzymic cleavage of glutathione haemoglobin preparations by glutathione reductase. Biochem. J. 119; 353.
Starss, A.P., S. Orgeig, C.B. Daniels, M. Davies and O. V. Lopatko. 2001. Antioxidant
150
enzymes in the developing lungs of egg-laying and metamorphosing vertebrates Statistix. 2008. Release 9.0. Analytical Software. Talahassee, FL. Stepinska, U. and M.R. Bakst. 2006. Fertilization. In Jamieson, B.G.M. (ed.)
Reproductive Biology and Phylogeny of Aves: 533–587. Enfield, New Hampshire, USA & Plymouth UK: Science Publishers Inc.
Stewart M.S., J.E. Spallholz, K.H. Neldner and B.C. Pence. 1999. Selenium compounds have disparate abilities to impose oxidative stress and induce apoptosis. Free Radic Biol Med. 26:42-48.
Sukra Y, S. Sastrohadinoto, I.T. Budiarso. 1976. Effect of selenium and mercury on
gross morphology and histopathology of chick embryos. Poult. Sci.55(6): 2424-2433.
Evenson. 1997. Selenium regulation of selenium-dependent glutathione peroxidases in animals and transfected CHO cells. BES. 10:346-355.
Surai, P.F. 1999. Tissue-specific changes in the activities of antioxidant enzymes during the development of the chicken embryo. Br. Poultry Sci. 40(3): 397-405.
Surai, P.F. 2000. Effect of Se and vitamin E content of the maternal diet on the
antioxidant system of the yolk and the developing chick. Br. Poultry Sci. 41: 235–243.
Surai, P.F., F. Karadas, A.C. Pappas and N.H. Sparks. 2006. Effect of organic selenium in quail diet on its accumulation in tissues and transfer to the progeny. Brit Poult Sci. 47: 65-72.
Surai, P.F., F. Karadas, A.C. Pappas and J.E. Dvorska. 2004. Selenium distribution in
eggs of ISA Brown commercial layers. In: Nutritional Biotechnology in the Feed and Food Industries, Proceedings of Alltech’s 20th Annual Symposium (T.P. Lyons and K.A. Jacques, eds). Nottingham University Press, UK, pp. 17 Suppl.1.
Surai, P.F., R.C. Noble and B.K. Speake.1996. Tissue –specific differences in antioxidant
distribution and susceptibility to lipid peroxidation during development of the chick embryo. Biochim Biophysica Acta. 1304: 1-10.
Surai, P.F. 1999. Tissue-specific changes in the activities of antioxidant enzymes during the development of the chicken embryo. Br Poult Sci. 40:397-405.
Surai, P.F. 2003.Natural antioxidants in avian nutrition and reproduction. Nottingham
University Press, Nottingham UK. Surai, P.F. 2006. Selenium in Nutrition and Health. Nottingham University Press,
Nottingham UK.
151
Surai, P.F., B. K. Speake, R. C. Noble, and N. H. C. Sparks. 1997. Antioxidant systems
of the developing chick embryo; glutathione peroxidase. B. Poult. Sci. 38 (Suppl.): S19-S20.
Swain, B.K., T.S. Johri and S. Majumdar. 2000. Effect of supplementation of vitamin E,
selenium and their different combinations on the performance and immune response of broilers. Brit Poultry Sci. 41:287-92.
Swanson, C.A. Patterson, O.A. Levander, C. Veillon, P.R. Taylor, K. Helzlsouer, P.A.
McAdam and L.A. Zech. 1991. Human [74Se] selenomethionine metabolism: kinetic model. Am. J. Clin. Nutr. 54:917-926.
Szeleszczuk, P., Karpińska, E., Bielecki, W., Kosowska, and G., Borzemska, W. 2004.
Evaluation of lithium and selenium toxicity for chicken embryos and one-day-old chicks Medycyna Weterynaryjna. 60 (5): 492-495 (abstract).
Tako, E., P.R. Ferket and Z. Uni. 2005. Changes in chicken intestinal zinc exporter mRNA expression and small intestinal functionality following intra-amniotic zinc-methionine administration. J Nutr Biochem. 16:339-346.
Tappel A.L., B. Fletcher and D. Deamer. 1973. Effects of antioxidants and nutrients on
lipid peroxidation fluorescent products and aging parameters in the mouse. J. Gerontol 28:415-424.
S.A. Book and A.G. Hendrickx. 1991. Developmental Toxicity of L-Selenomethionine in Macaca fascicularis. Fund. App. Toxicol. 16: 147-160.
Tatum, L., P. Shankar, L. M. Boylan and J. E. Spallholz. 2000. Effect of dietary copper
on selenium toxicity in Fischer 344 rats. Biol Trace Elem Res. 77:241-249. Terry, N., Z. Q. Lin, R. S. Schemenauer, V. Cervinka, A. Zayed and A. Lee. 2000.
Selenium volatilization from a soil-plant system for the remediation of contaminated water and soil in the San Joaquin Valley. J Environ Qual. 29: 1048-1056.
Thompson, J.M., and M.L. Scott. 1969. Role of selenium in the nutrition of the chick. J.
Nutr. 97:335–342.
Thompson, J.N. and M.L. Scott. 1970. Impaired lipid and vitamin E absorption related to atrophy of the pancreas in selenium- deficient chicks. J. Nutr. 100: 797-809.
Tiwary, A.K., B.L. Stegelmeier, and K.E. Panter, L.F. James and J.O. Hall. 2006. Comparative toxicosis of sodium selenite and selenomethionine in lambs. Vet Diagn Invest. 18:61.
Tully W.C. and K.W. Franke 1936. A new toxicant occurring naturally in certain samples of plant foodstuffs VI. A study of the effect of affected grains on growing chicks. Poult. Sci. 14 (5) 280-284.
Turner, E. Elements of Chemistry: Including the Recent Discoveries and Doctrines of the
Science. 5th ed. Philadelphia: Desilver, Thomas & Co., 1835. Digitized copy. Turner, R.J. and J.M. Finch. 1991. Selenium and the immune response. P. Nutr. Soc.
50:275-285. Ullrey, D.E. 1980. Regulation of essential nutrients additions to animal diets (selenium –
model case). J Anim Sci. 51:645-651. Ullrey, D.E. 1992. Basis for regulation of selenium supplements in animal diets. J Anim
Sci. 70:3922-3927. Underwood, E.J. and N.F. Suttle. 1999. The mineral nutrition of livestock. 3rd ed. CABI
Publ., Oxon, UK. Uni, Z., and P.R. Ferket. 2003. Enhancement of development of oviparous species by in
ovo feeding. U.S. Patent no. 6,592,878 B2.
Utterback, P.L., C.M. Parson, I. Yoon, and J. Butler. 2005. Effect of supplementing selenium yeast in diets of laying hens on egg Se content. Poult. Sci. 84:1900-1901.
Vendeland S.C., Deagen J.T., Whanger P.D. 1992. Uptake of selenotrisulfides of
glutathione and cysteine by brush border membranes from rat intestines. J Inorg Biochem. 47:131-140.
Vendeland, S.C., J.T. Deagen and P.D. Whanger. 1988. Transport of selenium as selenite or selenomethionine across brush-border membranes from the upper intestine of rats. Faseb J. A1621.
Vendeland, S.C., J.T. Deagen, J.A. Butler and P.D. Whanger. 1994. Uptake of selenite,
selenomethionine and selenate by brush-border membrane-vesicles isolated from rat small-intestine. Biometals. 7: 305-312.
Vick, S.V., J. Brake and T.J. Walsh.1993. Relationship of incubation humidity and
�flock age to hatchability of broiler hatching eggs. Poult. Sci. 72: 251-258.
Vickers T. 2007. After I.S. Young, and J.McEneny. 2001. Lipoprotein oxidation and atherosclerosis. Biochem Soc Trans 29 (Pt 2): 358–62. Available at http://en.wikipedia.org/wiki/File: Lipid_peroxidation.svg. Visited September 21, 2011.
Vieira S.L. and E.T. Moran. 1998. Comparison of eggs and chicks from broiler breeders
of extremely different ages. J Appl Poult Res. 7:372-376.
153
Whanger, P.D. and J. Butler. 1988. Effects of various dietary levels of selenium as selenite or selenomethionine on tissue selenium levels and glutathione peroxidase activity in rats. J. Nutr. 118:846-852.
Whanger, P.D., N.D. Pedersen, J. Hatfield and P.H. Weswig. 1976. Absorption of Selenite and Selenomethionine from Ligated Digestive-Tract Segments in Rats. Proc Soc Exp Biol Med. 153:295-297.
Williams M.L., R.L. Hothem and H.M. Ohlendorf. 1989. Recruitment failure in
American avocets and black-necked stilts nesting at Kesterson Reservoir, California, 1984-1985. Condor 91:797-802.
Willis, E.D. 1969. Lipid Peroxide Formation in Microsomes; General Considerations.
Biochem J. 113: 315-324. Wilson, D.S., P. Zhang, R. He, R. Ota and S.T. Omaye. 1997. Kinetics of selenium
incorporation into tissues of female mallard ducks. Toxicol. 122:51-60. Wittmann, J. and J. Weissenbeck. 1980. The influence of gas composition in the air cell
on pipping and liver metabolism in embryonic chicks. Biochem Exp Biol. 16:383-390.
Wolffram S., B. Berger, B. Grenacher and E. Scharrer. 1989. Transport of seleno amino acids and their sulphur analogues across the intestinal brush border membrane. J. Nutr. 119:706-712.
Wolffram, S. 1999. Absorption and metabolism of selenium: difference between Inorganic and organic sources. In: Biotechnology in the Feed industry. Proc. of the 15th Annual Symposium, (T.P. Lyons, and K.A. Jacques, eds.). Nottingham University Press, Nottingham, UK, pp. 547-566.
Yaeger M.J., R.D. Neiger and L. Holler. 1998. The effect of subclinical selenium
toxicosis on pregnant beef cattle. J Vet Diagn Invest.10:268-273.
Yamamoto, Y. and B. Glick. 1982. A comparison of the immune response between two lines of chickens selected for differences in the weight of the bursa of fabricius. Poult. Sci. 61:2129-2132.
Yan, L. and J.E. Spallholz. 1993. Generation of reactive oxygen species from the reaction
of selenium compounds with thiols and mammary tumor cells. Biochem Pharm. 45:429-437.
154
VITA
LIZZA M. MACALINTAL
Place of birth: Philippines
Date of Birth: July 2, 1968
Education
MASTER OF SCIENCE, 2004
North Carolina State University, Raleigh, NC
DOCTOR OF VETERINARY MEDICINE, 1992
University of the Philippines at Los Banos, Philippines
Scholastic and Professional Awards:
Student Award for Excellence (Metabolism and Nutrition)
2011 Poultry Science Association, St. Louis, MO
Fulbright Scholarship
2002-2004 (NC State University)
Professional Work Experience:
Veterinarian – Bureau of Animal Industry, Philippines, 2000-2006