41
In-store Frozen Vegetable Eye- tracking Study Report Outlet: Checkers, Sunninghill, South Africa © Prompt Research Insights 2009
In-store Frozen Vegetable Eye-tracking Study
ReportOutlet: Checkers, Sunninghill,
South Africa
© Prompt Research Insights 2009

Agenda
• Executive summary
• Research objectives – The bird’s eye view
• Methodology
• Sample
• Empirical findings
• Conceptual insights and actionable foresights
© Prompt Research Insights 2009

Executive Summary
•The frozen vegetables industry consists of only a few brands
including the house brand with McCain being the dominant
brand. Awareness of the other brands is low with some
customers thinking there is no substitute for McCann.
•The picture and the texture of the packaging is the purchase
driver.
•There seems to be a dwindle in the purchase of frozen
vegetables as more consumers prefer more fresh vegetables
as the concern over health rises – there seems to be greater
awareness around required nutritional content on a daily
basis.
•Frozen vegetables do not hold the credibility of freshness
and “all the goodness I need” compared to fresh vegetables
but since they require much less preparation time they
remain part of their grocery shopping© Prompt Research Insights 2009
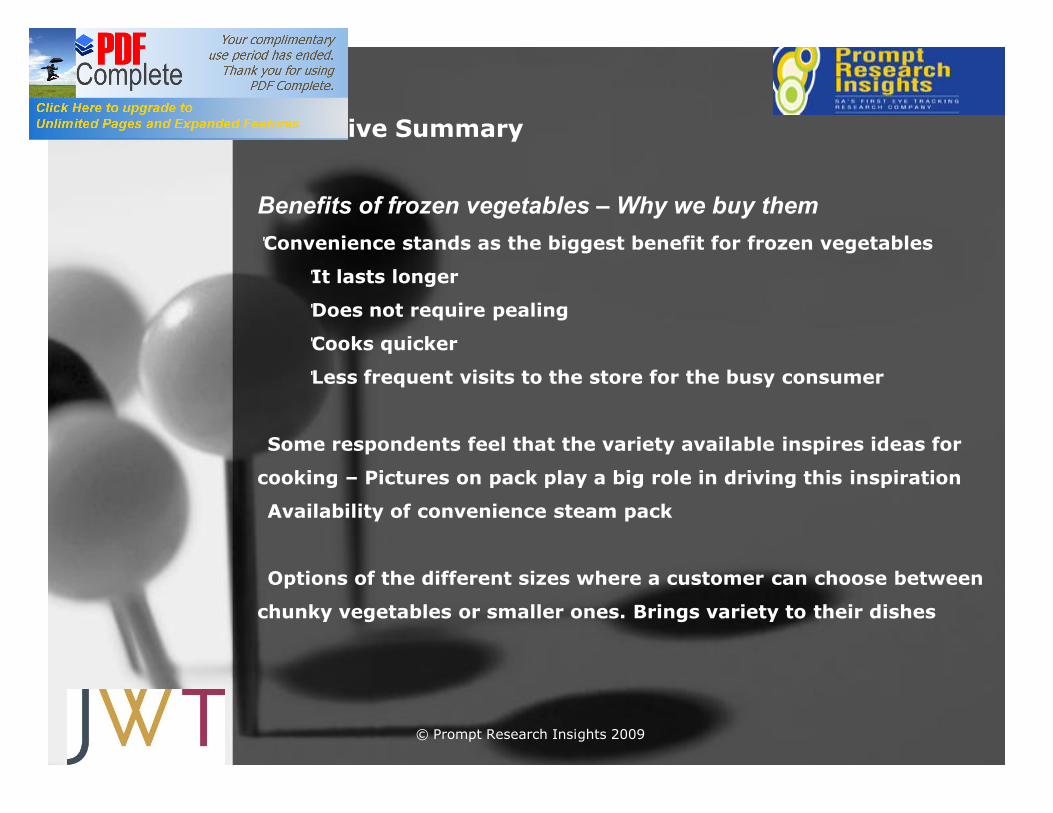
Executive Summary
Benefits of frozen vegetables – Why we buy them•Convenience stands as the biggest benefit for frozen vegetables
•It lasts longer
•Does not require pealing
•Cooks quicker
•Less frequent visits to the store for the busy consumer
•Some respondents feel that the variety available inspires ideas for
cooking – Pictures on pack play a big role in driving this inspiration
•Availability of convenience steam pack
•Options of the different sizes where a customer can choose between
chunky vegetables or smaller ones. Brings variety to their dishes
© Prompt Research Insights 2009

Barriers to Frequent Purchase
•There is very little reference to a health benefit –
credibility on health tends to be low as consumers do not
believe that a frozen product can contain the necessary
nutrients until consumption
•Concerns over the colour of the vegetables – fresh
vegetables seen to be brighter and more nutritious
•Frozen vegetables have less crunch meaning less fresh
– some describe them as soggy
•Frozen vegetables are not seen to deliver on the taste
benefit as some believe that the taste is not the same
as fresh vegetables
“All frozen vegetables taste like cardboard” (White
female, 35 -49)
Executive Summary
© Prompt Research Insights 2009

Objectives
Primary research objectivesA bird’s eye view
•To gain shopper insights and understanding at how shoppers shop
within the refrigerated vegetables category
•Understand shopper behavior and drivers, especially the coffin
freezer
Secondary research objectives
•Identify patterns of behavior within the category
•Understand the importance of brand within the category
•Understand shopper purchase decision
•Ascertain level of loyalty
© Prompt Research Insights 2009

Methodology
•In-store interviews were conducted where respondents
were approached in the store while they were making
their purchases
•The respondents were initially observed while the eye
tracker was recording what they were looking at and
asked questions regarding their observations.
• These interviews build one to rapport, serves to provide
greater detail and more intimate information while the
respondent is still engaged in the shopping activity
•Respondents were able to open up on a personal level
with the moderator who aims to break down barriers and
understand barriers and drivers of the category purchase
© Prompt Research Insights 2009

Brands studied
© Prompt Research Insights 2009

TEST DESIGN
Eye tracking findings
© Prompt Research Insights 2009

Choose a pack of frozen vegetables you would buy
© Prompt Research Insights 2009

The demographics of the people who took part in this study are shown above.
DEMOGRAPHICS
© Prompt Research Insights 2009

This heatmap shows where the participants focused most during the test sessions.
HEATMAP

Inverted heatmaps display the same information in the opposite way. They illustrate what people actually see and what is left out of their visual focus.
HEATMAP

This slide compares heatmaps for male and female participants. The differences in visual attention between target groups, guide you to more efficient content allocation on the
page.
FEMALE MALE
SEGMENTED HEATMAP

This slide compares heatmaps for older and younger people. The differences in visual attention between target groups, guide you to more efficient content allocation on the
page.
SEGMENTED HEATMAP
UNDER 35 OVER 35
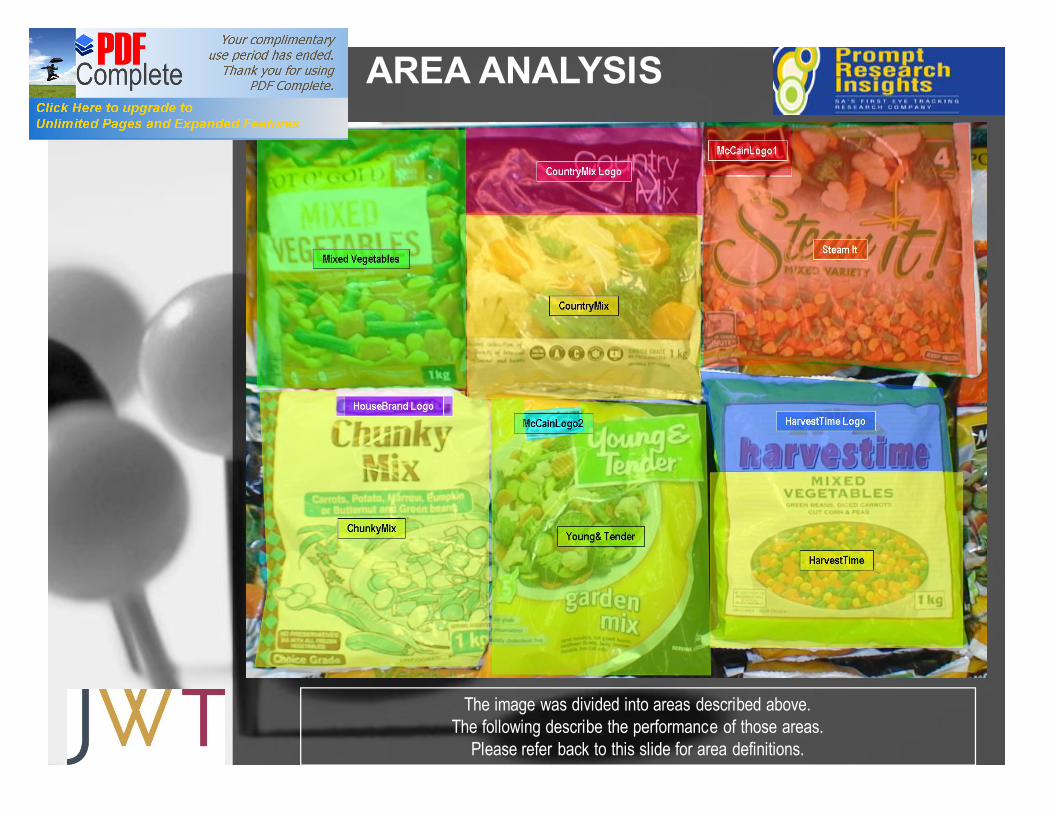
The image was divided into areas described above. The following describe the performance of those areas.
Please refer back to this slide for area definitions.
AREA ANALYSIS

CATCHINESS how attractive is an
area
Catchiness describes how well area captures attention, relative to its screen space

The blue bars in this graph show the catchiness scores of these areas The most important question is whether catchiness scores correspond to the page business priorities.
Are any areas using up too much attention? Is something important not performing?
CATCHINESS

Catchiness is here displayed in a table format.
CATCHINESS TABLE

How visible is the area
How fast people see the area
How long people look at the area
How engaged are people with the area
Visual value of area comprises of 4 key metrics listed above.Following slides display results for each metric in this study.
VISUAL VALUE

Blue bars on the graph show how quickly people arrived to different areas.Green visibility line displays how many participants actually saw the particular area.
VISUAL VALUE
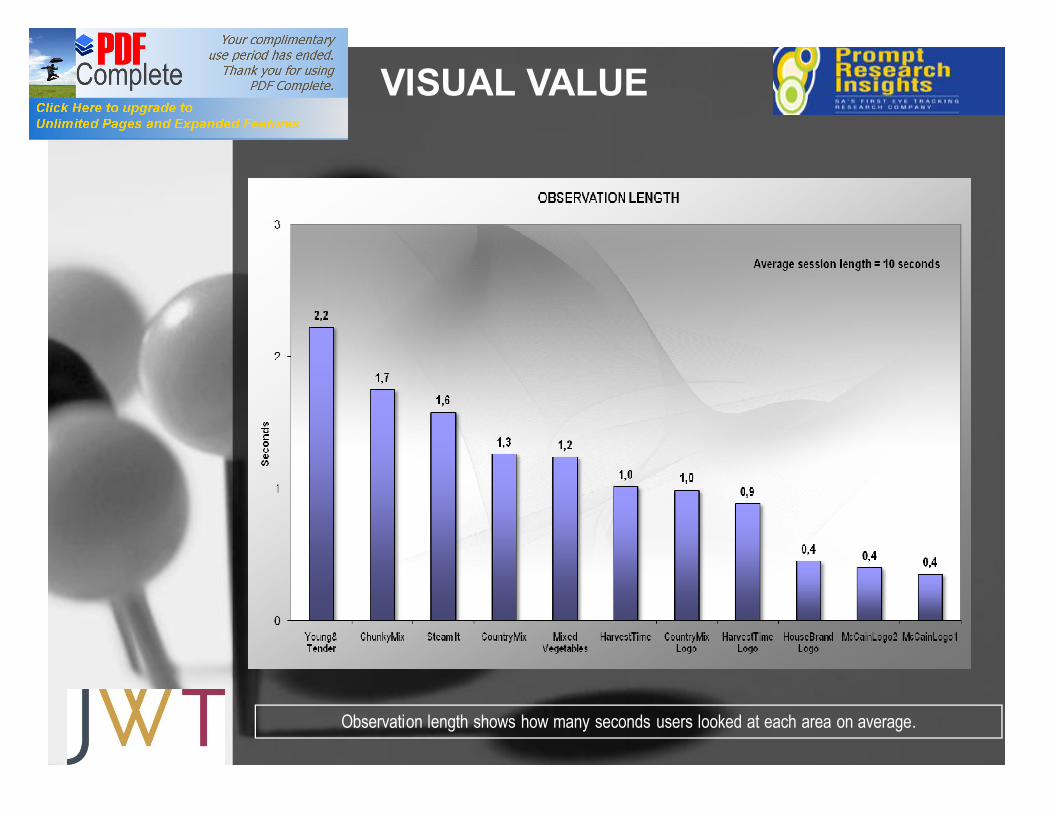
Observation length shows how many seconds users looked at each area on average.
VISUAL VALUE

VISUAL VALUE
Average eye fixation length measures engagement with the area.Longer duration of a single fixation means more information from that area was processed by the brain.
Engagement can be either positive (its interesting) or negative (its hard to understand).Either way, it measures with which areas people engage with the most
VISUAL VALUE
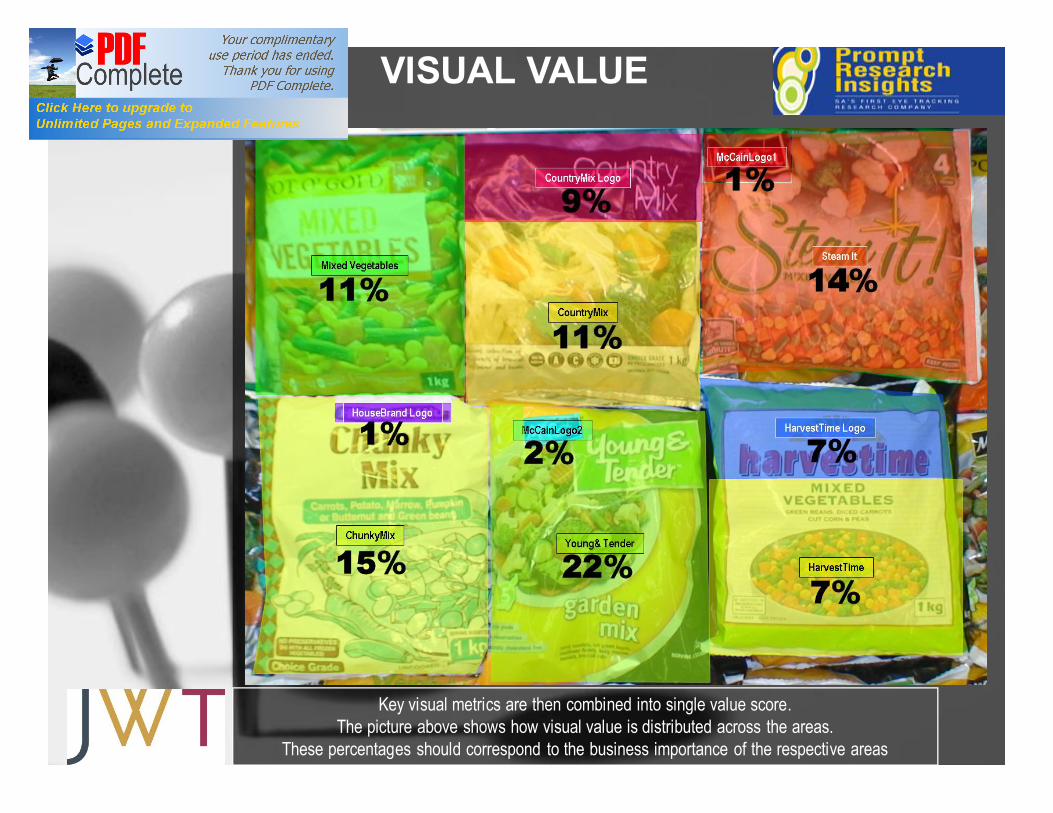
Key visual metrics are then combined into single value score.The picture above shows how visual value is distributed across the areas.
These percentages should correspond to the business importance of the respective areas

VISUAL VALUE
This Table shows the key visual metrics are combined into a single value score.These percentages should correspond to the business importance of the respective areas

Allocation of visual value across different functions of the page is displayed above.This distribution must be in line with business priorities of Your media.
VISUAL VALUE

Summary
•The logo is the first thing people look at in the category but
only so that they can see what brand it is, but do not focus too
much on it
•The picture of the vegetables on the pack is the most
important factor that drives purchase, people fixate more on it
to see what’s inside.
•Checkers and pot O gold has higher visual values purely
because people were struggling to see what’s in the pack.
Some respondents complained Pot O Gold is too bright and
hard to read while with Checkers its because one has to read
to see what’s there because the picture is dull
© Prompt Research Insights 2009

Further findings
© Prompt Research Insights 2009

•Identify patterns of behavior within the category
© Prompt Research Insights 2009

Behaviour patterns within the category
•Purchase mostly habitual - consumers were buying what they
always purchased, looking for their brand and the vegetable
type and off they go
•The habitual purchasers spent very little time browsing and
looking at other alternatives – they tended to be more loyal
and less price sensitive
•“What else is there to buy, what other brands are there?”
(Black male, 25 -35)
•“This is what I go for, my mother used to use it, what can
you do – you go for what you know” (White female, 25 -
35)
•The less habitual shopper browsed more,
© Prompt Research Insights 2009
•Pictures on packaging are used as purchase guide to identify preferred
vegetables and inspire new cooking ideas
•“I was looking for the sweet corn. I only buy the ones with the
sweet corn and so I look at the pictures” (Black male, 25 -35)
•“I like to look at the pictures to get new ideas, I have two children
so I like the stir fries, they keep it interesting for them” (White
female, 25 -35)
•With some respondents packaging communicated freshness vs. not
fresh – for example, McCain packaging communicated more freshness
with its glossy shine vs. Harvest time which was seen to be worn out
and tired
•“You see this pack compared to this one, this one looks like it’s
been around, that can’t be fresh” (Black male 25-35)
•McCain is the most dominant brand with it’s users displaying strong
loyalty – even with some price sensitive consumers claiming that it is
the better brand
•“Ideally you want McCain, the veggies are nicer, but I’ll buy it if
it’s on special” (White female, 35 -39)
© Prompt Research Insights 2009
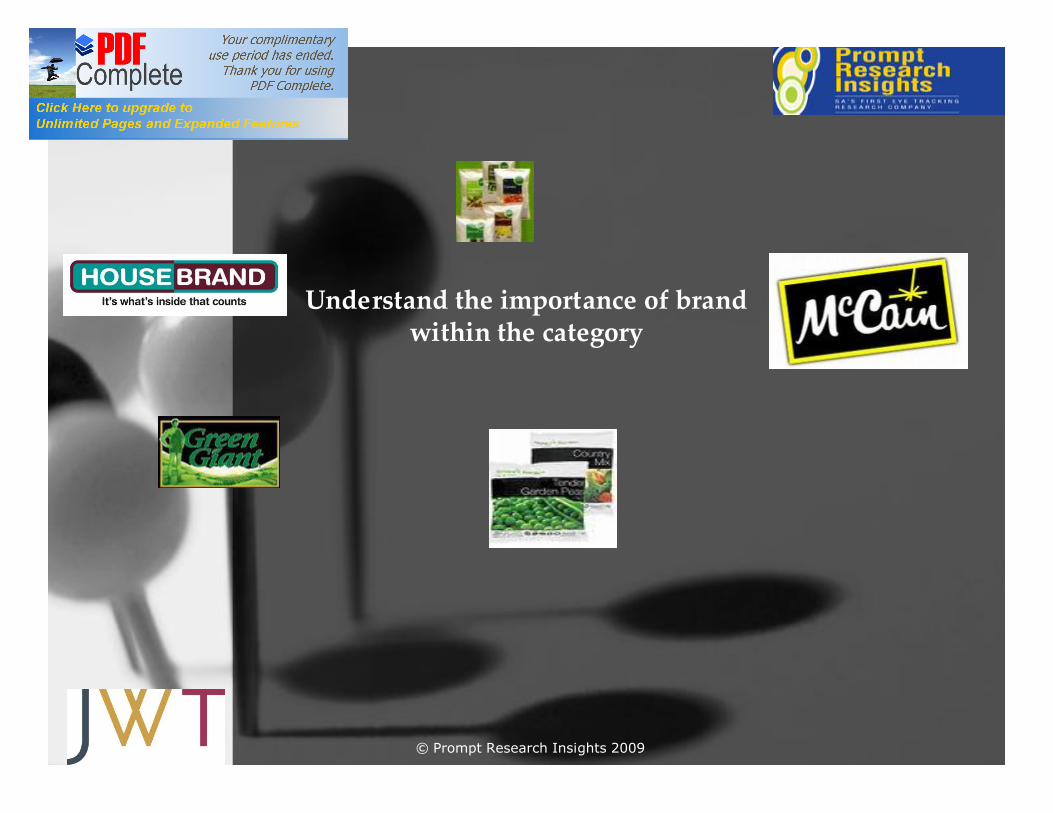
Understand the importance of brand within the category
© Prompt Research Insights 2009

Role of brand- Summary
•Brand plays a significant role within this category as it communicates;
•Good quality product – this means that the colour of the vegetables is
restored which equates to freshness
•Trust – consumers felt that they could trust certain brands more than
others based on the quality of the product, the brand’s reputation and
how long it has been around
•Brands that are well known, advertised more were seen to be more
credible, could be easily trusted and identified with
•Packaging of the brand played a significant role as it communicates the
level of freshness and the quality of the brand
•Greater affinity was displayed towards brands that had a larger variety
of options and thus seen as more innovative and progressive
•Certain brands were seen to be better cut than others
•Freezing methods were seen to be different for different brands which
affects the quality of the product
•Some brands were seen to be more expensive than others
© Prompt Research Insights 2009
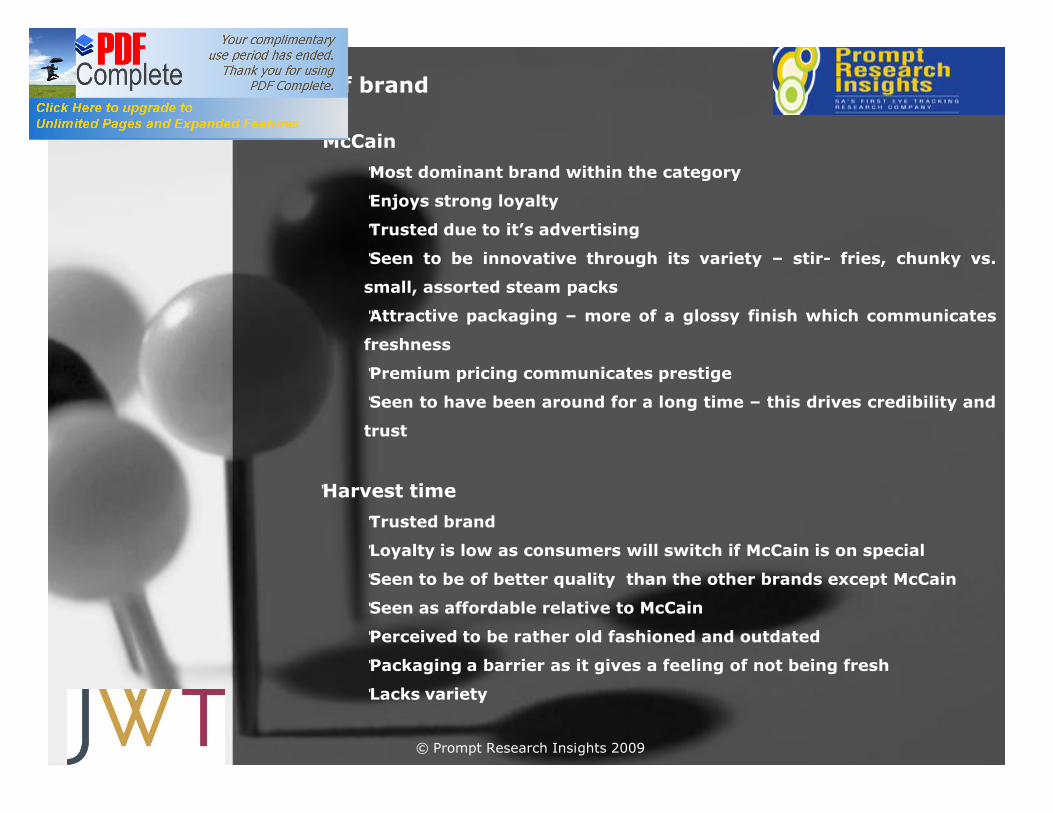
Role of brand
•McCain•Most dominant brand within the category
•Enjoys strong loyalty
•Trusted due to it’s advertising
•Seen to be innovative through its variety – stir- fries, chunky vs.
small, assorted steam packs
•Attractive packaging – more of a glossy finish which communicates
freshness
•Premium pricing communicates prestige
•Seen to have been around for a long time – this drives credibility and
trust
•Harvest time•Trusted brand
•Loyalty is low as consumers will switch if McCain is on special
•Seen to be of better quality than the other brands except McCain
•Seen as affordable relative to McCain
•Perceived to be rather old fashioned and outdated
•Packaging a barrier as it gives a feeling of not being fresh
•Lacks variety
© Prompt Research Insights 2009

Role of brand
•Nature’s garden
•Relatively unknown
•Low levels of loyalty
•A substitute when primary brand is not
available
•Packaging seen to be attractive and
communicates a sense of freshness
through its glossy finish
•Pot O Gold
•Unknown
•No loyalty
•Very little trust for the brand
•Seen to be cheaper and hence not the best
•Lacks innovation based on its packaging
style, perceived to be too bright© Prompt Research Insights 2009

Role of brand
•House brand
•Well known and yet not very trusted
•Seen to be too cheap – bought on the basis
of price
•Taste benefit not credible
•Only considered when on special
•Packaging unattractive
© Prompt Research Insights 2009

Unknown
Innovative
Quality
Cheap
McCain
Nature’s garden
Harvest time
Pot o Gold
House brand
© Prompt Research Insights 2009

Level of planning involved
© Prompt Research Insights 2009
Planning
• Where less planning was involved, consumers
tended to browse through then choose what they
think they’ll like based on packaging and brand
•Some purchases are based on habit
•“I always just buy the mixed one cos they
have everything” (Black female, 25 -35)
•Some consumers prepare their recipes for the week
and hence plan on the type of frozen vegetables
they will need for their shopping trip
•“I’m making stew today so I needed the mixed
vegetables to make it more appetizing” (White
female, 35 -49)
•“I need the cut green beans. I have to make a
salad” (Black female, 25 -35)
© Prompt Research Insights 2009

Conclusions and recommendations
• Frozen vegetables need to communicate a stronger
health benefit
•This can be achieved through the communication of
preserved nutrition in the frozen vegetables
•Packaging needs to serve as a stronger communication
tool – more appealing, inspiring and better quality.
•The picture of the vegetables is ultimately the deciding
factor on whether or not people will buy the product
•Greater variety creates greater appeal
•New and interesting combinations of vegetables create
curiosity and trial
•TV advertising builds credibility and trust because people
buy what they know.
© Prompt Research Insights 2009

Thank you!
PDF version of this study can be accessed here:
All high resolution images can be accessed here:
www.realeyes.it [email protected] [email protected]
© Prompt Research Insights 2009


![The Frozen Fish - Seafish - Seafish · SEGMENT SIX -THE RETAIL OUTLET AND THAWING ] } ... It is a good idea to read j ... Welcome to this module on 'The Frozen Fish Chain'. The module](https://static.documents.pub/doc/80x56/5acdbe057f8b9a93268df082/the-frozen-fish-seafish-six-the-retail-outlet-and-thawing-it-is-a-good.jpg)


