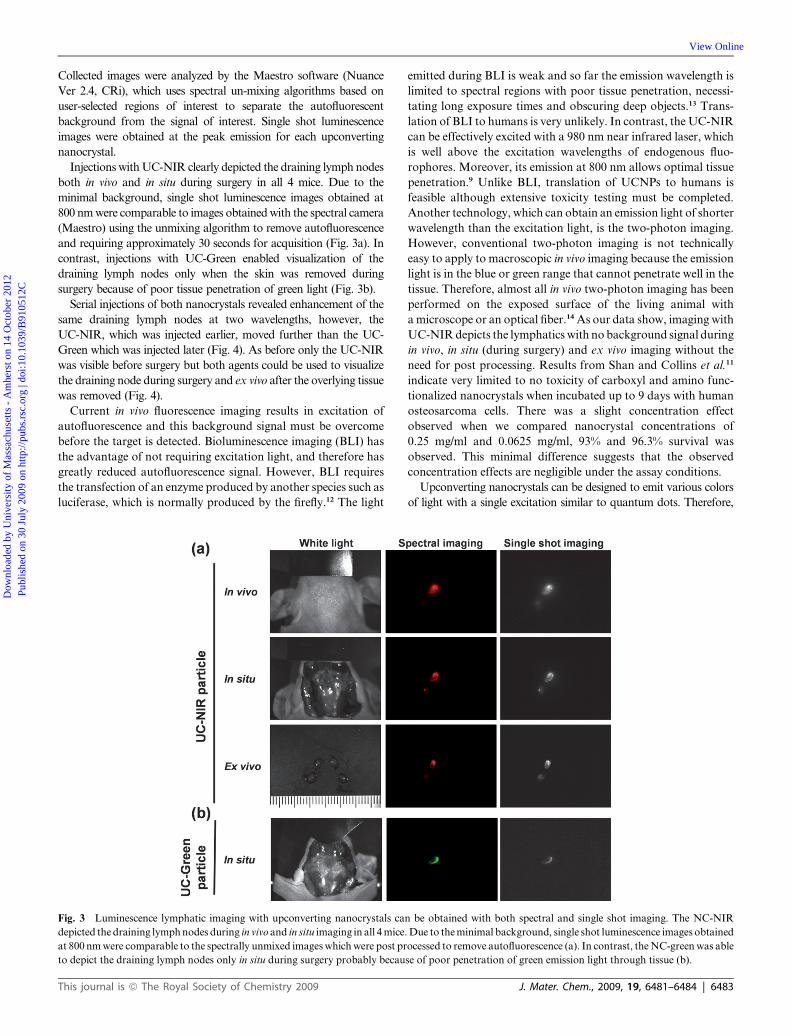
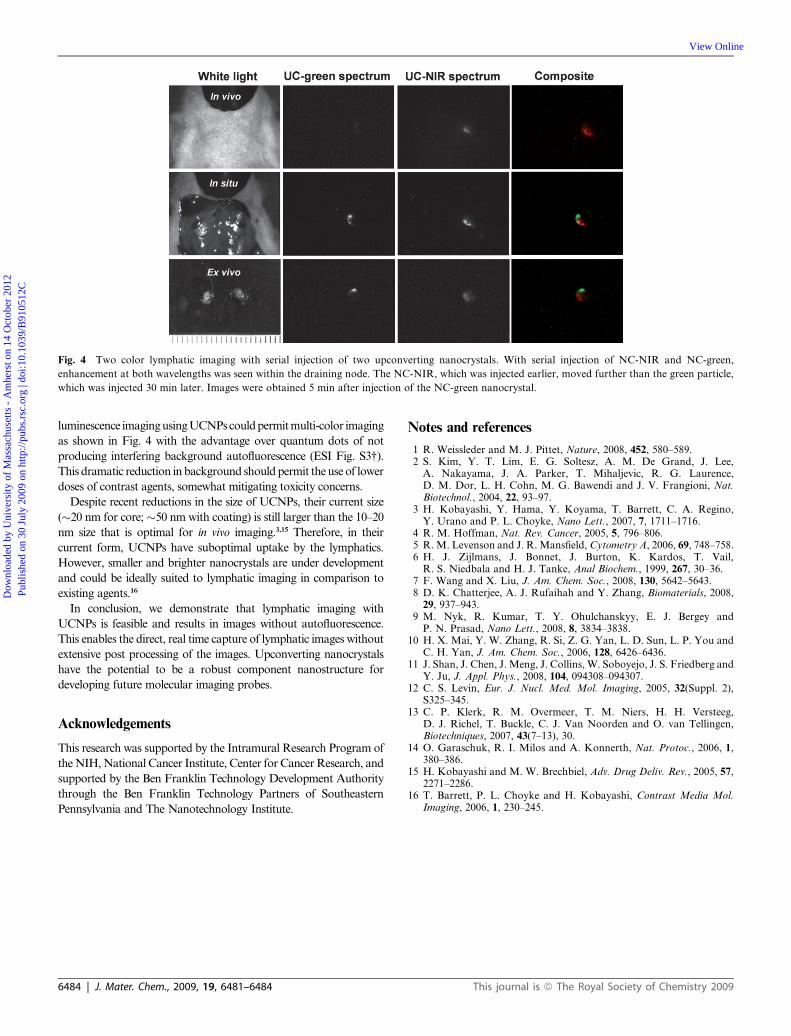
In vivo multiple color lymphatic imaging using upconverting nanocrystals† Hisataka Kobayashi, * a Nobuyuki Kosaka, a Mikako Ogawa, a Nicole Y. Morgan, b Paul D. Smith, b Christopher B. Murray, c Xingchen Ye, c Josh Collins, c G. Ajith Kumar, d Howard Bell d and Peter L. Choyke a Received 28th May 2009, Accepted 21st July 2009 First published as an Advance Article on the web 30th July 2009 DOI: 10.1039/b910512c Upconverting nanocrystals are unique nano-sized particles that emit light at shorter wavelengths (visible and near infrared) after exci- tation in the near infrared that dramatically reduces background autofluorescence in in vivo two color lymphatic imaging for depicting the lymphatic channels and nodes. In vivo fluorescence imaging has become an important technique in biomedical imaging 1 because of its high sensitivity, low cost and feasibility for clinical translation. However, normal tissue auto- fluorescence interferes with conventional in vivo fluorescence imaging by lowering the target to background ratio. Currently, there are two strategies for overcoming autofluorescence: employing ultrabright fluorophores such as quantum dots 2,3 or fluorescent proteins, 4 or acquiring spectral images and then post-processing the imaging data to remove the background signal. 5 Ultrabright fluorophores mostly consist of solid state quantum dots, which contain cadmium and selenium and are therefore potentially toxic. Spectral imaging is relatively slow; the acoustoptic tunable filters used in commercial systems have switching times of approximately 100 ms, leading to a minimum time of several seconds to acquire a full image cube. Real time post-processing of the data for the spectral unmixing is also problematic. Upconverting nanocrystals (UCNPs) represent a new strategy for eliminating background signal. They are excited by infrared or NIR light yet emit in the visible-NIR. As a result, there is minimal excitation of autofluorophores, and no spectral overlap between the upconverter emission and any autofluorescent background, effec- tively eliminating background signal 6 (Fig. 1). This enables near real- time luminescence imaging with high target to background ratios but without complex and time consuming image processing. Moreover, by changing the composition of the doping metals within UCNPs, it is possible to alter their emission wavelength. 7 Although these materials have been known for nearly 20 years, only recently have they been grown as nanocrystals in small sizes suitable for in vivo imaging. 8,9 In this study, we demonstrate the feasibility of using UCNPs for in vivo lymphatic imaging, which is a promising clinical application of nano-materials, using two UCNPs with different emission spectra. Two upconverting NaYF4 nanocrystals doped with rare earth activating pairs, Yb, Tm, or Yb, Er were synthesized for near- infrared (800 nm) and green (540 nm) emissions, respectively, Both nanocrystals, approximately 50 nm in diameter, 20 nm core measured by DLS (DelsaÔ Nano C system, Beckman Coulter, Fullerton, CA) and 10–15 nm thick surface PEG coatings, were employed for all in vivo experiments (see ESI Fig. S1†). The following chemicals were used as received without any further purification: Na(CF 3 COO) (GFS Chemical, Inc., Powell, OH), Y(CF 3 COO) 3 (GFS Chemical, Inc.), Yb(CF 3 COO) 3 (GFS Chemical, Inc.), Tm(CF 3 COO) 3 (GFS Chemical, Inc.), Er(CF 3 COO) 3 (GFS Chem- ical, Inc.), oleic acid (technical grade, 90%, Sigma-Aldrich, St. Louise, MO) and 1-octadecene (ODE, Sigma-Aldrich, technical grade, 90%). The synthesis was based on the methods reported by Mai et al. and Shan et al. 10,11 The methods reported by Mai and Shan have been modified slightly to increase heating efficiency and to obtain higher heating temperatures as close to the boiling point of oleic acid as possible. These modifications allow for a single step method by which pure b phase nanocrystals can be achieved. The ability to obtain b phase nanocrystals will ensure that we are utilizing nanocrystals with the highest quantum efficiency thus giving the greatest signal to Fig. 1 Near infrared excitation does not produce autofluorescence from the mouse abdomen. (a) A scheme of the excitation/emission profiles of quantum dots and UPNCs. (b) A comparison of autofluorescence emission spectra from the mouse abdomen excited with 468 nm blue (blue line) and 980 nm near infrared (red line). Near infrared light produces no detectable background from the body in the visible or near infrared ranges. (c) A scheme of the in vitro and in vivo macroscopic/animal imaging set-up. a Molecular Imaging Program, Center for Cancer Research, National Cancer Institute, NIH, Bldg. 10, Room 1B40, MSC 1088, Bethesda, MD 20892-1088, USA. E-mail: [email protected]b National Institute of Biomedical Imaging and Bioengineering, NIH, Bethesda, MD 20892, USA c University of Pennsylvania, Philadelphia, PA 19104, USA d Sunstone BioSciences, Inc., Philadelphia, PA 19104, USA † Electronic supplementary information (ESI) available: Fig. S1–S3. See DOI: 10.1039/b910512c This journal is ª The Royal Society of Chemistry 2009 J. Mater. Chem., 2009, 19, 6481–6484 | 6481 COMMUNICATION www.rsc.org/materials | Journal of Materials Chemistry Downloaded by University of Massachusetts - Amherst on 14 October 2012 Published on 30 July 2009 on http://pubs.rsc.org | doi:10.1039/B910512C View Online / Journal Homepage / Table of Contents for this issue
Transcript
COMMUNICATION www.rsc.org/materials | Journal of Materials Chemistry
Dow
nloa
ded
by U
nive
rsity
of
Mas
sach
uset
ts -
Am
hers
t on
14 O
ctob
er 2
012
Publ
ishe
d on
30
July
200
9 on
http
://pu
bs.r
sc.o
rg |
doi:1
0.10
39/B
9105
12C
View Online / Journal Homepage / Table of Contents for this issue
In vivo multiple color lymphatic imaging using upconverting nanocrystals†
Hisataka Kobayashi,*a Nobuyuki Kosaka,a Mikako Ogawa,a Nicole Y. Morgan,b Paul D. Smith,b
Christopher B. Murray,c Xingchen Ye,c Josh Collins,c G. Ajith Kumar,d Howard Belld and Peter L. Choykea
Received 28th May 2009, Accepted 21st July 2009
First published as an Advance Article on the web 30th July 2009
DOI: 10.1039/b910512c
Upconverting nanocrystals are unique nano-sized particles that emit
light at shorter wavelengths (visible and near infrared) after exci-
tation in the near infrared that dramatically reduces background
autofluorescence in in vivo two color lymphatic imaging for depicting
the lymphatic channels and nodes.
In vivo fluorescence imaging has become an important technique in
biomedical imaging1 because of its high sensitivity, low cost and
feasibility for clinical translation. However, normal tissue auto-
fluorescence interferes with conventional in vivo fluorescence imaging
by lowering the target to background ratio. Currently, there are two
strategies for overcoming autofluorescence: employing ultrabright
fluorophores such as quantum dots2,3 or fluorescent proteins,4 or
acquiring spectral images and then post-processing the imaging data
to remove the background signal.5 Ultrabright fluorophores mostly
consist of solid state quantum dots, which contain cadmium and
selenium and are therefore potentially toxic. Spectral imaging is
relatively slow; the acoustoptic tunable filters used in commercial
systems have switching times of approximately 100 ms, leading to
a minimum time of several seconds to acquire a full image cube. Real
time post-processing of the data for the spectral unmixing is also
problematic.
Upconverting nanocrystals (UCNPs) represent a new strategy for
eliminating background signal. They are excited by infrared or NIR
light yet emit in the visible-NIR. As a result, there is minimal
excitation of autofluorophores, and no spectral overlap between the
upconverter emission and any autofluorescent background, effec-
tively eliminating background signal6 (Fig. 1). This enables near real-
time luminescence imaging with high target to background ratios but
without complex and time consuming image processing. Moreover,
by changing the composition of the doping metals within UCNPs, it
is possible to alter their emission wavelength.7 Although these
materials have been known for nearly 20 years, only recently have
they been grown as nanocrystals in small sizes suitable for in vivo
imaging.8,9 In this study, we demonstrate the feasibility of using
UCNPs for in vivo lymphatic imaging, which is a promising clinical
application of nano-materials, using two UCNPs with different
emission spectra.
aMolecular Imaging Program, Center for Cancer Research, NationalCancer Institute, NIH, Bldg. 10, Room 1B40, MSC 1088, Bethesda, MD20892-1088, USA. E-mail: [email protected] Institute of Biomedical Imaging and Bioengineering, NIH,Bethesda, MD 20892, USAcUniversity of Pennsylvania, Philadelphia, PA 19104, USAdSunstone BioSciences, Inc., Philadelphia, PA 19104, USA
† Electronic supplementary information (ESI) available: Fig. S1–S3. SeeDOI: 10.1039/b910512c
This journal is ª The Royal Society of Chemistry 2009
Two upconverting NaYF4 nanocrystals doped with rare earth
activating pairs, Yb, Tm, or Yb, Er were synthesized for near-
infrared (800 nm) and green (540 nm) emissions, respectively, Both
nanocrystals, approximately 50 nm in diameter, �20 nm core
measured by DLS (Delsa� Nano C system, Beckman Coulter,
Fullerton, CA) and 10–15 nm thick surface PEG coatings, were
employed for all in vivo experiments (see ESI Fig. S1†). The following
chemicals were used as received without any further purification:
This dramatic reduction in background should permit the use of lower
doses of contrast agents, somewhat mitigating toxicity concerns.
Despite recent reductions in the size of UCNPs, their current size
(�20 nm for core;�50 nm with coating) is still larger than the 10–20
nm size that is optimal for in vivo imaging.3,15 Therefore, in their
current form, UCNPs have suboptimal uptake by the lymphatics.
However, smaller and brighter nanocrystals are under development
and could be ideally suited to lymphatic imaging in comparison to
existing agents.16
In conclusion, we demonstrate that lymphatic imaging with
UCNPs is feasible and results in images without autofluorescence.
This enables the direct, real time capture of lymphatic images without
extensive post processing of the images. Upconverting nanocrystals
have the potential to be a robust component nanostructure for
developing future molecular imaging probes.
Acknowledgements
This research was supported by the Intramural Research Program of
the NIH, National Cancer Institute, Center for Cancer Research, and
supported by the Ben Franklin Technology Development Authority
through the Ben Franklin Technology Partners of Southeastern
Pennsylvania and The Nanotechnology Institute.
6484 | J. Mater. Chem., 2009, 19, 6481–6484
Notes and references
1 R. Weissleder and M. J. Pittet, Nature, 2008, 452, 580–589.2 S. Kim, Y. T. Lim, E. G. Soltesz, A. M. De Grand, J. Lee,
A. Nakayama, J. A. Parker, T. Mihaljevic, R. G. Laurence,D. M. Dor, L. H. Cohn, M. G. Bawendi and J. V. Frangioni, Nat.Biotechnol., 2004, 22, 93–97.
3 H. Kobayashi, Y. Hama, Y. Koyama, T. Barrett, C. A. Regino,Y. Urano and P. L. Choyke, Nano Lett., 2007, 7, 1711–1716.
4 R. M. Hoffman, Nat. Rev. Cancer, 2005, 5, 796–806.5 R. M. Levenson and J. R. Mansfield, Cytometry A, 2006, 69, 748–758.6 H. J. Zijlmans, J. Bonnet, J. Burton, K. Kardos, T. Vail,
R. S. Niedbala and H. J. Tanke, Anal Biochem., 1999, 267, 30–36.7 F. Wang and X. Liu, J. Am. Chem. Soc., 2008, 130, 5642–5643.8 D. K. Chatterjee, A. J. Rufaihah and Y. Zhang, Biomaterials, 2008,
29, 937–943.9 M. Nyk, R. Kumar, T. Y. Ohulchanskyy, E. J. Bergey and
P. N. Prasad, Nano Lett., 2008, 8, 3834–3838.10 H. X. Mai, Y. W. Zhang, R. Si, Z. G. Yan, L. D. Sun, L. P. You and
C. H. Yan, J. Am. Chem. Soc., 2006, 128, 6426–6436.11 J. Shan, J. Chen, J. Meng, J. Collins, W. Soboyejo, J. S. Friedberg and
Y. Ju, J. Appl. Phys., 2008, 104, 094308–094307.12 C. S. Levin, Eur. J. Nucl. Med. Mol. Imaging, 2005, 32(Suppl. 2),
S325–345.13 C. P. Klerk, R. M. Overmeer, T. M. Niers, H. H. Versteeg,
D. J. Richel, T. Buckle, C. J. Van Noorden and O. van Tellingen,Biotechniques, 2007, 43(7–13), 30.
14 O. Garaschuk, R. I. Milos and A. Konnerth, Nat. Protoc., 2006, 1,380–386.
15 H. Kobayashi and M. W. Brechbiel, Adv. Drug Deliv. Rev., 2005, 57,2271–2286.
16 T. Barrett, P. L. Choyke and H. Kobayashi, Contrast Media Mol.Imaging, 2006, 1, 230–245.
This journal is ª The Royal Society of Chemistry 2009