U.S. ARMY Tecllnlcal Memor:]n(i[lm 9-68 I , \VORK PERFORMANCE WIT] 1 MLJSIC: IN3TR[JMHNTATION AND FREQ[JENCY RESPONS13 William Wokoun July 1968 AMCMS Code 5026.11.81900 HUMAN ENGINEERING LABOMTORIES ABERDEEN PROVING GROUND, MARYLAND
Transcript
U.S. ARMY
Tecllnlcal Memor:]n(i[lm 9-68
I,
\VORK PERFORMANCE WIT] 1 MLJSIC:
IN3TR[JMHNTATION AND FREQ[JENCY RESPONS13
William Wokoun
July 1968
AMCMS Code 5026.11.81900
HUMAN ENGINEERING LABOMTORIES
ABERDEEN PROVING GROUND,MARYLAND
Destroy this report when no longer needed.Do not return it t(-)the originator.
—. ——— ___ _____
- e\
The findings in this report are not to be construed as an officialDepartment of t!w Army position unless so designated by otherauthorized documents.
.
Use of trade names in this report does not constitute an officialendorsement or approval of the use of such commercbl products.
U. S. ARMY HUMAN ENGINEERING LABORATORIESAberdeen Proving Ground, Maryland
This document has been approve’d fur 11’u!’,1I.
r~lcas~ and saie; its dlstrihut~on 1s ~]ill]itL .{ .
—
PAGE ii -------BLANK
ABSTRACT
This experiment/~ ested whether music’s instrumentationaffects response times on a vigilance task. Instrumentationwas varied by restricting the frequency range, thus elimim -ting many of the overtones that determine timbre. Forty-onesubjects worked at the task for one hour while listening to aprogram of 23 selections, altermtely Wide-Range and Filtered,The subjects showed significantly better alertness during theWide-Range condition throughout the hour. The Filtered con-dition gave slower responses, greater variability, and inferiorindividual cons istency. Hence the music’s instrumentation hadseveral significant effects on alertness. In addition, the more-stimulating musical program here appeared responsible forfaster responses and lower variability ~~afiirrthe~
6. Correlations 13etwwn Response Times for QuarterHours Within the Same Condition . . . . . . . . . 18
7. Correlations Between Response Times Under Wide-Range ;~nd Filtered Conditions, by Quarters . . . . . 19
vi
WORK PI; RI?ORMANCE WITJ I MUSIC:
INSTRUMliNTATION AND FRIQLJENCY RESPONSE
INTRODUCTION.
The discovery that human observers. searching for targets on radar scopes,could not perform their jobs effectively for much more than twlf ~n hour was umomentous one, with far-reaching implications. It focussed attention on a trouhlc -some and ironic fact about human functioning on monotonous tasks: doing nothing isa hard job, and one which people do not perform with any great distinction.
These monotonous assignments are usually called vigilance tasks -- that is,work situations where people try to respond quickly and accurately, even thoughstimuli occur infrequently. Within the military, many of these vigilance tasks arecritically important: not only detecting faint targets on the radar scope or monitor-ing a complex. automated missile system, but even such prosaic assignments aswatching for aircraft. Vigilance is also an important element in many civilian jobs,such as a long-distance truck driver, an assembly-line inspector, or a worker whooperates automated machinery. These men need not respond constantly, and oftennot even rapidly; yet they must always be ready to.
Despite the importance of these functions, it often proves impractical orimpossible to have machines take them over completely. Since men must work atvigilance tasks, a large body of research has pursued possibilities which promisedto help human operators maintain their alertness. This experiment, and the twopreceding it. investigated whether manipulating environmental stimuli could improvevigilance.
The first experiment (3) demonstrated that a program of music can not only.
maintain alertness, but can actually improve performance ~t a monotonous task.The second experiment (4) linked the program’s general musical characteristicsto changes in beha ~’ior. The results showed that a single group of musical s elec -tions will have q~litc different effects when the selections are given in differentorders. More spticificaU!~, these experiments support the theoretical positionadvanced by O’h”cill (2), which rnaintoins that the “stimulation value” of a given. .musical arrangemcn’ depends on sl Ich variables as tempo, rhythm, instrumentation,and orchestral si Z(’
Lo.gicall\7. Ihc HU1[ slcp Jn expcrlmcn(~ltlon sIIoIIM he m:]nipulating each of Ihck’ariahles singly, Whl]c lloldII~ :111 olllcrs constanl. to ohscrvu II(JW they :lffcct ~lcrt -
ness al [he vigilance [ask. T!’llilc this :Ipproactl IS easy 10 stale it proves sluhborn]vdlffic Lilt to Implemcml . ‘[’llc cxpcrilncnt cr (’,lnno[ rcildlly oh(:[ in IWOrecordings of :]
select-ion using. for cx:]nlplc. (Ii(fercnt tcl~]pos -- j~~t ld~ntlc~ll In all other Wavs.
\Vorking with availnhlc recordings, tle h:]s no d irccl wuy to ma nipllltite rhvthn~.instrulllc[ll-il(iO1l, or []r~llcstr:ll si xc. }’cI tile .lv(r:l~( psi’cllol(o, qsl Is il[)t” prcp:lrcdt-o commission his tntn :irmn~enlents and conduct recording sessions 10 prcp:lrelnusicdl programs for his spcci:: lizcd purposes.
On the other hand, there arc many ways to process nl~lsic clcctronicall!”. Ifone of O’Ncill’s variables cot!ld bc translated into phvsical terms, it might thenbecon]e ~rnenahle to electronic manipulation in the psychological lahoratorv.
Instrumentation is such :i va riahle. O’Neill has stated that some tnstrmmcntssouncl more stimulating than others do. For cxarnple. he considers strings leaststimulating. woodwinds intermediate. and brass Instruments most stimulating. Forthe moment. we will refr:l in from speculating a hoLlt W’flythe waveform of a trumpetmight be more stimulating than a violin’s.
why , though , does .1 trumpet sound different from a violin’? According toFourier’s theory. an]’ complex waveform can be an~lyzcxl Into component sine waves.Since sine waves have a precise nmthernoticol definition, one sine wave is much likea m other; [hey differ onlf- in frequencv and amplitude. Thus when two instrumentsploy the same musictil n;te. their fundamental frequencies are nearly Identical. Infact. one Bell Laboratories demonstration (1) shows that a soprano. a piano. :1nd afactory whistle sound ulike -- if tile harmonics are filtered out so ~ve I]ear only thefundamental pitch.
For it is the harmonics -- multiples of the fundamental frequency -- that givenlusical instruments their characteristic timbres. Instruments sound differentbecause they generate varyi~ numbers and intensities of harmonics. If the over-tones could be removed entirely. differences in instrumentation would virtuallyvanish; one instrument would sound about like all the others.
Even if it were technically feasible to remove all overtones from a Imusicalrecording, it \voL]ld I1O1he desir:~ble to make the sound so drub and colorless.hTevertheless, the Kc1 TOmanaginf: fhe instrumentation variable in experimentationlies in the fact thal :i Il:]rmonic a 1~.:!, s l~ils J higher frequency than its f’lndamental.It is simple to rcn]{)ve high frequcnclcs with an electronic filter, although we cannever complctelj- s tp:t ral’e fund:ln]cnl.] 1s and harmonics: occo sional high-pitchedfundamentals ma! he lost. while vcr: low frequencies will still retain most of theirharmonics. Still. removing higher (rcqucmcics will selectively discriminate againstharmonics, while leaving the fundamentals relatively unaffected.
2
Restricting an audio system’s high-frequency response will reduce the music’sharmonic content, thereby reducing the differences in instrumentation. O’Neill hasasserted that variations in instrumentation make music more stimulating. If so,music reproduced with a wide frequency range should be more stimulating. Conse-quently, it should maintain the subjects’ alertness better and yield faster responsetimes.
.
METHOD
Subjects
The subjects were 41 male students from the author’s classes at the HumanEngineering Laboratories.
Experimented Rooms
Each subject was tested while seated alone in one of four Industrial AcousticsCo. model 402-A audiometric booths. These booths effectively isolated the subjectsfrom most of the extraneous noises they would otherwise have heard. Inside, thebooths were approximately 6 feet square by 6 1/2 feet high. A vigilance stimulusbox was on the table in front of the subject. To his left, on the floor, there was aseven-inch loudspeaker in a closed baffle.
Music
In developing the musical program for the present experiment, it was possibleto txike advantage of several findings from the previous studies. In the secondstudy (4), the experimenter chose the 23 selections more or less randomly, as ablock from an existing program. While this procedure can be defended as randomsampling, it unfortunately led to a heavy preponderance of slow and medium s elec -tions. To avoid repeating this bias. the author asked O’Neill to select another setof 23 selections so they would encornpass a broader range of stimulation values.Table 1 compares the previous program and O’NeilI’s new program by classifyingthe selections into four broad categories.
O’NCII1’S Class \(icatlon of SelectionsIn Pruscnt ;1IId ]’rev IoiIs Progr:lms
Numlmr of Select ionsPresent Previous
Descript~ve Ca(egor} Program Program
Fast 5 1
Bright 9 1
Medium 8 11
slow 1 10
Total 23 23
While both programs span the range from “slow” to “fast” selections, the newprogram spreads the selections over the categories more evenly. As a whole. thenew program is much more stim~llating than the previous one; onlv two selectionsi n the previous program were “bright” or “fast, ” but more than h& of the new pro-gram falls in these classes.
The findings of the previous study showed clearly that subjects perform betterwith an ascending order of selections -- one which becomes gradually more andmore stimulating. Therefore O’Neill arranged the 23 selections In the new progralminto an ascending order,
Muzak played each selection from a disc and copied it onto a 7 1/2 inch persecond full-track tape recording, which was used as a master in preparing processedtapes for the experiment,
The details of tIIc new program developed for this experiment are shown inTable 2.
4
TABLE 2
Program of Musical Selections and Stimuli
Music Program Stimuli
Start Stimulus
Time Selection Time Tube
:002:215:398:40
11:40
14:3417:2320:1222:3125:19
27:5830:0833:0235:5138:06
41:2243:4046:0148:0550:23
52:3754:4157:12
59:32
This is My Song:::sUmy
Born Free‘:<Moreand MoreSo Nice
*ode to Billy JoeIncense and Peppermints
‘;’Music to Watch Girls By
Hallelujah, Baby*Please Wait
Magnificent Seven‘~~e Man who Took the Valise
Don’t Sleep in the Subway‘:Up, Up, and AwaySamba Orfeu
‘:<Only Love MePuppet on a String
‘%tout Hearted MenBrasilia
‘~Nancy Knows
Brasileando‘<IfYou ’11Just Come Back to Me
I ‘ve Got Rhythm
(End of program)
1:405:09
9:2513:16
18:3821:02
26:25
28:58
33:5237:55
42:2944:36
49:2552:13
55:3159:12
2I
33
41
1
2
21
42
43
34
* Starred selections were filtered to restrict frequency range(see text).
Frequency Range
The independent variable was the music’s frequency range. Altm-nateselections -- those which would have even numbers, as starred in Table 2 -- werefiltered electronically to remove :i subst:lntia 1 portion of the high-frequency ran~c.
Odd-numbered (unstarred) SCICCIions were not sut>jected to any deliberatefrequency restriction. lIowever. dle tape speed of l-be cartridge svstcm itself, aswell as degradation during copying the master [-ape onto tt}e cartridge, necessarilyproduced some attenuation at high frequencies. This effect was :~ssessed under thesame conditions the music ~vould he subject to, by recording constant -intensih~ sinewaves on a cartridge. plaving thenl back, and measuring the output level for eachfrequency. These calibrations showed that the system’s overall frequenc~ responsewas flat within~ 2 decibels (dII) as high as 6000 [Iertz &Iz), then began to drop.The attenuation was 7 d13at 8000 }lz, and 19 dB at 10,000 Hz. TIIUS the lVidc-R~nge
svstem was flat to 6000 Hz, and it produced usable response at 8000 Hz. Thisfrequency range is approximately that used for speech tracks in motion pictures,]irhich are filtered at 8000 Hz. It is considerably wider than amplitude -modu Lztionradios, which are usually limited to 5000 Hz.
Because subjects heard unfiltered and filtered selections alternately. i t wasimportant to choose a filter which could restrict the frequency range without intro-ducing distortion, phase shift, and other contaminants which might draw a subject’sattention to its action. After listening to several filters with various high -frequencvcut-offs, we chose a Gramer Transformer Corporation No. 4231Y17 filter. Thisunit has a nominal passband of 300-3500 Hz ~ 1.5 dB, with rejection of 50 dB ormore at 5000 Hz and above. Since loading affects a filter’s frequencv response,the Human Engineering Laboratories’ Acoustical Research Branch calibrated thefilter with the input and output loads that were used. Its frequency response Wrasthen flat within: 2 dB between 400 and 3600 Hz, attenuating 4000 Hz by 20 dJ3. .lnd5000 Hz by more than 50 dB. Low-frequency response began decreasing at 800 Hz,reaching a 10-dB drop at 90 Hz.
For practical purposes, then, the Filtered condition removed all frequenciesabove about 3600 Hz. while the Wide -Rarge system reproduced somewhat more thananother octave of high frequencies. The filter’s high-frequency limit, which isroughly the same as with an ordinary telephone. may appear drastic. However,actual pilot tests with listeners who were not familiar with the selections showedthat they did not detect any difference between adjacent selections.
The filter was connected to a Ioggle switch, so it could be switched into andout of the circuit noiselessly.
The master tape which Muzak had prepared was pla ycxi through (or past) thefilter, electronically compressed into a dynamic range of 20 dIl to restrict variationsin physical intensity, and recorded on a 1163-foot Fidelipac tape cartridge at 3 3/4inches per second. The filter was switched into the circuit before each starredselection, then switched off again at the end of the starred selection.
During the experiment, the subjects heard the music program over their loud-speakers. The loudness of the music at the subjects’ ear positions ranged between55 and 65 dB ~ 0.0002 microbar, as measured with a Bruel and Kjaer type 2203Precision Sound-Level Meter.
Vigilance Task
This experiment used the same modified vigilance boxes as the precedingstudy (4). Briefly, each subject saw four 6E5 “magic-eye” tubes, mounted 1 1/2inches apart (Fig. 1). The control grids of these tubes were normally grounded,giving a wide shadow at the bottom of the tube (from left to right, Tubes 1, 2, and4). To display a stimulus, the tube’s grid was biased with a 1-1/2-volt battery,narrowing its shadow to about half its normal width (see Tube 3 in Fig. 1).
Immediately below each stimulus tube, there was a pushbutton. The stijectswere instructed to press these buttons to show they had perceived a stimulus.
The intervals between stimuli depended on several restrictions. It was stipu-lated that 16 stimuli would be given during the one-hour session, spaced no closertogether than 1 1/2 minutes, and no farther apart than 5 1/2 minutes. The experi-mental conditions for stimuli (Wide-Range vs. Filtered music) were counterbalancedwithin =ch quarter hour of the session. During each quarter hour, the first andfourth stimuli appeared during Wide-Range selections, and the middle two duringFiltered selections. The exact stimulus times were varied unsystematically sosubjects could not learn to anticipate them.
The sequence of the four display tubes was determined from a table of randomnumbers, with the stipulations that a given stimulus must not occur more than twicein a row, and that each stimulus must occur about equally often. As a matter of fact,the random sequence exactly fulfilled both of these conditions.
The stimulus t ilmes and sequences are listed, in relation to the music program,in the third and fourth columns of Table 2.
s
Control and Data -R ccording Iiqu ipment
The music program WLISrecorded on one track of a magnetic-tape cartridge.Two tones. recorded on another track of the same cartridge, controlled stimulusselection and presentation outonmtically. This i]rrangcment g[mranteed that fl~estimuli were always given in the same order and :]t exactly the same points in IIIC *music program.
The subjects’ response tilmes were recorded on four [racks of a magnetic tape.one track corresponding to each of the four booths. A timing tone of known frequencywns gated onto the tape when stimuli were presented. and turned off when a subjectpressed the correct pllshbutton. Later, these tone bursts were played back into tinelectronic counter. The cycle counts, when divided by the timing-tone frequency.gave response times correct to the nearest millisecond.
This apparatus has already been described in detail elsewhere (4).
Procedure
The subjects were tested in groups of three or four, each in a separate boodl,All of the experimental sessions were scheduled to begin at three o ‘clock. to mini -mize any effects that differing times of day might have on a subject’s alertness.
To assure that every subject received exactly the same instructions. they wererecorded on a separate tape cartridge, complete with control tones that selected andpresented two stimuli to illustrate the directions. After each subject was seated inhis booth at the beginning of the experimental session, he heard these instructionsover his loudspeaker: $
Modern missile systems are becoming more and more automated,Once a target has been detected, the system practically runs by itself --it can track the target automatically, compute its course, and fire at ituntil it has been destroyed, But soldiers still have to keep watch on radarscopes to delecr targets in the first place, and to decide which targets mfire at. Th 1+ cxperirnent will measure how well you can detect targetsignals.
The im,s I ]i front of you has four electronic tubes in it. represcnringthe four Seciors d target can tipproach from. Notice tha t each tulm fi’1s :~wide shadow :1\ I he bottom -- this means there aren’t any rargets in thatsector.
9
Now if a target does appear, one of the shadows will narrow toabout half the size it is now. Watch . (Stimulus appeurs. ) When ashadow does narrow, you should push the button under Ihul tube.Push it now. (Pause)
This is how you tell the computer to track in Lhti{ sector. Noticethat. when you push the button, the shadow widens hack to its normalsize as the computer Mkcs over.
When you see a target, push the button firmly until you hear )tclick, and then hold it down for a moment until you see the shadowgo back to normal. Let’s try it again for practice, to see how fastyou can react. (Second stimulus appears. )
The important thing is pushing the button fast. Try to push thebutton just as quickly as you can when you see a target, because you’rebeing scored on how fast you respond. But be careful not to press thebuttons unless you do see a target. If you press a button when thereisn’t any target, that counts against you as an error.
Notice, too, that your booth is soundproofed, so you won’t bedistracted by hearing people talking, telephones ringing, and thingslike that. We have to use soundproofing to keep these noises undercontrol. Our first subjects complained the booths bothered thembecause they were unnaturally quiet, so now we counteract that byplaying background music.
Remember, when you see a target, press the button just asquickly as you can. H you have any questions, open your door and
ask them now. If not, begin watching for targets as soon as themusic starts playing.
10
A short time wtis allowed to give the subjects an opportunity to ask questionsif they wanted to. but no subject requested further instructions. The mUSi C progranlitself began within a minute after the instructions were completed.
Although the subjects were told they would be penalized for responding whenthere was no stimulus, such responses were not recorded, This instruction wasgiven mainly to discourage subjects from holding buttons down continuously.Observation through the booths’ one-way windows showed that subjects virtuallynever pressed buttons unless there was a stimulus.
At the end of the session, the experimenter asked the subjects rather vaguequestions, such as, ‘What do you think the experiment was about?” Although mostsubjects were willing to hazard a guess, none of them was ever able to verbalizethe hypothesis under test. The subjects’ comments indicated they were totallyunaware that the music’s frequency response had changed.
11
RESULTS AND DISCUSSION
Response Measures and Criteriu
In comparing thu w:)ys that l\’lde-Range and Filtered nlllsic :Iffectwd the S(!I>ICCIS’alertness, ~ve will List? tile same three criteria developed in the preceding stud J :mean response times, variabilities. and intrasubject reliabilities. #
If Wide-Range music is truly more stimulating, its effect should be reflected
in faster response times.
Although there were differences among means in the previous study, the pro-grams had a much more pronounced effect on variability, 1Ience lf tile music’sfrequency response is an important variable, the Wide-Range music should alsonurrow the variability of response times.
Finally, the subjects’ reliabilities -- the extent to which tiey retain theirplaces in the rank order of response times throughout the hour -- proved to be asensitive index of differential effects. First, if either condition affects the subjects
consistently throughout the hour, the quarter-hour means for that condition shouldshow correlation with each other. Second, if Wide-Range music and Filtered musicaffect subjects differently, there should be little correlation between performanceunder the two conditions.
Thus a music program would have greatest practical efficacy if it producedthese three effects:
1. Shorter mean response times.
2. Less variable response times (smaller variances).
3. Higher individual reliabilities (larger correlations betweena subject’s performance during different time periods).
12
Mean Response Times
As in the previous studies, the number of stimuli was selected so individualresponse times could lx pooled to get more stable estimates of the pa ramet.er, bygiving accidental fluctuations an opportunity to offset each other. Statisti tally,this treatment has the added advantage that it reduces the skewness of individualresponse-time measurements. yielding a more nearly normal distribution whichcan be analyzed with parametric methods.
Therefore a total of 16 stimuli was arranged so there were four in eachquarter hour: two during Wide-Range selections, and the other two during Filteredselections. While i t would have been desirable to give still more stimuli undereach condition, it seemed more important to preserve the task’s realistic monotonyby spacing the stimuli at about the same intervals as in the previous studies.Consequently, a subject’s quarter-hour means for each condition are somewhatless stable than before, because they are based on two measures, rather thanfour.
Within each quarter hour, the conditions were counterbalanced to assurethat progressive response changes, such as fatigue and boredom, would have thesame net effect on the Wide-Range condition as on the Filtered condition, Thusthe means for the two conditions were comparable during each quarter hour,
Table 3 gives the quarter-hour means for Wide-Range and Filtered conditions.Consistently, in each quarter hour, the mean response time was faster with Wide-Range music than with Filtered music. The probability that this would occur bychance is the same as the probability of flipping four unbiased coins and gettingfour heads -- i.e. , one chance in 24, or one chance in 16, Since this is thesmallest probability possible with four such events (~= , 063), it is interpretedas indicating that the subjects responded significantly faster with Wide-Rangemusic than with Filtered music,
Furthermore. even the slowest quarter-hour mean for Wide-Range music(. 936 second) was faster than the fastest one for Filtered music (. 962 second).All four means for the Wide-Range condition were faster than any of those in theFiltered condition. This finding verifies the prediction based on O’Neill’s theory;the music did mainf ain alertness better when it had a wide frequency range and,as a result, more variation in instrumentation.
Comparing the !WOmeans for individual quarter hours, the Wide-Range andFiltered conditions differed very significantly during the second quarter hour~=2.44, ~= .0073). The difference between conditions also verged on significanceduring the first quarter hour ~ = 1.44, ~ = . 076). Although the third and fourthquarter hours did differ in the predicted direction, these mans, taken individually,did not differ enough to reach statistical significance.
13
TAIILE 3
Mean Response ‘[’imcx (Seconds) ond \~:~riancesfor Wide-R~nge .lnd F II(crcd Selections. hy ~jlt:lrf~~r 1kmrs
It seems noteworthy that even the slowest quarter-hour mean in thls cxpuri -ment (1. 106 second) was faster than the fastest one in the previous studv (1. 121second). Since the conditions of the two experiments differed in severa 1 ~i’:1}s,this improvement cannot be attributed conclusively to anv onc varlahle. It s cemslikewise inappropriate to compare the results statistically. Nevertheless. !Ilc Ilvosituations were generally comparable, and both used enough sub Iects 10 :[ss~mereasonably stable estimates of the population means. The lmost ilnportn nt dlffurencebetween the two experiments is that the new program. used here, includcd far lnorcselections rated “bright” and “fast, ” and only one judged “slow.” ~llls it s~emseminently reasonable to attribute the improvement in performance here l-o the ll~orc-stimul.sting musical program.
The trend of quarter-hour means within the Filtered condition was not .1norderly one: these response tilmes were somewhat longer during tile first 11’llfhour, and particllla rl)- long during the second quarter hour. These degradedresponse times represent the ]vell - known vigilance decrement, which ~Tic~llyappears after about I]alf an hour a [ :1)c monotonous task. Note. howcwer. that thelongest response times occurred d~!r]nq the second quarter hour. In the prmriolfsstudy, using a less- st~mulating mi[sicul program. response tirncs were IOW’USIduring the third q~u]rter hour. .lppI revtly the new musical progr:~m. ~rit.11jzreaterstimulation, partially offset the vigilance decrement. The second-quarter decre-ment seen here might he reduced even further by increasing the program’sstimulation values during the second quarter.
14
In fact, the unfiltered condition seemed to do exactly that. The means forquarter hours indicate that Wide-Range music afforded greater stimulation thanFiltered music. Correspondingly, the trend of the Wide-Range means was asteady progression, with e~ch quarter slightly slower than the one before it; theabrupt vigilance decrement vanished completely.
Altogether, these results virtually specify the program of stimulation whichwill give best performance at tasks like the one used here. In the previous study,the ascendiqg program’s stimulation values increased very gradually during mostof the hour, finally rising sharply in the last few minutes. The present study,using greater average stimulation values and a more-nearly linear increase,reduced response times considerably and smoothed out the third-quarter vigilancedecrement. However. the means still showed s]mall, though steady, increasesduring the hour. As a hypothesis for further experiments, it might prove effectiveto increase stimulation even more sharply during the first half hour, and then moregradually thereafter.
In summary, the quarter-hour means unmistakably demonstrate that Wide-Range music is more stimulating than Filtered music, affirming that instrumen-tation does affect alertness at the vigilance task. Furthermore, the means fromthis study and the preceding one strongly suggest that making the program morestimulating has directly improved the subjects’ response times.
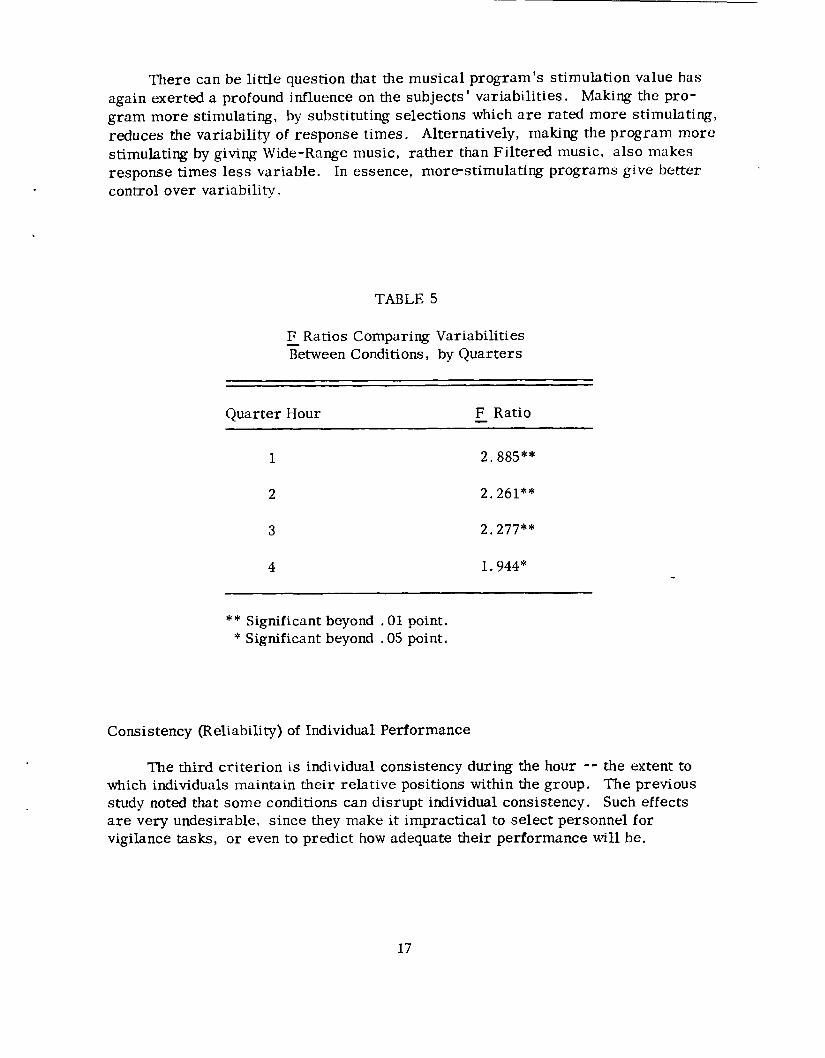
Variability of Response Times
An unexpected finding in the previous study was the dramatic effect themusical program exerted on the subjects’ variability. This area deserves carefulscrutiny, since minimizing variabilities offers a most attractive opportunity toimprove the predictability of behavior.
Variances for each of the conditions, by quarter hours, have already beenpresented in the fourth column of Table 3. Both conditions showed the same regulartrend: the subjects became progressively more variable during the hour. The ~ratios in Table 4 evaluate the significance of this increasing variability for eachexperimental condi ti on. These ~’s reveal that, of the three pairs of adjacentquarters, two show significant increases in variability with the Wide-Range con-dition -- perhaps because its initial variability was so small -- although none ofthe pairs of adjacent- quarters differed significantly with the Filtered condition,The remaining three comparisons involve quarter hours which are temporallyseparated from each other; all three pairs cliffered significantly, for both con-ditions. Clearly. the subjects did become more variable as the hour wore on.
15
TABLE 4
~ Ratios Comparing Variabilities IkJhveen Quarters of Program
The Wide-Range condition gave considerably smaller variances than theFiltered condition did. As a matter of fact, only the last quarter of the Wide-Range condition was as variable as the very first quarter of the Filtered condition,The F ratios in Table S test the statistical significance of these differences.Subje~ts were very significantly more variable in the Filtered condition during thefirst three quarters, and significantly so during the last quarter. Thus the subjectswere always significantly less variable with Wide-Range music than they were withFiltered music.
We may also compare these variances with those engendered by the less-stimulating ascending program in the previous study. With the previous program,the overall variance was .384 -- almost exactly twice the variance of the most-variable quarter in Ihis study. Even during its least-variable quarter, the previousprogram produced a variance of . 156. which is greater than three of the Wide-Rangequarters here.
16
There can be little question that the musical program’s stimulation value hasagain exerted a profound influence on the subjects’ variabilities. Making the pro-gram more stimulating, by substituting selections which are rated more stimulating,reduces the variability of response times. Alternatively, making the program more
stimulating by giving Wide-Range music, rather than Filtered music, also makesresponse times less variable. In essence, morestimuIating programs give better ~control over variability.
TABLE 5
~ Ratios Comparing VariabilitiesBetween Conditions, by Quarters
Consistency (Reliability) of Individual Performance
The third criterion is individual consistency during the hour -- the extent towhich individuals maintain their relative positions within the group. The previousstudy noted that some conditions can disrupt individual consistency. Such effectsare very undesirable, since they make it impractical to select personnel forvigilance tasks, or even to predict how adequate their performance will be,
17
As before, individual consistency has been evaluated with Spearman rhocorrelation coefficients, colmpari~ the subjects’ perform~ nce during quarter hoursof the same experimental condition (Table 6). With the Wide-Range music, five of
the six rhos reached significance. and two of them were vcr y significant (~ lessthan . 01). These results indicate that ti]e subjects did respond consistently whilelistening to Wide-Range music.
TA13LE 6
Correlations Ikhvwn Response Times for Quarter 1[oursJYithin dle Same Condition
Parenthetically, we should note that the correlations between quarters aresmaller here than in the previous study. The alternation behveen lYide-Range andFiltered conditions. analogous to the Increasingly Variable program used before,may well have reduced these corrclntions below those characteristic of anuncomplicated ascending program.
With Filtered mllsic, only onc of the six rhos was statistically significant.Apparently the effect of Filtered music varies considerably during the hour, sothat it becomes difficult to predict whether a person will do poorly or well.
18
,
t
Since it is known that subjects stay more alert in some quarters than in others,we might reasonably expect their alertness to depend mostly on time of the hour,regardless of whether they are listening to Wide-Range or Filtered music. Therhos in Table 7 correlate the two conditions for each quarter. The coefficient forthe third quarter hour is very significant, but the other three do not differ signifi -
cantly from zero. This finding contradicts our expectation: variations in alert-ness depended mostly on the music’s frequency range, rather than on time of thehour.
TABLE 7
Correlations Between Response TimesUnder Wide-Range and Filtered Conditions, by Quarters
CorrelationQuarter Hour Coefficient
1 +. 183
2 +. 164
3 +. 416**
4 +, 202
** Significant beyond .01 point.
Thus the individual-consistency criterion leads to the same conclusion as theother two indices: the music’s frequency range does affect performance at thevigilance task, and Wide-Range music gives better alertness than Filtered music.
19
Conclusions
The three criteria agree In dcmonstr;lting tllut Wide-Range m~lsic nmintaimthe promptness of response Iimes signlfic:intly hettcr IIlun Filtered music. Thisfinding means that the nlusic’s Ins fru]ncntat ion, WIIICII was controlled throughfiltering, does affect perfornmncc. TIIus it validates :Inotller aspect of () ’Ncill’stheoretical position and bro:]dcns tl]c scientific basis for nl:lnipulatirg instrurncnt2-tion JS one means of ]ll:lint~ining (he human opurtitor’s alcrlness. In addition. Ihcresults imply that realizi~ music’s full potential for Improving performance willrequire good audio equipment which can reproduce In extended frequency range.Speech-range audio systems -- such as intercoms. ~vitll tllcir restricted frequcncvro nges -- will be significantly less effective.
20
SUMMARY
1. This experiment aimed to determine whether the instrumentation of amusical program affects response times on a vigilance task. Instrumentationwas varied by restricting the music’s frequency range, thus eliminating manyof the overtones that determine a sound’s timbre.
2. Forty-one subjects worked at the task for one hour while listening toa program of 23 musical selections. The first selection (and other odd-numbered selections ) were played with a wide frequency range. Even-numberedselections were filtered to remove frequencies above 4000 Hertz (Hz), and togradually attenuate low-frequency response below about 800 Hz.
3, Response times were averaged for each of the two conditions, byquarter hours. The subjects responded consistently -- and signifimntly --faster with Wide-Range music than with Filtered music. All four Wide-Rangemeans were faster than the shortest Filtered mean.
4. AS in the previous study+ the musical program affected variabilitieseven more extensively than means. For every quarter hour, the subjectswere significantly less variable when listening to Wide-Range music. Forthree of the four quarters, variability with Wide -Range music was lower thanit ever was with Filtered music,
5. While listening to Wide-Range music, the subjects showed significantlygreater consistency, as measured by rhos correlating mean performance duringquarter hours. Five of the six pairs of quarters were correlated significantlyor very significantly during Wide-Range music, but only one pair showed asignificant correlation during Filtered music.
6, The Wide-Range and Filtered conditions appeared to have differenteffects on the subjects, since three of the four quarters showed no significantcorrelation between the two conditions. Thus response times depended moreheavily on the experimental conditions than on time of the hour.
7, All of these results demonstrate that the music’s instrumentationdoes affect alertness significantly, and that an extended-range audio systemis required to take full advantage of instrumentation as a tool for maintainingpeak alertness.
8. The new program of music used here was designed to give considerablygreater stimulation than the one used previously. Its greater stimulation valuesprobably account for generally faster responses and lower variability than in theprevious study.
21
1. Bell Telephone hboratories. The science of sound.New York: Folkw:Lvs Records ,~59,
.—
2. 0’Neill, D, M. hflusic to enhance the v,ork cmviromncnt.Mglmt. of Pers. Quart. , 1966, ~. 17-23.
3. Wokoun, W. Vigilance with background music,Technical hfemorandum 16-63, U. S. Army 1IumanEngineering T~boratories, ,Iberdeen Proving Ground.Md. , August 1963.
4. Wokoun, W. Effects of music on work performance.—. —— —Technical Memorandum 1-68, U. S. ,\rmy lHumanEngineering Laboratories, Aberdeen Proving Ground,Md. , January 1968,
22
I !q, (KA hl~lteriel Command, Wash, DC\~l[:R [.(l Jr.ThOOl~S,Ofc1{.,s & IA})S) I
t)57(~ ANIRL (MRHER/Batc~) Ificj71) ,A\~R1. (hl Kl[E/Warrick) I
Wrtght -P,itterson AFB Ohio
l:ltctr,mic Sys Div (AFSC)S, wntlfic & Tech M() Div (I; ST1)I,. (;. ILlnscom Ficl{i, !htfor[{, L!ils< I
I
2[1
~
1
I
I
I
2
I
I
I
I
I
I
I
I
[UnclassifiedSecudty Classification
DOCUMENT CONTROL DATA - R 6 D(Security classificmlioII cl flfle, body efabatracf ar8dr<!+exing ar,n01at10nmusf be ●tered when the ow,=llrepot( Is cta*a:fl*d)
ORIGINATING AC TIVITV (Co fporate author> !2a. REPORT S13CURITV CLASSIFICATION
This document has been approved for public release and sale; its distribution is unlimited.Released to Department of Commerce for sale to the public.
Il. SUPPLEMENTARY NOTES
7
12. SPONSORING MILITARY ACTIVITY
3. ASISTRACT
This experiment tested whether music’s instrumentation affects response times on avigilance task. Instrumentation was varied by restricting the frequency range, thus elim -inating many of the overtones that determine timbre. Forty-one subjects worked at thetask for one hour while listening to a program of 23 selections, altermtely Wide-Range andFiltered. The subjects showed significantly better alertness during the Wide -Range condi -tion throughout the hour. The Filtered condition gave slower responses, greater variability,and inferior individual consistency. Hence the music’s instrumentation had several signifi-cant effects on alertness. In addition, the more-stimulating musical program here appearedresponsible for faster responses and lower variability than in the preceding experiment.
)D 9’Z..I473 O.BOL.T. . . . ARMV. . . .nEWLACRS 00 VORAI 1478, I JAM ●4, WMICM IS