25
Inception Workshop on Mainstreaming Gender into Trade Policy 21-22 April 2009, Addis Ababa Overview of Intra-African Trade By Daniel A. Tanoe NEPAD & Regional Integration Division, ECA

Inception Workshop onMainstreaming Gender into Trade Policy
21-22 April 2009, Addis Ababa
Overview of Intra-African Trade
By Daniel A. Tanoe
NEPAD & Regional Integration Division, ECA
Introduction
OUTLINE
Importance of Intra-African trade Africa’s export and import patterns Challenges of intra-African trade Some basic facts on Informal sector trade in
Africa

Why intra-African trade is important
AU vision - A common continental market for goods and services.
Common Market makes sense for Africa’s 53 mostly small economies.
Trade as an engine of growth
More trade within Africa – Retention of wealth

Africa’s export and import patterns
Africa's export and import patterns by RECs (Regional Economic
Communities)
Africa’s export and import patterns
Exports0
5
10
15
20
25
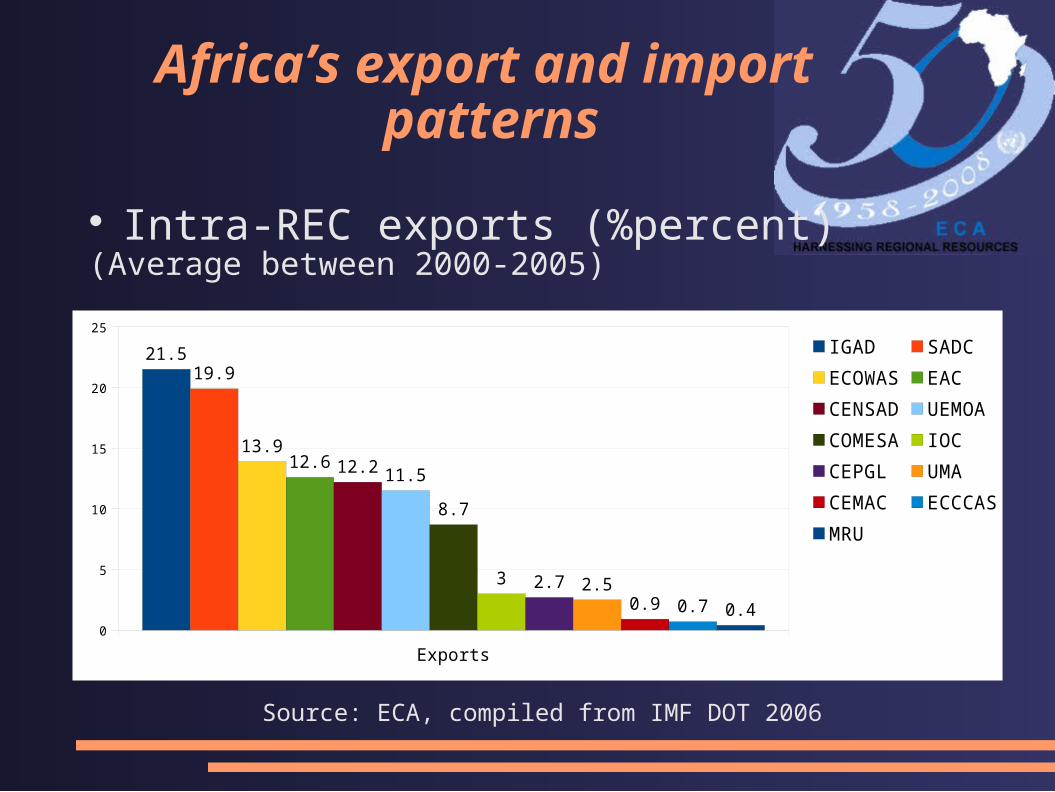
21.519.9
13.912.6 12.2 11.5
8.7
3 2.7 2.50.9 0.7 0.4
IGADSADCECOWASEACCENSADUEMOACOMESAIOCCEPGLUMACEMACECCCASMRU
Intra-REC exports (%percent)(Average between 2000-2005)
Source: ECA, compiled from IMF DOT 2006

Exports to the rest of Africa (%)((Average between 2000-2005))
Source: ECA, compiled from IMF DOT 2006
Exports0
2
4
6
8
10
12
14
16
18
2018.6
8.6
7.2
5.8 5.54.7 4.5 4.5
3.9
2.7 2.3 2.2 1.8
UEMOACOMESAEACIGADECOWASCEPGLUMACENSADMRUCEMACSADCECCCASIOC
Africa’s export and import patterns

Intra-REC imports (%)(Average between 2000-2005)
Source: ECA, compiled from IMF DOT 2006
Imports0
5
10
15
20
25
30
35 33.1
18.7
15.8 15.2 14.913
11.1
5.23.8 3.6 3.1
1.6 1.3
SADCEACECOWASIGADUEMOACENSADCOMESACEMACECCCASIOCUMACEPGLMRU
Africa’s export and import patterns

Imports from Rest of Africa (%)(Average between 2000-2005))
Source: ECA, compiled from IMF DOT 2006
Imports0.0
5.0
10.0
15.0
20.0
25.0
30.0
35.0
40.0
35.5
17.215.1
14 13.7
9.9 9.4 8.9
6.45.2
3.62.6 1.7
CEPGLCOMESAIOCECCCASUEMOAEACMRUCEMACCENSADECOWASIGADSADCUMA
Africa’s export and import patterns

Africa’s export and import patternsGrowth trends
2000 2001 2002 2003 2004 2005
75
100
125
150
175
200
225
Intra-REC indices of export trends(base year = 2000)
CEMACCEPGLCOMESACENSADUEMOAIGADIOCECOWASSADCUMAEACECCASMRU
Africa’s export and import patterns
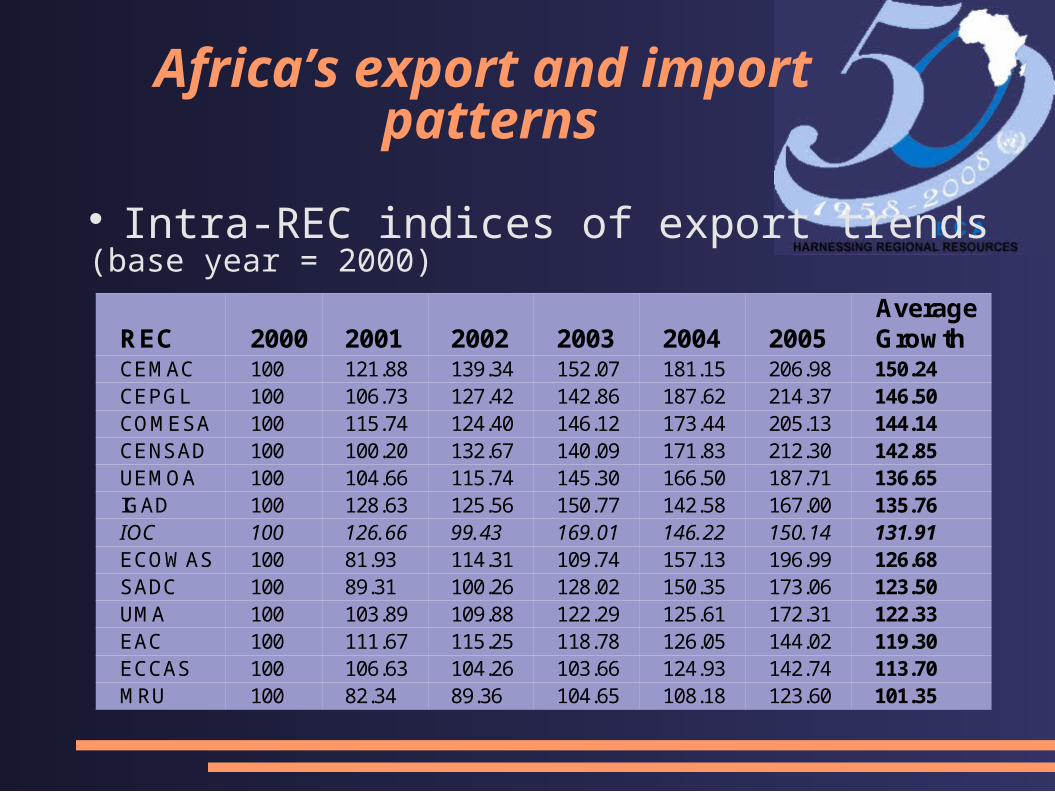
Intra-REC indices of export trends(base year = 2000)
REC 2000 2001 2002 2003 2004 2005CEMAC 100 121.88 139.34 152.07 181.15 206.98 150.24CEPGL 100 106.73 127.42 142.86 187.62 214.37 146.50COMESA 100 115.74 124.40 146.12 173.44 205.13 144.14CENSAD 100 100.20 132.67 140.09 171.83 212.30 142.85UEMOA 100 104.66 115.74 145.30 166.50 187.71 136.65IGAD 100 128.63 125.56 150.77 142.58 167.00 135.76IOC 100 126.66 99.43 169.01 146.22 150.14 131.91ECOWAS 100 81.93 114.31 109.74 157.13 196.99 126.68SADC 100 89.31 100.26 128.02 150.35 173.06 123.50UMA 100 103.89 109.88 122.29 125.61 172.31 122.33EAC 100 111.67 115.25 118.78 126.05 144.02 119.30ECCAS 100 106.63 104.26 103.66 124.93 142.74 113.70MRU 100 82.34 89.36 104.65 108.18 123.60 101.35
AverageGrowth
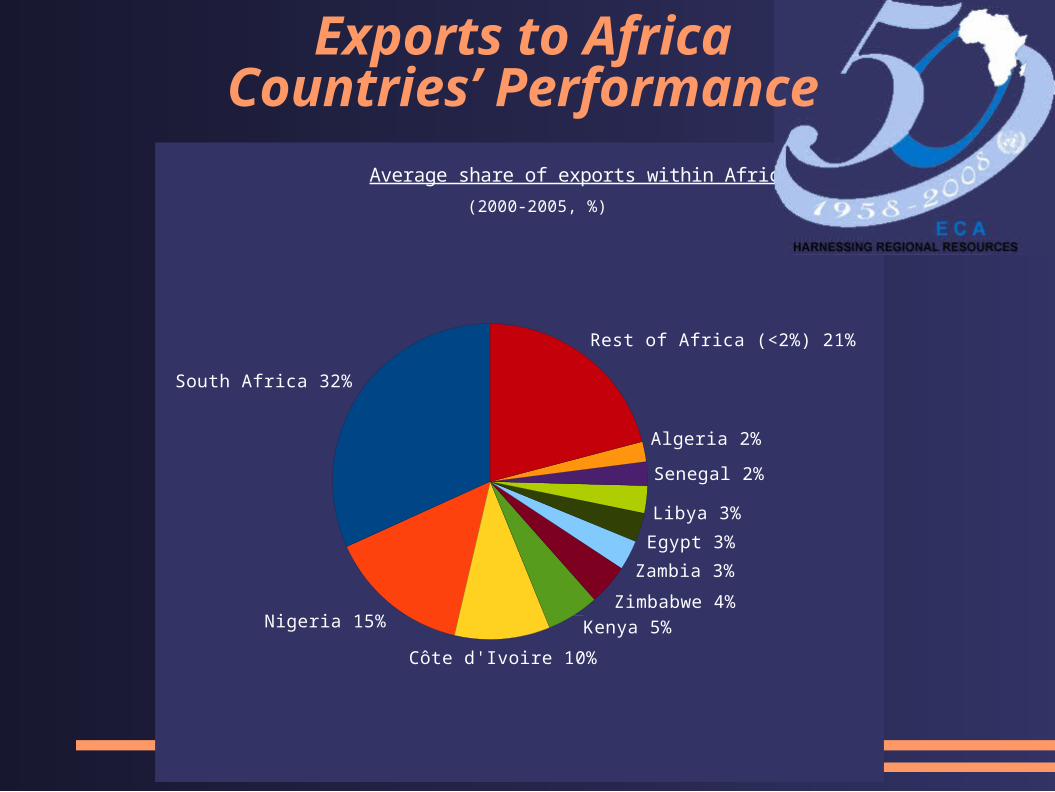
South Africa 32%
Nigeria 15%
Côte d'Ivoire 10%
Kenya 5%
Zimbabwe 4%
Zambia 3%
Egypt 3%
Libya 3%
Senegal 2%
Algeria 2%
Rest of Africa (<2%) 21%
Average share of exports within Africa
(2000-2005, %)
Exports to AfricaCountries’ Performance

Exports to Africa
Countries’ Performance Share of exports within Africa (%)(Average between 2000-2005
Country Exports Country Exports Country Exports Country ExportsSouth Africa 31.79 Togo 1.21 Congo, Rep. 0.37 Sierra Leone 0.05Nigeria 14.56 Tanzania 1.17 Congo, DR 0.34 Burundi 0.04Côte d'Ivoire 9.86 Uganda 1.1 Guinea 0.28 Rwanda 0.04Kenya 5.36 Djibouti 1.09 Burkina Faso 0.27 C.A.R. 0.04Zimbabwe 4.19 Mauritius 0.98 Madagascar 0.23 Cape Verde 0.00Zambia 3.07 Ghana 0.94 Sudan 0.18 Comoros 0.00Egypt 2.97 SACCA 0.92 Mali 0.11 São Tomé&P. 0.00Libya 2.79 Benin 0.8 Equatorial Guinea 0.08 Total 100Senegal 2.45 Gabon 0.8 Liberia 0.08Algeria 2.05 Mauritania 0.75 Seychelles 0.07 Source: ECA, compiledMorocco 1.86 Angola 0.69 Gambia 0.06 from IMF DOT 2006Tunisia 1.58 Malawi 0.58 Guinea-Bissau 0.06Cameroon 1.55 Ethiopia 0.51 Somalia 0.05Mozambique 1.49 Niger 0.5 Chad 0.05

South Africa 8%
Zimbabwe 7%
Zambia 6%
Ghana 6%
Côte d'Ivoire 6%
Nigeria 5%
Mali 5%
Mozambique 4%Morocco 3%Angola 3%
Kenya 3%Egypt 3%
Tanzania 3%
Uganda 3%
Libya 3%
Congo, DR. 3%
Senegal 3%
Cameroon 2%
Malawi 2%
Mauritius 2%
Rest of Africa (<2%) 18%
Average share of imports within Africa
(2000-2005, %)
Imports from AfricaCountries’ Performance
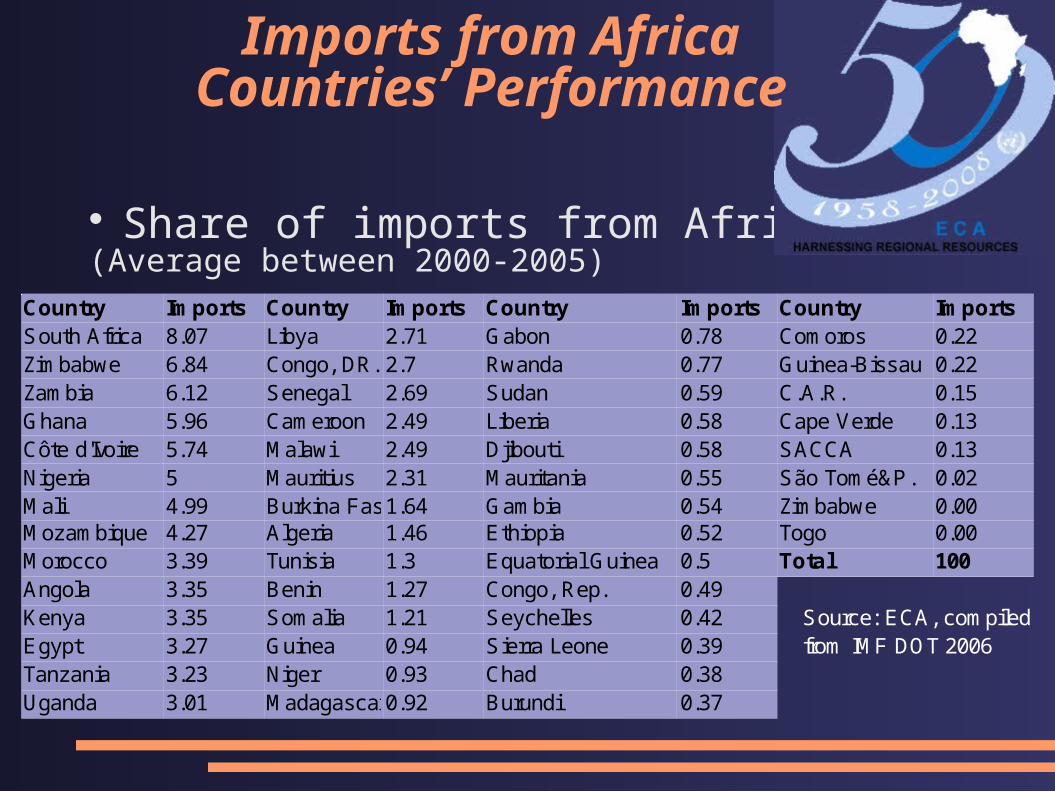
Share of imports from Africa (%)(Average between 2000-2005)
Country Imports Country Imports Country Imports Country ImportsSouth Africa 8.07 Libya 2.71 Gabon 0.78 Comoros 0.22Zimbabwe 6.84 Congo, DR. 2.7 Rwanda 0.77 Guinea-Bissau 0.22Zambia 6.12 Senegal 2.69 Sudan 0.59 C.A.R. 0.15Ghana 5.96 Cameroon 2.49 Liberia 0.58 Cape Verde 0.13Côte d'Ivoire 5.74 Malawi 2.49 Djibouti 0.58 SACCA 0.13Nigeria 5 Mauritius 2.31 Mauritania 0.55 São Tomé&P. 0.02Mali 4.99 Burkina Faso1.64 Gambia 0.54 Zimbabwe 0.00Mozambique 4.27 Algeria 1.46 Ethiopia 0.52 Togo 0.00Morocco 3.39 Tunisia 1.3 Equatorial Guinea 0.5 Total 100Angola 3.35 Benin 1.27 Congo, Rep. 0.49Kenya 3.35 Somalia 1.21 Seychelles 0.42 Source: ECA, compiledEgypt 3.27 Guinea 0.94 Sierra Leone 0.39 from IMF DOT 2006Tanzania 3.23 Niger 0.93 Chad 0.38Uganda 3.01 Madagascar0.92 Burundi 0.37
Imports from AfricaCountries’ Performance

Africa’s export and import patterns
Africa’s merchandise exports
43%
20%
16%
9%
12%
Total merchandise(2005)
To EuropeTo N. AmericaTo AsiaTo AfricaTo ROW
Total Merchandise
From Africa Share2005 2000 2005
To World 297.7 100.00% 100.00%To Europe 127.8 50.30% 42.90%To N. America 60.2 17.30% 20.20%To Asia 48.6 16.40% 16.30%To Africa 26.5 9.80% 8.90%
ValueIn Billion $

Fuels and Mining Products Manufactured Products Agricultural Products
From Africa Share Share Share2005 2000 2005 2005 2000 2005 2005 2000 2005
To World 194.2 100.00% 100.00% 63 100.00% 100.00% 32.3 100.00% 100.00%To Europe 74.2 45.70% 38.20% 34.5 60.10% 54.70% 15.2 50.00% 47.20%To N. America 52.9 24.70% 27.20% 5.1 8.60% 8.10% 0.02 5.00% 6.30%To Asia 33.4 18.30% 17.20% 7.7 9.80% 12.20% 0.05 18.20% 15.30%To Africa 9.4 5.10% 4.80% 11.4 16.20% 18.10% 0.06 18.70% 17.10%
ValueIn Billion $
ValueIn Billion $
ValueIn Billion $
African merchandise exports
38%
27%
17%
5%13%
Fuels and Mining Products(2005)
To Europe
To N. America
To Asia
To Africa
To ROW55%
8%
12%
18%
7%
Manufactured Products(2005)
To Europe
To N. America
To Asia
To Africa
To ROW
47%
0%
53%
Agricultural Products(2005)
To Europe
To others
To ROW
Africa’s export and import patterns
Overall Intra-African Trade Picture
Persistently small intra-African trade, consistently under 15 per cent.
Dependence on developed countries
Heavy export reliance on fuels and minerals

Challenges of intra-African trade
Highlights

African countries desirous to encourage trade among themselves;
However, on the whole, with a few exceptions, not much progress has been made on intra-African trade;
Challenges of intra-African trade

Nature of African economies /Supply side
Inadequate trade related infrastructure
Trade facilitation challenges
Challenges of intra-African trade

Informal Sector tradein Africa: Some basic facts
Mainly unregistered trade across borders based on popular demand and supply
Often referred to as illicit trade or classified as smugglers Participants and beneficiaries are usually people and communities along
border lines and adjacent areas It terms of gender, it includes both female and men of all ages Large numbers of women are often observed transporting goods on their
backs and heads across borders Such unregistered trade is often not reported in national accounts and does
not pay tax Goods traded “informally” once in the country sometimes find
themselves in licensed/registered shops by registered traders Goods traded include agricultural products, clothing, shoes, electronics Informal sector traders are often subjected to harassment by customs
officers and police, and seizure of goods Financing of informal trade is mostly through own savings and credits
from friends and relatives as bank loans are not easily accessible to small traders.

Informal sector trade (Basic Facts contd)
Century-old practice People and communities of regions want to interact and trade without
governmental interference or requirement for formal registration for such trade
Informal trade sustains livelihoods and meets basic needs Failure of state in fulfilling the needs of the poor and border communities
compels informal trade Long distances from national central markets Alternate market outlets for better prices Avoidance of heavy taxes, customs duties, levies and other charges
including solicitation of bribery by Government officials Avoidance of stoppages and searches at several road blocs that may
involve unloading and loading even of people, causing waste of time.
Magnitudes of informal sector trade:
Difficult to give exact magnitudes because of its unrecorded nature
Available data mostly based on sample case studies & estimates from particular short periods, and thus the picture is mostly incomplete.
Some estimates suggest that the value of unrecorded/informal exports could be as high as 25% of total formal exports. (e.g. Informal cross-border trade survey report by Uganda Bureau of Statistics, June 2006.
Informal sector trade (contd)
Lessons
Lower customs duties and taxes on essential commodities
Improve customs procedures and remove non-tariff barriers
Systematically include issue of informal trade in bilateral and multilateral trade discussions/forums in RECs
Bring socio-economic development to border areas and rural communities
Remove frequent road blocs

THANK YOU


