The Indiana Dichotomy: Economy Grows but Lags Nation The Indiana Dichotomy: Economy Grows but Lags Nation 1 The Hoosier Side of Louisville 3 Indiana’s Information Sector Primarily in Telecom and Publishing 6 A New Approach to City-Level Unemployment Estimates 8 Inside the Data Center 9 Getting Indiana Off the Ground 10 A State & University Partnership for Economic Development Indiana Economic Development Corporation Indiana Department of Workforce Development Indiana Business Research Center, IU Kelley School of Business inside in context INDIANA ’S WORKFORCE AND ECONOMY AUGUST 2005 T he economic expansion has picked up steam as every state in the nation experienced economic growth in 2004, according to new data released by the U.S. Bureau of Economic Analysis (BEA). Indiana’s growth, however, lagged behind the national average. These conclusions are based on preliminary estimates of gross state product (GSP), the most comprehensive measure of overall economic activity in each state. Using a prototype methodology designed to accelerate GSP estimates, the BEA data have been released a full year sooner than past GSP figures. This release estimates total state output in 2004, but estimates of output by industry for 2004 are still several months away. Indiana’s GSP in 2004 was $208.4 billion, ranking the Hoosier state 15th in the nation for total output, a position Indiana has held steadily for several years (see Table 1). To overtake Washington and move into 14th place, Indiana’s economy would have to grow by more than $30 billion per year; and the gap to 13th place, Massachusetts, is even greater at $90 billion. Looking the other direction, Minnesota and Maryland are hot on Indiana’s heels with economies less than one percent smaller than Indiana’s. Ranks: Use with Caution Indiana’s output growth of 3.6 percent over 2003 was slower than the U.S. average of 4.2 percent, ranking Indiana only 35th among the states for year- over-year economic growth (see Figure 1). A national organization focused on technology-based economic growth recently raised concerns among some Hoosier observers when it noted that Indiana ranked 43rd among the states in GSP growth. However, this ranking was based on the four-year GSP change from 2000 to 2004, which involves a very different base year for comparison than the figures cited above. In 2000, Indiana began a major decline in employment while much of the rest of the nation was still enjoying a growing economy (Figure 2). It is important to remember that rankings do not reveal the size of differences between states in (continued on page 2) State 2000 U.S. Rank 2001 U.S. Rank 2002 U.S. Rank 2003 U.S. Rank 2004 U.S. Rank United States 9,749,104 9,836,571 10,009,433 10,289,220 10,720,296 Illinois 464,257 5 465,299 5 465,826 5 470,101 5 485,231 5 Ohio 371,228 7 365,791 7 369,354 7 375,740 7 384,049 7 Michigan 337,185 9 328,228 9 333,714 9 340,972 9 345,980 9 Indiana 194,683 15 190,876 15 194,993 15 201,263 15 208,434 15 Wisconsin 176,244 19 177,842 18 181,153 19 186,350 19 194,093 19 Kentucky 112,737 28 113,530 27 116,269 27 120,508 26 124,079 27 TABLE 1: TOTAL REAL GSP (MILLIONS OF 2000 DOLLARS) IN THE MIDWEST, 2000 THROUGH 2004 Source: IBRC, using U.S. Bureau of Economic Analysis data *Not seasonally adjusted Unemployment for June 2005 Indiana’s unemployment rate for June was 5.1 percent, slightly lower than the nation’s 5.2 percent.* Compared to June of last year, Indiana’s unemployment rate has remained steady, while U.S. unemployment has dropped from 5.8 percent. For a map of the latest rates by county, visit www.incontext.indiana.edu. 2 3 4 5 6 7 8 1989 1991 1993 1995 1997 1999 2001 2003 2005 Indiana United States June of Each Year Percent Unemployed County April 2000 through July 2004 Numeric Change Percent Change Hamilton 18,026 25.9 Hendricks 10,050 25.6 Hancock 3,670 16.9 Switzerland 586 13.9 Johnson 5,684 12.6 Boone 2,127 11.9 Tippecanoe 5,920 10.1 Jasper 1,088 9.7 Clark 3,891 9.4 Warrick 1,883 9.2 Fastest Growth in Housing Units Source: U.S. Census Bureau
Transcript
The Indiana Dichotomy: Economy Grows but Lags NationThe Indiana Dichotomy: Economy Grows
but Lags Nation1
The Hoosier Side of Louisville 3
Indiana’s Information Sector Primarily in Telecom and Publishing
6
A New Approach to City-Level Unemployment Estimates
8
Inside the Data Center 9
Getting Indiana Off the Ground 10
A State & University Partnership for Economic Development Indiana Economic Development Corporation Indiana Department of Workforce Development Indiana Business Research Center, IU Kelley School of Business
inside
incontextINDIANA’S WORKFORCE AND ECONOMY AUGUST 2005
The economic expansion has
picked up steam as every state
in the nation experienced
economic growth in 2004, according to
new data released by the U.S. Bureau
of Economic Analysis (BEA). Indiana’s
growth, however, lagged behind the
national average.
These conclusions are based on
preliminary estimates of gross state
product (GSP), the most comprehensive
measure of overall economic activity
in each state. Using a prototype
methodology designed to accelerate
GSP estimates, the BEA data have been
released a full year sooner than past
GSP figures. This release estimates
total state output in 2004, but estimates
of output by industry for 2004 are still
several months away.
Indiana’s GSP in 2004 was $208.4
billion, ranking the Hoosier state
15th in the nation for total output, a
position Indiana has held steadily for
several years (see Table 1). To overtake
Washington and move into 14th place,
Indiana’s economy would have to grow
by more than $30 billion per year; and
the gap to 13th place, Massachusetts,
is even greater at $90 billion. Looking
the other direction, Minnesota and
Maryland are hot on Indiana’s heels
with economies less than one percent
smaller than Indiana’s.
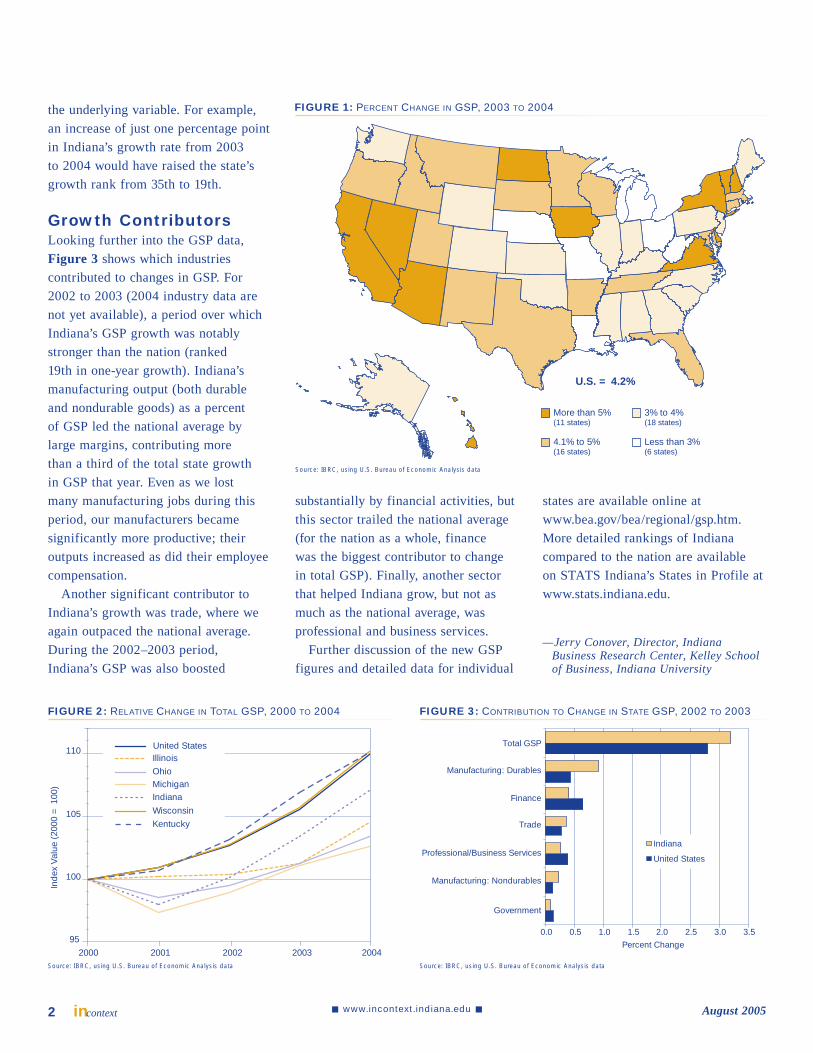
Ranks: Use with CautionIndiana’s output growth of 3.6 percent
over 2003 was slower than the U.S.
average of 4.2 percent, ranking Indiana
only 35th among the states for year-
over-year economic growth (see Figure 1). A national organization focused
on technology-based economic growth
recently raised concerns among some
Hoosier observers when it noted that
Indiana ranked 43rd among the states
in GSP growth. However, this ranking
was based on the four-year GSP change
from 2000 to 2004, which involves a
very different base year for comparison
than the figures cited above. In 2000,
Indiana began a major decline in
employment while much of the rest of
the nation was still enjoying a growing
economy (Figure 2). It is important to
remember that rankings do not reveal
the size of differences between states in
(continued on page 2)
State 2000U.S. Rank 2001
U.S. Rank 2002
U.S. Rank 2003
U.S. Rank 2004
U.S. Rank
United States 9,749,104 9,836,571 10,009,433 10,289,220 10,720,296
TABLE 1: TOTAL REAL GSP (MILLIONS OF 2000 DOLLARS) IN THE MIDWEST, 2000 THROUGH 2004
Source: IBRC, using U.S. Bureau of Economic Analysis data*Not seasonally adjusted
Unemployment for June 2005Indiana’s unemployment rate for June was 5.1 percent, slightly lower than the nation’s 5.2 percent.* Compared to June of last year, Indiana’s unemployment rate has remained steady, while U.S. unemployment has dropped from 5.8 percent. For a map of the latest rates by county, visit www.incontext.indiana.edu.
2
3
4
5
6
7
8
1989
1991
1993
1995
1997
1999
2001
2003
2005
Indiana
United States
June of Each Year
Per
cent
Une
mpl
oyed
County April 2000 through July 2004Numeric Change Percent Change
—Jerry Conover, Director, Indiana Business Research Center, Kelley School of Business, Indiana University
substantially by financial activities, but
this sector trailed the national average
(for the nation as a whole, finance
was the biggest contributor to change
in total GSP). Finally, another sector
that helped Indiana grow, but not as
much as the national average, was
professional and business services.
Further discussion of the new GSP
figures and detailed data for individual
the underlying variable. For example,
an increase of just one percentage point
in Indiana’s growth rate from 2003
to 2004 would have raised the state’s
growth rank from 35th to 19th.
Growth ContributorsLooking further into the GSP data,
Figure 3 shows which industries
contributed to changes in GSP. For
2002 to 2003 (2004 industry data are
not yet available), a period over which
Indiana’s GSP growth was notably
stronger than the nation (ranked
19th in one-year growth). Indiana’s
manufacturing output (both durable
and nondurable goods) as a percent
of GSP led the national average by
large margins, contributing more
than a third of the total state growth
in GSP that year. Even as we lost
many manufacturing jobs during this
period, our manufacturers became
significantly more productive; their
outputs increased as did their employee
compensation.
Another significant contributor to
Indiana’s growth was trade, where we
again outpaced the national average.
During the 2002–2003 period,
Indiana’s GSP was also boosted
More than 5%(11 states)
U.S. = 4.2%
3% to 4%(18 states)
Less than 3%(6 states)
4.1% to 5%(16 states)
FIGURE 1: PERCENT CHANGE IN GSP, 2003 TO 2004
Source: IBRC, using U.S. Bureau of Economic Analysis data
0.0 0.5 1.0 1.5 2.0 2.5 3.0 3.5
Total GSP
Manufacturing: Durables
Manufacturing: Nondurables
Trade
Finance
Professional/Business Services
Government
Percent Change
Indiana
United States
FIGURE 3: CONTRIBUTION TO CHANGE IN STATE GSP, 2002 TO 2003
Source: IBRC, using U.S. Bureau of Economic Analysis data
95
100
105
110
2000 2001 2002 2003 2004
Inde
x V
alue
(20
00 =
100
)
United StatesIllinoisOhioMichiganIndiana
WisconsinKentucky
FIGURE 2: RELATIVE CHANGE IN TOTAL GSP, 2000 TO 2004
Source: IBRC, using U.S. Bureau of Economic Analysis data
2
The Area
The Louisville Metropolitan
Statistical Area (metro) includes
nine Kentucky counties and
extends north of the Ohio River to
encompass Clark, Floyd, Harrison and
Washington counties in Indiana. These
four Indiana counties contribute over
236,500 people (roughly 20 percent)
to the metro’s total population, which
exceeds 1.2 million. For purposes of
this article, analysis will be focused
on the Hoosier side of the Louisville
region.
Indiana’s Clark County, home to
Jeffersonville and Clarksville, is the
second largest of the 13 counties in
the metro with a 2004 population of
100,706. Floyd County follows with
a population of 71,543. Half of that
county’s population lives in New
Albany, the largest city on the Indiana
side of the metro.
Combined, the four Indiana counties
have added about 7,000 residents
since 2000. Looking at the percentage
The Hoosier Side of Louisville
60
150
52
6031
65
71
62
462
135
11
160
111
337
6056
256
933
403
4
39
311
335
203
127
79
265
211
1638
62
135
335
66
337
111 42
52
31
31
31
64 131131
448
864
Jeffe
rson
ville
New A
lbany
Cla
rksv
ille
Salem
Galena
Sellersburg
New Washington
Memphis
Oak Park
New Pekin
Corydon
Charlestown
Saltillo
HardinsburgBorden
Livonia
Georgetown
Palmyra
Little York
Milltown
Utica
Fredericksburg
Campbellsburg
Greenville
Lanesville
Elizabeth
Mauckport
Crandall
Laconia
New Amsterdam
New Middletown
Clark
Harrison
Washington
Floyd
Washington
Trimble
Clark
HenryOldham
Harrison
Floyd
JeffersonShelby
Meade
SpencerBullitt
Nelson
14.711.1
40.1
56.6
36.0
49.9
21.717.1 17.6
23.0
117.9
48.6
0
100,000
200,000
300,000
400,000
500,000
600,000
700,000
800,000
Jeffe
rson
Cla
rk
Floy
d
Bul
litt
Old
ham
Nel
son
She
lby
Har
rison
Mea
de
Was
hing
ton
Hen
ry
Spe
ncer
Trim
ble
0
20
40
60
80
100
120
Tota
l Pop
ulat
ion
1990 to 2004
5.2
0.9
4.41.0
8.811.8
7.811.6
6.0 7.42.4
4.7
26.0
11.3
2000 to 2004Kentucky CountiesIndiana Counties
Total Population (left axis) Growth (right axis)
Percent C
hange
FIGURE 1: LOUISVILLE’S 2004 TOTAL POPULATION AND GROWTH
Source: IBRC, using U.S. Census Bureau data
3incontextAugust 2005 www.incontext.indiana.edu
growth from 1990 and
the growth from 2000,
the Indiana counties
have grown slower than
many of their Kentucky
counterparts (see Figure 1). The relatively low
growth rates in the metro’s
three largest counties
(Jefferson, Clark and Floyd)
are indicative of the strong
suburbanization trends in
less populated areas.
Population projections
from the Indiana Business
Research Center indicate
that, by 2020, the four Indiana
counties will grow 5.8 percent
(nearly 13,800 people) from current
levels. This is slower than the state’s
anticipated growth of 8.1 percent.
During this same time period, the
number of senior citizens is expected to
increase about 55 percent from Census
2000 levels; that is significantly faster
than the state’s overall rate of almost
41 percent. Meanwhile, the region is
anticipated to have noteworthy declines
in the number of school-age children
and young adults.
Major Industry NewsTable 1 shows the region’s largest
employers. Although the largest single
employer in the region is Caesar’s
Indiana, the four-county region
mirrors the state’s industrial mix, with
manufacturing (19.7 percent), retail
trade (13.3 percent) and health care
(12.1 percent) being the three biggest
industries.
Manufacturing: Major
manufacturers include Beach Mold
and Tool, JeffBoat, Discount Labels,
Pillsbury, FKI Security Group,
Gohmann Asphalt and Construction,
and Colgate Palmolive.
The June closing of the bankrupt
Tower Automotive plant in Corydon
and the resulting loss of 600
August 2005 www.incontext.indiana.edu incontext
manufacturing jobs has been a
recent shock to the local economy;
it was Harrison County’s second-
largest employer, and over half of its
employees resided in the county.1
On the upside, Canadian-based
Martinrea (fluid systems and metal-
forming) purchased Corydon’s bankrupt
Oxford Automotive plant earlier this
year, keeping about 300 jobs in the
county. In Clark County, MedVenture
Technology Corp., a Louisville firm
that designs and manufactures medical
devices, announced it is relocating
to Jeffersonville in the North Port
Business Center (one of the state’s
certified technology parks). About
70 percent of its 156 employees are
Indiana residents, and MedVenture
plans to expand to over 500 employees
in the next five years.2 Currently, the
average hourly wage at the firm is near
$24.
Retail Trade: Set to open just in
time for the holiday season, the River
Falls Mall in Clarksville will boast
Company Name Products or Services EmploymentCaesars Indiana Resort Hotel and Casino 2,560New Albany/Floyd County School Corp. School System 1,700U.S. Census Bureau National Processing Center 1,550Clark Memorial Hospital Hospital 1,500Greater Clark County School System School System 1,250Floyd Memorial Hospital & Health Services Hospital 1,200Beach Mold and Tool Plastics, Tooling, Moldings and Assembled Parts 986JeffBoat Barge Construction 886Indiana University Southeast College/University 691Discount Labels Labels Manufacturing 665Pillsbury Refrigerated Baked Goods 571FKI Security Group Fireproof Files, Safes and Security 550Gohmann Asphalt and Construction Asphalt Manufacturing 500Colgate Palmolive Dental Cream and Other Products 450Hitachi Cable Indiana Brake Hose Assembly Manufacturing 430Koetter Woodworking Wood Products 400The Medical Center of Southern Indiana Hospital 350American Commercial Lines Marine Transportation/Communication 284Green Valley Care Center Nursing/Retirement Home 258Kitchen Kompact Kitchen Cabinets 250AirGuard of Indiana Air Filter Manufacturing 235Adplex Rhodes Promotional Print Services 235Wyandot Snack Foods 230Silvercrest Children’s Development School/Residential Facility 220Clarksville Community Schools School System 217ESSROC Materials Cement Manufacturing 207
TABLE 1: MAJOR SOUTHERN INDIANA EMPLOYERS
Source: Southern Indiana Chamber of Commerce
a new $30 million Bass Pro store,
complete with its own restaurant, an
indoor archery range, an outfitting
shop for boats and a 60-foot-tall,
50,000-gallon aquarium.3 The 280,000
square-foot mega-store will be the
second-largest Bass Pro store in the
nation (behind the flagship store in
Springfield, MO). It is expected to
be a boon to the tourism market in
the area, as its seasonal seminars at
other locations have drawn as many as
30,000 to 40,000 people, and it attracts
an average of 2.8 million visitors
annually.
Health Care: As seen from Table 1, two of the largest employers in the
region are the county-owned hospitals
in Clark and Floyd counties. A growing
concern in the health care field is that
private medical facilities will siphon
the profitable procedures away from
county hospitals, along with patients
able to pay their bills, leaving the
county hospitals to treat the indigent.
In an effort to prevent this, Clark,
Floyd and Harrison counties are three
of four counties in the state to pass
moratoriums on new health care facility
construction (with Morgan County
being the fourth). Currently, those
moratoriums, except for the one in
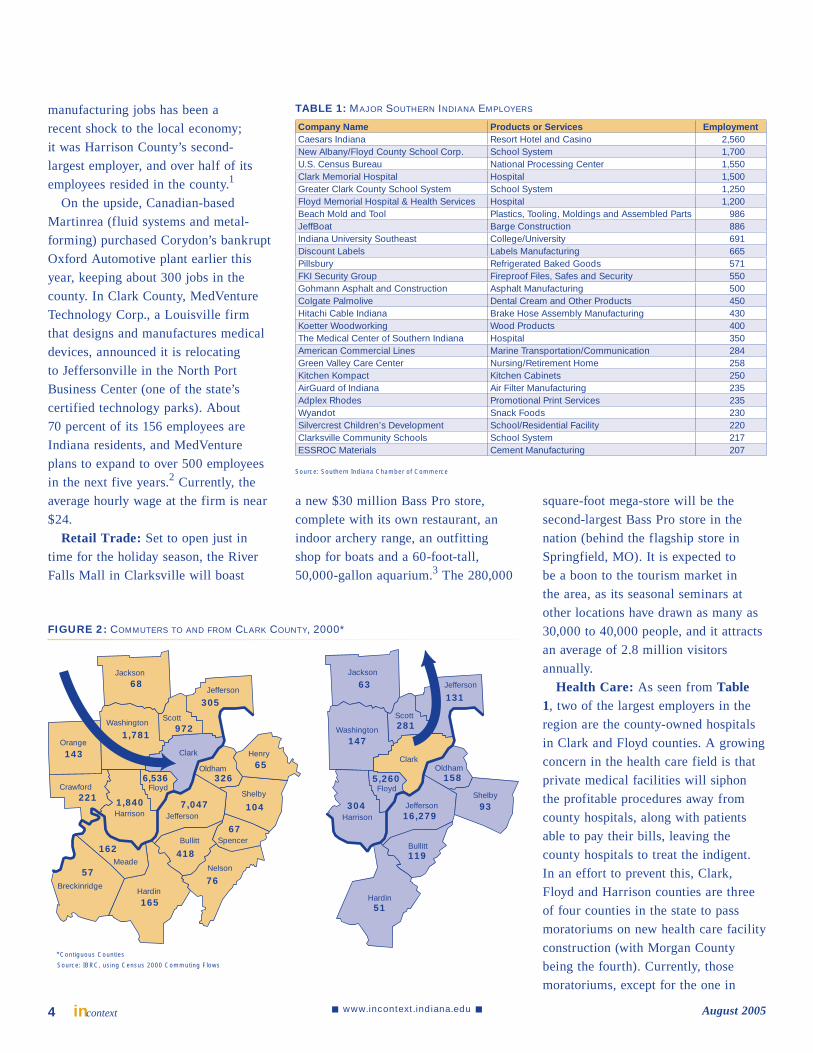
FIGURE 2: COMMUTERS TO AND FROM CLARK COUNTY, 2000*
76
165
57
418
67
162
1047,047
6,536
1,840221
32665
143
1,781 972
305
68
Nelson
HardinBreckinridge
Bullitt Spencer
Meade
Shelby
Jefferson
Floyd
Harrison
Crawford
Oldham
HenryClarkOrange
WashingtonScott
Jefferson
Jackson
51
119
9316,279
5,260
304
158
147281
13163
Hardin
Bullitt
ShelbyJefferson
Floyd
Harrison
OldhamClark
Washington
Scott
Jefferson
Jackson
Source: IBRC, using Census 2000 Commuting Flows
*Contiguous Counties
4
Harrison County, are being challenged
in federal court.4
CommutingClark County has the largest
commuting flows on the Hoosier side
of the border, according to the Census
2000 figures. Eighteen counties had at
least 50 people commuting into Clark
County, drawing almost 8,500 workers
from Kentucky. Meanwhile, over
16,000 Clark County residents worked
in Jefferson County, the heart of the
Louisville metro (see Figure 2).
Wages and CompensationOverall, the average weekly wage for
the four-county region was $574 for
the third quarter of 2004—about $80
less than the state rate. Compared to
Indiana’s other metros, the average
wages were higher than those found
in the Indiana portion of Cincinnati-
Middletown, Bloomington, Terre Haute
and Michigan City–La Porte, but lower
than the remaining 11 metros in the
state.
At the industry level, all were
below the statewide level, except
for transportation and warehousing,
where southern Indiana workers had
a $1 advantage (see Figure 3). Three
industries accounting for about 3
percent of the total workforce had
average weekly wages that were
more than $200 below the Indiana
average for that industry: information,
professional, scientific and technical
services, and mining. Comparing these
numbers to those from three years ago
(2001:3), shows that all wages have
increased, except those in professional,
scientific and technical services, which
declined by $28 (a 4.3 percent drop).
When looking at the three
industries employing the most workers
(manufacturing, retail trade and
health care), each saw significant
average wage increases. In particular,
manufacturing wages rose $122 (19.2
percent), and health care wages saw
a $90 weekly increase (16.5 percent).
Overall, management of companies and
enterprises saw the largest increase in
wages, both numerically ($290) and on
a percentage basis (37.1 percent).
Notes1. Charles Ewry, “What the loss of 600 Tower
Automotive jobs will mean for Corydon,” The Corydon Democrat 10 June 2005.
2. Larry Thomas, “Jeffersonville woos MedVenture with $5.5 million bond issue,” The Evening News 21 June 2005.
3. John L. Gilkey, “Bass Pro Shops set to open $30 million store Nov. 14 in Clarksville,” The Evening News 2 June 2005.
4. Tom Murphy, “Debate over health care development takes legal twist” Indianapolis Business Journal 23 June 2005.
—Rachel Justis, Managing Editor, Indiana Business Research Center, Kelley School of Business, Indiana University
$0
$200
$400
$600
$800
$1,000
$1,200
$1,400
Accommodation and Food ServicesArts, Entertainment and Recreation
Agriculture, Forestry, Fishing and HuntingOther Services(Except Public Administration)
Administrative, Support and Waste ManagementRetail Trade
Real Estate and Rental and LeasingInformation
Public AdministrationProfessional, Scientific and Technical Services
Educational ServicesConstruction
Health Care and Social ServicesWholesale Trade
Transportation and WarehousingFinance and Insurance
MiningManufacturing
UtilitiesManagement of Companies and Enterprises
Total
IndianaLouisville (Indiana part)
FIGURE 3: WEEKLY WAGES AND COMPENSATION, 2004:3
Source: IBRC, using IDWD Census of Employment and Wage data
This article is part of an ongoing series covering Indiana’s metropolitan statistical areas. Gain access to this and the 10 previously published metros—Anderson through Lafayette—on the newly redesigned InContext website at www.incontext.edu. As you will see from the schedule below, the four remaining metro areas will all be available by the end of the year:
Lafayette Kokomo
Indianapolis
Gary
Fort Wayne
Evansville
Elkhart-Goshen
Ande
rson Muncie
South Bend-Mishawaka
Michigan City-La Porte
Terre Haute
Bloomington
Louisville
Columbus
Month Featured MetroSeptember Michigan City–La PorteOctober MuncieNovember South Bend–MishawakaDecember Terre Haute
5incontextAugust 2005 www.incontext.indiana.edu
August 2005 www.incontext.indiana.edu incontext
Information sector data from
the 2002 economic census has
been released for the nation and
the state. The information sector is
comprised of seven subsectors, all
primarily engaged in producing,
processing and distributing information.
Indiana had 2,267 establishments,
with the bulk of its employment in
telecommunications and publishing.
The Hoosier information sector made
up only 1.6 percent of the nation’s
establishments in this sector.
Figure 1 shows the make-
up of the information sector in
Indiana and the nation. Indiana’s
distribution of establishments is more
concentrated than the nation’s, with
the telecommunication subsector
outstripping the nation by 7 percentage
points. Indiana’s growth rate over the
past five years in this sector has been
almost half that of the nation’s.
Figure 2 compares Indiana’s
information sector to the rest of
the nation. At $39,969, Indiana
ranked 32nd in average earnings per
employee.1 Nine states came within
5 percent of Indiana’s earnings:
Oklahoma, Nevada, Arkansas and
Wisconsin were above Indiana,
while Utah, Rhode Island, Nebraska,
Tennessee and Alabama fell just short
of it.
Publishing Industry Highlights Figure 3 looks at Indiana’s second
largest subsector: the publishing
industry (except internet). Note that
revenue data were not available
for Indiana’s largest subsector—
telecommunications. In the publishing
industry, the state generated
approximately $3.85 million per
establishment, ranking 31st among the
states and the District of Columbia.
Indiana had approximately 31
employees per establishment engaged
in publishing activities. Indiana’s
immediate Midwestern neighbors were
yielding greater revenues than the
state in the publishing industry but
were utilizing more people to do so.
The exception was Kentucky, which
was generating substantial revenues
but utilizing fewer employees than
other states. Newspaper publishers in
Indiana can claim the greatest number
of businesses and employment in the
Indiana’s Information Sector Primarily in Telecom and Publishing
23%
16%
7%
1%
36%
14%
3%
Publishing industries(except Internet)
Motion picture and sound recording industries
Broadcasting(except Internet)
Internet publishing and broadcasting
Telecommunications
Internet service providers, web search portalsand data processing
Other information services
20%
13%
9%
1%
43%
13%
1%
United States
Indiana
FIGURE 1: INFO SECTOR ESTABLISHMENTS
Source: IBRC, using 2002 Economic Census data
FIGURE 3: PUBLISHING SECTOR REVENUES, 2002
Indiana = $3,852,221
$3 million to $6 million (28 states)
More than $10 million(5 states)
Less than $3 million (12 states)
$6 million to $10 million(6 states)
Labels show number of employees per establishment
31
5015 23
27
1718
3121
16
3424 26
29
42
30
40
44 31
32
41311636
38
3534
61
272730
2625
29 3144
27 213332
29
183319 32
2734
25
27
35
21
Source: IBRC, using 2002 Economic Census data
Indiana = $39,969
$35,000 to $45,000 (18 states)
More than $50,000(10 states)
Less than $35,000 (12 states)
$45,001 to $50,000 (11 states)
Labels show state’s share of the U.S. information sector 0.4
2.2
0.5 0.50.3
0.30.3
1.50.5
0.4
2.01.4 0.6
1.1
2.8
0.7
7.9
3.7 1.3
0.3
2.91.60.7
0.914.9
3.14.2
0.6
0.30.51.9
2.31.11.1 2.71.9
1.5 1.12.31.7
7.0
0.6
1.20.7 3.00.90.7
5.6
2.8
0.3
1.0
States within 5 percent of Indiana’s earnings
FIGURE 2: INFORMATION SECTOR AVERAGE EARNINGS PER JOB, 2002
Source: IBRC, using 2002 Economic Census data
6
industry and had 45 percent of the total
revenue (see Table 1).
One might think more employees
mean greater revenues, which seems
to be the case (especially with the
state of Washington, which had an
average of 50 employees and generated
$29,324,230 per establishment).
Texas’s publishing firms are getting a
lot of mileage out of their employees.
It ranked in the top 10 for revenue
generation per establishment, but
like Kentucky, did not utilize many
employees (see Table 2).
Quite a bit of the county and place
economic census data for Indiana is
either not available or nondisclosable
for confidentiality reasons, but Table 3 looks at the counties and places for
which we have data for the publishing
industry. Marion County had by far the
greatest number of publishing outfits
in the state and generated the most
revenue per establishment, even though
it had fewer employees per location
than Monroe and Madison counties.
Hamilton County, which only had
about 20 employees per establishment,
ranks fifth in revenue. Almost half
of Hamilton County’s publishing
businesses are in Carmel, and they
contributed 62 percent of the revenue.
Notes1. Average earnings per employee is annual
payroll divided by the number of employees. Payroll includes all forms of compensation, such as salaries, wages, commissions, dismissal pay, bonuses, vacation allowances, sick-leave pay and employee contributions to qualified pension plans. Also included are tips and gratuities received by employees from patrons and reported to employers.
—Amber Kostelac, Data Manager, Indiana Business Research Center, Kelley School of Business, Indiana University
County Establishments Revenue per Establishment
Rank Employees per Establishment
Rank
Marion 95 $8,236,547 1 43 3
Monroe 17 $6,273,647 2 52 1
Lake 15 $4,113,667 3 31 5
Madison 5 $3,605,800 4 49 2
Hamilton 24 $3,330,292 5 20 9
Delaware 6 $3,279,333 6 32 4
Wayne 6 $2,350,667 7 31 6
Elkhart 18 $2,300,944 8 27 7
Boone 7 $2,089,143 9 9 10
La Porte 10 $1,264,000 10 20 8
City or Town
Indianapolis 91 $8,511,132 1 44 3
Fort Wane 13 $5,239,615 2 48 2
Lafayette 5 $5,185,200 3 51 1
Carmel 13 $3,792,231 4 17 4
TABLE 3: PUBLISHING INDUSTRY HIGHLIGHTS,* 2002
Source: IBRC, using 2002 Economic Census data*Counties and cities for which publishing industry revenue was available. Others were either not available or not disclosable
TABLE 2: SELECTED STATES BY REVENUE PER ESTABLISHMENT IN THE PUBLISHING INDUSTRY, 2002
State Revenue per Establishment
Rank Employees per Establishment
Rank
Top Ten States
Washington $29,324,230 1 50 2 District of Columbia $16,138,433 2 61 1 New York $12,778,310 3 40 7 Missouri $11,905,822 4 44 4 New Jersey $10,347,824 5 41 6 Pennslyvannia $9,601,976 6 44 3 Massachusetts $9,276,787 7 42 5 California $8,842,783 8 38 8 Texas $7,577,459 9 29 28 Illinois $6,851,443 10 34 13
County unemployment estimate * census share for city =
unemployment estimate for city
However, there are problems with
this approach. If a city’s share of the
unemployment was disproportionately
high during the census for some reason
(a recent closing of a significant
employer, for example) the city will be
“stuck” with that share of the county’s
total unemployment until the next
census, regardless of how the actual
distribution of unemployment between
the city and the balance of the county
might change during that decade. An
additional issue involves the time lag
between the actual census and the
introduction of census-share ratios for
the cities into the modeling software,
which might take three to five years.
To respond to this shortcoming,
the Bureau of Labor Statistics
(BLS), which funds and oversees
the production of Local Area
Unemployment Statistics estimates,
developed an alternate methodology,
and Indiana is adopting it with
these revised estimates. A residency
assignment system maintained by
BLS geocodes
Unemployment
Insurance (UI)
claims records
based on the
claimant address
(i.e. assigns
longitude and
latitude) and
assigns place
codes based on
that “rooftop” mapping of the address.
If the address falls within a designated
city based on that geocoding, the city’s
place code is appended to the record;
if the address falls outside the city’s
defined limits, no city code is added—
although both sets of records will be
included in the county’s UI claims for
the period. In considering the city’s
unemployment claims for the period
in question, only the records coded for
the city will be included. For example,
county claims for Floyd County would
include all claims records coded for
that county, but claims for New Albany
would have an additional place code,
allowing us to identify those records
and arrive at a separate claims count
for New Albany. In the case of a
county with multiple large cities for
which estimates are produced (e.g.,
Lake County), each city’s claims are
coded separately.
This new approach has the obvious
advantage of reflecting month-to-
month changes to the distribution of
unemployment claims activity between
the city (or cities) and the balance of
the county. In the case of Lake County,
the distribution of unemployment
has shifted somewhat since the 2000
census. The new approach captures
the fact that Gary and East Chicago
now have a smaller proportion of the
county’s total unemployment than they
did in 2000, while unemployment in
some other cities within the county has
increased (see Table 1).
It should be noted that the claims
counts for cities and counties, while a
significant factor, constitute only one of
several model inputs used in arriving at
unemployment estimates. Some cities
will see shifts in their unemployment
rates with the 2005 estimates compared
to the 2000–2004 benchmarked
estimates, which employed the old
methodology, and may experience
more month-to-month volatility in
their unemployment estimates. For
example, some cities may see higher
unemployment estimates in January
than the county as a whole, since retail
establishments tend to be concentrated
in urban areas, and post-holiday
layoffs may be more frequent among
city residents based on proximity
to those workplaces. In general, the
new methodology will provide more
accurate, current estimates for cities’
labor force components utilizing
current UI claims activity, rather than a
static snapshot of unemployment ratios
from half a decade ago.
—Vicki Seegert, Manager, Advanced Economic and Market Analysis Group, Indiana Department of Workforce Development
A New Approach to City-Level Unemployment Estimates
8
City
New Method: Disaggregated Claims
Old Method: Census Share
Unemployed Rate Unemployed Rate
East Chicago 1,010 9.5 1,630 14.0
Gary 3,210 8.8 5,420 13.5
Hammond 2,710 7.8 2,840 7.8
Hobart 930 7.0 570 4.6
Merrillville 930 5.9 580 3.8
Schererville 640 4.5 330 2.5
TABLE 1: LAKE COUNTY CITY ESTIMATES COMPARISON, JANUARY 2005
Source: Indiana Department of Workforce Development
about the legitimacy of a new survey
they have received in the mail. A local
police department also called after an
individual in the community contacted
them about someone coming to their
door with a laptop computer claiming
to be from the Census Bureau. The
fact is, starting in January of 2005, the
U.S. Census Bureau started mailing
the American Community Survey to
300,000 addresses every month in
every county of the United States,
including every county in Indiana.
The Census Bureau has published an
informative and helpful document
entitled American Community Survey—
A Handbook for State and Local
Officials. This document, along with a
sample of the survey questionnaire and
many other publications, can be found
at www.census.gov/acs.
—Frank Wilmot, State Data Center Coordinator, Indiana State Library
The Economic Census
The 2002 Economic Census
began collecting data on
the nation’s businesses in
late 2002, and it is in the process of
being released by the Census Bureau.
Currently, state level data is being
released (see Table 1) and is available
through the American FactFinder
website (http://factfinder.census.gov).
To help users better understand and
gain access to the 2002 Economic
Census and how it relates to past
economic censuses, the Census Bureau
is offering two hands-on seminars to
be held in Indianapolis at the Indiana
State Library on September 23rd at
9:00 a.m. and 1:30 p.m. Both seminars
are free to the public and each will last
three hours. The required registration
can be done online at www.census.gov/
econ/census02/guide/ec02conf.htm.
Racial and Ethnic Composition Since 1790Since the first census in 1790,
when U.S. marshals counted 3.9
million residents, the
decennial census has
collected data on the
nation’s population,
including data on racial
composition. For the
first time, the U.S.
Census Bureau has
released a historical
summary by city, titled
Historical Census
Statistics on Population
Totals by Race, 1790 to
1990, and by Hispanic
Origin, 1970 to 1990,
for Large Cities and
Other Urban Places in
the United States. It is
available online at www.
census.gov/population/
www/techpap.html.
This working paper illustrates how
the composition by race and Hispanic
origin has changed over the years
in 306 cities. Data are provided for
224 places that have had a census
population of 100,000 or more at some
point from 1790 to 1990, as well as
another 82 places that historically were
among the largest in their state. As
shown in Figure 1, Indiana cities and
towns included in the working paper
are Evansville, Fort Wayne, Gary,
Hammond, Indianapolis, New Albany
and South Bend.
The racial categories used in the
report are those used in the 1990
census. Data from Census 2000 are not
included because they are not directly
comparable with race data from
previous censuses.
Handbook for State and Local OfficialsThe Data Center has received a few
phone calls from concerned citizens
Inside the Data Center
0
100
200
300
400
500
600
700
1830
1850
1870
1890
1910
1930
1950
1970
1990
Pop
ulat
ion
(in th
ousa
nds)
Evansville
Fort Wayne
Gary
Hammond
Indianapolis
New Albany
South Bend
FIGURE 1: TOTAL POPULATION, 1830–1990
Source: IBRC, using U.S. Census Bureau data
9incontextAugust 2005 www.incontext.indiana.edu
May
June
July
Sept
Mining
Information
Educational Services
ManufacturingWholesale Trade
Retail Trade
Real Estate and Rental and Leasing
Professional, Scientific and Technical Services
Administrative, Support and Waste ManagementHealth Care and Social Assistance
Arts, Entertainment and RecreationAccommodation and Food ServicesOther Services
UtilitiesConstruction
Transportation and Warehousing
Finance and Insurance
TABLE 1: RELEASE DATES FOR INDIANA SECTOR DATA
August 2005 www.incontext.indiana.edu incontext
Indiana has a chance to be at the
forefront of a major change in air
transportation. Cities and towns of
all sizes will have more options to use
the airways and companies will have
larger market areas; many new and
existing firms will have opportunities
to participate in a growing market. This
is the potential offered by the Small
Aircraft Transportation System (SATS).
The VisionA little more than 100 years ago, a
revolutionary event in history occurred
with little media attention or public
fanfare. Two Ohio bicycle makers, one
of whom was born in Indiana, first
achieved power flight.
Recently at Danville Virginia,
with modest media fanfare, SATS
was presented to the public. This
presentation exhibited years of
innovative aviation research supported
jointly by the Federal Aviation
Administration (FAA) and the National
Aeronautics and Space Administration
(NASA).
One goal of SATS is to provide the
nation with an economic development
tool for communities of all sizes,
enabled by local air accessibility,
bypassing hub-and-spoke air
transportation constraints and delays.
Another goal is to relieve the over-
burdened air-traffic control network.
SATS is a revolutionary departure
from previous economic transportation
models. Historically, transportation and
economic development has been along
paths or lines. Community prosperity
required being on a line (no matter how
circuitous): a river, seaport, path or
road. Next came canals and railroads
followed by paved highways and then
interstate highways. Airlines put cracks
in this model with point-to-point
transportation. But the industry was
dominated by economies
of scale that left out
smaller communities and
airports. SATS will break
the old linear model with
a new, highly flexible
transportation network that
makes each community the
center of its own economic
radius.
What is SATS?The Small Aircraft
Transportation System
is just that—a system
with technological and
organizational components.
On the technology side,
SATS is a dramatic
upgrade—both in the vehicle
and on the ground—and
would eliminate much of
the complexity in today’s
aviation. Instead of a pilot
facing an intimidating
array of dials, all
necessary information
is available on a
single screen. On-
board computers
monitor systems and
relate information as needed to the
screen so the pilot can concentrate on
essential functions. Via an airborne
Internet system, planes are able
to communicate with each other,
sequencing landings and preventing
mid-air collisions. In most cases, SATS
eliminates the need for two pilots in
the cockpit.
On the ground, a Geographic
Positioning System (GPS) with
computer communications to air-borne
traffic provides information that allows
landings at much lower visibility levels
than are possible today. There is little,
if any, need for SATS-equipped aircraft
to use the already over-burdened air
traffic control system.
There are more than 60 airports
in Indiana with runways long enough
for SATS aircraft (see Figure 1).
They require, however, installation of
a GPS-based communication system
(estimated to cost as little as $50,000)
for use by SATS-equipped airplanes.
As NASA and the FAA refine the
SATS technology, the aviation industry
is undergoing a major transformation.
A new generation of low-cost jets is
being built using the latest advanced
manufacturing techniques. Thus, new
air-taxi or on-demand services will be
Getting Indiana Off the Ground
10
*Map does not include major commercial airportsSource: IBRC, using Indiana Department of Transportation data
Peru
Knox
SalemPaoli
Warsaw
Muncie
MarionKokomo
Goshen
Wabash
Delphi
Brazil
Auburn
Angola
Seymour
Elkhart
La Porte
Bedford
Winamac
Madison
Lebanon
ClintonRichmond
Columbus
AndersonSheridan
Portland
Sullivan
Plymouth
Kentland
Griffith
Lafayette Frankfort
Tell City
Rochester
Valparaiso
Winchester
Rensselaer
Washington
New Castle
MonticelloLogansport
Huntington
Greensburg
Terre Haute
Bloomington
French Lick
Shelbyville
Smith Field
Eagle Creek
Huntingburg
Greencastle
Indianapolis Executive
Connersville
North Vernon
Kendallville
Indianapolis Metropolitan
Mount Comfort
Michigan City
Jeffersonville
Crawfordsville
Hendricks CountyGreenwood Municipal
FIGURE 1: AIRPORTS WITH RUNWAYS LONG ENOUGH FOR SATS*
available at airports that currently have
enormous excess capacity. As aircraft
ownership costs decrease dramatically,
there will also be a rise in the
availability of air-taxi services using
sophisticated scheduling programs to
improve service and drive costs even
lower. These new SATS-equipped
aircraft will be in the air in the coming
year.
Economic Implications SATS will create jobs for those
who manufacture the planes and
complementary equipment. Indiana
needs to explore this opportunity as a
replacement for declining employment
in the automotive sector.
SATS will create jobs at airports
to service airplanes arriving and
departing, as well as jobs for those who
fly the planes. It will lower the costs of
existing travel, increasing the earnings
of firms. It will also create jobs
because firms will be able to generate
more business by traveling more often.
If you live in Logansport, Richmond,
Frankfort, Connersville or any other
Indiana city with a small airport,
SATS gives you new choices. But,
you do not necessarily have to live in
a small town. You could be living on
the eastside of Indianapolis, near the
Mount Comfort Airport, or in Lake
County, not far from the Gary or
Griffith airports. SATS opens up new
opportunities to avoid the costs and
discomforts of major airports.
Some existing travel will
be diverted from autos to air-taxis.
Instead of driving from Kokomo to
Tell City, a traveler could fly. Instead
of a five-hour drive in each direction,
the flight would be under an hour each
way. Eight hours of travel saved, to say
nothing of the fatigue.
SATS will also substitute for some
combined auto-air travel. Today a
traveler from Muncie going to Anniston
(AL) drives to the Indianapolis airport
(about an hour and a half), flies to a
hub city (Chicago, Memphis, Atlanta
or Detroit), transfers to a flight to
Birmingham (best elapsed time: three
hours and 20 minutes) and then drives
to Anniston (about an hour). Total time
for the trip: close to six hours excluding
parking, security and the usual airport
hassle. But a direct flight from Muncie
to Anniston would be less than two
hours. Again, the total time savings
of SATS would be eight hours for the
round-trip.
Hence, SATS will get some travelers
to change their mode of transport.
But it will also induce those who are
currently not travelers to make trips
they are not now taking. These induced
trips became the focus of a study by
the Indiana SATS Consortium.
Induced Business Activity ModelThis model is built on the idea that
firms will expand their markets
if less-time-consuming modes of
transportation are available. It ignores
in-bound business activity that can
benefit a community and non-business
flights. It contains several variables
or assumptions that can be changed
at will. Given the absence of existing
empirical data for such a revolutionary
service, this approach, using very
conservative assumptions, offers a
minimalist estimate of the economic
value of SATS to existing businesses in
a county.
1. To estimate induced activity, the
number of establishments for
each U.S. county was drawn from
County Business Patterns produced
by the U.S. Census Bureau. The
data were reduced to five sectors:
manufacturing, information, finance
and insurance, professional and
technical services, and a residual
sector. For each sector, a minimum
number of flights per year per
establishment was assumed. For
example, manufacturing firms were
assumed to take one flight per year
per establishment. Other sectors
were assumed to take fewer flights
per establishment. This produced the
number of flights for each sector and
each county.
2. Each flight taken was assumed to
have a fare of $1,800 (based on
calculations by Virginia Tech) and
to have two executives onboard. The
value of executive time was assumed
to be 150 percent of the average
earnings per worker in that sector
in that county as calculated from
data generated by the U.S. Bureau of
Economic Analysis (BEA). This time
cost was added to the fare to give a
total cost for the trip.
3. The value of the trip to the firm was
assumed to be equal to the cost of
the trip times the ratio of the value
of output to employee compensation
Indiana SATS Consortium (INSATS)INSATS fosters economic growth and the development of the aeronautics industry.
It aspires to have Indiana lead the nation in the operational deployment of the Small
Aircraft Transportation System (SATS) technologies and to help individual communities
unleash untapped economic growth by developing their small airports into
prosperous on-ramps to the national air transportation system. For more
details about activities and conferences, see www.insats.org.
11 incontextAugust 2005 www.incontext.indiana.edu
Nonprofit OrganizationU.S. Postage
PAIDBloomington, Indiana
Permit No. 2
Indiana University, Kelley School of BusinessIndiana Business Research Center777 Indiana Avenue, Suite 210Indianapolis, IN 46202
Published monthly by a partnership of:
August 2005Volume 6, Number 5
Indiana Economic Development Corporation
Secretary of Commerce ... Patricia MillerPresident ........................... Mickey MaurerResearch Director ............. Ryan Asberry
One North Capitol, Suite 700Indianapolis, IN 46204
Web: www.iedc.in.gov
Indiana Department of Workforce Development
Commissioner ................... Ronald L. StiverDeputy Commissioner, Strategic Research
and Development .......... Andrew Penca
10 N. SenateIndianapolis, IN 46204
Web: www.in.gov/dwd
Indiana Business Research CenterKelley School of Busi ness, Indiana University
Director .............................. Jerry ConoverExecutive Editor ................ Carol O. RogersManaging Editor................ Rachel JustisGraphic Design ................. Molly MarlattCirculation ......................... Nikki LivingstonQuality Control .................. Amber Kostelac and Joan Ketcham
Bloomington1275 E. Tenth Street, Suite 3110Bloomington, IN 47405
Indianapolis777 Indiana Avenue, Suite 210Indianapolis, IN 46202
Digital ConnectionsIN ContextCurrent workforce and economic news with searchable archives.www.incontext.indiana.edu
STATS IndianaAward-winning economic and demographic site provides thousands of current indicators for Indiana and its communities in a national context.www.stats.indiana.edu
Indiana Economic DigestThe news behind the numbers, the Digest is a unique partnership with daily newspapers throughout Indiana providing access to daily news reports on business and economic events.
www.indianaeconomicdigest.net
incontext(continued from page 11)
for each sector. Those data are not available at the county level, so state level gross
state product estimates from the BEA were used. The thought here is that a firm
would not undertake a trip without a return equal to the value it would obtain from
a like investment in employee compensation.
4. A business trip may be expected to generate additional orders that can be realized
without additional trips. Relationships established by the initial trip can be
strengthened by telephone and e-mail so that repeat orders may be created. A
repeat business coefficient was applied for each sector.
5. From these basic sources and assumptions, the model generates the increases of
output, earnings and employment in each county within the 48 continental states.
This is how it worked out for Adams County in Indiana (dollars are expressed in
2002 values with no adjustment for inflation):
Value of added output in the community = $3.2 million
Amount of added earnings by workers and business proprietors in the
community = $2.0 million
Increased number of jobs in the community = 72
Full results for all counties are available by e-mailing [email protected]. No
multipliers for indirect or income-induced values are applied. These estimates are for
a single year. Further increases would be built on them, but not without limit. The
magnitude of the results increase as the number of establishments in a community
rises (particularly manufacturing firms) and as the existing average wage rises.
What would a community spend as incentives today to get 72 jobs tomorrow? If
SATS costs $50,000, it would be the bargain of the century.
The ultimate economic development issue, it appears to us, is to get the planes
flying, which does involve some minimal investment at airports, and to get business
passengers in the seats (a marketing effort by air-taxi operators). The normal
functioning of markets will do the rest.
—Morton Marcus, Director Emeritus, Indiana Business Research Center, Kelley School of Business, Indiana University; and Ted Jockel, Independent Economic Consultant