The IncuCyte ZOOM offers users the ability to acquire HD phase as well as dual wavelength fluorescent images of living cells—producing multiplexed data that can kinetically measure cell proliferation, apoptosis, cytotoxicity, and other cell biology applications. The IncuCyte ZOOM’s refined processor is capable of accurately distinguishing between background and positive fluorescent objects across a wide range of cell types and fluorescent intensities. With this feature, an IncuCyte ZOOM user has the ability to tailor Processing Definitions to optimally analyze a specific cell phenotypes. This requires 3 simple steps as described below: 1) creating an Image Collection, 2) creating a Processing Definition, and 3) Launching an Analysis Job. As illustrated in Figure 1, the data processing flow is separated into two distinct phases, the Assay Development Phase, and the Established Assay Phase Assay Development Phase The first step in the Assay Development Phase is to collect assay data. Next, a small collection of representative images is selected from that data set to be part of an Image Collection. This image collection is then used to define and test a Processing Definition. It is within this Processing Definition that users set the parameters that will be applied to all images within current and future data sets. Once the Processing Definition is established, it should not need to be modified again. The tested, finalized and saved Processing Definition is then used in the Established Assay Phase. Established Assay Phase When the images of an experiment have already been collected, the user can apply the Processing Definition to that experiment by Launching an Analysis Job. Alternatively, a user can (and should) apply a Processing Definition to an experiment at the time the experiment is scheduled in the IncuCyte ZOOM Scheduler. In doing so, the IncuCyte ZOOM software will analyze images in real-time as they are acquired. As a result, users can look at, analyze, export, and evaluate their phase contrast data in real-time. IncuCyte™ ZOOM Fluorescent Processing Overview Assay Development Phase: The user defines image analysis parameters that will be used to analyze all images within an established assay. Once completed, the parameters will be applied to all experiments/vessels that use the same experimental conditions (Assay/Cell Type/Fluorescent Marker/Magnification). Established Assay Phase: Once the parameters have been defined and saved in the Assay Development Phase, users can apply those parameters to future experiments with the click of a button. Figure 1: Flow chart illustrating the IncuCyte ZOOM assay development strategy. Image Collection: An Image Collection is a group of images that can be used to train, test, or refine a Processing Definition. Image collections will typically contain 3-6 images that best represent the phenotypes under investigation. Too many images in an Image Collection should be avoided as it can prolong the development of a Processing Definition. Processing Definition: Processing Definitions are what define the parameters used to analyze all images within an experiment. Each new Assay, Cell Type, and/or magnification will likely require a new Processing Definition, but once established, will not have to be created again. Once finalized and saved, Processing Definitions can be applied to vessels/experiments at the time of scheduling such that images are analyzed in real-time. Analysis Job: An Analysis Job is launched to analyze images and produce metrics based on the parameters contained within the saved Processing Definition. The scope of the job is specified by the user when the job is launched. This scope includes controls for a single time point, over a defined time frame, or open ended if the Vessel/Experiment is still being actively scanned.
Transcript
The IncuCyte ZOOM offers users the ability to acquire HD phase as well as dual wavelength fluorescent images of living cells—producing multiplexed data that can kinetically measure cell proliferation, apoptosis, cytotoxicity, and other cell biology applications. The IncuCyte ZOOM’s refined processor is capable of accurately distinguishing between background and positive fluorescent objects across a wide range of cell types and fluorescent intensities. With this feature, an IncuCyte ZOOM user has the ability to tailor Processing Definitions to optimally analyze a specific cell phenotypes. This requires 3 simple steps as described below: 1) creating an Image Collection, 2) creating a Processing Definition, and 3) Launching an Analysis Job. As illustrated in Figure 1, the data processing flow is separated into two distinct phases, the Assay Development Phase, and the Established Assay Phase
Assay Development Phase The first step in the Assay Development Phase is to collect assay data. Next, a small collection of representative images is selected from that data set to be part of an Image Collection. This image collection is then used to define and test a Processing Definition. It is within this Processing Definition that users set the parameters that will be applied to all images within current and future data sets. Once the Processing Definition is established, it should not need to be modified again. The tested, finalized and saved Processing Definition is then used in the Established Assay Phase. Established Assay Phase When the images of an experiment have already been collected, the user can apply the Processing Definition to that experiment by Launching an Analysis Job. Alternatively, a user can (and should) apply a Processing Definition to an experiment at the time the experiment is scheduled in the IncuCyte ZOOM Scheduler. In doing so, the IncuCyte ZOOM software will analyze images in real-time as they are acquired. As a result, users can look at, analyze, export, and evaluate their phase contrast data in real-time.
IncuCyte™ ZOOM Fluorescent Processing Overview
Assay Development Phase: The user defines image analysis parameters that will be used to analyze all images within an established assay. Once completed, the parameters will be applied to all experiments/vessels that use the same experimental conditions (Assay/Cell Type/Fluorescent Marker/Magnification).
Established Assay Phase: Once the parameters have been defined and saved in the Assay Development
Phase, users can apply those parameters to future experiments with the click of a button.
Figure 1: Flow chart illustrating the IncuCyte ZOOM assay development strategy.
Image Collection: An Image Collection is a group of images that can be used to train, test, or refine a Processing Definition. Image collections will typically contain 3-6 images that best represent the phenotypes under investigation. Too many images in an Image Collection should be avoided as it can prolong the development of a Processing Definition.
Processing Definition: Processing Definitions are what define the parameters used to analyze all images within an experiment. Each new Assay, Cell Type, and/or magnification will likely require a new Processing Definition, but once established, will not have to be created again. Once finalized and saved, Processing Definitions can be applied to vessels/experiments at the time of scheduling such that images are analyzed in real-time. Analysis Job: An Analysis Job is launched to analyze images and produce metrics based on the parameters contained within the saved Processing Definition. The scope of the job is specified by the user when the job is launched. This scope includes controls for a single time point, over a defined time frame, or open ended if the Vessel/Experiment is still being actively scanned.
IncuCyte ZOOMTM Fluorescent Processing Overview
2
Fluorescent Processing: Metrics
IncuCyte ZOOM provides the following set of metrics relevant for fluorescent object analysis:
Count
Confluence
Average Area
Total Object Area
Average Eccentricity
Average Mean Intensity
Average Integrated Intensity
Total Integrated Intensity Note: Calibration Units (CU) are units assigned at the time of calibration
where the calibration dye is given a value of 100 CU. For example, GCU=20 means this object is 20% the brightness of the Green calibration
dye. To accurately quantify these metrics, a user creates a Processing Definition well-suited to the cell type, assay conditions, and magnification. The following section will guide you through the exact steps you need to complete the Assay Development Phase for your specific assay. Screenshots are included for further clarity, and definitions of all the IncuCyte ZOOM terms can be found in blue boxes.
Fluorescence Processing: Assay Development Phase
Step 1. Determining the Spectral Unmixing
1. Image wells containing cells that express the green signal ONLY or wells containing cells that express the red signal ONLY (depending upon the reagent being used). These images MUST be acquired using both the red and green channel to evaluate if the fluorophore produces signal in both channels.
NOTE: It is rare that green fluorescence is detected by the
red channel.
2. Once a few images have been collected, the User can visualize how much of the red fluorescence is detected by the green channel (and vice-versa) by toggling between Image Channels (Screenshot 1).
3. The user can then adjust the “% of Red removed from Green” by increasing the values on the right under “Spectral Unmixing” until no red image is visualized in the green channel. Too high a percentage of Red removal from Green may result in overcorrection and the appearance of “holes” within the image.
Fluorescent Processing Metrics Defined Object Count (1/Image or 1/mm2 or 1/well): The number of objects per image, per mm2, or per well. Avg. Area (µm2): The average area of the objects in the image. Total Object Area (µm2/Image or µm2/Well): The total amount of area within an image or a well containing fluorescent objects. Confluence (%): The percentage of the image area occupied by objects. Avg. Mean Intensity (CU): The image average of the objects’ mean fluorescent intensity. Avg. Integrated Intensity (CU x µm2): The image average of the objects’ integrated fluorescent intensity. Total Integrated Intensity (CU x µm2/Image): The total sum of the objects’ fluorescent intensity in the image. Avg. Eccentricity: The average of how round or compact the objects are. Ranges from 0 to 1 with a perfect circle having a value of 0.
Screenshot 1: Spectral Unmixing The red fluorophore in this screenshot produces a signal in both the red and green channel (top row) The red channel is unmixed from the green channel by 8% to better distinguish between the 2 fluorophores (bottom row).
Red Channel Green Channel
IncuCyte ZOOMTM Fluorescent Processing Overview
3
NOTES: Spectral unmixing should be determined for all new fluorescent proteins or dyes. Once established, the percentage can be
applied at time of vessel scheduling in future assays containing that fluorophore. (i.e. 8% of Red removed from Green is optimal for Essen’s NucLight and CytoLight Red Reagents/Cell Lines). The User must be aware that overcorrection using the spectral unmixing tool may affect assay metrics as well as the loss of detection of true green objects.
4. Click “Save” to apply the spectral unmixing to the current vessel.
IMPORTANT: It is imperative that spectral unmixing is saved before any image collections, processing definitions, or analysis jobs are created.
Step 2. Creating an Image Collection
1. Collect Fluorescent images of your cells every 2-6 hours until assay is complete.
2. Open the Vessel View. If the appropriate spectral unmixing was not applied at the time of Vessel Scheduling, use the Spectral Unmixing tool in the Vessel View and click “Save”.
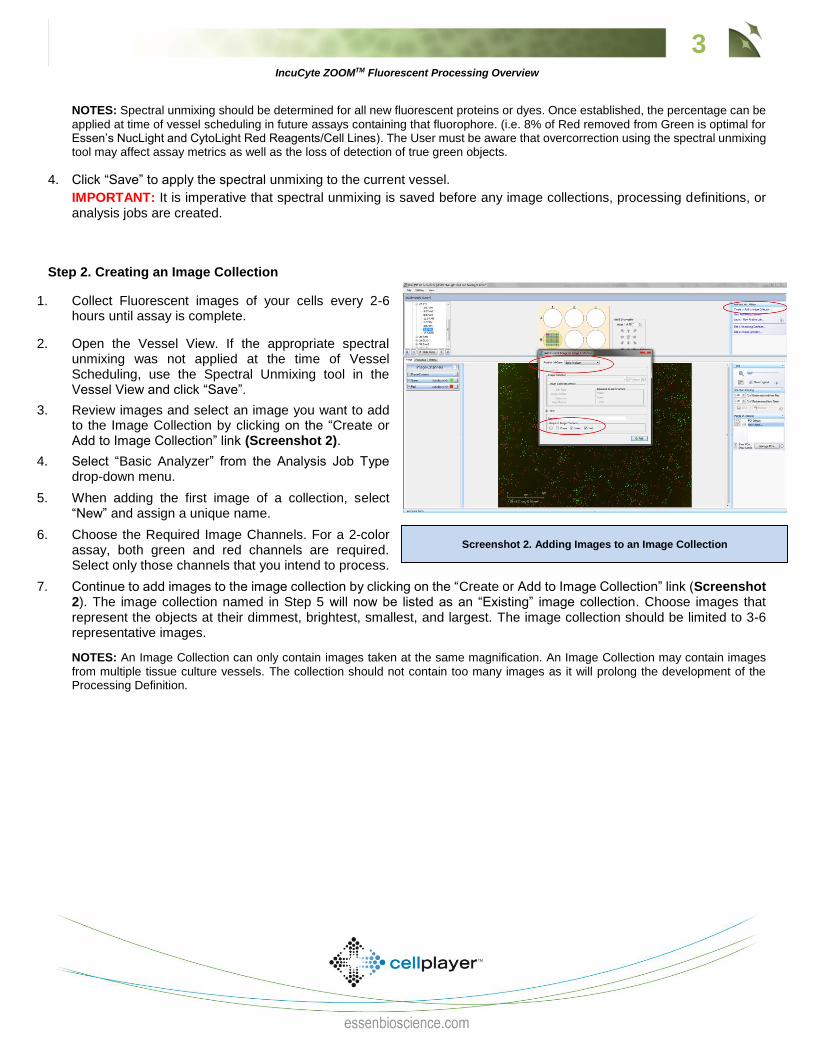
3. Review images and select an image you want to add to the Image Collection by clicking on the “Create or Add to Image Collection” link (Screenshot 2).
4. Select “Basic Analyzer” from the Analysis Job Type drop-down menu.
5. When adding the first image of a collection, select “New” and assign a unique name.
6. Choose the Required Image Channels. For a 2-color assay, both green and red channels are required. Select only those channels that you intend to process.
7. Continue to add images to the image collection by clicking on the “Create or Add to Image Collection” link (Screenshot 2). The image collection named in Step 5 will now be listed as an “Existing” image collection. Choose images that represent the objects at their dimmest, brightest, smallest, and largest. The image collection should be limited to 3-6 representative images.
NOTES: An Image Collection can only contain images taken at the same magnification. An Image Collection may contain images
from multiple tissue culture vessels. The collection should not contain too many images as it will prolong the development of the Processing Definition.
Screenshot 2. Adding Images to an Image Collection
IncuCyte ZOOMTM Fluorescent Processing Overview
4
Step 3. Creating a Processing Definition
1. Start a new Processing Definition by clicking on the “New Processing Definition” link within the Vessel View (found underneath “Analysis Job Utilities” in Screenshot 2).
2. Select the proper Image Collection and click “Continue” (Screenshot 3).
3. The Basic Analyzer Processing Definition Editor will open displaying the “Preview Image Collection” drop down menu (Screenshot 4). This will default to the image collection selected in the previous step (Screenshot 3), but it is advised to check before changing parameters.
NOTE: You may preview a processing definition on multiple
image collections, if desired.
4. Check the boxes which you wish to analyze. For instance, if you are only analyzing Green and Red data it is unnecessary to check the Phase box. This will save time in previewing and running jobs.
5. Assign phenotypic “Object Names” (for example, if your green objects represent nuclei, you will label them “Nuclei”, and the metric would appear as “Nuclei per image”).
6. Choose a “Preview Image Collection” on which to test your processing definitions. This will default to the image collection selected in step 2, but it is advised to check before changing parameters.
NOTE: You may preview a processing definition on multiple
image collections, if desired.
7. Parameters can be adjusted to mask objects in 3 different ways:
Adaptive Segmentation – A local background level (LBL) across each processed image is automatically determined and the user inputs a Threshold Adjustment value this far above the LBL. It is advised to preview the default threshold adjustment of 2.0. To include more objects, lower this parameter, to exclude background, increase this parameter.
Fixed Threshold – A single threshold level in calibrated fluorescence units is used across the image. This number can be set as a number near or in between the dimmest positive object and the brightest background area.
Top Hat – A background trend across the image is estimated and then subtracted. The radius should be measured slightly larger than the smallest radius of the biggest object (Screenshot 5). Use the measuring tool to estimate that distance. A radius that is set too small may result in a loss in object detection. A radius that is set too large can cause incorrect background estimation. This method works best for low-density objects.
8. After determining the Parameters, click “Preview Current" to assess the changes on the current
Screenshot 3: Starting a New Processing Definition
image only or “Preview all” to apply the changes on all the images in you collection. Note: If using Top-Hat, once the image is previewed, a background subtracted image is formed and displayed in a new tab under the available color channels. Use the “Original” and “Background Subtracted” tabs to compare between the two images. Only the “Background Subtracted” image will be used for segmentation.
9. Make sure that both the correct fluorescent image channel box and the “Mask” box are checked and evaluate your mask.
10. Use the “Blend Mode”, “Weight”, “Outlines”, and “Color” selection options to help you to assess the mask (Screenshot 6). Changing these will not affect the processing definition. To clearly determine the mask, you can zoom in on the network using the tool slider followed by the weight slider located under the mask section.
11. If necessary, increase the threshold to eliminate masking of background or decrease the threshold to include dimmer objects. Click “Preview” to assess the changes.
12. Further refine the mask by modifying the Edge split, Cleanup, and Filters.
a. Select “Edge split off” for Edge Split if objects are not closely spaced. The user also has the option to finely tune the Edge split by moving the edge sensitivity bar to the left to minimize the number of splits and to the right to maximize the number of splits.
b. Decrease the size of the mask by entering a negative “Adjust size” value or increase the size of the mask by entering a positive value. Fill the holes in the mask by entering a value in “Hole Fill” option.
c. Apply filters for area, eccentricity, mean intensity, and integrated intensity to eliminate dead cells, debris, or background from being masked as objects (See Fluorescent Processing Parameters on next page for definitions).
13. Once you have previewed the complete Image Collection and are satisfied with the parameters, save the Processing Definition (File > Save) and give it a unique name.
14. You may also “Save as” only green parameters or only red parameters at this time by un-checking the “Analyze” box of the color you wish to no longer include, clicking “Preview”, and clicking File > Save as.
15. If you need to modify your processing definition for a new assay (e.g. new cell type or reagent), click on “Edit a Processing Definition” link in the Vessel View. Adjust the necessary parameters, filters, and cleanup, then “Preview” the changes. After you are satisfied with your changes, choose File > Save to replace the original definition, or File > Save As to save a new processing definition and keep the original.
Screenshot 6: Previewing Object Masks
IncuCyte ZOOMTM Fluorescent Processing Overview
6
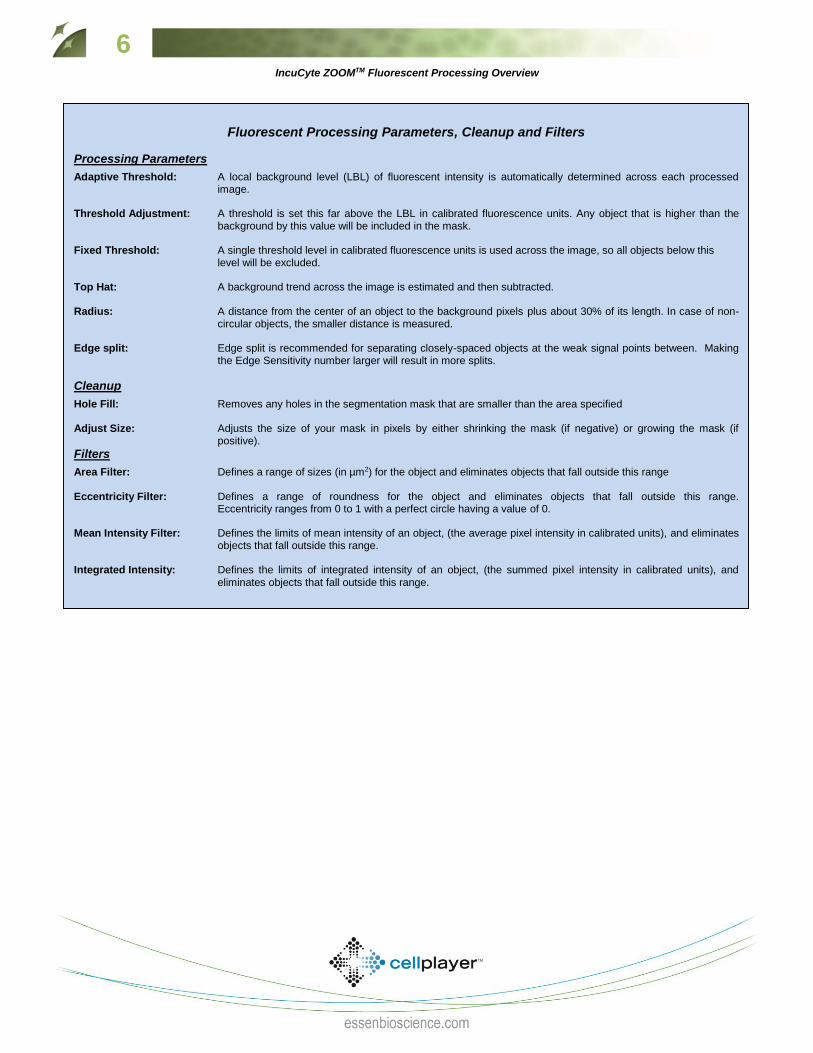
Fluorescent Processing Parameters, Cleanup and Filters
Processing Parameters
Adaptive Threshold: A local background level (LBL) of fluorescent intensity is automatically determined across each processed image.
Threshold Adjustment: A threshold is set this far above the LBL in calibrated fluorescence units. Any object that is higher than the
background by this value will be included in the mask. Fixed Threshold: A single threshold level in calibrated fluorescence units is used across the image, so all objects below this level will be excluded. Top Hat: A background trend across the image is estimated and then subtracted. Radius: A distance from the center of an object to the background pixels plus about 30% of its length. In case of non-
circular objects, the smaller distance is measured. Edge split: Edge split is recommended for separating closely-spaced objects at the weak signal points between. Making the Edge Sensitivity number larger will result in more splits.
Cleanup
Hole Fill: Removes any holes in the segmentation mask that are smaller than the area specified Adjust Size: Adjusts the size of your mask in pixels by either shrinking the mask (if negative) or growing the mask (if positive).
Filters
Area Filter: Defines a range of sizes (in µm2) for the object and eliminates objects that fall outside this range Eccentricity Filter: Defines a range of roundness for the object and eliminates objects that fall outside this range. Eccentricity ranges from 0 to 1 with a perfect circle having a value of 0. Mean Intensity Filter: Defines the limits of mean intensity of an object, (the average pixel intensity in calibrated units), and eliminates objects that fall outside this range. Integrated Intensity: Defines the limits of integrated intensity of an object, (the summed pixel intensity in calibrated units), and
eliminates objects that fall outside this range.
IncuCyte ZOOMTM Fluorescent Processing Overview
7
Fluorescent Processing: Established Assay Phase Option 1. Launch an Analysis Job for an existing
vessel 1. Open the Vessel View for the vessel you wish to
analyze.
2. Click “Launch New Analysis Job” under “Analysis Job Utilities” (Screenshot 7) or at the bottom left corner of the page.
3. Select “Basic Analyzer” for Job Type
4. Choose the “Processing Definition” you wish to use from the drop down menu.
5. Assign a unique name to the Job.
6. You may select a “Time Range”, “Single Time”, or “Open Ended” to analyze.
7. Select the wells you wish to analyze and click “OK”.
Option 2. (Recommended) Launch an Analysis Job
at time of Vessel Scheduling 1. Add a New Vessel and select the appropriate
channels required for imaging (Screenshot 8).
2. Under Spectral Unmixing, enter your pre-determined and optimized %.
3. Under Analysis Job Setup, select “Basic Analyzer” for Job Type.
4. Under the same heading, select your Processing
Definition.
5. Name your vessel, add notes, determine the frequency of scans, and click Apply.
6. Data will be processed following each scan to provide fluorescent object metrics in real-time.
Screenshot 8. Launching an Analysis Job at the time of Vessel
Scheduling
Screenshot 7: Launching an Analysis Job for an existing vessel
IncuCyte ZOOMTM Fluorescent Processing Overview
8
Frequently Asked Questions 1) Q: Why do I see square pattern on my mask after choosing “Adaptive” in Parameters tab?
A: Adaptive Segmentation algorithm breaks each image into small, square segments and estimates the background in
each square individually. When the Threshold Adjustment value is set too close to the value of the background, the algorithm is not able to differentiate between the background and fluorescent objects. Top-Hat Background Subtraction may be more suitable for handling the background in this case. This issue could also be solved by using brighter cells or low-fluorescence media (see Background Fluorescence Tech Note).
2) Q: How do I know if I should use Adaptive, Fixed Threshold or Top-Hat algorithm for my images?
A: Most people use trial-and-error approach. Fixed threshold works best for images with consistent background (which
is usually not the case if you have cells in cell culture media). Top-Hat is a filtering algorithm that helps to remove uneven illumination and isolate positive objects by estimating and subtracting the background from an image. The main advantage of the Top-Hat Subtraction algorithm is the ability to generate a background subtracted image and segment that image, thus enabling the computation of raw fluorescent intensities of objects. Adaptive Segmentation method differentiates the positive objects from the background by detecting the lowest background level and segmenting objects at a user defined threshold above that level. It does not subtract the background from fluorescence intensity metrics and does not provide the user with a background subtracted image.
3) Q: For Top-Hat, how precisely do I have to measure the radius? How easy is it to make a bad mistake?
A: As a general rule, it is better to overestimate you radius value than to underestimate it. Slightly overestimating the
radius is likely to still give you correct background subtraction. Overestimating the radius by a large value may cause loss of sensitivity for background trend, meaning that the background subtraction will be constant throughout the image. Underestimating the radius may cause objects to be undetected and should be avoided. We recommend starting with the default value of 100µm. If your results are good, use that!
4) Q: Does the Top-Hat work on non-circular or non-uniform structures?
A: The Top-Hat method is equally effective for circular and non-circular objects.
5) Q: Sounds like the Top-Hat method works better than Adaptive. I have always used Adaptive method for my cell counts, should I switch to Top-Hat now?
A: Not necessarily. If you have been using Adaptive and it worked for you, there is no reason to switch. Adaptive method
works great for counting objects. However, you may want to switch to Top-Hat if: 1) You want to have raw values of your fluorescent objects and would like to perform comparative analysis between
objects within an image or multiple images. 2) You want to use the images (or make a movie) for a publication or a presentation and need to minimize the
background.
6) Q: I have some previously scanned vessels and I want to see how they would look with the Top-Hat background subtraction. Can I re-analyze them now?
A: Yes, you can! Open your previous Processing Definition (or create a new one) and choose Top-Hat under the
Parameters tab. Preview images then adjust parameters, cleanup and filters as necessary in order to correctly mask the objects of interest. If Top-Hat more appropriately masks the fluorescent objects, re-analyze your data using this saved Processing Definition.
IncuCyte ZOOMTM Fluorescent Processing Overview
9
7) Q: When measuring radius value to put in the Top-Hat tab, do I choose my brightest object or my dimmest object? Should I choose the object surrounded by the highest background or lowest background?
A: The brightness of the object or the brightness of the background around the object does not matter when measuring
radius. Choose a largest object you want to be included in you masking and measure the radius with the measuring tool.
8) Q: How do I measure radius on non-circular objects?
A: Measure the shortest distance from the center of your object to the background and then add ~ 30% to the measured
value.
9) Q: What is the smallest possible radius value of an object? A: 10 µm. If the radius you measured is less than that value, just set the value to 10 µm.
10) Q: When would I use “Hole Fill” option? A: It is useful in case of transparent cells such as HUVECs, where the borders are easily detected, but the center is not.