34
Independent criminal advocacy in England and Wales Analytical Narrative May 2014
Independent criminal advocacyin England and Wales
Analytical Narrative
May 2014


Independent criminal advocacy in England and Wales
Contents
Introduction 3
Section 1: The current state of criminal advocacy 4
Section 2: Routes into the criminal advocacy profession 16
Section 3: Demand for criminal advocacy 24
References 29
1

Analytical narrative
2
Independent criminal advocacy in England and Wales
Introduction
1. This annex supports the Independent Criminal Advocacy Review, commissioned by the Lord Chancellor on 5th September 2013 and conducted by Sir Bill Jeffrey.
2. Pre-published data pertaining to criminal advocacy was collated and used to inform the review throughout the process. Furthermore, additional ad-hoc analysis of unpublished Legal Aid Agency (LAA), Ministry of Justice (MoJ) and HM Courts and Tribunal Service (HMCTS) administrative data was also undertaken at the request of Sir Bill Jeffrey. The purpose of this annex is to present both sets of data used in the review as an analytical narrative.
3. As this annex collates data from a variety of disparate sources, it may serve the secondary purpose of uniting the available data related to criminal advocacy in one location.
4. The data presented in this annex has been grouped into the following three sections:
The current state of criminal advocacy – which presents data on the number of practicing advocates, how much they receive in payment from public sources, the diversity of the profession, the proportion of work carried out by solicitor advocates at a national and regional level and the proportion of led juniors that are solicitor advocates.
Routes into the criminal advocacy profession – which presents data on the training processes that prospective advocates undergo. This includes the training process for both solicitors and barristers.
Demand for criminal advocacy – which presents data on trends in crime, particularly serious crime, as well as Crown Court case volumes, the number of legal aid applications and the proportion of defendants represented by legally aided barristers.
3

Analytical narrative
Section 1: The current state of criminal advocacy
Overview
5. The number of solicitor advocates practicing in criminal courts has risen each year since solicitors first acquired Higher Rights of Audience qualifications in 1994. Due to data limitations it is more difficult to assess how the number of criminal barristers has changed over time. Since 2006/07, the proportion of publicly funded Crown Court defence advocacy undertaken by solicitor advocates has increased each year. Barrister payments from public sources varies widely though some barristers undertaking criminal defence work remunerated by the Advocates’ Graduated Fee Scheme (AGFS)1 may not be doing many publicly funded cases each year.
Around a third of barristers practice criminal law and the number of solicitor advocates practicing criminal law increases each year
6. As of February 2014, there were 15,615 barristers practicing in England and Wales.2 The Bar Standards Board (BSB) estimate that just under a third of these, around 5,000, specialise in criminal law. This estimate is consistent with the 2011 Barristers’ Working Lives survey3 where a third of those surveyed stated that criminal law was their main area of practice.
7. The 2014 Bar Barometer report suggests that the total number of barristers in practice rose by 4% between 2007 and 2012 from 15,030 to 15,585.4 Neither the BSB nor the Bar Council has published figures on the barrister populations for 2013 and the extent to which the figures for 2007 to 2012 are comparable with the 2014 figure above is unknown.
8. The BSB informed the Criminal Advocacy Review that it is difficult to establish reliable figures on the number of barristers by area of practice as it is not compulsory for barristers to disclose their area(s) of practice to them. The BSB advises that work is ongoing to improve the recording of practice area on their data systems.
9. The Solicitors Regulation Authority (SRA) publishes statistics on the practicing population of solicitors with the Higher Rights of Audience qualification that enables them to carry out advocacy work. As of February 2014, there were 3,284 solicitor advocates with Higher Rights of Audience who solely practiced in the criminal courts, and a further 1,531 practicing both civil and criminal advocacy.5
1 The Advocates Graduated Fee Scheme, or AGFS, is administered by the Legal Aid Agency and is used to pay advocates for legally aided work. The level of payment can depend on the type of case, the offence, a basic fee, the number of pages of prosecution evidence, the number of witnesses, the number of attendance days and the type of advocate (e.g. a QC or a led junior). 2 This figure was supplied by the BSB to the Criminal Advocacy Review. It has not come from a published source. 3 See <http://www.barcouncil.org.uk/media/99583/barristers__working_lives_06_02_12_web_2.pdf> 4 See < https://www.barstandardsboard.org.uk/media/1584380/barometer_report_112pp_ tuesday_3.pdf> 5 See <http://www.sra.org.uk/sra/how-we-work/reports/data/higher_rights_of_audience.page>
4
Independent criminal advocacy in England and Wales
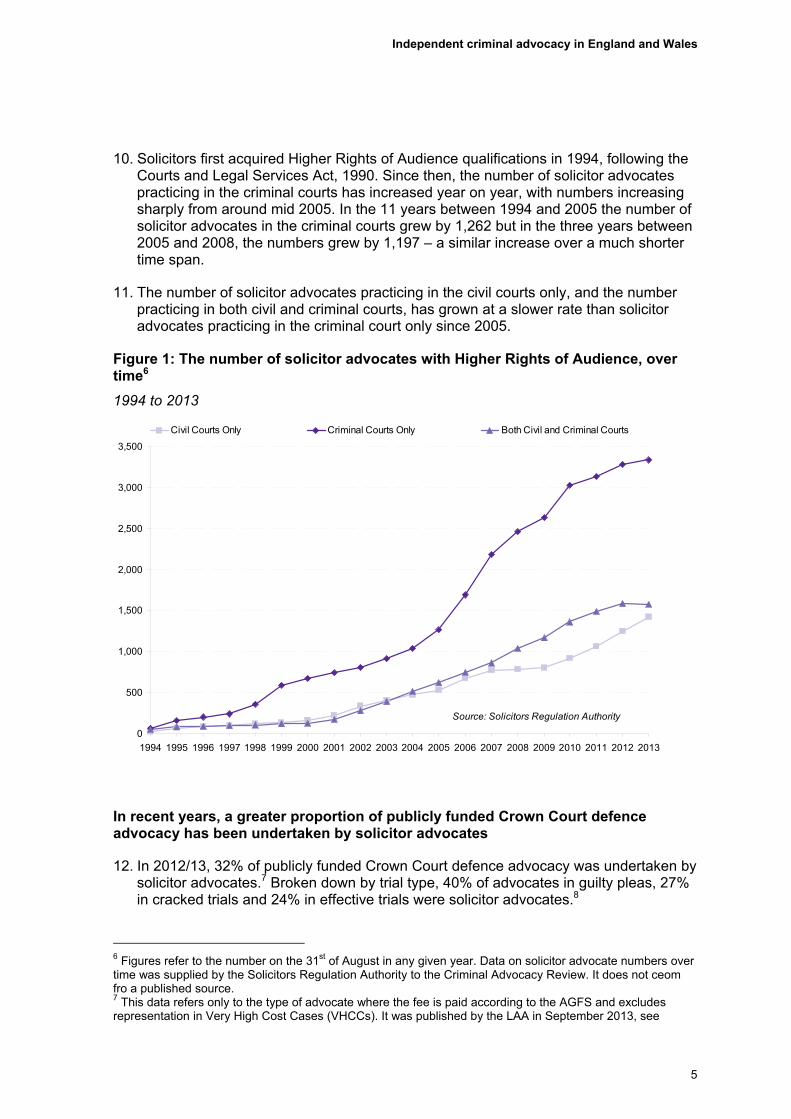
10. Solicitors first acquired Higher Rights of Audience qualifications in 1994, following the Courts and Legal Services Act, 1990. Since then, the number of solicitor advocates practicing in the criminal courts has increased year on year, with numbers increasing sharply from around mid 2005. In the 11 years between 1994 and 2005 the number of solicitor advocates in the criminal courts grew by 1,262 but in the three years between 2005 and 2008, the numbers grew by 1,197 – a similar increase over a much shorter time span.
11. The number of solicitor advocates practicing in the civil courts only, and the number practicing in both civil and criminal courts, has grown at a slower rate than solicitor advocates practicing in the criminal court only since 2005.
Figure 1: The number of solicitor advocates with Higher Rights of Audience, over time6
1994 to 2013
0
500
1,000
1,500
2,000
2,500
3,000
3,500
1994 1995 1996 1997 1998 1999 2000 2001 2002 2003 2004 2005 2006 2007 2008 2009 2010 2011 2012 2013
Civil Courts Only Criminal Courts Only Both Civil and Criminal Courts
Source: Solicitors Regulation Authority
In recent years, a greater proportion of publicly funded Crown Court defence advocacy has been undertaken by solicitor advocates
12. In 2012/13, 32% of publicly funded Crown Court defence advocacy was undertaken by solicitor advocates.7 Broken down by trial type, 40% of advocates in guilty pleas, 27% in cracked trials and 24% in effective trials were solicitor advocates.8
6 Figures refer to the number on the 31st of August in any given year. Data on solicitor advocate numbers over time was supplied by the Solicitors Regulation Authority to the Criminal Advocacy Review. It does not ceom fro a published source. 7 This data refers only to the type of advocate where the fee is paid according to the AGFS and excludes representation in Very High Cost Cases (VHCCs). It was published by the LAA in September 2013, see
5

Analytical narrative
13. As Figure 2 shows, the proportion of publicly funded Crown Court defence advocacy undertaken by solicitor advocates started to increase in 2006/07; this rise began at the same time as the largest recorded year on year rise in the number of solicitor advocate practicing criminal law (between 2006 and 2007 the number grew by 493). The trial type that saw the largest rise in the proportion of publicly funded Crown Court defence advocacy undertaken by solicitor advocates between 2006/07 and 2012/13 was guilty pleas, which increased by 33 percentage points from 7% in 2006/07 to 40% in 2012/13.
Figure 2: The proportion of publicly funded Crown Court defence advocacy undertaken by solicitor advocates, for effective trials, cracked trials and guilty pleas9
2002/03 to 2012/13
0%
5%
10%
15%
20%
25%
30%
35%
40%
45%
2002/03 2003/04 2004/05 2005/06 2006/07 2007/08 2008/09 2009/10 2010/11 2011/12 2012/13
Guilty Pleas Cracked Trials Effective Trials
Source: Legal Aid Agency/Ministry of Justice
14. Between 2006 and 2009, the guilty plea rate in the Crown Court also increased by 6 percentage points from 65% to 71%10, meaning that more guilty plea and cracked trial
<https://www.gov.uk/government/uploads/system/uploads/attachment_data/file/238115/legal-aid-statistics-090913.pdf>, and it only refers to trials (guilty pleas, cracked trials and effective trials). It does not include other work such as committals for sentence or appeals). 8 A guilty plea case occurs where the defendant enters a guilty plea on all counts or some of the counts provided no jury is sworn in respect to the not guilty counts. A cracked trial is a case in which proceedings are stopped due to the defendant(s) pleading guilty or the prosecution offering no evidence after the accused is indicted but before the trial begins. An effective trial is a trial that commences on the day it is scheduled and a verdict is reached or the case is concluded. 9 The data in Figure 2 does not come from a published source; it comes from an ad-hoc request made to both the LAA and the MoJ for the Criminal Advocacy Review. The 2011/12 and 2012/13 data comes from LAA administrative datasets. Data for 2010/11 and previous years comes from the Criminal Legal Aid Transition (CLAT) database held by the MoJ. CLAT is a management information system that records payments made to barristers and solicitors for work carried out in the Crown Court - AGFS payments were originally made via the CLAT system but responsibility has since transferred to the LAA.
6

Independent criminal advocacy in England and Wales
work was becoming available at the same time as solicitor advocates were doing proportionately more guilty plea and cracked trial work. Going back further in time, the guilty plea rate rose year on year between 2001 and 2009. The MoJ have advised that the data required to determine the guilty plea rate is unreliable prior to 2001, so it has not been presented in Figure 3. Since 2009 there has been a slight decline in the guilty plea rate, to 69% in 2013.
Figure 3: The guilty plea rate in trial cases in the Crown Court, for England and Wales
2001 to 2013
0%
10%
20%
30%
40%
50%
60%
70%
80%
2001 2002 2003 2004 2005 2006 2007 2008 2009 2010 2011 2012 2013
Source: Ministry of Justice
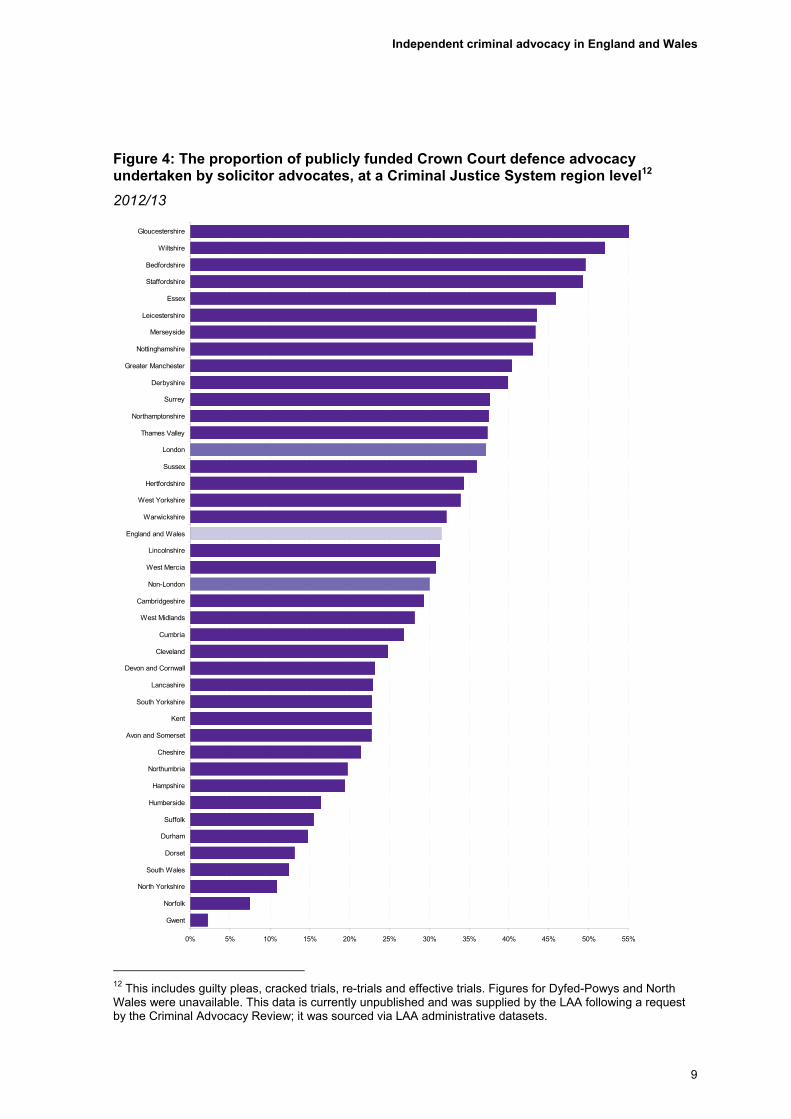
15. There is variation between CJS regions when the 2012/13 LAA data are split sub-nationally. The following statistics for each CJS region, and those in Figure 4, refer to trials heard in the Crown Courts within that region, rather than offences necessarily taking place there. In Gloucestershire, 56% of publicly funded Crown Court defence advocacy was undertaken by solicitor advocates, compared with 8% in Norfolk and 2% in Gwent. For the London CJS regions, 37% of publicly funded Crown Court defence work was undertaken by solicitor advocates in 2012/13, compared with 30% for the non-London regions.
10 The guilty plea rate is the number of defendants pleading guilty to all counts as a proportion of all defendants with a plea. It includes those who change their plea from not guilty to guilty during a case. For the statistics, see Table 3.7 of Court Statistics Quarterly – October to December 2013, published by the MoJ - <https://www.gov.uk/government/publications/court-statistics-quarterly-october-to-december-2013>
7
Analytical narrative
16. For all CJS regions except Norfolk, solicitor advocates undertook a greater proportion of Crown Court defence advocacy for guilty pleas than they did for either cracked trials or effective trials.
17. The guilty plea rate also varies between CJS regions. In 2012, the highest guilty plea rate in Crown Courts trial cases was in Durham, at 80%, which compares to the lowest rate of 54% in London.11 Figure 5 further suggests a correlation between geography and the guilty plea rate in 2012, with a lower guilty plea rate in the southern half of the country; for the 15 CJS regions with a guilty plea rate of 70% or lower, the CJS region furthest north was the West Midlands.
11 2012 data on the guilty plea rate for different CJS regions does not come from a published source. It was provided by the MoJ following a request by the Criminal Advocacy Review.
8
Independent criminal advocacy in England and Wales
Figure 4: The proportion of publicly funded Crown Court defence advocacy undertaken by solicitor advocates, at a Criminal Justice System region level12
2012/13
0% 5% 10% 15% 20% 25% 30% 35% 40% 45% 50% 55%
Gwent
Norfolk
North Yorkshire
South Wales
Dorset
Durham
Suffolk
Humberside
Hampshire
Northumbria
Cheshire
Avon and Somerset
Kent
South Yorkshire
Lancashire
Devon and Cornwall
Cleveland
Cumbria
West Midlands
Cambridgeshire
Non-London
West Mercia
Lincolnshire
England and Wales
Warwickshire
West Yorkshire
Hertfordshire
Sussex
London
Thames Valley
Northamptonshire
Surrey
Derbyshire
Greater Manchester
Nottinghamshire
Merseyside
Leicestershire
Essex
Staffordshire
Bedfordshire
Wiltshire
Gloucestershire
12 This includes guilty pleas, cracked trials, re-trials and effective trials. Figures for Dyfed-Powys and North Wales were unavailable. This data is currently unpublished and was supplied by the LAA following a request by the Criminal Advocacy Review; it was sourced via LAA administrative datasets.
9

Analytical narrative
Figure 5: The guilty plea rate in trial cases, split by Criminal Justice System region
2012
0% 10% 20% 30% 40% 50% 60% 70% 80%
London
Dorset
Dyfed-Powys
Thames Valley
Kent
Bedfordshire
Hampshire & Isle of Wight
Hertfordshire
Sussex
England and Wales
Cambridgeshire
Surrey
Devon & Cornwall
Wiltshire
West Midlands
Essex
Suffolk
Avon & Somerset
Leicestershire
North Yorkshire
Cleveland
Gloucestershire
Derbyshire
Northamptonshire
South Wales
West Mercia
Lincolnshire
North Wales
Norfolk
Greater Manchester
Nottinghamshire
West Yorkshire
Merseyside
Humberside
Staffordshire
Cheshire
Cumbria
Northumbria
South Yorkshire
Lancashire
Warwickshire
Durham
18. Figures 2 and 4 refer to publicly funded defence advocacy in the Crown Court but it is
difficult to determine whether a similar picture exists in the magistrates’ court. Advocates in the magistrates’ court are either unassigned counsel, which means the advocate has been directly instructed by either a solicitor or the client, or assigned counsel which is where the LAA pays an advocate for any work undertaken because they deem the case to be sufficiently complex as to warrant an advocate. LAA payment to assigned counsel totals less than £1m per annum, for example in 2012/13 the LAA paid £600,000 to the 149 barristers who performed advocacy work in the
10
Independent criminal advocacy in England and Wales
magistrates’ court.13 Unassigned advocates are not remunerated directly by the LAA so the LAA do not collect data on whether the advocate is a solicitor advocate, barrister or legal executive.
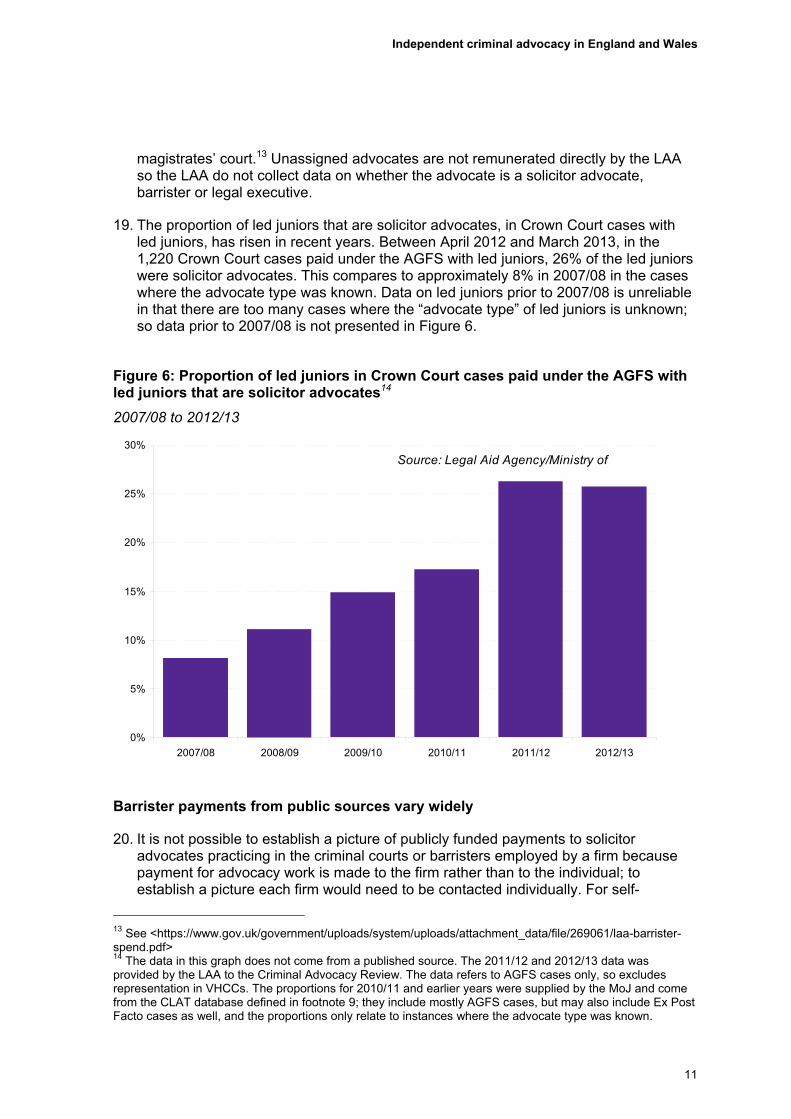
19. The proportion of led juniors that are solicitor advocates, in Crown Court cases with led juniors, has risen in recent years. Between April 2012 and March 2013, in the 1,220 Crown Court cases paid under the AGFS with led juniors, 26% of the led juniors were solicitor advocates. This compares to approximately 8% in 2007/08 in the cases where the advocate type was known. Data on led juniors prior to 2007/08 is unreliable in that there are too many cases where the “advocate type” of led juniors is unknown; so data prior to 2007/08 is not presented in Figure 6.
Figure 6: Proportion of led juniors in Crown Court cases paid under the AGFS with led juniors that are solicitor advocates14
2007/08 to 2012/13
0%
5%
10%
15%
20%
25%
30%
2007/08 2008/09 2009/10 2010/11 2011/12 2012/13
Source: Legal Aid Agency/Ministry of
Barrister payments from public sources vary widely
20. It is not possible to establish a picture of publicly funded payments to solicitor advocates practicing in the criminal courts or barristers employed by a firm because payment for advocacy work is made to the firm rather than to the individual; to establish a picture each firm would need to be contacted individually. For self-
13 See <https://www.gov.uk/government/uploads/system/uploads/attachment_data/file/269061/laa-barrister-spend.pdf> 14 The data in this graph does not come from a published source. The 2011/12 and 2012/13 data was provided by the LAA to the Criminal Advocacy Review. The data refers to AGFS cases only, so excludes representation in VHCCs. The proportions for 2010/11 and earlier years were supplied by the MoJ and come from the CLAT database defined in footnote 9; they include mostly AGFS cases, but may also include Ex Post Facto cases as well, and the proportions only relate to instances where the advocate type was known.
11

Analytical narrative
employed barristers, however, some analysis has been undertaken to establish how much they were paid from public sources each year.
21. Analysis of 2012/13 AGFS closed case data (which means only cases that finished during the 2012/13 period) suggests that there is a relationship between payment levels and the number of cases that a barrister completes in a year. Barristers with higher levels of payment tend to complete on average both more cases, and cases with more evidence pages, than barristers with lower levels of payment – as Figure 7 shows.
22. The 2011 Barristers’ Working Lives survey found that 60% of self-employed criminal barristers who reported a change in workload noted that their workload had decreased over the last 12 months.15 Possible explanations of this include falls in Crown Court receipts between 2009 and 2012 (see Section 3 of the annex) or increasing proportions of publicly funded Crown Court defence work undertaken by solicitor advocates. However, it is important to note Figure 7 only concerns AGFS work whereas self-employed barristers can receive payment from a variety of other sources.
Figure 7: Relationship between 2012/13 AGFS payment levels for completed cases and the number and complexity of AGFS cases (including VAT)16
0
2
4
6
8
10
12
14
£0 to £10k £10k to £20k £20k to £30k £30k to £50k £50k to £75k £75k to £100k £100k to £150k £150k to £200k Over £200k
AGFS Annual Payment Band (Inc VAT)
Ave
rag
e N
um
ber
of
Cas
es
0
200
400
600
800
1000
1200
1400
1600
1800
2000
Nu
mb
er of E
viden
ce Pag
es
Mean Number of Guilty Pleas
Mean Number of Cracked Trials
Mean Number of Trials
Average Number of Evidence Pages in Guilty Pleas
Average Number of Evidence Pages in Cracked Trials
Average Number of Evidence Pages in Trials
No. of barristers: in band
921 519 402 609 520 65146355346
34 cases
31 cases
26 cases
21 cases
16 cases
11 cases
7 cases
Mean total =3 cases
33 casesSource: Legal Aid Agency/Ministry of Justice
15 See < > http://www.barcouncil.org.uk/media/99583/barristers__working_lives_06_02_12_web_2.pdf16 Figure 6 was sourced from the MoJ’s ‘Transforming Legal Aid – Next Steps: Government Response’ paper published in February 2014 - <
> https://consult.justice.gov.uk/digital-communications/transforming-legal-aid-
next-steps/consult_view
12

Independent criminal advocacy in England and Wales
23. In England and Wales, criminal advocates can receive payment from a variety of public sources, including the Advocates Graduated Fee Scheme, the Crown Prosecution Service Graduated Fee Scheme, the Magistrates’ court scheme, for representation in the civil courts and payments made to panel or non-panel advocates in respect of very high cost cases in the Crown Court.
24. The MoJ has published data on barrister’s combined payments from these sources.17 In 2012/13, the mean payment level from these sources combined was £72,000 and the median was £56,000; the mean is higher than the median because it is influenced by a small number of barristers who received very large payments. These figures are inclusive of the VAT that barristers must pay to HM Revenue and Customs, they do not deduct expenses such as chambers fees nor do they include any income from non-public sources.
25. Under a quarter (24%) of criminal barristers received less than £20,000 in payments from these sources in 2012/13, and just over a quarter (26%) received more than £100,000. Figure 8 shows how payments were distributed across the 4,931 barristers who were paid from public sources in 2012/13. Barristers are only included in Figure 8 if they did at least some criminal advocacy work.
Figure 8: Distribution of criminal barrister total payments from public sources, inclusive of VAT and disbursements
2012/13
0
100
200
300
400
500
600
700
800
0-10
k
10-2
0k
20-3
0k
30-4
0k
40-5
0k
50-6
0k
60-7
0k
70-8
0k
80-9
0k
90-1
00k
100-
110k
110-
120k
120-
130k
130-
140k
140-
150k
150-
160k
160-
170k
170-
180k
180-
190k
190-
200k
200-
250k
250-
300k
300-
400k
400-
500k
500-
600k
600-
700k
Median £56,000
Mean £72,000
Source: Legal Aid Agency/Ministry of Justice
26. It is difficult to establish a picture of how payments to barristers have evolved over a long period of time. The main reason for this is that the AGFS has undergone a number of changes over the years such as shifting away from multiple advocates being able to bill for a case. Furthermore, advocates used to undertake work whereby payments were made on an ex post facto basis (known as the EPF scheme) at the end of a case, which could be a number of years after initial instruction. Barristers
17 See the ad-hoc publication from the MoJ, published in early 2014, entitled ‘Barrister fee income from public sources 2012/13’ - <https://www.gov.uk/government/uploads/system/uploads/attachment_data /file/269061/laa-barrister-spend.pdf>
13

Analytical narrative
typically received a single one-off payment for each case under the EPF scheme. In 2001, case contracts were more closely managed by the then Legal Services Commission so that advocates would be paid throughout the life of the case according to a payment schedule, rather than a single large payment at the end of the case. However, while barristers were undertaking work under these new contracts, they were still receiving payments under the EPF scheme in those cases that pre-dated the case contract scheme. This made it difficult to differentiate payments to advocates by fee paying scheme in the early to mid 2000s.
The Bar is less diverse than the general population
27. As of yet, there have been no published demographic statistics specifically related to criminal advocates, limiting any analysis on the diversity of the advocacy profession to barristers or solicitors as a whole.
28. At the time of writing, the most recent data on the diversity of the Bar is the 2014 Bar Barometer report. This suggested that barristers were more likely to be male and white than other branches of the legal profession and the general population of England and Wales – as Table 1 suggests.
Table 1: Gender and ethnicity demographic breakdowns for different branches of the legal profession18 19 20
Advocate Type % Male % Female % White % Black and Minority Ethnic
Barristers (in 2012)* 65% 35% 88% 12%Solicitors (in 2012) 53% 47% 86% 14%Legal Executives (in 2013) 26% 74% N/A N/AEngland and Wales (2011 census) 49% 51% 86% 14%* Barrister ethnicity and gender proportions have excluded barristers where the demographic was unknown.
Gender Ethnicity
29. Gender diversity for barristers varies by employment type; there is a smaller difference
in the gender proportions for employed barristers than for self-employed barristers.
Table 2: Barrister gender, by employment type in 2010 21
Male Female Difference (percentage points)Employed 54% 46% 7Self-employed 68% 32% 36All barristers 65% 35% 30
18 Sources: 2014 Bar Barometer, Solicitors Regulation Authority, Chartered Institute of Legal Executives (CILEx) and the 2011 Census results. 19 The Solicitor statistics relate to solicitors on the roll, rather than solicitor advocates exclusively. The solicitor figures include registered European lawyers, registered foreign lawyers and exempt European lawyers. 20 CILEx ethnicity figures have not been provided because the ethnic group proportions published in the ‘CILEx Membership Diversity Statistics’ section of their website do not sum to 100%. Elsewhere on the CILEx website, it is estimated that 13% of CILEx members are of an ethnic minority – see <http://www.cilex.org.uk/about_cilex/equality_and_diversity/cilex_and_social_mobility.aspx> 21 Percentage point differences may not sum due to rounding.
14

Independent criminal advocacy in England and Wales
30. The 2011 Barristers’ Working Lives survey also suggests that 31% of employed barristers and 47% of self-employed barristers went to a fee paying school.
More individuals are leaving the criminal Bar than other areas of practice
31. The Bar Exit Survey, published by the Bar Council, surveys those who leave the Bar or change their practicing status. Throughout their most recent report, published in 2011, barristers that do either of these are referred to as ‘leavers’.22 The 2011 Bar Exit Survey publication covers leavers in the periods 2001-2004, and 2006-2010, using survey results from a 2005 survey, and annual surveys conducted each year from 2007 to 2011.
32. In 2008, 2009 and 2010, of those leaving the area of practice with the highest proportion of leavers was the criminal Bar though the proportion fell each year, from 46% in 2008 to 36% in 2010. Comparable data on area of practice was not provided for the previous surveyed years.
33. Looking at self-employed leavers for all surveyed years, 46% of self-employed leavers said that criminal law was their main area of practice. The Bar Exit Survey compares this with 31% of barristers surveyed in the 2011 Barristers’ Working Lives survey who said that their current area of practice was criminal law. Data on self-employed criminal barristers for specific years was not presented in the report.
34. The Bar Exit Survey asked respondents firstly why they left the self-employed Bar, and subsequently for the factors that influenced this decision. The foremost reason for any barrister leaving the self-employed Bar was to transfer to the employed Bar. Retirement and child care responsibilities were also commonly cited as reasons.
35. In terms of factors that influenced the decision to leave, financial reasons were the most prominent factor in most cases (63% of self-employed leavers cited a financial reason, of which uncertainty over future levels of income was the main sub-concern). The 2011 Bar Exit Survey report attributes financial reasons as being the most important factor influencing leaving for the criminal Bar specifically though a precise figure was not reported.
36. Amongst employed leavers, criminal law was also the main area of practice, with 39% of employed leavers from all surveyed years combined coming from the criminal Bar. Retirement, rather than transferring to the self-employed Bar, was the most common reason for leaving the employed Bar. However, as with the self-employed Bar, financial reasons were the most important factor influencing the decision to leave, though 24% of the employed bar gave this reason as opposed to the 63% of the self-employed Bar. Reasons for leaving were not split by area of practice.
22 For the latest publication of the Bar Exit Survey, see <http://www.barcouncil.org.uk/media/18145/ 15_12_general_council_of_the_bar_leavers_report.pdf>
15
Analytical narrative
Section 2: Routes into the criminal advocacy profession
Overview
37. The number of undergraduate law students increased between 2002/03 and 2009/10 but has since started to fall. Similarly, the number of students enrolling on either the Bar Professional Training Course (BPTC) or the solicitor’s Legal Practice Course (LPC) has declined in recent years. Applying for pupillage is a competitive process. Much of the data in this section refers to all barristers or solicitors, without differentiating by area of practice.
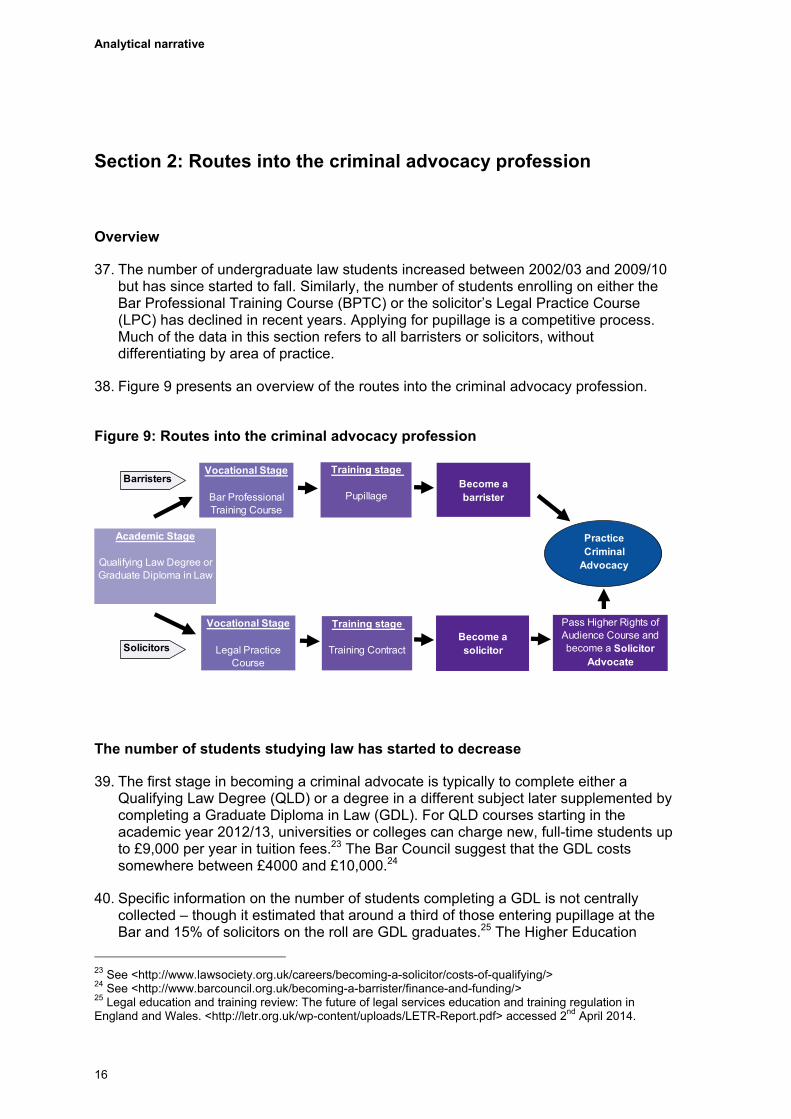
38. Figure 9 presents an overview of the routes into the criminal advocacy profession.
Figure 9: Routes into the criminal advocacy profession
Training stage
Pupillage
Vocational Stage
Legal Practice Course
Academic Stage
QG
ualifying Law Degree or raduate Diploma in Law
Vocational Stage
Bar Professional Training Course
Training stage
Training Contract
Become a barrister
Become a solicitor
Pass Higher Rights of Audience Course and become a Solicitor
Advocate
Practice Criminal
Advocacy
Barristers
Solicitors
The number of students studying law has started to decrease
39. The first stage in becoming a criminal advocate is typically to complete either a Qualifying Law Degree (QLD) or a degree in a different subject later supplemented by completing a Graduate Diploma in Law (GDL). For QLD courses starting in the academic year 2012/13, universities or colleges can charge new, full-time students up to £9,000 per year in tuition fees.23 The Bar Council suggest that the GDL costs somewhere between £4000 and £10,000.24
40. Specific information on the number of students completing a GDL is not centrally collected – though it estimated that around a third of those entering pupillage at the Bar and 15% of solicitors on the roll are GDL graduates.25 The Higher Education
23 See < > http://www.lawsociety.org.uk/careers/becoming-a-solicitor/costs-of-qualifying/24 See < > http://www.barcouncil.org.uk/becoming-a-barrister/finance-and-funding/25 Legal education and training review: The future of legal services education and training regulation in England and Wales. <http://letr.org.uk/wp-content/uploads/LETR-Report.pdf> accessed 2nd April 2014.
16

Independent criminal advocacy in England and Wales
Statistics Agency (HESA)26 does publish statistics on the number of students enrolling on law courses.
41. HESA’s statistics suggest the number of students enrolling on undergraduate law courses rose by 27% between 2002/03 and 2012/13 from 53,865 to 68,540. However the number of law undergraduates peaked in 2009/10 at 72,140 which is 5% higher than the number for 2012/13, pointing to a decline in recent years.
42. Between 2002/03 and 2012/13 the number of students enrolling on postgraduate law courses fell by 13%, from 23,815 to 20,650, though numbers started to decline in 2007/08.
Figure 10: Law student university enrolment, by level of study
2002/03 to 2012/13
0
10,000
20,000
30,000
40,000
50,000
60,000
70,000
80,000
2002/03 2003/04 2004/05 2005/06 2006/07 2007/08 2008/09 2009/10 2010/11 2011/12 2012/13
Undergraduate Law Students Postgraduate Law Students
Source: Higher Education Statistics Agency
The number of law students enrolled onto either the BPTC or the LPC has fallen in recent years
43. Having completed the academic stage, students then choose whether they want to become a solicitor or a barrister. Prospective barristers apply for and complete the BPTC – 2014/15 BPTC fees vary between £12,000 and £18,00027 - whereas prospective solicitors complete the LPC, for which fees vary between £8,500 and £12,900.28 Survey evidence for 2005/06 (prior to the establishment of the BPTC)
26 See < > http://www.hesa.ac.uk/index.php?option=com_pubs&task=show_pub_detail&pubid=1& Itemid=28627See <
> https://www.barstandardsboard.org.uk/qualifying-as-a-barrister/bar-professional-training-course/bptc-
frequently-asked-questions/#fees28 See <http://www.lawsociety.org.uk/careers/becoming-a-solicitor/costs-of-qualifying/>
17

Analytical narrative
suggested loans were the most common way of funding professional training to be a barrister.29 Recent evidence from 2011 suggests that a third of pupil applicants funded their BPTC via a loan.30
44. The BPTC replaced the Bar Vocational Course (BVC) in 2010/11 following the Wood Review. Its purpose is to provide students with the skills required to be a barrister. The 2014 Bar Barometer publishes BPTC statistics for 2007/08 to 2011/12 and figures prior to this on their website.31 In 2011/12 there were 3,017 applications for the BPTC – a decrease on the previous year of 3%.
45. In 2011/12 there were 1,732 students that enrolled on the BPTC. Between 2006/07 and 2011/12, the number of BVC/BPTC enrolments fell by 200 (or 10%) from 1,932 to 1,732. The Wood Review concluded that admission standards for the BVC/BPTC were too low and that too many students were being enrolled given the number of pupillages available – following the review a compulsory Bar Course Aptitude Test has been introduced for prospective 2013 BPTC entrants onward.32
Figure 11: Bar Vocational Course / Bar Professional Training Course statistics
BVC for 2003/04 to 2009/10, BPTC for 2010/11 and 2011/12
0
500
1,000
1,500
2,000
2,500
3,000
3,500
2003/04 2004/05 2005/06 2006/07 2007/08 2008/09 2009/10 2010/11 2011/12
Applicants Enrolments (those who successfully apply) Pass the Course
Source: Bar Standards Board
29 ERS Market Research (2006) Bar Council BVC student survey on aspirations for full practice at the Bar – full report.<http://www.barcouncil.org.uk/media/18169/bvcsurveyaspirationsatbar2006.pdf> accessed 2nd April 2014. 30 Carney, C. (2011) An analysis of the backgrounds of pupil portal applicants in 2011. The General Council of the Bar of England and Wales. <http://www.barcouncil.org.uk/media/62529/ppa2011cc.pdf> accessed 2nd April 2014. 31 See < https://www.barstandardsboard.org.uk/media/1584380/barometer_report_112pp_ tuesday_3.pdf>. 32 See <https://www.barstandardsboard.org.uk/media/1353435/bvc_report_final_with_annexes_as_ on_website.pdf>
18

Independent criminal advocacy in England and Wales
46. Since 1993/94 (the earliest available data point), more LPC places have been available than the number of students that enrol on them. The Law Society state that in 2010/11 there were 15,166 LPC places available (of which 20% were part-time) and a total of 7,064 students enrolled onto them. Law Society figures33 also show that the number enrolling on the LPC peaked in 2006/07 at 9,850 but has since fallen each year. Not all prospective solicitors who complete the LPC go on to become solicitor advocates, some will solely undertake litigation.
Obtaining a pupillage is a competitive process
47. After completing the vocational stage, students proceed to a training stage. Prospective barristers undertake a one year pupillage in which they receive training from more experienced barristers either in a set of chambers or in an organisation. Prospective solicitors undertake a training contract working under the supervision of qualified solicitors in a firm.
48. Students can apply for a pupillage using either the Bar Council’s online Pupillage Gateway system or directly to Chambers. The BSB have published statistics on their website on the number of pupils registered for their first six, which is the first six months of a pupillage, for the years 2002/03 to 2010/11.34 The figure for 2011/12, published in the 2014 Bar Barometer, shows 438 pupils registering for their first six in that year.35 Each year since 2007/08, when 562 pupils registered, the number of registrations has been falling.
33 Dixon, D. (2012) Entry to the solicitor’s profession 1980-2011. The Law Society. <http://www.lawsociety.org.uk/careers/becoming-a-solicitor/documents/trends-in-entry-to-the-solicitors-profession-1980-2011/> accessed 2nd April 2014. 34 See <https://www.barstandardsboard.org.uk/media-centre/research-and-statistics/statistics/pupillage-statistics/> 35 See < https://www.barstandardsboard.org.uk/media/1584380/barometer_report_112pp_ tuesday_3.pdf>
19

Analytical narrative
Figure 12: Number of first six pupillages registered by pupils
2002/03 to 2011/12
0
100
200
300
400
500
600
700
2002/03 2003/04 2004/05 2005/06 2006/07 2007/08 2008/09 2009/10 2010/11 2011/12
Source: Bar Standards Board
49. For 2008/09 to 2010/11, the BSB has also published annual figures on the number of applications for pupillage and the number of successful applicants.36 The latest figures (2010/11) suggest there were 2,865 applications and 446 pupils registering on their first six, a ratio of 6.4 applications to each pupillage available. Prospective pupils can make multiple applications, so the figures do not refer to a ratio for applicants; nevertheless the Bar Council acknowledges that obtaining a pupillage is an ‘extremely competitive process’.37
50. As part of their submission to the Criminal Advocacy Review, the BSB provided more recent statistics on applications via the Pupillage Gateway system. In 2013 there were 2,708 applications via the Gateway and 187 successful applications, a ratio of 14.5 applications to 1 successful application.38 Again, it is worth noting that the ratio refers to applications, not applicants; a prospective pupil can submit multiple applications via the Gateway.
51. The 2014 Bar Barometer presents statistics on pupil’s main pupillage practice area, though notes that pupillages as a whole cannot be categorised into particular practice areas because pupils can practice different areas of law.39 In both 2010/11 and 2011/12, around a quarter of pupils identified criminal law as the main area of practice; in both years criminal law had the highest proportion of pupils of all areas of practice.
36 See <https://www.barstandardsboard.org.uk/media-centre/research-and-statistics/statistics/pupillage-statistics/> 37 See <http://www.barcouncil.org.uk/becoming-a-barrister/how-to-become-a-barrister/pupillage/> 38 These statistics do not come from a published source. 39 See <https://www.barstandardsboard.org.uk/media/1584380/barometer_report_112pp_ tuesday_3.pdf>
20

Independent criminal advocacy in England and Wales
52. For all pupillages in 2011/12, the Bar Barometer reports that 72% of surveyed pupils intended to undertake their pupillage in London, compared to 28% outside London.
53. Pupillage applications can be made prior to completing the BPTC; the number of applications may therefore include students who have not successfully completed their BPTC. Furthermore, Law Schools often advise prospective barristers to submit pupillage applications towards the end of their degree, even if they are not fully committed to becoming a barrister. Some applications may therefore be speculative rather than representative of a full intent. The 2014 Bar Barometer suggests just under a third of pupils surveyed had secured pupillage prior to beginning their BPTC.40
54. Prospective barristers have a maximum of five years following the completion of their BVC/BPTC, in which they can start a pupillage.41 A 2006 ERS Market Research survey of BVC students commissioned by the Bar Council found that if they were not successful in applying for a pupillage, 81% of 508 respondents would continue to re-apply for a pupillage in subsequent years.42
55. Several studies have compared the demographics of those applying for pupillage with those successful in obtaining one. Using multivariate analysis for 2011 applications, Sauboorah and Carney (2011)43 found that having an Oxbridge degree, followed by having a first class honours degree were the strongest predictors of success in gaining a pupillage, though correlation analysis also found that successful applicants were more likely to:
Be male,
Be of white ethnicity,
Be younger,
Have attended a fee paying school,
Have parents educated to degree level,
Have parents in professional or managerial jobs,
Have studied an arts or humanities subject at university.
56. These findings are consistent with regression analysis based on data ten years previous. Zimdars (2011) reported similar findings for 2001 to 2004 BVC graduates; type of university attended, attainment at university and BVC attainment level were the key predictors of gaining a pupillage.44 Zimdars found no significant effect by gender, ethnicity, parent’s occupation or type of secondary school attended. However being
40 See < https://www.barstandardsboard.org.uk/media/1584380/barometer_report_112pp_ tuesday_3.pdf> 41 See < https://www.barstandardsboard.org.uk/qualifying-as-a-barrister/pupillage/pupillage-frequently-asked-questions/> 42 ERS Market Research (2006) Bar Council BVC student survey on aspirations for full practice at the Bar – full report.<http://www.barcouncil.org.uk/media/18169/bvcsurveyaspirationsatbar2006.pdf> accessed 2nd April 2014. 43 Sauboorah, J. and Carney, C. (2012) Pupillage Survey 2010/11: An analysis of the backgrounds of pupils registered in 2010/11. Bar Standards Board. Carney, C. (2011) An analysis of the backgrounds of pupil portal applicants in 2011. The General Council of the Bar of England and Wales. <http://www.barcouncil.org.uk/media/62529/ppa2011cc.pdf> accessed 2nd April 2014.
44 Zimdars, A. K. (2011) The Competition for Pupillages at the Bar of England and Wales (2000-2004). Journal of Law and Society, 38(4).
21

Analytical narrative
white, attending a private school and having parents from professional or managerial jobs were strong predictors of the type of university attended (and to a lesser extent, attainment at university); and so could be considered secondary factors.
57. Chambers or organisations offering pupillages are required to pay pupils a minimum of £12,000 for the year. A 2010/11 pupillage survey45 suggested that the median earnings for pupils in criminal and family practice was £18,000 (the median was £19,209), which was less than the earnings for pupils in civil practice (median of 27,500, mean of £28,289).46
58. Factors predicting success in applying for a pupillage are also associated with pupil earnings. Figure 13 is based on the 2009/10 and 2010/11 pupillage survey and shows that Oxbridge graduates and those with first class degrees tend to earn more on average as a pupil.47
Figure 13: Median annual pupil earnings by university attended, area of practice and degree class, based on 2009/10 and 2010/11 Pupillage Survey48
£20,000
£25,500
£18,000
£27,500
£20,000
£29,000
£0 £5,000 £10,000 £15,000 £20,000 £25,000 £30,000 £35,000
Other
First Class
Criminal/ Family
Civil
Others
Oxbridge
De
gre
e C
lass
Are
a o
f pra
ctic
eU
niv
ers
itya
tten
de
d
59. Law Society figures49 show that the number of training contracts registered varies each year, though there was a broadly upward trend from 1993/94 to 2007/08 with an average year on year increase of around 4%. In 2007/08 there were 6,303 training
45 Sauboorah, J. and Carney, C. (2012) Pupillage Survey 2010/11: An analysis of the backgrounds of pupils registered in 2010/11. Bar Standards Board.
46 Earnings are defined as the minimum amount that chambers are required to pay pupils for the year (£12,000) added to any earnings the pupil received in their second six from practicing as a barrister. 47 Sauboorah, J. and Carney, C. (2012) Pupillage Survey 2010/11: An analysis of the backgrounds of pupils registered in 2010/11. Bar Standards Board.
48 Family and Criminal pupillage earnings were grouped together in Sauboorah & Carney’s report. 49 Dixon, D. (2012) Entry to the solicitor’s profession 1980-2011. The Law Society. <
> accessed 2
http://www.lawsociety .org.uk/careers/becoming-a-solicitor/documents/trends-in-entry-to-the-solicitors-profession-1980-2011/
nd April 2014.
22

Independent criminal advocacy in England and Wales
contracts registered but the number of training contracts fell in 2008/09 and 2009/10 to 5,809 and 4,874, which is an annual decrease on the previous year of 8% and 16% respectively. In 2010/11 (the latest year of data) there were 5,441 training contracts registered, similar to the level in 2001/02.
Figure 14: Training Contracts Registered
1993/94 to 2010/11
0
1000
2000
3000
4000
5000
6000
7000
1993
/94
1994
/95
1995
/96
1996
/97
1997
/98
1998
/99
1999
/00
2000
/01
2001
/02
2002
/03
2003
/04
2004
/05
2005
/06
2006
/07
2007
/08
2008
/09
2009
/10
2010
/11
Source: Solicitors Regulation Authority
60. Training contract salaries vary substantially depending on the area of law and whether the firm is based in London or not. The SRA currently stipulates a minimum salary of £18,590 for trainees working in London and £16,650 for trainees working out of London. However, the SRA recently closed a consultation on whether to abolish this minimum salary requirement and replace it with a reference to the minimum wage regulations.
23
Analytical narrative
Section 3: Demand for criminal advocacy
Overview
61. Demand for criminal advocacy services is influenced by trends in crime, particularly the serious crime that is most likely to lead to advocacy work in the Crown Court. Though crime as a whole has been falling for at least a decade, the same cannot be said for receipts50 to the Crown Court.
62. Since the re-introduction of Crown Court Means Testing in 2010, there has been a trend away from legally aided representation in the Crown Court and legal aid applications made in the magistrates’ court for the Crown Court are now at their lowest level for at least 20 years.
Crime has a whole has been falling for at least a decade
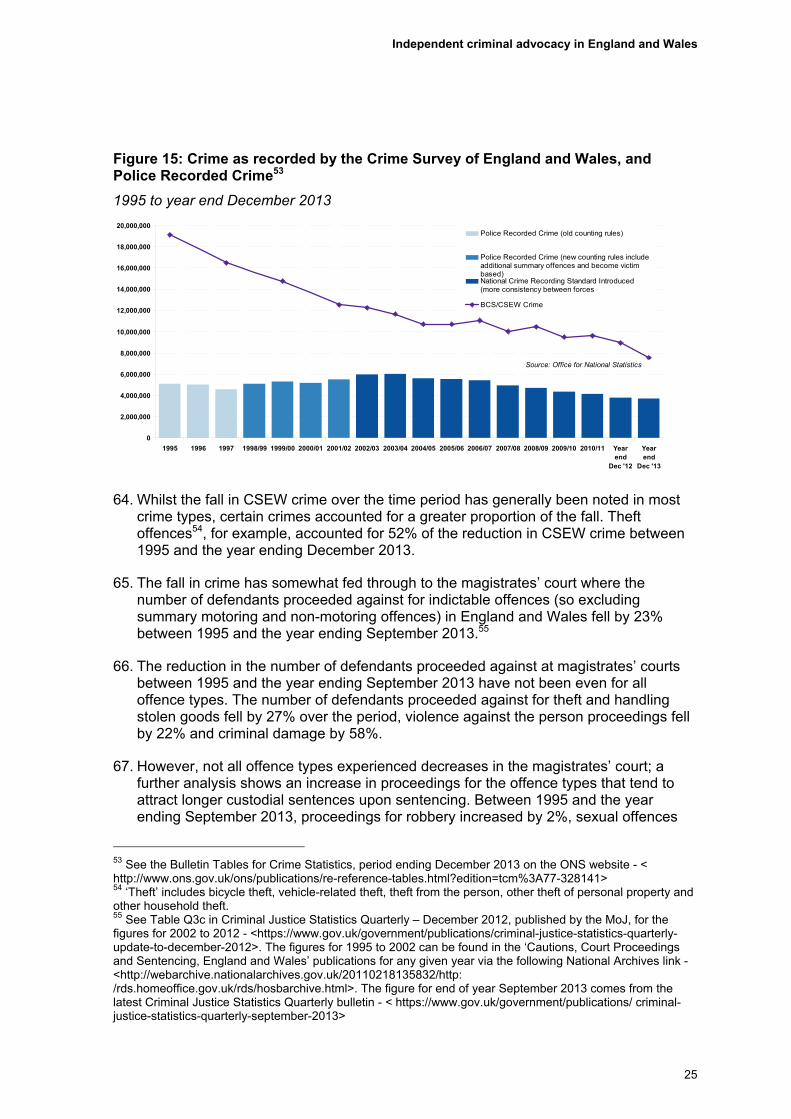
63. Crime trends can be assessed using a variety of measures - the Crime Survey for England and Wales (CSEW)51 for example indicates that crime has fallen by over half (60%) between 1995 and the year ending December 2013, from 19 million crimes to 7.5 million. Police recorded crime52 peaked in 2003/04 at just over 6 million recorded crimes, and has since fallen to 3.7 million crimes in the year ending December 2013 – a reduction of 38%.
50 A receipt is a case that enters the Crown Court. Receipts include committals direct from the magistrates’ court, bench warrants executed (trial and sentence only) and cases transferred in less cases transferred out. 51 The CSEW asks households if they experienced any crimes in the past year. It is considered a more reliable reflection of the extent of crime than police recorded figures as it can capture crime not reported to, or recorded by, the police. The Office for National Statistics is responsible for the CSEW. 52 In England and Wales, recorded crime data are collected from police forces for each crime within the notifiable offence list. It provides a good measure of trends in well-reported crimes (such as homicide). Recently, police recorded crime data was found by the UK Statistics Authority not to meet the required standard for designation as National Statistics.
24
Independent criminal advocacy in England and Wales
Figure 15: Crime as recorded by the Crime Survey of England and Wales, and Police Recorded Crime53
1995 to year end December 2013
0
2,000,000
4,000,000
6,000,000
8,000,000
10,000,000
12,000,000
14,000,000
16,000,000
18,000,000
20,000,000
1995 1996 1997 1998/99 1999/00 2000/01 2001/02 2002/03 2003/04 2004/05 2005/06 2006/07 2007/08 2008/09 2009/10 2010/11 Yearend
Dec '12
Yearend
Dec '13
Source: Office for National Statistics
Police Recorded Crime (old counting rules)
Police Recorded Crime (new counting rules includeadditional summary offences and become victimbased) National Crime Recording Standard Introduced(more consistency between forces
BCS/CSEW Crime
64. Whilst the fall in CSEW crime over the time period has generally been noted in most crime types, certain crimes accounted for a greater proportion of the fall. Theft offences54, for example, accounted for 52% of the reduction in CSEW crime between 1995 and the year ending December 2013.
65. The fall in crime has somewhat fed through to the magistrates’ court where the number of defendants proceeded against for indictable offences (so excluding summary motoring and non-motoring offences) in England and Wales fell by 23% between 1995 and the year ending September 2013.55
66. The reduction in the number of defendants proceeded against at magistrates’ courts between 1995 and the year ending September 2013 have not been even for all offence types. The number of defendants proceeded against for theft and handling stolen goods fell by 27% over the period, violence against the person proceedings fell by 22% and criminal damage by 58%.
67. However, not all offence types experienced decreases in the magistrates’ court; a further analysis shows an increase in proceedings for the offence types that tend to attract longer custodial sentences upon sentencing. Between 1995 and the year ending September 2013, proceedings for robbery increased by 2%, sexual offences
53 See the Bulletin Tables for Crime Statistics, period ending December 2013 on the ONS website - < http://www.ons.gov.uk/ons/publications/re-reference-tables.html?edition=tcm%3A77-328141> 54 ‘Theft’ includes bicycle theft, vehicle-related theft, theft from the person, other theft of personal property and other household theft. 55 See Table Q3c in Criminal Justice Statistics Quarterly – December 2012, published by the MoJ, for the figures for 2002 to 2012 - <https://www.gov.uk/government/publications/criminal-justice-statistics-quarterly-update-to-december-2012>. The figures for 1995 to 2002 can be found in the ‘Cautions, Court Proceedings and Sentencing, England and Wales’ publications for any given year via the following National Archives link - <http://webarchive.nationalarchives.gov.uk/20110218135832/http: /rds.homeoffice.gov.uk/rds/hosbarchive.html>. The figure for end of year September 2013 comes from the latest Criminal Justice Statistics Quarterly bulletin - < https://www.gov.uk/government/publications/ criminal-justice-statistics-quarterly-september-2013>
25

Analytical narrative
increased by 36% and drug offences by 66%. This suggests a shift in the courts towards the more serious and complex offences more likely to require a criminal advocate. Magistrates’ court proceedings as a whole have fallen, however, because the offence types that have seen falls are more prevalent than those that have seen rises.
Figure 16: Defendants proceeded against at magistrates' courts for indictable offences
1995 to year end September 2013
0
100,000
200,000
300,000
400,000
500,000
600,000
1995 1996 1997 1998 1999 2000 2001 2002 2003 2004 2005 2006 2007 2008 2009 2010 2011 2012 YearendSep2013
Source: Ministry of Justice / Home Office
In contrast, serious offence proceedings in the Crown Court have not seen long term falls
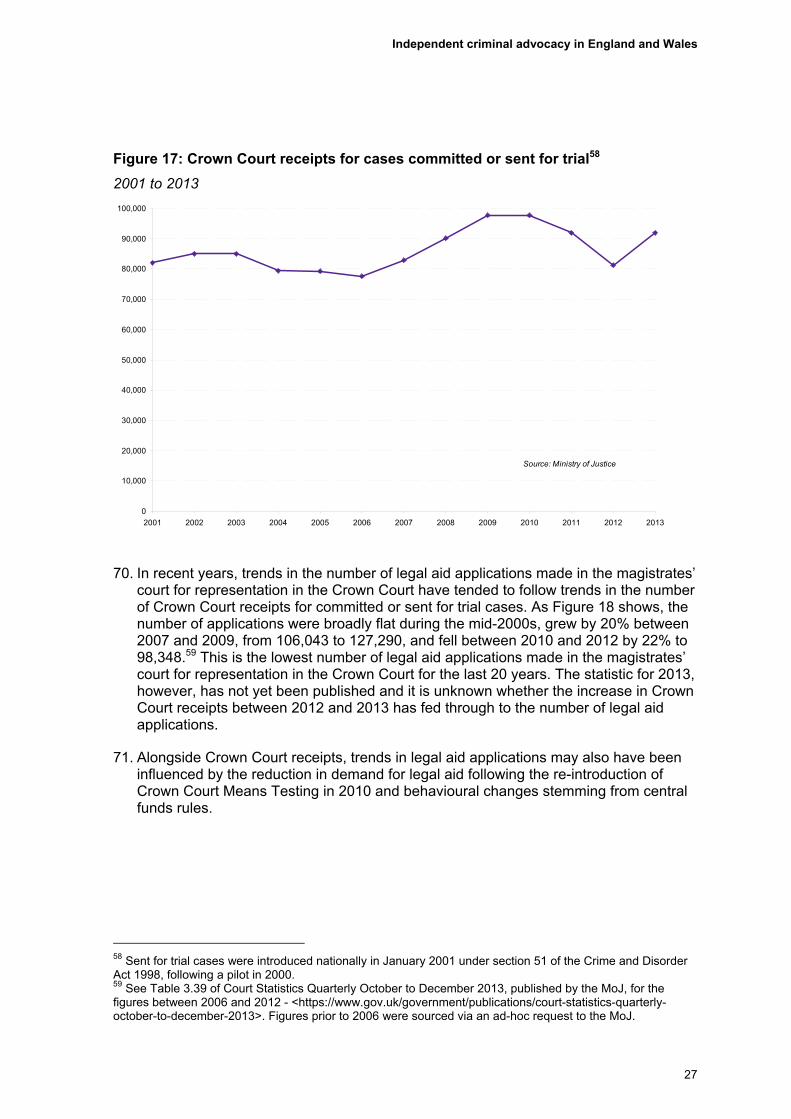
68. Crown Court receipts can be considered an important measure of demand for criminal advocacy – in particular Crown Court receipts for cases either committed for trial or sent for trial.56 57 As Figure 17 shows, trends in Crown Court receipts for these types of case over time have not declined over the long term like crime as a whole.
69. Between 2006 and 2009 receipts for committed or sent for trial cases rose by 26% from 77,557 to a peak of 97,707 in 2009. Between 2009 and 2012 these receipts fell by 17% to 81,168 (just below 2007 levels) before rising again between 2012 and 2013 by 13% to 91,953. This recent rise has been driven by an increase in triable either way receipts in 2013, which may be an effect of the abolition of committal hearings for triable-either-way cases in the magistrates’ court; Crown Court receipts in 2013 were higher than in any year between 2001 and 2008.
56 A case is sent for trial to the Crown Court by the magistrates’ court if it is an ‘indictable only’ offence (which means it can only be heard in the Crown Court). A case counts as committed for trial if the offence can be heard at either the magistrates’ or the Crown Court and if the defendant chooses trial by jury. 57 The following Crown Court receipt figures are taken from Table 3.2 of Court Statistics Quarterly October to December 2013, published by the MoJ - <https://www.gov.uk/government/publications/court-statistics-quarterly-october-to-december-2013>
26
Independent criminal advocacy in England and Wales
Figure 17: Crown Court receipts for cases committed or sent for trial58
2001 to 2013
0
10,000
20,000
30,000
40,000
50,000
60,000
70,000
80,000
90,000
100,000
2001 2002 2003 2004 2005 2006 2007 2008 2009 2010 2011 2012 2013
Source: Ministry of Justice
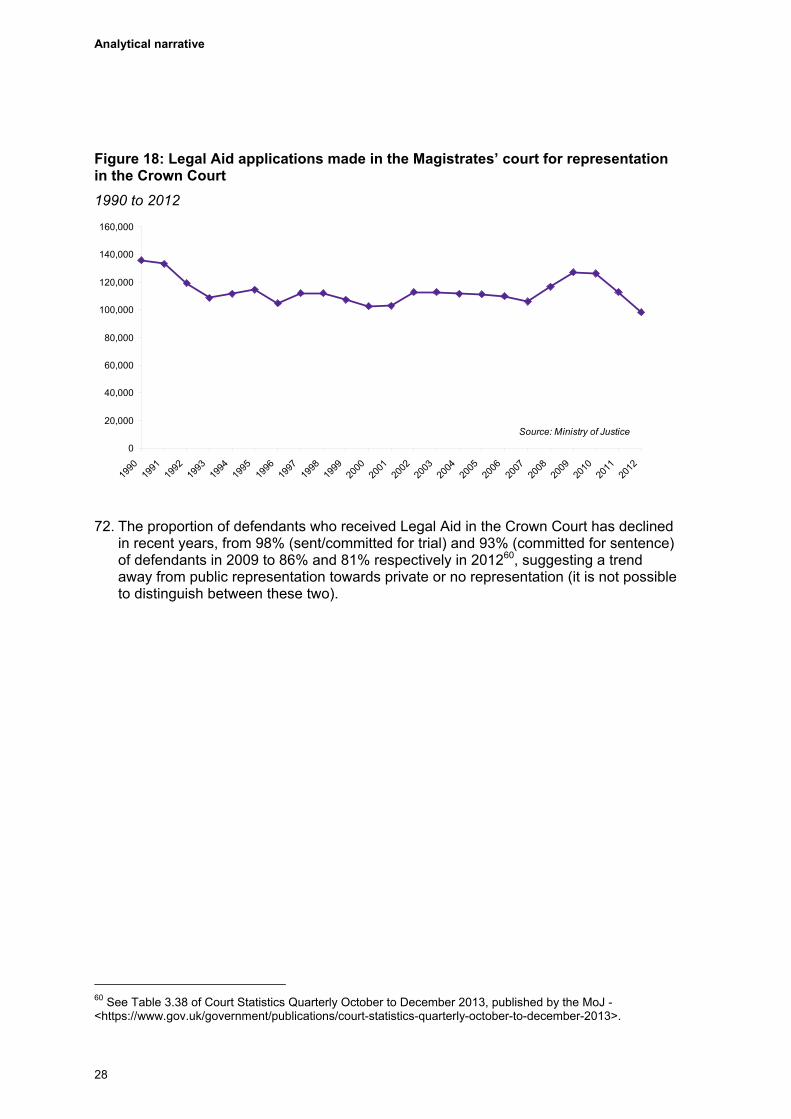
70. In recent years, trends in the number of legal aid applications made in the magistrates’
court for representation in the Crown Court have tended to follow trends in the number of Crown Court receipts for committed or sent for trial cases. As Figure 18 shows, the number of applications were broadly flat during the mid-2000s, grew by 20% between 2007 and 2009, from 106,043 to 127,290, and fell between 2010 and 2012 by 22% to 98,348.59 This is the lowest number of legal aid applications made in the magistrates’ court for representation in the Crown Court for the last 20 years. The statistic for 2013, however, has not yet been published and it is unknown whether the increase in Crown Court receipts between 2012 and 2013 has fed through to the number of legal aid applications.
71. Alongside Crown Court receipts, trends in legal aid applications may also have been influenced by the reduction in demand for legal aid following the re-introduction of Crown Court Means Testing in 2010 and behavioural changes stemming from central funds rules.
58 Sent for trial cases were introduced nationally in January 2001 under section 51 of the Crime and Disorder Act 1998, following a pilot in 2000. 59 See Table 3.39 of Court Statistics Quarterly October to December 2013, published by the MoJ, for the figures between 2006 and 2012 - <https://www.gov.uk/government/publications/court-statistics-quarterly-october-to-december-2013>. Figures prior to 2006 were sourced via an ad-hoc request to the MoJ.
27
Analytical narrative
Figure 18: Legal Aid applications made in the Magistrates’ court for representation in the Crown Court
1990 to 2012
0
20,000
40,000
60,000
80,000
100,000
120,000
140,000
160,000
1990
1991
1992
1993
1994
1995
1996
1997
1998
1999
2000
2001
2002
2003
2004
2005
2006
2007
2008
2009
2010
2011
2012
Source: Ministry of Justice
72. The proportion of defendants who received Legal Aid in the Crown Court has declined
in recent years, from 98% (sent/committed for trial) and 93% (committed for sentence) of defendants in 2009 to 86% and 81% respectively in 201260, suggesting a trend away from public representation towards private or no representation (it is not possible to distinguish between these two).
60 See Table 3.38 of Court Statistics Quarterly October to December 2013, published by the MoJ - <https://www.gov.uk/government/publications/court-statistics-quarterly-october-to-december-2013>.
28

Independent criminal advocacy in England and Wales
References
Bar Standards Board (2008) Bar Standards Board review of the Bar Vocational Course: Report of the Working Group. <https://www.barstandardsboard.org.uk/media/1353435/bvc_report_final_with _annexes_ as_on_website.pdf>
Carney, C. (2011) An analysis of the backgrounds of pupil portal applicants in 2011. The General Council of the Bar of England and Wales. <http://www.barcouncil.org.uk/media/62529/ppa2011cc.pdf> accessed 2nd April 2014.
Dixon, D. (2012) Entry to the solicitor’s profession 1980-2011. The Law Society. <http://www.lawsociety .org.uk/careers/becoming-a-solicitor/documents/trends-in-entry-to-the-solicitors-profession-1980-2011/> accessed 2nd April 2014.
Electoral Reform Research (2011) General Council of the Bar Exit Survey 2011. General Council of the Bar. <http://www.barcouncil.org.uk/media/18145/15_12_general_council_of_the_bar_leavers _report.pdf> accessed 2nd April 2014.
ERS Market Research (2006) Bar Council BVC student survey on aspirations for full practice at the Bar – full report. <http://www.barcouncil.org.uk/media/18169/bvcsurveyaspirationsatbar2006.pdf> accessed 2nd April 2014.
Legal Aid Agency (2013). Statistics Release Legal Aid Statistics. <
>https://www.gov.uk/government/uploads/system/uploads/attachment_data/file/238115/legal-aid-
statistics-090913.pdf accessed 2nd April 2014.
Legal education and training review: The future of legal services education and training regulation in England and Wales. <http://letr.org.uk/wp-content/uploads/LETR-Report.pdf> accessed 2nd April 2014.
Ministry of Justice (2013) Criminal Justice System Statistics Quarterly update to December 2012, England and Wales. <https://www.gov.uk/government/publications/criminal-justice-statistics-quarterly-update-to-december-2012> accessed 2nd April 2014.
Ministry of Justice (2013). Court Statistics Quarterly October to December 2013, England and Wales. <https://www.gov.uk/government/publications/court-statistics-quarterly-october-to-december-2013> accessed 2nd April 2014.
Ministry of Justice (2014) Criminal Justice System Statistics Quarterly update to June 2013, England and Wales. <https://www.gov.uk/government/uploads/system/uploads/attachment_data/file/260303/ criminal-justice-stats-june-2013.pdf> accessed 2nd April 2014.
Ministry of Justice (2014) Transforming Legal Aid – Next Steps: Government Response. <https://consult.justice.gov.uk/digital-communications/transforming-legal-aid-next-steps/consult_view> accessed 2nd April 2014.
29
Analytical narrative
30
Office for National Statistics (2014) Crime Statistics, period ending December 2013. < http://www.ons.gov.uk/ons/publications/re-reference-tables.html?edition= tcm%3A77-328141> accessed 24th April 2014.
Pike, G., and Robinson, D. (2012) Barristers’ Working Lives: A biennial survey of the Bar 2011. General Council of the Bar, Bar Standards Board. < http://www.barcouncil.org.uk/media/18145/ 15_12_general_council_of_the_bar_leavers_report.pdf> accessed 2nd April 2014.
Sauboorah, J. and Carney, C. (2012) Pupillage Survey 2010/11: An analysis of the backgrounds of pupils registered in 2010/11. Bar Standards Board.
The General Council of the Bar of England and Wales (2014) Bar Barometer: Trends in the profile of the Bar. Bar Council, Bar Standards Board. <https://www.barstandardsboard.org.uk/media/1584380/barometer_report_112pp_tuesday_3.pdf> accessed 2nd April 2014.
Zimdars, A. K. (2011) The Competition for Pupillages at the Bar of England and Wales (2000-2004). Journal of Law and Society, 38(4).


© Crown copyright 2014 Produced by the Ministry of Justice
You may re-use this information (excluding logos) free of charge in any format or medium, under the terms of the Open Government Licence. To view this licence, visit http://www.nationalarchives.gov.uk/doc/open-government-licence/ or email: [email protected]
Where we have identified any third party copyright material you will need to obtain permission from the copyright holders concerned.
Alternative format versions of this report are available on request from [email protected]


