1 India | Country reports | Trends in global energy efficiency 2011 India Energy efficiency report Objectives: – 5% of savings in energy consumption by 2015 Overview 2009 2000-2009 (% / year) Primary intensity (EU=100) 1 164 -- -2.9% ++ CO2 intensity (EU=100) 181 -- -1.2% -- CO2 emissions per capita (in tCO 2 / cap) 1.4 ++ 4.5% -- Power generation 2009 2000-2009 (% / year) Efficiency of thermal power plants (in %) 27 -- 0.2% - Rate of electricity T&D losses (in %) 23 -- -2.8% + CO2 emissions per kWh generated (in gCO 2 / kWh) 963 -- 0.5% -- Industry 2009* 2000-2009* (% / year) Energy intensity (EU=100) 192 -- -3.3% ++ Unit consumption of steel (in toe / t) 0.39 - -5.1% ++ *2008 and 2000-2008 for steel ++ Among best countries + Better than the EU average 1 - Below the EU average 1 -- Among countries with lowest performances 1 The European Union, as the best-performing region, is used as the benchmark. Latest update: January 2011
Transcript
1 India | Country reports | Trends in global energy efficiency 2011
CO2 emissions per capita (in tCO2 / cap) 1.4 ++ 4.5% --Power generation 2009 2000-2009 (% / year)Efficiency of thermal power plants (in %) 27 -- 0.2% -Rate of electricity T&D losses (in %) 23 -- -2.8% +CO2 emissions per kWh generated (in gCO2 / kWh) 963 -- 0.5% --Industry 2009* 2000-2009* (% / year)Energy intensity (EU=100) 192 -- -3.3% ++Unit consumption of steel (in toe / t) 0.39 - -5.1% ++*2008 and 2000-2008 for steel
++ Among best countries + Better than the EU average1 - Below the EU average1 -- Among countries with lowest performances
1 The European Union, as the best-performing region, is used as the benchmark.
Latest update: January 2011
Trends in global energy efficiency 2011 | Country reports | India 2
1. Overview1.1. Policies: 5% reduction in energy consumption by 2015In 2001 Parliament adopted a law on energy efficiency, known as the Energy Conservation Act. This law came into force in March 2002. It required large energy consumers to implement specific actions and introduced energy consumption labels and performance standards for electrical appliances. The Bureau of Energy Efficiency was created to implement those provisions.
Within the National Action Plan on Climate Change (NAPCC) adopted in 2008, a National Mission for EnhancedEnergy Efficiency was launched with several targets for 2014-2015: annual fuel savings of at least 23 Mtoe, a cumulative avoided electricity capacity addition of 19,000 MW and a CO2 emission mitigation of 98 Mt.
1.2. Energy consumption trends: surge driven by electricity demandTotal energy consumption per capita remains very low. In 2009, it reached 0.6 toe, compared with 1.8 toe on average for the world and around 1 toe for non-OECD countries.
Primary energy consumption has been increasing rapidly since 1990 (4 percent / year), with a growth rate of over 5 per-cent / year since 2005. The global economic downturn in 2009 did not affect this rapid pace. Final energy consumption has grown at a rate of 3.5 percent / year since the year 2000.
Coal is the country’s top energy source with 42 percent of primary energy consumption in 2009, followed by biomass (26 percent). Oil products covered 23 percent of the country’s needs, gas accounted for 7 percent, and nuclear and hydro electricity reached 2 percent in 2009.
Source: Enerdata
60
160
260
360
460
560
660
760
1990 1995 2000 2005 2009
Mto
e
Primary consumption
Final consumption
Figure 1: Total and final energy consumption trends
The households, services and agriculture sector represents nearly 50 percent of final consumption. Industry consumes 40 percent of final consumption while transport accounts for 10 percent. Excluding biomass, transport accounts for 17 percent and industry for 50 percent.
Source: Enerdata
0%
10%
20%
30%
40%
50%
60%
70%
80%
90%
100%
1990 2000 2005 2009
Households - Services -Agriculture
Transport
Industry (including non energy uses)
Figure 2: Distribution of final energy consumption by sector
Electricity consumption per capita is very low: 560 kWh in 2009, compared with an average of about 1,400 kWh in non-OECD countries. The share of electricity in final energy con-sumption is developing over time and reached 12 percent in 2009 (7 percent in 1990). Electricity consumption has increased by more than 6 percent / year since 2000, ie, more rapidly than total energy consumption. Industry accounts for 45 percent of total electricity consumption. Compared with other countries the share of agriculture in electricity consump-tion is high (20 percent), which is explained by the heavily subsidized rates, while the share of households is 22 percent. The household electrification rate is 61 percent and 84 percent of villages are electrified (2009).
3 India | Country reports | Trends in global energy efficiency 2011
IndiaEnergy efficiency report
Source: Enerdata
0
100
200
300
400
500
600
700
Industry Others
1990 1995 2000 2005 2009
TWh
Figure 3: Electricity consumption trends by sector
1.3. Energy efficiency and CO2 trends: large reduction in very high energy intensityTotal energy consumption per unit of GDP (primary energy intensity), measured at purchasing power parity, is close to the world average but remains lower than the average in non-OECD countries.
Total energy intensity has decreased by 2.2 percent / year since 1990. Between 1990 and 2009, final energy consumption per unit of GDP (final intensity) decreased more rapidly than pri-mary energy intensity. The soaring electricity demand leads to a rise in conversion losses since most power generation is from coal, which in turn results in a slower reduction in primary energy intensity.
CO2 emissions per unit of GDP (CO2 intensity) decreased by 0.5 percent / year between 1990 and 2009, which is much slower than energy intensity. This is mainly explained by the decreasing share of carbon-free energy sources in the fuel mix (mainly biomass and hydro). The NAPCC (2008) aims to reduce carbon intensity by 20-25 percent by 2020 (compared with 2005 levels).
Source: Enerdata
-4.0%
-3.5%
-3.0%
-2.5%
-2.0%
-1.5%
-1.0%
-0.5%
0.0%1990-2009 2000-2009
%/y
ear
Primary energy intensity
Final energy intensity
CO2 intensity
Figure 4: Energy and CO2 intensity trends
2. Power generation2.1. Policies: ambitious targets for renewablesElectricity production falls chronically short of the country’s electricity needs (with a peak capacity deficit of almost 20 percent). The capacity expansion is systematically below the needs, and the objectives fixed in the Plans are rarely met.
The government’s target under the 11th Plan (2007-2012) is to install a renewable power capacity of 14,500 MW, of which 10,500 MW would be from wind. The Government will grant Rs3,600bn (US$79bn) in subsidies for wind power projects (Rs0.49 / kWh (US$0.49 / kWh) for a minimum of four years and a maximum of 10 years) to be connected to the national grid. The subsidies will be applicable to projects of up to 4 GW and are earmarked for developers until 2012. India has announced its goal of having a solar energy capacity of 20 GW by 2022, as forecasted in the 13th Five-Year Plan (2018-2022).
2.2. Power generation trends by source: growing market share for coalPower generation is increasingly based on fossil fuels, which in 2009 accounted for around 85 percent of the country’s elec-tricity generation, compared with 75 percent in 1990. Coal is the main fuel for electricity production, accounting for 70 percent in 2009 compared with 66 percent in 1990. Natural gas is developing rapidly: in 2009, it accounted for 12 percent of the power generation compared with 3 percent in 1990. The share of hydroelectricity fell significantly, from 25 percent in 1990 to 12 percent in 2009. Among CO2-free energy sources, wind energy has started to develop significantly in recent years, but in 2009 it still accounted for less than 2 percent of the total. Nuclear represents around 2 percent of total electricity genera-tion. Altogether, the share of carbon-free power generation decreased from 27 percent in 1990 to 16 percent in 2009.
Trends in global energy efficiency 2011 | Country reports | India 4
Source: Enerdata
0
100
200
300
400
500
600
700
800
900
1000
1990 2000 2009
TWh
Other*
Wind
Hydro
Nuclear
Gas
Oil
Coal-Lignite
*Including biomass, geothermal and solar
Figure 5: Power generation by source
2.3. Efficiency of the power sector: deterioration in energy efficiencyThe efficiency of the power sector is decreasing and in 2009 stood at 30 percent, compared with 36 percent in 1990. The reduction of the share of hydroelectricity, the development of nuclear power and the aging of coal power plants explains the deterioration of this ratio. The rise in gas-fired capacities, which are more efficient than coal, leads to a smaller drop in the efficiency of thermal power plants. In 2009 thermal power plants had an efficiency rate of 27 percent, compared with 30 percent in 1990. The use of more efficient technologies, such as gas combined cycles and cogeneration, also limited the fall in the ratio for thermal power generation. In 2009, combined cycles accounted for around 15 percent of thermal capacities and almost the entire gas-fired power production.
Source: Enerdata
25
27
29
31
33
35
37
%
1990 1995 2000 2005 2009
Total power generation
Thermal power plants
Figure 6: Efficiency of power generation and thermal power plants
Source: Enerdata
0
20
40
60
80
100
120
140
160
Steam Combined cycles
GW
1990 1995 2000 2005 2009
Figure 7: Thermal electricity capacity, by technology
Transmission and distribution losses are very high but have been decreasing since 2000 (from 30 percent to about 25 percent in 2009). Around 5 percent of these losses are non-technical losses (unpaid electricity). The losses exceed 40 percent in eight states, range between 30 percent and 40 percent in seven other states and between 20 percent and 30 percent in a further eight states. India is far above the average for non-OECD countries, which stands at 11 percent.
Source: Enerdata
0
5
10
15
20
25
30
35
%
1990 1995 2000 2005 2009
Figure 8: Electric T&D losses
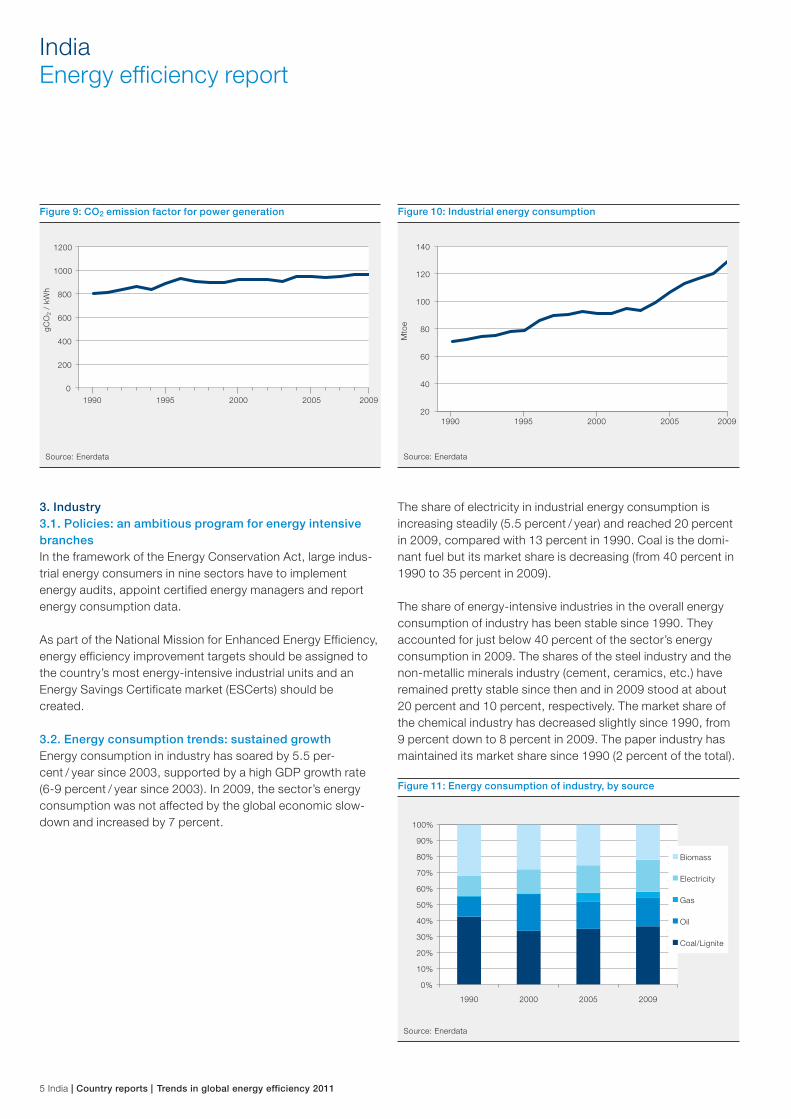
As a result of the fast-growing share of fossil fuel in power generation, the average CO2 emission factor has increased by about 20 percent since 1990, reaching 960 gCO2 / kWh in 2009. However, the growth in CO2 emissions per kWh gener-ated has slowed down since 2000, at 0.5 percent / year com-pared with 1 percent / year between 1990 and 1999.
5 India | Country reports | Trends in global energy efficiency 2011
IndiaEnergy efficiency report
Source: Enerdata
0
200
400
600
800
1000
1200
gCO
2 /
kWh
1990 1995 2000 2005 2009
Figure 9: CO2 emission factor for power generation
3. Industry3.1. Policies: an ambitious program for energy intensive branchesIn the framework of the Energy Conservation Act, large indus-trial energy consumers in nine sectors have to implement energy audits, appoint certified energy managers and report energy consumption data.
As part of the National Mission for Enhanced Energy Efficiency, energy efficiency improvement targets should be assigned to the country’s most energy-intensive industrial units and an Energy Savings Certificate market (ESCerts) should be created.
3.2. Energy consumption trends: sustained growthEnergy consumption in industry has soared by 5.5 per-cent / year since 2003, supported by a high GDP growth rate (6-9 percent / year since 2003). In 2009, the sector’s energy consumption was not affected by the global economic slow-down and increased by 7 percent.
Source: Enerdata
20
40
60
80
100
120
140
Mto
e
1990 1995 2000 2005 2009
Figure 10: Industrial energy consumption
The share of electricity in industrial energy consumption is increasing steadily (5.5 percent / year) and reached 20 percent in 2009, compared with 13 percent in 1990. Coal is the domi-nant fuel but its market share is decreasing (from 40 percent in 1990 to 35 percent in 2009).
The share of energy-intensive industries in the overall energy consumption of industry has been stable since 1990. They accounted for just below 40 percent of the sector’s energy consumption in 2009. The shares of the steel industry and the non-metallic minerals industry (cement, ceramics, etc.) have remained pretty stable since then and in 2009 stood at about 20 percent and 10 percent, respectively. The market share of the chemical industry has decreased slightly since 1990, from 9 percent down to 8 percent in 2009. The paper industry has maintained its market share since 1990 (2 percent of the total).
Source: Enerdata
0%
10%
20%
30%
40%
50%
60%
70%
80%
90%
100%
1990 2000 2005 2009
Biomass
Electricity
Gas
Oil
Coal/Lignite
Figure 11: Energy consumption of industry, by source
Trends in global energy efficiency 2011 | Country reports | India 6
Source: Enerdata
0%
10%
20%
30%
40%
50%
60%
70%
80%
90%
100%
Other
Paper
Non metallic minerals
Chemical
Steel
1990 2000 2005 2008
*Estimated electricity consumption by branch
Figure 12: Energy consumption of industry, by branch
3.3. Energy intensity trends: large improvements achieved in industryBetween 1990 and 2009, energy intensity in industry fell by more than 3 percent / year. Since 2000, it has decreased at the even faster pace of 3.8 percent / year.
Source: Enerdata
-3.9%
-3.8%
-3.7%
-3.6%
-3.5%
-3.4%
-3.3%
-3.2%
-3.1%
-3.0%
-2.9%
1990-2008 2000-2008
%/y
ear
*Including construction and mining
Total*
Figure 13: Trends in the energy intensity of industrial branches
Copyright notices
“Trends in global energy efficiency 2011” is based on data and information pro-vided by Enerdata and the Economist Intelligence Unit. The data and informa-tion is published with the consent of Enerdata and the Economist Intelligence Unit.
All information or data provided by Enerdata, in any form, is the property of En-erdata and is protected in each country by national laws governing intellectual property. All information or data provided by Enerdata is copyright protected, inclusive of material appearing in a hard copy format or electronically. Data pro-vided by Enerdata are based on compilation and analysis of the best sources in the industry. Enerdata has agreements with those providers to use and publish this data.