Page 1
Page 1 of 38
THIS REPORT CONTAINS ASSESSMENTS OF COMMODITY AND TRADE ISSUES MADE BY
USDA STAFF AND NOT NECESSARILY STATEMENTS OF OFFICIAL U.S. GOVERNMENT
POLICY
Date:
GAIN Report Number:
Approved By:
Prepared By:
Report Highlights:
After a record harvest of 98.5 million metric ton (MMT) last year, India’s MY 2018/19 (April/March)
wheat production is forecast lower at 94 MMT on lower planting, still record fourth highest crop.
Despite sufficient domestic supplies, MY 2018/19 wheat imports are forecast at 1.5 MMT to augment
quality wheat requirement. India is set for a record MY 2017/18 (October/September) rice production
of 110 MMT and record corn production of 26 MMT. Assuming normal 2018 monsoon, MY 2018/19
rice production is forecast at 109 MMT from 43.5 million hectares, and corn production at 25.5 MMT
from 9.2 million hectares, India’s record third highest harvest in both cases. India is the largest rice
exporters in the world with MY 2017/18 rice exports estimated at a record 13 MMT; and MY 2018/19
exports forecast slightly lower at 12 MMT on forecast relatively tight domestic supplies. Due to
growing demand from the feed sector, India is likely to emerge as net importer of corn in MY 2018/19
with imports forecast at 0.5 MMT.
Dr. Santosh K. Singh
Mark Wallace
2018
Grain and Feed Annual
India
IN8027
3/16/2018
Required Report - public distribution
Page 2
Page 2 of 38
Commodities:
Table 1. India: Commodity, Wheat, PSD (Area in Thousand Hectares, Quantity in Thousand Metric Tons, Yield in MT/Hectare)
Wheat 2016/2017 2017/2018 2018/2019
Market Begin
Year Apr 2016 Apr 2017 Apr 2018
India USDA
Official
New
Post
USDA
Official
New
Post
USDA
Official
New
Post
Area Harvested 30418 30220 30785 30785 0 29700
Beginning Stocks 14540 14540 9800 9800 0 12500
Production 87000 87000 98510 98510 0 94000
MY Imports 5896 5896 1500 2000 0 1500
TY Imports 6147 6147 1500 1800 0 1500
TY Imp. from
U.S.
0 0 0 0 0 0
Total Supply 107436 107436 109810 110310 0 108000
MY Exports 516 516 500 500 0 400
TY Exports 409 441 400 400 0 400
Feed and Residual 4700 4700 5000 5000 0 5000
FSI Consumption 92420 92420 93000 92310 0 93000
Total
Consumption
97120 97120 98000 97310 0 98000
Ending Stocks 9800 9800 11310 12500 0 9600
Total Distribution 107436 107436 109810 110310 0 108000
Yield 2.8601 2.8789 3.1999 3.1999 0 3.165
Production:
MY 2018/19 Outlook
The Indian wheat harvest in the upcoming summer is likely to be lower than last year’s record
production due to soil moisture and temperature stress during planting and early vegetative growth
stages (October-early December). Weather conditions have improved since December and the standing
crop is progressing well under adequate soil moisture conditions. Assuming normal weather conditions
from now through harvest (April), Post forecasts marketing year (MY) 2018/19 wheat production at 94
million metric tons (MMT) from 29.7 million hectares (MHa), lower than last year’s revised final
production estimate of 98.5 MMT, largely due to lower planting and trend yield. Despite lower
planting, the government’s preliminary estimate (2nd
Advance Estimate of Feb 28, 2018) forecasts 2018
wheat production optimistically at a near-record 97 MMT; they expect a further increase in yield over
Wheat
Page 3
Page 3 of 38
last year’s record yield despite adverse planting conditions. However, most trade sources are currently
estimating the crop in the range of 91 to 94 MMT.
Due to below-normal rains in the second half (August-September) of 2017 monsoon season (See
IN7124), sowing of the 2018 wheat crop commenced in October under relatively dry conditions and
progressed slowly through December compared to normal years. Wheat planting in the western and
central states was particularly affected due to inadequate irrigation facilities compared to the northern
states. The Ministry of Agriculture’s (MoA) crop situation reports show that progress of planting in the
major wheat growing states was delayed by 2-3 weeks, and farmers in central and western states shifted
some of last year’s wheat area to less irrigation-intensive crops like chick peas and other pulses. The
latest crop condition report of February 2018 estimates the MY 2018/19 wheat planting reported by the
state departments of agriculture1 down by more than 4 percent over last year.
Beginning in December growing conditions improved due to lower temperatures, and scattered rains in
January/February helped during the critical vegetative growth, tillering, flowering and panicle initiation
stages of the standing crop. No major incidences of any pest or disease outbreaks have been reported in
the wheat growing states. Market sources report that lower planting in Madhya Pradesh, Maharashtra,
and parts of Uttar Pradesh may affect supplies of ‘quality’ wheat necessary for production of quality
flour for higher value processed wheat products. Agriculture experts report that the overall crop
condition is good but “less than optimal” compared to last year when record planting, timely sowing,
and favorable winter conditions through March resulted in record production and yield. Consequently,
Post forecasts MY 2018/19 production at 94 MMT from 29.7 million hectare and assuming the trend
yield (3.16 MT/hectare), it would be India’s record fourth highest production if realized. Extended cold
temperature conditions during March may delay the harvest, but would improve the yield prospects and
raise the forecast production estimate. However, an early rise in temperature during March/April (grain
filling and maturity stage) and/or heavy rains/hailstorms during harvest could adversely affect the yield
prospects and lower the production from the forecast level.
MY 2017/18 Production:
Based on the Government of India’s (GOI) final estimates released on February 28, 2018, the MY
2017/18 wheat production estimate is revised marginally higher to a record 98.5 MMT and area is
revised to a record 30.8 MHa with the record yield estimated at 3.2 MT/hectare.
Indian wheat can be characterized as soft/medium hard, medium protein, white bread wheat, somewhat
comparable to U.S. hard white wheat. Wheat from the central and western regions grown under
relatively drier conditions has relatively higher protein and gluten in comparison to wheat from northern
India. Wheat yields across major growing states show variations due to ‘assured’ irrigation availability,
soil condition, and adoption of technology. Wheat yields in the largely irrigated northern India (Punjab,
Haryana, and Western Uttar Pradesh) are above 4.5 tons per hectare, while yields in western and central
states (Gujarat, Rajasthan, Madhya Pradesh, Bihar and parts of Uttar Pradesh) are relatively lower
(below 3.0 tons per hectare). The perennial river system from the Himalayas replenishes the surface
(canal) and ground (tube wells) systems in north India; the western and central states largely depend on
the residual water after the monsoon.
1 Typically the planting figures reported by the Department of Agriculture of major wheat growing states is lower than the
final area figures based on the crop area reported by the Department of Revenue.
Page 4
Page 4 of 38
India produced about 1.0-2.0 MMT of durum in Madhya Pradesh, Rajasthan, and Maharashtra, mostly
for food processors. Over the last decade, more farmers have shifted from durum wheat cultivation to
non-durum varieties due to higher profit margins (higher yields and rising government minimum
support price (MSP)). Most durum wheat is purchased by the private sector at a premium over common
non-durum wheat for higher-value bakery and confectionary products. Availability of relatively ‘cheap’
high quality imported wheat (APW) for blending and processing over the last few years has lowered the
price premium for local durum wheat compared to common wheat. Market sources report that India is
likely to produce about 1.0 MT for Durum wheat in MY 2018/19, unchanged from last year level.
Source: MoA, Government of India (GOI); and FAS/New Delhi - MY 2016/17 and 2018/19.
Production of wheat and rice has been the cornerstone of India’s agricultural and food security policies
and programs since the onset of the famous “Green Revolution’ in the mid-1960s. Indian wheat
production has grown steadily in the last decade on back-to-back bumper harvests despite two years of
weather affected decline in production (MY 2015/16 and 2016/17). Wheat acreage has been relatively
stable around 30 million hectares in recent years, and does not show significant year-on-year variation
(less than 5 percent) due to the government’s minimum price support (MSP) policy, an effective
government procurement program in growing states, and relatively stable productivity under irrigated
conditions vis-à-vis other competing crops. Although the wheat crop is largely irrigated (over 90
percent), withdrawal of monsoon and residual soil moisture from the previous kharif (fall planted)
season does influence the progress of planting, while winter temperatures and rains critically influence
crop growth and yield prospects. Wheat yields in northern states have nearly peaked and are
comparable to other high yielding producers in the world. However, yields in other states have been
increasing with the steady expansion in irrigation facilities and adoption of improved production
technologies.
Indian wheat cultivation does face future threats of diversion of acreage to non-agricultural use, soil
degradation, and climate change. Since most wheat area has assured ground/canal irrigation supplies,
Page 5
Page 5 of 38
interest from urban developers and other non-agricultural businesses is leading to increasing diversion
of prime area out of wheat cultivation, especially areas adjacent to urban habitats. In northern India,
over-exploitation of ground water and flood irrigation is causing the problems of soil salinity and
declining water table, which may force farmers to switch to less water intensive crops like oilseeds,
pulses and corn. Vulnerability of the wheat crop to ‘climate change’, particularly the ‘earlier-than-
normal’ onset of summer and consequent rise in temperatures (terminal heat) affecting the crop at grain
filling/maturity stages (March/April), is a major concern among researchers and policy makers. Of the
31 million hectares under wheat cultivation, researchers estimate that about 10-12 million hectares are
prone to terminal heat stress. Indian Council of Agricultural Research (ICAR) and other State
Agricultural Universities (SAU) are developing appropriate response mechanisms through agronomic
management (early planting) and technologies (short duration varieties) to mitigate potential climate
risks. Recent incidences of untimely heavy rains/hailstorms during critical stages (MY 2016/17), which
may be related to global warming/climate change, is also a concern for the policy makers on the future
of wheat cultivation.
Agriculture experts report that the yields of most of the popular Indian wheat varieties are near their
genetic potential, and are showing signs of fatigue due to continuous reuse of seeds by farmers. ICAR,
India’s apex agriculture research agency, and the SAUs are involved in developing location-specific
wheat varieties with traits addressing crop duration, varied soil conditions, rising yield potential, and
improved grain qualities; they are doing this largely through traditional breeding methods. Given that
wheat seed production and marketing is mostly administered by public sector institutions, the new wheat
varieties have been slow to make quick inroads among growers due to inadequate seed multiplication,
distribution, and extension facilities with the seed replacement rate estimated around 25 percent only.
Biotechnology applications in wheat are limited to experimental marker-assisted breeding in order to
develop resistance to biotic and abiotic stresses.
To date, there have not been any known incidences of Ug99, a wheat rust of global concern, in India.
However, reports suggest that about 60-70 percent of India’s wheat acreage is under varieties/cultivars
susceptible to the disease if it hits India from the Pakistan border side. Local agricultural scientists assert
that the agro-climatic conditions in northern India’s wheat belt are not conducive to Ug99, but the
highly mutative nature of the Ug99 strain could make India’s wheat growing areas vulnerable to this
rust. The National Agriculture Research System (NARS), which comprises research institutes under the
Indian Council of Agricultural Research and various State Agriculture Universities, survey and monitor
the wheat crop, and newly developed varieties, for various rusts, including Ug99. In the last few years,
the GOI has focused on encouraging the state governments to replace susceptible varieties with Ug99-
resistant varieties screened by NARS.
Consumption:
Wheat is the staple food in the growing areas (north, west and central India), but competes with rice in
non-growing regions (south and east India). Despite the forecast for tight domestic supplies, India’s
wheat consumption (FSI) in MY 2018/19 is forecast higher at 93 MMT to feed the growing population.
Relatively tight domestic supplies coupled with higher government procurement price (minimum
Page 6
Page 6 of 38
support price) will raise the domestic prices in the upcoming season compared to last year.
Government market intervention programs for supply of subsidized wheat through the public
distribution system (PDS), and likely availability of higher quantities of government wheat stocks for
sale to the open market will help allay price inflation concerns. Assuming no significant changes in the
international market prices and government’s import policy, southern India millers are likely to continue
to augment their quality wheat (mainly for blending) requirements through imports on expected
domestic shortages of quality wheat. Consequently, MY 2018/19 wheat consumption is estimated to
increase marginally to 93 MMT on expected firm prices and relatively inelastic demand in the major
consuming regions. Wheat use for feed and residual in MY 2018/19 is forecast at 5 MMT, unchanged
from last year despite forecast higher prices on expected steady demand from the livestock sectors.
However, any change in the existing import policy (duty level) for wheat may change the imports of
wheat and consumption in southern India.
MY 2017/18 consumption is revised lower to 92.3 MMT on reports of decline in consumption in the
southern states due to relatively higher wheat prices compared to last year. After a record growth of
nearly 10 percent in MY 2016/17, FSI consumption in MY 2017/18 has slowed down due to weakening
of demand in the non-traditional wheat consuming southern states. Industry sources report that MY
2016/17 consumption was largely fueled by high offtake in the coastal southern region where imported
wheat (zero import duty) was more economical than the local wheat from north/central India due to low
international prices and freight costs compared to inland transport cost from the growing regions. The
GOI’s decision to impose 10 percent import duty in March 2017, which was further raised to 20 percent
in November 2017, forced the millers to revert back to sourcing local wheat at higher cost (higher MSP
and inland transport cost due to higher international fuel prices) compared to the foreign wheat they had
used in MY 2016/17. Market sources report that southern-based millers have cut back wheat off take
significantly due to higher raw material cost compared to last year as the consumers in these non-wheat
states are more price responsive than the traditional states. Relatively weak off take of government
wheat stocks, the major supplier of local wheat to non-wheat growing states in normal years, in the
ongoing marketing season reflects weak demand for wheat in these regions. Consequently, MY
2017/18 FSI consumption is estimated lower at 92.3 MMT, marginally lower than last year’s record
consumption.
Wheat as a staple food is consumed at the household level in the form of homemade chapattis or rotis
(unleavened flat bread) using custom milled atta (whole wheat flour). Some wheat is also used for
various wheat-based processed products like raised breads, “biscuits” (cookies) and other bakery items.
Typically, about 55-60 percent of the wheat is marketed, and the balance is used by the farmer for
personal food, feed and seed use. About half of the marketed wheat is procured by the government
under the MSP procurement program for distribution through PDS, supply to various other food
programs, and in smaller quantities for open market sale to private millers to contain domestic prices.
The balance is procured from the farmers directly by the private sector for milling, processing and other
uses.
Most of the marketed wheat is procured whole wheat and distributed through the open market and
public distribution system (PDS) to be either custom milled by the household for home use or milled for
processors and institutional buyers. Most of the wheat retained by farmers (about 40-45 percent) is also
custom-milled, mostly in the chakkies (small flour mills) for home consumption, and small quantities
(20-25 percent) are milled for feed use (mainly for milking/lactating cows and buffaloes). Most of the
Page 7
Page 7 of 38
organized millers produce wheat flour and atta for the hotels, restaurants, and institutional (HRI) sector,
and a small share is distributed for consumers in branded packs. Market sources report that the market
for packaged and branded flour is growing at about 10 percent per annum on growing demand from
urban consumers due to the convenience factor. There is a small but growing market for high quality
wheat (3-4 MMT) for the baking and confectionary food market which has been growing at a healthy
10-12 percent per annum over the last few years.
Most commercial feed caters to poultry and aquaculture farms, which largely uses corn, oilseed meals,
and other coarse grains, including small quantities of spoiled/inferior quality wheat. In the highly
disorganized dairy sector (mostly backyard dairy with 2-3 animals), there is very limited use of wheat
by the organized feed sector. Most of the feed use in the dairy sector is restricted to lactating animals,
and includes some oil cakes, household food waste, and other grain mixes. However, the recent trend of
replacing local low-yielding dairy animals by higher yielding cross-bred cows and ‘murrah’ breed
buffaloes has increased the demand for commercial dairy feed by about 15 percent per annum; this
change drives higher wheat usage in dairy feed sector. Typically, the spoiled and inferior quality wheat
not deemed fit for human consumption, both government-held and open market, is used for animal feed.
Market sources believe that the relatively tight government-held wheat stocks in recent years have
limited the diversion of government-held wheat to animal feed.
The organized milling sector is relatively small at about 1200-1300 medium to large flour mills with
aggregate milling capacity of about 25 MMT. These businesses mill mostly maida (flour) and semolina
to cater to HRI sector demand, and they produce bran flakes for the mixed feed industry. Market
sources report that most mills are operating at 40-60 percent of their capacity and process about 14-15
MMT of wheat per annum.
Procurement and Offtake for Government Programs
Record domestic production and relatively strong government MSP compared to open market prices
boosted MY2017/18 government wheat procurement to an estimated 30.8 MMT, more than 34 percent
higher than the previous year, but lower than the initial target of 33 MMT. The government has set up a
procurement target of 32 MMT for MY 2018/19 on expected ‘sufficient’ upcoming harvest. Given the
significant increase in the MSP and relatively weak domestic prices in the major producing states, wheat
procurement is likely to cross 30 MMT, nearly the same as last year despite relatively tight domestic
supplies compared to last year. Most of the wheat to the government program is likely to come from the
surplus states of Punjab, Haryana, and Uttar Pradesh where the crop is progressing well, and slightly
lower quantities compared to last year are likely to come from the states of Madhya Pradesh and
Rajasthan due to expected lower crop.
Despite the imposition of the new GST regime, most of wheat marketed in Punjab and Haryana is likely
to be procured by the government because they impose additional local taxes/cess compared to other
states, which precludes market purchase by private trade in these states. After coming to power in 2017,
the BJP government in the leading wheat producing state of Uttar Pradesh has focused on expanding the
government MSP procurement operation which will continue for the upcoming harvest season. The
Madhya Pradesh government announcement to pay an additional bonus of INR 2000 per MT over and
above the MSP to their farmers should also support government procurement in the state despite the
lower crop.
Page 8
Page 8 of 38
With imports blunted by 20 percent duty, private domestic trade is likely to compete with the
government procurement program in the states that offer higher open market prices, such as Madhya
Pradesh, Rajasthan, and Uttar Pradesh. Consequently, MY 2018/19 government procurement is forecast
lower at 30 MMT compared to the government target.
Source: Food Corporation of India, GOI, and FAS/New Delhi forecast for MY 2018/19
Table 2. India: Government Wheat Procurement and PDS Operation
Marketing
Year
Production GOI
Procurement1
MSP GOI Total
Cost
Offtake from GOI
Stocks
PDS Issue Price
(Apr–Mar) (Million
Tons)
(Million Tons)
INR per
ton
INR Per ton
(Million Tons) INR per ton
APL BPL AAY/NFSA
2009/10 80.68 25.38 (31.5) 10,800 14,246 22.38 6,100 4,150 2,000
2010/11 80.80 22.51 (27.8) 11,000 14,944 23.07 6,100 4,150 2,000
2011/12 86.87 28.34 (32.6) 11,700 15,953 24.27 6,100 4,150 2,000
Page 9
Page 9 of 38
2012/13 94.88 37.92(40.0) 12,850 17,526 33.24 6,100 4,150 2,000
2013/14 93.51 25.09(26.8) 13,500 19,083 30.61 6,100 4,150 2,000
2014/15 95.85 28.02(29.2) 14,000 20,512 27.16 6,100 4,150 2,000
2015/16 86.53 28.09(32.5) 14,500 21,274 31.57 6,100 4,150 2,000
2016/17 87.00 22.96(26.4) 15,250 21,970 29.25 6,100 4,150 2,000
2017/18 98.38 30.83(31.3) 16,250 23,963 25.20 6,100 4,150 2,000
2018/192 94.00 30.00(32.1) 17,350 24,456
3 na 6,100 4,150 2,000
Sources: Ministry of Agriculture, Food Corporation of India.
Notes: Exchange rate INR 64.8 = US$ 1 on March 9, 2018 1 Figure in parentheses is GOI procurement as percentage of total production
2 FAS/New Delhi estimate
3 Economic Cost includes cost of procurement (MSP), handling, storage, transport, interest, etc.
PDS - Public Distribution System
APL - Above Poverty Line
BPL - Below Poverty Line
AAY -Antyodaya Anna Yojana (Poorest of the Poor)
NFSA-National Food Security Act
Over the last decade, the cost of wheat under the MSP program has nearly doubled due to the continued
increase in MSP and high overheads of the government procurement, storage and management system.
On the other hand, the government has kept the wheat sales price under various food security programs
unchanged since 2002. The National Food Security Act (NFSA) 2013 creates an entitlement for
eligible beneficiaries (50% and 75% of the urban and rural populations accounting for about 2/3rd of the
population) to receive 5 kilograms of rice, wheat, or coarse grain (millet) at subsidized prices of INR 3,
2 and 1 per kilogram, respectively. With most states gradually expanding the effective implementing of
the NFSA, increasing quantities of wheat are now being distributed through the public distribution
system (PDS) at the ‘lowest’ price slab of INR 2000/MT. The government distributes about 24-25MMT
of wheat under the NFSA and other food security programs annually, and also sells wheat under the
OMSS to the private trade to contain domestic prices. Recent official data suggests very low offtake of
wheat under the OMSS in MY 2017/18, estimated to barely touch sales of 1 MMT compared to an
estimated 4.7 MMT in MY 2016/17. Market sources attribute low open market sale of government
wheat due to sufficient open market supplies at prices below the government offer prices (MSP plus
inland transport cost).
Prices:
Riding on a record harvest, domestic wheat prices declined significantly from the beginning of MY
2017/18 and remained steady through the marketing season (April-August). Subsequently, domestic
prices have followed the normal post-harvest price cycle but are running at much lower levels compared
to last year.
Page 10
Page 10 of 38
Source: Agmarket News, Ministry of Agriculture, GOI.
Domestic prices have ruled steady since November despite the increase in import duty from 10 percent
to 20 percent. Spot prices in February 2018 ranged between INR 15,950 ($246) to INR 16,400 ($253)
per MT in major producing states, lower than the MSP of INR 17,350 (4268) per MT for the upcoming
MY 2018/19 season. Despite forecasts for a sufficient domestic harvest, the GOI’s MSP is likely to
push new crop prices upward for the upcoming marketing year (April-July) as the private trade seeks to
cover their consumption requirements. Prices after the procurement season (April-July) will also be
influenced by the international price movement and government policies (import duties and domestic
wheat offtake under OMSS).
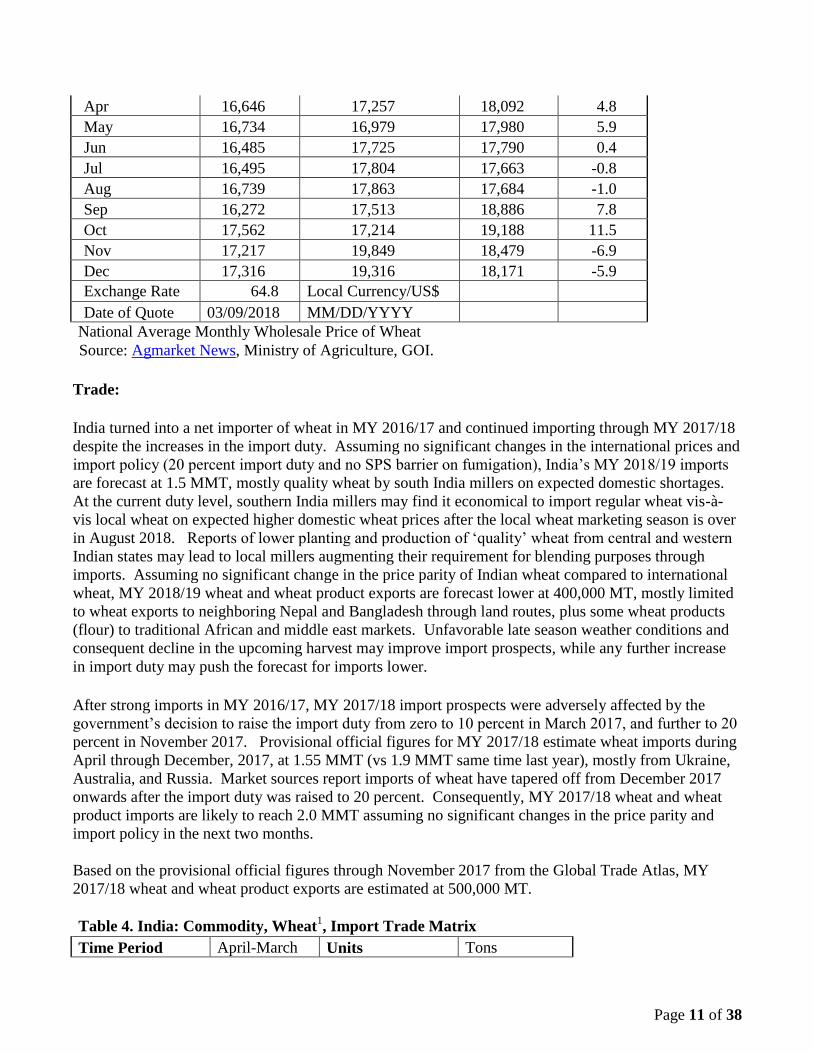
Table 3. India: Commodity, Wheat, Prices Table
Prices In Rupees per uom metric tons
Year 2015 2016 2017 %Change
Jan 17,153 16,914 20,149 19.1
Feb 17,397 17,472 19,247 10.2
Mar 17,204 17,242 18,922 9.7
Page 11
Page 11 of 38
Apr 16,646 17,257 18,092 4.8
May 16,734 16,979 17,980 5.9
Jun 16,485 17,725 17,790 0.4
Jul 16,495 17,804 17,663 -0.8
Aug 16,739 17,863 17,684 -1.0
Sep 16,272 17,513 18,886 7.8
Oct 17,562 17,214 19,188 11.5
Nov 17,217 19,849 18,479 -6.9
Dec 17,316 19,316 18,171 -5.9
Exchange Rate 64.8 Local Currency/US$
Date of Quote 03/09/2018 MM/DD/YYYY
National Average Monthly Wholesale Price of Wheat
Source: Agmarket News, Ministry of Agriculture, GOI.
Trade:
India turned into a net importer of wheat in MY 2016/17 and continued importing through MY 2017/18
despite the increases in the import duty. Assuming no significant changes in the international prices and
import policy (20 percent import duty and no SPS barrier on fumigation), India’s MY 2018/19 imports
are forecast at 1.5 MMT, mostly quality wheat by south India millers on expected domestic shortages.
At the current duty level, southern India millers may find it economical to import regular wheat vis-à-
vis local wheat on expected higher domestic wheat prices after the local wheat marketing season is over
in August 2018. Reports of lower planting and production of ‘quality’ wheat from central and western
Indian states may lead to local millers augmenting their requirement for blending purposes through
imports. Assuming no significant change in the price parity of Indian wheat compared to international
wheat, MY 2018/19 wheat and wheat product exports are forecast lower at 400,000 MT, mostly limited
to wheat exports to neighboring Nepal and Bangladesh through land routes, plus some wheat products
(flour) to traditional African and middle east markets. Unfavorable late season weather conditions and
consequent decline in the upcoming harvest may improve import prospects, while any further increase
in import duty may push the forecast for imports lower.
After strong imports in MY 2016/17, MY 2017/18 import prospects were adversely affected by the
government’s decision to raise the import duty from zero to 10 percent in March 2017, and further to 20
percent in November 2017. Provisional official figures for MY 2017/18 estimate wheat imports during
April through December, 2017, at 1.55 MMT (vs 1.9 MMT same time last year), mostly from Ukraine,
Australia, and Russia. Market sources report imports of wheat have tapered off from December 2017
onwards after the import duty was raised to 20 percent. Consequently, MY 2017/18 wheat and wheat
product imports are likely to reach 2.0 MMT assuming no significant changes in the price parity and
import policy in the next two months.
Based on the provisional official figures through November 2017 from the Global Trade Atlas, MY
2017/18 wheat and wheat product exports are estimated at 500,000 MT.
Table 4. India: Commodity, Wheat1, Import Trade Matrix
Time Period April-March Units Tons
Page 12
Page 12 of 38
Imports for MY 2016/17 MY 2017/182
U.S. 0 U.S. 0
Others Others
Ukraine 2,904,019 Ukraine 679,523
Australia 2,202,877 Australia 514,689
Bulgaria 291,924 Russia 353,476
Russia 153,102
France 107,910
Total for Others 5,659,832 Total for Others 1,547,688
Others not Listed 89,581 Others not Listed 7,424
Grand Total 5,749,413 Grand Total 1,555,112
Source: Global Trade Atlas and DGCIS, GOI 1 Does not include wheat product
2 Provisional data for the period April through December 2017
Table 5. India: Commodity, Wheat1, Export Trade Matrix
Time Period April-March Units Tons
Exports for MY 2016/17 MY 2017/182
U.S. 0 U.S. 0
Others Others
Nepal 190,819 Nepal 157,741
UAE 37,270 Bangladesh 6,213
Indonesia 23,890 U.A.E. 6,181
Total for Others 251,979 Total for Others 170,135
Others not Listed 13,930 Others not Listed 16,305
Grand Total 265,909 Grand Total 186,440
Source: Global Trade Atlas and DGCIS, GOI 1 Does not include wheat product;
2 Provisional data for the period April through December 2017
Tariffs
Currently, India imposes an import tariff of 20 percent on wheat (HS1001). Due to the record
production and relatively weak domestic prices in MY 2017/18, the GOI raised the import duty on
wheat from zero to 10 percent in March 2017; and further to 20 percent in November 2017 to contain
imports and support domestic wheat prices. There have been no changes in the applicable tariff on other
wheat products in the recent past.
Besides the basic custom duty, wheat products incur an additional GST duty of 12 percent equivalent to
the local sales tax (countervailing duty). The government in the recent 2018/19 budget replaced the
Education Cess (2%) and Secondary and Higher Education Cess (1%) with a Social Welfare Surcharge
Page 13
Page 13 of 38
of 10 percent of basic custom duty on imported goods, including wheat and wheat products effective
March 1, 2018 (see IN8014). See attached the applicable import tariff table for wheat and wheat
products.
Table 6: Import Tariffs on Wheat and Wheat Products
HS
Code
Description Basic Duty
(BD) on
Assessable
value
Social
Welfare
Surcharge
(SWS) on
AV+BD
Integrated GST
(IGST) on
AV+BD+IGST
Total Effective
Duty
(BD+SWS+IGST)
1001 Wheat and
Muslin
20 percent 10 Percent Nil 22 percent
1101 Wheat and
Muslin Flour
30 percent 10 percent Nil 33 percent
190219 Uncooked
pasta, not
stuffed or
otherwise
prepared not
containing
eggs
30 percent 10 percent 12 percent 49.68 percent
190230 Other Pasta 30 percent 10 percent 12 percent 49.68 percent
190240 Couscous 30 percent 10 percent 12 percent 49.68 percent
Exchange rate on Feb 15, 2018 1US$= INR 63.00
There are no restrictions including export tariffs or taxes on wheat and wheat products after the export
ban on wheat was removed on September 9, 2011.
Stocks:
Assuming normal off take of wheat in the last two months (Feb-Mar 2018), MY 2017/18 wheat ending
stocks estimate is revised higher to 12.5 MMT based on the latest official wheat stock estimates. MY
2018/19 ending stocks are forecast to decline to 9.6 MMT on expected higher offtake of government
wheat through the PDS, other food security programs, and open market sales. With forecast of
improved government wheat stocks in MY 2018/19 (higher opening stocks and forecast 30 MMT
procurement), the government is likely to supply more wheat in the upcoming marketing year through
various food security programs and open market sales to contain any potential domestic price escalation
due to the upcoming national elections in 2019.
Page 14
Page 14 of 38
Source: Food Corporation of India, GOI
The government wheat stocks on February 1, 2018, are officially reported at 17.5 MMT compared to
11.5 MMT for the same period last year. Sources report that the government offtake in the next few
months will continue to be limited for food security programs as open market prices for wheat continue
to remain weak and well below the government offer prices. Assuming normal monthly offtake for the
food security programs in the last two months, MY 2017/18 government wheat ending stocks are
estimated at 12.5 MMT compared to 8.1 MMT last year, and significantly higher than the government’s
desired minimum buffer stock norms of 7.5 MMT. Market sources report no imported wheat stocks by
importers/traders except for the pipeline stocks with millers, which is unlike last year when
importers/traders held about 1.7 MMT wheat stocks by the end of MY 2016/17.
Estimates of privately-held wheat stocks are not available, but are expected not to be beyond the
pipeline stocks due to provisions in the Essential Commodities Act. The PS&D table does not include
privately held stocks.
Policy:
Research & Development:
The agriculture sector is a high priority for the GOI and various state governments allocating significant
funding to support research, development, and extension activities for new varieties and improved
production technologies (e.g., pest management). Although the crop wise allocation is not available,
rice and wheat account for the majority of spending as they have been the focus crops for food security.
The National Agriculture Research System under the aegis of the GOI’s Indian Council of Agricultural
Research conducts wheat research and development at the national level, which is complemented by the
SAUs, regional research institutions, and agricultural extension agencies at the regional and state levels.
The central and state governments also support farmers by subsidizing inputs (fertilizer, seed, power,
Page 15
Page 15 of 38
irrigation and chemicals), and by including agricultural credit at affordable prices for various crops such
as wheat. The GOI and state governments also support development and extension activities for
transfer of new varieties and improved production technologies (seed, implements, pest management) to
farmers.
Price Support:
The GOI’s market intervention programs - MSP for select agricultural crops, and procurement of food
grain for distribution through the food security programs - have the twin objectives of ensuring
remunerative prices to the farmers and food security at affordable prices to the Indian population. The
GOI establishes a minimum support price (MSP) for wheat on the basis of recommendations by the
Commission for Agricultural Costs and Prices (CACP). On February 1, 2018, the Finance Minister
presenting the GOI’s 2018/19 Budget announced that the government target MSP will be at least 1.5
times the cost of production. It was later clarified that the cost of production will be taken as Cost A2
(Cost of all inputs) plus imputed cost of family labor (FL). The CACP report for the Indian rabi (winter
planted) crop year 2017/18 (July-June) estimates the MSP for MY 2018/19 is already more than double
the Cost A2+FL.
Some states also provide additional bonus to their farmers over and above the MSP out of their own
exchequers. Despite the central government’s earlier directive of 2014 against offering additional state
bonuses, the state of Madhya Pradesh declared an additional bonus of INR 2000 per MT to their farmers
under the MSP program in MY 2017/18 and further extended it for the upcoming MY 2018/19 also.
Government parastatals like the Food Corporation of India (FCI) and various state marketing agencies
bear the mandate to procure wheat at the MSP for central government stocks. Subsequently, the
government allocates wheat for distribution through the public distribution system and welfare schemes
at a subsidized price. In years of sufficient procurement and stocks, the government also sells wheat in
the open market to the private trade to stabilize open market prices.
Trade Policy:
India’s phytosanitary requirement (i.e., a wheat sample drawn from a single consignment should not
contain more than 100 quarantine seeds (31 quarantine seeds have been specified) per 200 kg) and other
SPS issues have effectively barred U.S. wheat shipments to India.
Marketing:
India is likely to continue to import wheat on relatively lower international prices and tight domestic
supplies, and rising domestic demand. There is also a growing demand for high-protein wheat for the
growing bakery/confectionary industry and western style fast food sector. The rapidly growing fast
food industry and modernizing bakery/confectionary industry generate demand for specialty flours
(used in pizzas and burger buns) that require different wheat classes that are not produced in India. The
steady decline in acreage under local durum and ‘high protein/hard’ wheat varieties (Sharbati and Lok-
1) mostly grown in central India, is likely to create a steady import market for ‘high protein’ hard wheat
for blending to produce specialty flour. However, U.S. wheat continues to be denied market access to
India despite numerous discussions at the technical levels in the past.
Page 16
Page 16 of 38
Commodities:
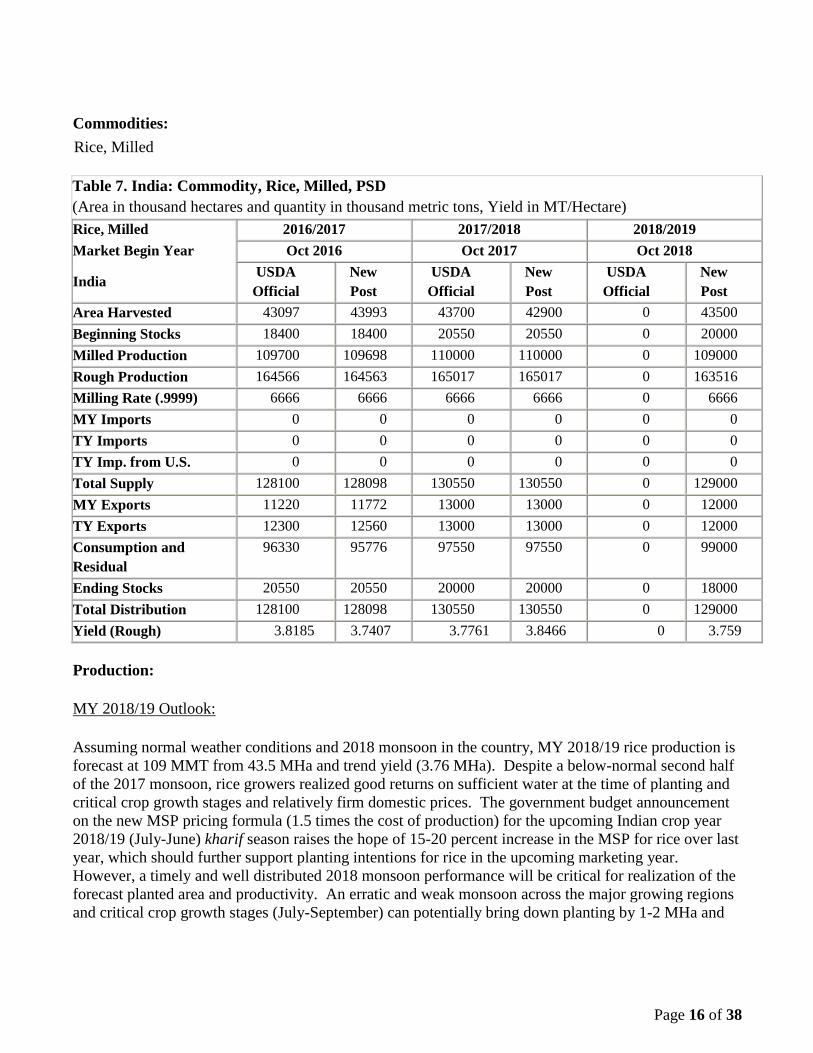
Table 7. India: Commodity, Rice, Milled, PSD
(Area in thousand hectares and quantity in thousand metric tons, Yield in MT/Hectare)
Rice, Milled 2016/2017 2017/2018 2018/2019
Market Begin Year Oct 2016 Oct 2017 Oct 2018
India USDA
Official
New
Post
USDA
Official
New
Post
USDA
Official
New
Post
Area Harvested 43097 43993 43700 42900 0 43500
Beginning Stocks 18400 18400 20550 20550 0 20000
Milled Production 109700 109698 110000 110000 0 109000
Rough Production 164566 164563 165017 165017 0 163516
Milling Rate (.9999) 6666 6666 6666 6666 0 6666
MY Imports 0 0 0 0 0 0
TY Imports 0 0 0 0 0 0
TY Imp. from U.S. 0 0 0 0 0 0
Total Supply 128100 128098 130550 130550 0 129000
MY Exports 11220 11772 13000 13000 0 12000
TY Exports 12300 12560 13000 13000 0 12000
Consumption and
Residual
96330 95776 97550 97550 0 99000
Ending Stocks 20550 20550 20000 20000 0 18000
Total Distribution 128100 128098 130550 130550 0 129000
Yield (Rough) 3.8185 3.7407 3.7761 3.8466 0 3.759
Production:
MY 2018/19 Outlook:
Assuming normal weather conditions and 2018 monsoon in the country, MY 2018/19 rice production is
forecast at 109 MMT from 43.5 MHa and trend yield (3.76 MHa). Despite a below-normal second half
of the 2017 monsoon, rice growers realized good returns on sufficient water at the time of planting and
critical crop growth stages and relatively firm domestic prices. The government budget announcement
on the new MSP pricing formula (1.5 times the cost of production) for the upcoming Indian crop year
2018/19 (July-June) kharif season raises the hope of 15-20 percent increase in the MSP for rice over last
year, which should further support planting intentions for rice in the upcoming marketing year.
However, a timely and well distributed 2018 monsoon performance will be critical for realization of the
forecast planted area and productivity. An erratic and weak monsoon across the major growing regions
and critical crop growth stages (July-September) can potentially bring down planting by 1-2 MHa and
Rice, Milled
Page 17
Page 17 of 38
production by 5-8 MMT from the forecast level, while adequate and well distributed rains can raise
forecast production by 2-3 MMT.
Record MY 2017/18 Production on Improved Rabi Rice Prospects:
Based on expected higher-than-estimated kharif rice yields and rabi (including summer) rice planting,
Post’s MY 2017/18 rice production estimate is raised higher to a record 110 MMT (95.5 MMT kharif
rice and 14.5 MMT rabi rice), marginally higher than the revised MY 2016/17 production of 109.7
MMT (previous record). Despite the 2017 monsoon being ‘near-normal’, a relatively weak monsoon
during August/September, especially in the western and central regions, affected kharif (fall planted)
rice planting. However, a good northeast monsoon (October-December) in the southern states improved
the planting and production prospects for both kharif and rabi rice in south India. The latest official
rabi crop condition report shows higher planting of rabi rice compared to last year’s ‘drought’-affected
planting in southern India. Sufficient reservoir water availability in southern India is also likely to
support good summer rice planting. Provisional yield estimates for kharif rice in the irrigated north
India and eastern India suggest higher yield realization than earlier expected. Consequently, Post
estimates MY 2017/18 rice production at a record 110 MMT, slightly below the government ‘optimistic
record’ forecast production of 111 MMT. Although the planting of rabi rice is ahead of last year as per
crop condition report of February 2018, a forecast for higher summer temperatures may affect may
affect rabi rice prospects. Industry sources are currently estimating the MY 2017/18 crop in the range
of 105 MMT to 108 MMT.
Based on the final official estimate for the ICY 2016/17, MY 2016/17 rice production has been
marginally lowered to 109.7 MMT from 43.99 million hectares on lower than earlier estimated yields in
southern states.
Accounting for about 40 percent of the country’s food grain production, rice is the most important food
crop cultivated across the country and throughout the year. Although about 60 percent of the area is
irrigated, rice is predominantly a rainfed kharif season crop as it requires high quantity of water for
transplanting and during major vegetative growth stages. Planting of the kharif season crop closely
rides on the onset and progress of the south-west monsoon rains during June/July, and crop growth is
highly dependent on rains through August-September. There is a small rabi crop, mostly irrigated,
planted in the eastern and southern states of West Bengal, Odisha, Andhra Pradesh, Telangana and
Tamil Nadu.
Page 18
Page 18 of 38
Source: Ministry of Agriculture, GOI; and FAS/New Delhi (MY 2017/18 and 2018/19).
India’s rice acreages have plateaued around 43-44 million hectares, but production in recent years has
shown a steady upward trend on improving yields due to the introduction of improved varieties and
agronomic practices. The government’s program to “Bring the Green Revolution to Eastern India
(BGREI)” by promoting the Green Revolution and other improved technologies to the eastern region of
the country launched in 2010 has realized significant productivity gains in the states of Bihar,
Chhattisgarh, Jharkhand, eastern Uttar Pradesh, West Bengal, and Odisha. Nevertheless, overall rice
yields are still well below the world average with wide variations in rice productivity among the various
producing states in the country depending on the irrigation water availability and adoption of
technology. Researcher and policy makers believe there is further scope for increasing rice productivity
in the country by expanding irrigation facilities and adopting technology. However, most rice growing
states continue to depend on southwest and northeast monsoons for soil moisture and irrigation water
availability critical for planting and production prospects.
Many agriculture experts are increasingly concerned about the sustainability of the current rice
production system and its ability to sustain growing food demand for future. Surplus rice growing states
like Punjab, Haryana, Uttar Pradesh, Andhra Pradesh, West Bengal, Orissa and other states follow
intensive rice-wheat or rice-rice cropping systems, and are facing severe environmental issues, including
deteriorating soil health, declining water tables, and emergence of new resistant disease/pests. Several
state governments, with support from the central government, have been actively promoting crop
diversification from rice to lower water intensive crops like corn, pulses and other horticultural crops.
Meanwhile, the government continues to focus on rice and wheat procurement at MSP for the
government’s food security programs, which helps stabilize market prices compared to alternative
crops. Consequently, a significant shift away from rice planting is not imminent in the near future due
to lack of more profitable and/or low-risk crop alternatives.
Global warming and climate change issues like glacier melting, aberration in monsoon rains, and rise in
sea water levels may also affect the future of rice cultivation in India. Glacier melting may affect the
Page 19
Page 19 of 38
irrigation water supply through perennial rivers originating in the Himalayas. Experts also attribute
recent monsoon aberrations like intermittent short heavy rain spells to climate change, which may affect
rice cultivation in the country. A significant share of the rice crop is produced in the coastal regions that
are susceptible to the ‘potential’ rise in the sea levels due to global warming.
Basmati (long grain) Rice:
India’s long-grain Basmati rice is grown in Punjab, Haryana, western Uttar Pradesh, Uttarakhand and
Himachal Pradesh. The introduction of higher yielding PUSA Basmati 1121 variety in 2003 and shorter
duration semi-dwarf PUSA Basmati 1509 variety in 2013 has supported strong growth in Basmati rice
production in the last two decades. The new variety is being increasingly adopted by farmers due to
shorter growth cycle, lower irrigation requirements, and higher yields compared to other traditional
varieties. Basmati rice production in MY 2017/18 has recovered to 9.0 MMT (1.9 million hectares)
compared to 8.0 MMT (1.7 million hectares) in the previous year due to higher Basmati prices in MY
2016/17. Although the market prices of basmati rice in MY 2017/18 have been relatively flat, farmers’
returns have been reasonably good compared to non-Basmati and other crops. Consequently, MY
2018/19 Basmati rice production is forecast higher at 9.5 MMT from 2.0 million hectares, assuming
normal 2018 monsoon and weather conditions.
Hybrid Rice:
Most of the hybrid rice is cultivated in eastern India (eastern Uttar Pradesh, Bihar, Jharkhand, and
Chhattisgarh) but has been gradually spreading in central India also. There are over 50-60 hybrids
developed by both private seed companies and public research organizations, but only 25-30 hybrids are
popular among farmers, mostly from the private sector. Several state governments offer seed subsidies
and other support to encourage adoption of hybrids under various programs. However, the growth of
area under hybrid rice cultivation is severely hampered by: (i) the inability to cater to different consumer
quality preferences; (ii) low incremental yield realization; and (iii) poor milling quality over traditional
varieties. Although there are no reliable official or industry statistics available, market sources report
that area planted with hybrid rice in the last few years has ranged from 1.8 to 2.0 million hectare.
Nevertheless, several private seed companies and public sector institutions are developing improved
hybrid rice varieties focusing on higher yields and addressing the quality concerns.
Biotechnology:
Efforts are underway, mostly by the private sector, to develop transgenic rice varieties to incorporate
resistance to various pests, diseases, and abiotic stresses. However, approvals and commercialization of
transgenic rice are still years away. Nevertheless, several private seed companies and most public
sector rice research organizations are working on marker assisted breeding of rice for resistance to biotic
and abiotic stresses and incorporating quality traits.
Consumption:
Rice is the key staple food for the majority of Indians (more than 70 percent) across the country.
Although there are no reliable data or long term consumption studies, sources report per capita
Page 20
Page 20 of 38
consumption of rice has been stagnant or marginally declining in recent years. With the growing
economy and rising income levels, consumers are increasingly substituting rice for higher
protein/nutrition foods like pulses, meat, dairy, fruits and vegetables. MY 2018/19 consumption is
forecast at 99 MMT, about 1.4 percent higher than the previous year on forecast sufficient domestic
supplies and growing population. Rice consumption in MY 2017/18 is estimated at 97.6 MMT on
higher supplies of government rice under the National Food Security Act and other food security
programs (see table 8). Post’s MY 2016/17 consumption estimate is revised marginally lower to 95.8
MMT to account for revised final production estimate.
Due to the varied consumer preferences, more than 4,000 varieties of rice are produced and marketed
throughout the country. Most of the ‘coarse grain’ rice is procured by the government and a smaller
quantity by traders for exports. The locally preferred rice varieties are procured by the private millers
for marketing to the consumers, mostly unbranded/packaged and a small but growing segment of
branded/packaged rice. The long grain Basmati rice and other specialty rice from various regions are
procured by millers for exports or sale as branded/packaged rice in the local markets. About 40-50
percent share of the production is retained by the farmers for their own consumption (locally milled)
and seed use.
The livestock feed industry uses de-oiled rice bran and a small quantity of broken rice as fillers in the
commercial feed. A small quantity of broken/damaged rice is used for alcohol production, mostly for
the potable liquor industry, while the by-product DDGS is sold to the feed industry. However, there are
no official or reliable industry estimates available for rice for feed consumption or industrial use.
Procurement and Offtake for Government Programs:
Rice is the other important food grain besides wheat for the government’s food security programs. The
government procures rice in various states either by directly buying un-milled rice from farmers through
various agencies and getting it custom milled or by imposing levies on private mills in the state.
Most rice under the government procurement program came through a mandatory levy on local millers
until the late 90s. Under that program, with some variation among the states, local rice millers were
required to sell to the government a fixed portion of their milled rice at pre-established rates, called the
“levy price,” which was linked to the MSP of paddy rice plus milling costs. With the government’s
raising the MSP significantly in recent years, the government has been largely procuring paddy rice
bought at the support price, which is subsequently custom-milled for the government by private millers
at the government expense for storage and distribution through the PDS.
Page 21
Page 21 of 38
Table 8. India: Government Procurement of Rice by State
(Figures in MMT)
State MY 2015/16 MY 2016/17 MY 2016/17 MY 2017/18
October-September October-September Oct 1 through Mar 1
Punjab 9.35 11.05 11.05 11.83
Andhra Pradesh 4.34 3.72 2.37 2.55
Telangana 1.58 3.60 1.10 1.22
Chhattisgarh 3.44 4.02 4.02 3.21
Odisha 3.37 3.63 1.88 2.24
Haryana 2.86 3.58 3.57 3.97
Uttar Pradesh 2.91 2.35 2.06 2.86
West Bengal 1.57 1.92 0.55 0.02
Madhya Pradesh 0.85 1.31 1.30 1.10
Tamil Nadu 1.19 1.19 0.09 0.21
Others 2.76 1.72 1.66 0.92
Total 34.22 38.11 29.65 30.12
Source: Food Corporation of India, GOI.
Riding on back-to-back record and near-record domestic harvests, the government rice procurement
under the MSP program has been very strong in the last two years. Official sources estimate rice
procurement through March 1, 2018, at 30.1 MMT compared to 29.7 MMT by the same time last year.
With report of an expected good rabi rice harvest, MY 2017/18 procurement is likely to reach 38.5
MMT compared to 38.1 MMT last year.
Page 22
Page 22 of 38
Table 9. India: Government’s Rice Procurement and PDS Operation
Marketin
g Year
Productio
n
GOI
Procuremen
t1
MSP for
Paddy
(Unmille
d Rice
Common
variety)
GOI
Economi
c Cost
Offtake
from
GOI
Stocks in
Indian
Fiscal
Year
(Apr/Mar
)
PDS Issue Price
(Oct-
Sept)
(Million
Tons)
(Million
Tons)
INR per
ton
INR Per
ton
(Million
Tons)
INR per ton
APL BPL AAY/NFS
A
2009/10 89.09 32.03 (36.0) 10,000 18,201 27.64 7,95
0
4,15
0
3,000
2010/11 95.98 34.20 (35.6) 10,000 19,831 29.96 7,95
0
4,15
0
3,000
2011/12 105.30 35.04 (33.3) 10,800 21,229 32.05 7,95
0
4,15
0
3,000
2012/13 105.24 34.04 (32.3) 12,500 23,049 32.64 7,95
0
4,15
0
3,000
2013/14 106.60 31.85 (29.9) 13,100 26,155 29.20 7,95
0
4,15
0
3,000
2014/15 105.48 32.17(30.5) 13,600 29,436 35.57 7,95
0
4,15
0
3,000
2015/16 104.41 34.22(32.8) 14,100 31,255 32.13 7,95
0
4,15
0
3,000
2016/172 109.70 38.11(34.7) 14,700 31,050 33.71 7,95
0
4,15
0
3,000
2017/182 110.00 38.5 (35.0) 15,500 32,970 34.40 7,95
0
4,15
0
3,000
2018/192 109.00 na na 33,103
3 na 7,95
0
4,15
0
3,000
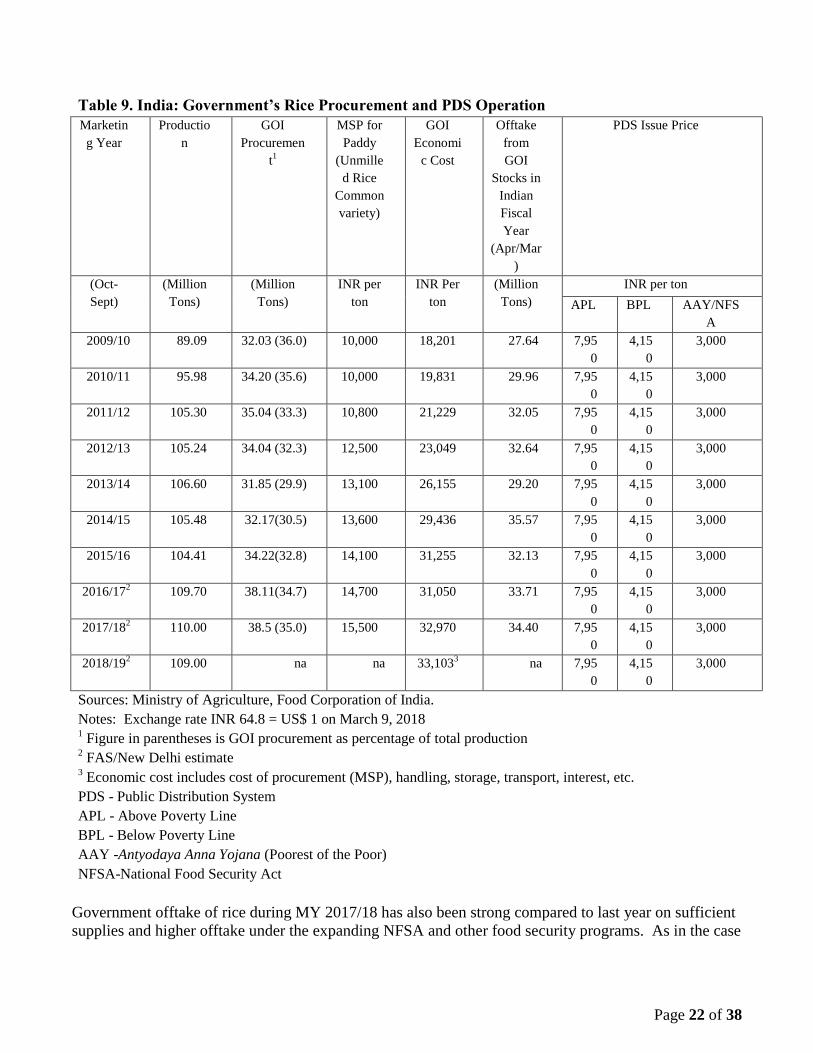
Sources: Ministry of Agriculture, Food Corporation of India.
Notes: Exchange rate INR 64.8 = US$ 1 on March 9, 2018 1 Figure in parentheses is GOI procurement as percentage of total production
2 FAS/New Delhi estimate
3 Economic cost includes cost of procurement (MSP), handling, storage, transport, interest, etc.
PDS - Public Distribution System
APL - Above Poverty Line
BPL - Below Poverty Line
AAY -Antyodaya Anna Yojana (Poorest of the Poor)
NFSA-National Food Security Act
Government offtake of rice during MY 2017/18 has also been strong compared to last year on sufficient
supplies and higher offtake under the expanding NFSA and other food security programs. As in the case
Page 23
Page 23 of 38
of wheat, there has been no increase in the retail price of rice distributed through the PDS since July 1,
2002, while the MSP has more than doubled over the last decade.
Prices
Despite sufficient domestic supplies, domestic prices during the MY 2017/18 have fluctuated on strong
export demand and speculation on the crop size. Market prices during the second half of the season are
likely to remain steady but may respond to changes in international prices.
Source: Agmarket News, Ministry of Agriculture, GOI
Table 10. India: Commodity, Rice, Milled, Prices Table
Prices In Rupees per uom metric tons
Year 2015 2016 2017 %Change
Jan 28,400 27,827 28,656 3.0
Feb 28,149 27,876 28,648 2.8
Mar 28,463 28,343 29,964 5.7
Apr 28,497 27,836 29,072 4.4
May 29,036 27,856 29,422 5.6
Jun 26,582 27,541 30,500 10.7
Jul 26,495 28,393 27,467 -3.3
Aug 26,673 28,761 28,370 -1.4
Sep 27,061 28,610 29,679 3.7
Oct 25,888 28,652 29,718 3.7
Nov 26,136 28,599 28,121 -1.7
Dec 26,451 27,765 29,213 5.2
Exchange Rate 64.8 Local Currency/US$
Date of Quote 03/09/18 MM/DD/YYYY
Page 24
Page 24 of 38
National Average Monthly Wholesale Price of Common Rice
Source: Agmarket News, Ministry of Agriculture, GOI.
Trade:
Since the removal of the export ban on coarse grain rice in 2011, India has emerged as the world’s
leading rice exporter with exports in MY 2017/18 expected to reach a new record (revised 13 MMT).
Assuming current price parity for Indian rice vis-a-vis rice from competing origins, rice exports in MY
2018/19 are forecast at 12 MMT (8.0 MMT coarse rice and 4.0 MMT Basmati rice) on expected
relatively tight exportable supplies. Additionally, an expected significant increase in the government
MSP for the upcoming season may adversely affect the export competitiveness of Indian rice.
However, price movements in the international market and value of the Indian Rupee vis-à-vis other
currencies may affect the forecast exports. The Indian government is unlikely to impose any export
restrictions on rice exports due to sufficient domestic supplies, particularly the government rice stocks.
Source: Monthly exports through December 2018 from Directorate General of Commercial Intelligence
(DGCIS), GOI.
Rice exports have continued strong since the last quarter of CY 2017 on strong export demand from
neighboring Bangladesh, Iran and African markets. Assuming no significant change in the export
competitiveness of Indian rice and a stable value of the Indian rupee vis-a-vis the US Dollar, MY
2017/18 rice exports are estimated to reach a record 13 MMT (9 MMT of coarse rice and 4.0 MMT of
Basmati rice) at the current pace of monthly exports. Basmati rice is mostly exported to Middle Eastern
countries and Europe, while coarse rice is mostly exported to African and neighboring countries.
Page 25
Page 25 of 38
Preliminary CY 2017 export figures from official data indicate export sales totaling 12.55 MMT, with a
significant increase in exports to Bangladesh and Iran. Other major export destinations were
neighboring Nepal and Sri Lanka), other Middle Eastern countries (including Saudi Arabia, U.A.E.,
Iraq), and African countries (Senegal, Benin, Guinea, Cote D’ Ivoire, and Somalia.)
Table 11. India: Commodity, Rice, Milled, Export Trade Matrix
Time Period Jan-Dec Units Tons
Exports for CY 2016 CY 2017
U.S. 147,610 U.S. 164,797
Others
Others
Saudi Arabia 925228 Bangladesh 1,301,986
United Arab Emirates 916508 Iran 925,308
Iraq 691127 Senegal 906,749
Benin 688235 Saudi Arabia 851,060
Iran 663713 Benin 808,814
Nepal 596614 United Arab Emirates 665,578
Senegal 547699 Nepal 580,473
Guinea 515726 Sri Lanka DSR 557,279
Cote d Ivoire 353080 Iraq 551,970
Somalia 320179 Guinea 492,925
South Africa 287140 Cote D'Ivoire 479,335
Turkey 249524 Somalia 364,845
Total for Others 6,754,773 Total for Others 8,486,322
Others Not Listed 3,194,344 Others Not Listed 3,901,291
Grand Total 10,096,727 Grand Total 12,552,410
Source: Global Trade Atlas & DGCIS, GOI for December 2017
The GOI removed the import duty on rice in March 2008, and there are no other applicable taxes
including social surcharge or IGST. However, imports of rice have been negligible in the recent past
due to competitive local prices and consumer preference for local rice varieties.
Stocks:
MY 2018/19 ending stocks are forecast to decline to 18 MMT compared to MY 2017/18 revised ending
stocks estimate of 20 MMT on expected continued strong demand and forecast relatively tight domestic
supplies.
Based on the higher than expected current government stock levels – the result of strong procurement--
Post’s MY 2017/18 rice ending stocks estimate has been raised to 20 MMT. The estimate for
government-held rice stocks as of February 1, 2018, is 33.9 MMT compared to 29.3 MMT at the same
Page 26
Page 26 of 38
time last year. Assuming stronger offtake in the remaining marketing season due to sufficient
government stocks, MY 2017/18 government rice ending stocks are estimated at 18 MMT, significantly
higher than the GOI’s desired buffer stocks of 10.3 MMT. There is no published information, official or
otherwise, about privately held rice stocks. Despite sufficient domestic supplies, strong export demand
is likely to draw down the privately held MY 2017/18 ending stocks to 2.0 MMT compared to 3 MMT
at the same time last year. The rice PS&D table includes both government stocks and estimated
privately held stocks.
Policy:
Production and Market Support:
The central and state governments follow the same production and market support policies for rice and
wheat. Given the higher coverage of rice compared to wheat, both in terms of acreage and producing
states, there are various rice-specific development schemes such as the Special Rice Development
Program (SRDP) and Promotion of Hybrid Rice (price subsidies on seed). The central government also
undertakes a price support, procurement, and distribution program for rice just as for wheat.
The GOI has banned futures trading in rice since September 2007 on price inflation concerns as policy
makers believe that futures trading may lead to speculation.
Trade:
India existing trade policy imposes no export restrictions on rice. On September 9, 2011, the
government lifted the export ban on non-Basmati rice, which had been in effect since September 2007
(with ad hoc humanitarian exports exempted from time to time). On July 4, 2012, the government
removed the minimum export price (MEP) requirement on exports of Basmati rice.
Marketing:
Indian high-quality Basmati and select premium coarse grain varieties compete against U.S. rice in
several markets, including the Middle East and European Union. India exports Basmati rice and other
specialty/fragrant rice to the United States, which mostly caters to consumers coming from India, the
Middle East and South Asia.
Commodities:
Production:
Barley
Millet
Sorghum
Corn
Page 27
Page 27 of 38
Assuming a normal 2018 monsoon and overall weather conditions during both kharif and rabi growing
seasons, MY 2018/19 coarse grain production is forecast at 43.4 MMT, slightly lower than MY 2017/18
production of 43.7 MMT on expected lower planting of corn and trend yields for all coarse grains.
Forecast coarse grain production includes 25.5 MMT of corn, 11.5 MMT of millets, 4.6 MMT of
sorghum and 1.8 MMT of barley. More than 75 percent of coarse grains are cultivated during the kharif
season, while some corn and sorghum, and barley crops are planted during the rabi season. With only
about 15 percent of coarse grain cultivated under irrigation, production is critically dependent on the
performance of southwest (June-September) and northeast (October-November) monsoon rains for both
kharif and rabi (residual moisture) seasons.
Source: Ministry of Agriculture, GOI; and FAS/New Delhi estimates for MY 2017/18 and 2018/19.
Based on the latest government and market reports, MY 2017/18 total coarse grain production is
estimated at 43.7 MMT, marginally higher than last year’s revised estimated production on expected
record corn harvest. However, production is likely to be lower than the government’s ‘optimistic’ 2nd
advance estimate on lower kharif planting and production due to weak second half of the southwest
monsoon, particularly in the major kharif coarse grain growing central and western parts of India.
Relatively higher government’s support prices (MSP) for pulses also led to a shift in planted area from
kharif corn, millet and sorghum to pulse crops. MY 2017/18 coarse grain production includes 26 MMT
(record) corn, 11.4 MMT of millet, 4.5 MMT of sorghum, and 1.8 MMT of barley.
Planting of most kharif coarse grains (corn, millet and sorghum) started under favorable conditions due
to timely and normal 2017 monsoon rains in June and July. However, below normal rains in late
August/Early September affected the crop during vegetative growth and other critical crop stages
affecting yield prospects. Market sources report lower overall yield compared to last year for most
coarse grain in the central and western states. Despite lower planting of kharif corn, MY 2017/18
production estimate is raised higher to a record 26 MMT based on higher than earlier expected kharif
corn yields and favorable upcoming rabi corn prospects.
Page 28
Page 28 of 38
Based on the final official estimates, MY 2016/17 coarse grain production has been revised marginally
lower to 43.5 MMT on lower than earlier estimated production of corn ( 25.9 MMT), and millet (11.6
MMT). Based on the final official estimates for MY 2016/17, area and production estimates in the
PSDs for the coarse grains have been revised.
Corn Dominates Coarse Grain Supplies:
Corn accounts for the major share of the coarse grain production and has been gaining share in the
coarse grain basket over the last decade. Corn production growth has been supported by growing
demand (poultry feed and industrial use) and increasing productivity on improved hybrid seeds.
Introduction of newer higher yielding hybrids, particularly single cross hybrids, has encouraged farmers
to replace traditional varieties with improved varieties. However, MY 2017/18 corn acreage declined on
lower planting of kharif corn due to dry conditions for the late planted corn and the shift to planting
pulses in some states. However, planting of rabi corn is estimated higher than last year on sufficient
soil moisture in the eastern and southern states. Despite weak market prices during most of MY
2017/18, MY 2018/19 corn acreage is estimated only marginally lower at 9.2 million as most farmers
are likely to continue to plant corn on relatively stable and higher returns compared to other coarse
grains due to higher yields and steady demand.
Market sources estimate hybrid corn accounts for more than 70 percent of the planted area, most of
which is feed/industrial grade corn, while food grade corn is generally produced using traditional
cultivars. In the last few years, relatively weak international prices have rendered Indian corn
uncompetitive in the international market. Despite weak corn exports, growing demand from the
rapidly expanding demand from the domestic poultry industry as well as, commercial animal feed and
starch industries has supported back-to-back ‘bumper’ production in recent years. Expansion of hybrids
acreage has slowed down in the recent years, although farmers continue to replace old hybrids with the
newer higher-yielding hybrid varieties. India’s weak intellectual property regulations (IPR) and slow
agriculture biotechnology regulatory system has precluded any major technological breakthrough for
productivity gains in corn and other coarse grains.
Sorghum and millet cultivation has been declining over the last two decades on weakening demand and
profitability compared to other competing crops. Production is plagued by an absence of any significant
major productivity-enhancing technological (varietal or agronomic) breakthrough or expansion of
irrigation infrastructure. Also, industrial sector demand is weak and a lack of growing government-
driven supplies for various food security programs coupled with shifting consumer preference for
wheat/rice have influenced farmer planting decisions for sorghum and millet. Over the last two decades,
traditional cultivated area under sorghum and millet has shifted to commercially viable crops like corn,
cotton, soybean and other commercial crops. Since sorghum and millet is cultivated largely under
unirrigated conditions in relatively dryland areas, production fluctuates year to year depending on the
performance of the monsoon.
Production of barley, a relatively small winter crop in north India, has been relatively steady around 1.6-
1.8 MMT on demand from the malting and brewing industry. Barley production in MY 2018/19 is
forecast at 1.8 MMT on reported higher planting in the traditional barley growing western states on
relatively lower water requirement compared to wheat. Traditionally, India produced six-row varieties,
which are mostly for food and feed use and are unsuitable for malting. Recently, a few high quality
Page 29
Page 29 of 38
malting grade barley varieties have been developed through public-private breeding programs, and these
varieties are steadily replacing older varieties. Trade sources report that some malting and brewing
companies are promoting the cultivation of the malting grade barley varieties under contract farming
(buy-back arrangement) in the traditional growing areas of Rajasthan, Punjab, and Haryana.
Consumption:
Despite forecast tight domestic supplies, MY 2018/19 total coarse grain consumption is forecast higher
at 44.8 MMT compared to last year’s revised estimate of 43.6 MMT on expected steady demand from
the animal feed and industrial sector. Market sources report that growth of the poultry, dairy and cotton
industry (starch use) will continue to fuel demand for corn and other coarse grains.
Historically, coarse cereals were the staple diet of Indians for rural and lower income households. Since
1960’s, coarse grains have been increasingly replaced by rice and wheat driven by the relatively high
productivity gains (Green Revolution) and government’s food security programs, which ensure supplies
for highly subsidized rice and wheat across the country. A recent productivity gain in corn through
hybrids has mostly been targeted for feed/industrial grade users, with very limited varietal improvement
in food grade corn yields. Although there has not been any published national consumption survey
since National Sample Survey - Household Consumption of Good and Services in India, 2011/12 (see Table 10
of IN4005), changing consumer preferences driven by strong economic growth continues to fuel a
steady shift away from coarse grains.
Coarse grains are still an important cereal supplement in the staple diet for a large section of subsistence
farmers and rural poor that are not appropriately covered under the government food security programs.
Sources report a growing ‘new market’ for coarse grains among “health conscious” urban Indian
consumers, including Indians suffering from diabetes and other life style diseases for their higher fiber
and nutrient content compared to rice/wheat.
Over the last two decades, corn is increasingly being used for feed and industrial use, particularly
poultry feed and starch. The poultry industry has been growing by about 5-6 percent per annum on
higher consumer demand for animal proteins due to a growing economy and expanding middle class.
The starch industry, largely catering to textile production, is growing at around 3 percent on domestic
and export demand. There is small but growing use of corn for ethanol production, mostly for use by
the potable liquor industry for blended whisky and other liquor. Some corn is used to produce
traditional foods, snacks, and savories.
Animal Feed Use
While there is no published information on India’s animal industry, market sources report that the
commercial feed industry accounts for more than half of the total market. The commercial feed industry
largely caters to poultry (70-75 percent), aquaculture (10-12 percent) and dairy cattle (10-15 percent)
feed sectors. Given the small dairy operation (2-3 animals per family), most of the dairy feed supplies
are met through farm feed mixes, which are typically given to lactating cows and female buffaloes.
Industry sources report that corn and soybean meal dominate the commercial feed market, which is
supplemented by other coarse grains and other oilseed meals depending on the comparative pricing.
Page 30
Page 30 of 38
Small quantities of DDGS from grain based ethanol plants (using broken rice and low-quality grains)
are being used by poultry feed manufacturers.
Table 12. India: Usage of Grains, Oil Meals and Other Feed Ingredients
(Quantity in Million Metric Tons)
Commodity Quantity Comments
Corn 13.5-
14.5 Largely commercial feed for poultry and aquaculture sector
Wheat 4.5-4.8 Largely farm feed mixes and commercial feed for dairy sector
Other Course
Grains 2.0-2.5
Largely farm feed mixes and some for commercial feed for all
sectors
Soybean Meal 4.4-4.8 Largely commercial feed for poultry and aquaculture sector
Cotton Seed &
Meal 3.8-4.0
Largely farm feed mixes and some for commercial feed for dairy
sector
Rapeseed Meal 2.8-3.0 Largely commercial feed and some for farm feed mixes for all
sectors
Peanut Meal 1.3-1.5 Largely commercial feed and some for farm feed mixes for all
sectors
Other Oil Meals 0.7-0.8 Largely commercial feed and farm feed mixes for all sectors
Wheat Bran1 2.5-3.0
Largely farm feed mixes and some commercial feed for dairy
sector
DDGS 0.2-0.3 Compound feed for poultry sector
Total 36.0-
38.0 Compound feed accounts for about 55-60 percent of the total share
Source: FAS New Delhi Estimates based on information from trade sources 1Bye product of the roller flour mills
According to industry sources, India’s feed industry is growing at a CAGR of 5-7% with poultry, cattle
and aqua feed sectors emerging as major growth drivers. Experts report the demand for animal protein
and dairy products will increase the compound feed consumption demand by Indian fiscal year 2017/18
(April-March) to 27-28 MMT against an estimated supply of 21-22 MMT. The demand-supply gap is
likely to expand in the coming years which may force the Indian feed industry to source feed ingredients
from the international market in 3-5 years.
Domestic Corn Market:
MY 2018/19 corn consumption is forecast higher at 26.5 MMT on expected steady demand for poultry
feed, starch, and ethanol. Forecast consumption includes 14.5 MMT for poultry feed, 1.5 MMT for
other animal feed, 1.8 MMT for starch, 1.5 MMT for ethanol, and balance for food, seed and other uses.
Page 31
Page 31 of 38
MY 2017/18 corn consumption is estimated at 25.5 MMT, on lower production of food grade corn due
to dry conditions in the food grade corn growing regions in western and central India.
Riding on back-to-back record domestic production in MYs 2016/17 and 2017/18, local corn prices
have been declining since January 2017. Currently the market prices for corn in the major producing
and consuming states are even below the government’s MSP (INR 14,250/$220 per MT) on upcoming
harvest of another bumper rabi crop.
Source: Agmarket News, Ministry of Agriculture, GOI. Also see Table-17.
Food use accounts for a major share of sorghum, millet, and barley consumption. Some poor quality
(largely weather and rain damaged) grains are also fed to cattle. The new malting barley varieties are
being used for brewing (650,000- 700,000 metric tons). Indian sorghum is not traditionally fed to
chickens due to its high tannins (poor taste), but is reportedly increasingly incorporated in the
production of spirits, industrial alcohol, and starch.
India’s domestic ethanol program for fuel does not affect the domestic and export market demand for
cereal grains and its byproducts. The domestic ethanol program uses molasses (a sugar industry
byproduct) as feed stock, and does not utilize cereal grains for producing ethanol for “fuel”. There is no
commercial production of ethanol or DDGS from corn in India. However, small quantities of ethanol
are produced from the rice milling industry waste (broken rice) and lower quality wheat and coarse
grains to be used for potable liquor and other industrial uses, and none for ‘fuel’ use. Small quantities of
DDGS (200,000 MMT to 300,000 MMT) from these ethanol plants are used by the animal feed
industry.
Trade:
Indian corn is uncompetitive in the international market due to relatively weak international prices. Due
to expected tight domestic supplies, Post forecasts MY 2018/19 corn exports lower at 300,000 MT,
mostly to neighboring Nepal and some seed exports. MY 2018/19 imports are forecast to increase to
Page 32
Page 32 of 38
500,000 under the existing tariff rate quota of 500,000 MT on relatively tight domestic supplies and
expected strong demand.
Since MY 2015/16, Indian corn has been priced out of the international market due to relatively firm
domestic prices driven by the government MSPs and strong domestic demand. Despite relatively lower
domestic prices in MY 2017/18, Indian corn remains uncompetitive in the export market on weak
international prices. Based on the current pace of exports for the first quarter of MY 2017/18, MY
2017/18 exports are estimated to reach 600,000 MT, mostly to neighboring Nepal and a small quantity
by land routes to Bangladesh.
India exports small quantities of sorghum and barley, largely to neighboring countries and the Middle
East. Strong prices due to tight supplies resulted in India turning into a net importer of barley in MY
2016/17, mostly for malting purpose. Barley imports in MY2018/19 are forecast higher at 400,000 on
expected steady demand from the malting industry.
Tariff
India imposes a basic import duty of 50 percent on sorghum and millet, while the import duty for barley
is zero. India allows corn imports under a tariff rate quota (TRQ) of 500,000 MT with a zero percent
duty. Imports of corn outside the TRQ are subject to a 50 percent import duty. To import corn under
the TRQ, the importer must obtain a Tariff Rate Quota Allocation Certificate issued by the Directorate
General of Foreign Trade (DGFT). This certificate is issued in accordance with procedures developed
by the EXIM Facilitation Committee.
Table 13: Import Tariffs on Coarse Grains
HS Code Description Basic Duty
(BD) on
Assessable
value
Social
Welfare
Surcharge
(SWS) on
AV+BD
Integrated GST
(IGST) on
AV+BD+IGST
Total Effective
Duty
(BD+SWS+IGST)
1003 Barley Nil Nil Nil Nil
1005 Corn* 50 percent 10 percent Nil 55 percent
1007 Grain
Sorghum
50 percent 10 percent Nil 55 percent
10082110-
100829
Various
Millets
50 percent 10 percent Nil 55 percent
* India has a TRQ of 500,000 on imports of corn at zero duty
Exchange rate on Feb 15, 2018 1US$= INR 63.00
Policy:
Production:
Page 33
Page 33 of 38
The GOI production policy and program for coarse grains is significantly lower on coverage and
budgetary support compared to rice and wheat. The government’s MSP procurement program and food
distribution program through the PDS for coarse grains are restricted to a few states and limited to
procurement of food grade grains strictly for NFSA and other food security programs.
Unlike wheat and rice, the government does not have any buffer stock commitments for coarse grains.
The GOI does not allow the use of food grains, including coarse cereals, to produce biofuels. However,
grains certified not fit for human consumption can be used to produce ethanol for industrial use,
including use for blending for potable liquor. Efforts to produce ethanol from other feed stocks like
sweet sorghum stover and crop waste are still at the research stage.
India has not commercialized any genetically engineered (GE) coarse grain crops. Some corn events
from the private sector are going through the regulatory approval process but are progressing slowly and
are several years away from commercialization. Several Indian seed companies and public sector
research institutions are developing various GE crops including corn and sorghum, but it may take
several years before it can be commercialized. Most biotech events in other coarse grains (sorghum and
millet) are still at the developmental stage, and have not been submitted for regulatory approval.
Trade:
Currently, the GOI imposes no restrictions on exports of corn, millet, sorghum, and barley. Imports of
these commodities are also allowed by private trade subject to the effective import duty and
phytosanitary conditions specified in the Plant Quarantine (Regulation of Imports into India) Order
2003.
The GOI’s phytosanitary requirements for weed seeds, ergot, and other SPS issues, including no
approvals to date for any GE corn events, have effectively banned U.S. coarse grain exports to India.
Imports of any GE product, including GE corn and food products derived from GE crops are subject to
approval by India’s biotech regulatory agency, the Genetic Engineering Appraisal Committee (GEAC).
To date, the GEAC has not approved any GE coarse grains or byproducts for import.
Marketing:
Growth of the poultry and starch industries and consequent demand from these sectors is soon likely to
outstrip domestic production of corn, eventually creating steady demand for imported corn in the next
three to five years. Growth in the brewing industry is expected to fuel demand for malting grade
barley. India is likely to continue to import small quantities of food grade corn (e.g., sweet corn etc.,)
and popcorn for the food processing industry due to growing consumer demand and low domestic
supplies. In MY 2018/19, India is likely to import corn and barley again to augment domestic supply
shortages.
Production, Supply and Demand Data Statistics:
Table 14. India: Commodity, Corn, PSD
(Area in Thousand Hectares, Quantity in Thousand Metric Tons, Yield in MT/Hectare)
Corn 2016/2017 2017/2018 2018/2019
Page 34
Page 34 of 38
Market Begin
Year Nov 2016 Nov 2017 Nov 2018
India USDA
Official
New
Post
USDA
Official
New
Post
USDA
Official
New
Post
Area Harvested 9890 9633 9600 9300 0 9200
Beginning Stocks 850 850 1335 1335 0 1285
Production 25900 25900 27150 26000 0 25500
MY Imports 79 79 50 50 0 500
TY Imports 78 78 50 50 0 500
TY Imp. from
U.S.
7 7 0 0 0 0
Total Supply 26829 26829 28535 27385 0 27285
MY Exports 594 594 600 600 0 300
TY Exports 542 542 600 600 0 300
Feed and Residual 14500 14500 16000 15500 0 16000
FSI Consumption 10400 10400 10500 10000 0 10500
Total
Consumption
24900 24900 26500 25500 0 26500
Ending Stocks 1335 1335 1435 1285 0 485
Total Distribution 26829 26829 28535 27385 0 27285
Yield 2.6188 2.6887 2.8281 2.7957 0 2.7717
Table 15. India: Commodity, Sorghum, PSD (Area in Thousand Hectares, Quantity in Thousand Metric Tons, Yield in MT/Hectare)
Sorghum 2016/2017 2017/2018 2018/2019
Market Begin Nov 2016 Nov 2017 Nov 2018
Page 35
Page 35 of 38
Year
India USDA
Official
New
Post
USDA
Official
New
Post
USDA
Official
New
Post
Area Harvested 5862 5624 4829 4870 0 5200
Beginning Stocks 151 151 198 196 0 146
Production 4570 4568 4660 4500 0 4600
MY Imports 0 0 0 0 0 0
TY Imports 0 0 0 0 0 0
TY Imp. from
U.S.
0 0 0 0 0 0
Total Supply 4721 4719 4858 4696 0 4746
MY Exports 23 23 50 50 0 50
TY Exports 24 24 50 50 0 50
Feed and Residual 500 500 600 500 0 500
FSI Consumption 4000 4000 4000 4000 0 4000
Total
Consumption
4500 4500 4600 4500 0 4500
Ending Stocks 198 196 208 146 0 196
Total Distribution 4721 4719 4858 4696 0 4746
Yield 0.7796 0.8122 0.965 0.924 0 0.8846
Table 16. India: Commodity, Millet, PSD
Page 36
Page 36 of 38
(Area in Thousand Hectares, Quantity in Thousand Metric Tons, Yield in MT/Hectare)
Millet 2016/2017 2017/2018 2018/2019
Market Begin
Year Nov 2016 Nov 2017 Nov 2018
India USDA
Official
New
Post
USDA
Official
New
Post
USDA
Official
New
Post
Area Harvested 9102 9094 8759 8870 0 9100
Beginning Stocks 287 287 547 547 0 447
Production 11560 11560 11640 11400 0 11500
MY Imports 0 0 0 0 0 0
TY Imports 0 0 0 0 0 0
TY Imp. from
U.S.
0 0 0 0 0 0
Total Supply 11847 11847 12187 11947 0 11947
MY Exports 0 0 0 0 0 0
TY Exports 0 0 0 0 0 0
Feed and Residual 1500 1500 1600 1500 0 1400
FSI Consumption 9800 9800 9900 10000 0 10200
Total
Consumption
11300 11300 11500 11500 0 11600
Ending Stocks 547 547 687 447 0 347
Total Distribution 11847 11847 12187 11947 0 11947
Yield 1.2701 1.2712 1.3289 1.2852 0 1.2637
Page 37
Page 37 of 38
Table 17. India: Commodity, Barley, PSD
(Area in Thousand Hectares, Quantity in Thousand Metric Tons, Yield in MT/Hectare)
Barley 2016/2017 2017/2018 2018/2019
Market Begin
Year Apr 2016 Apr 2017 Apr 2018
India USDA
Official
New
Post
USDA
Official
New
Post
USDA
Official
New
Post
Area Harvested 589 589 656 656 0 720
Beginning Stocks 246 246 173 173 0 170
Production 1440 1440 1750 1747 0 1800
MY Imports 388 388 350 350 0 400
TY Imports 324 324 400 400 0 400
TY Imp. from
U.S.
0 0 0 0 0 0
Total Supply 2074 2074 2273 2270 0 2370
MY Exports 1 1 50 50 0 50
TY Exports 1 1 25 50 0 50
Feed and Residual 500 500 600 550 0 600
FSI Consumption 1400 1400 1450 1500 0 1600
Total
Consumption
1900 1900 2050 2050 0 2200
Ending Stocks 173 173 173 170 0 120
Total Distribution 2074 2074 2273 2270 0 2370
Yield 2.4448 2.4448 2.6677 2.6631 0 2.5
Page 38
Page 38 of 38
Table 18. India: Commodity, Corn, Prices Table
Prices In Rupees per uom Metric tons
Year 2015 2016 2017 %Change
Jan 12,829 14,600 14,896 2.0
Feb 13,385 15,286 14,897 -2.5
Mar 13,865 14,982 14,947 -0.2
Apr 14,302 14,501 14,815 2.2
May 13,062 14,129 14,168 0.3
Jun 13,390 14,762 14,068 -4.7
Jul 12,888 15,015 14,366 -4.3
Aug 14,010 15,505 14,299 -7.8
Sep 13,878 15,169 13,745 -9.4
Oct 13,875 14,411 13,488 -6.4
Nov 14,073 14,901 13,743 -7.8
Dec 14,687 14,381 13,369 -7.0
Exchange Rate 64.8 Local Currency/US$
Date of Quote 03/09/18 MM/DD/YYYY
National Average Monthly Wholesale Prices of Corn
Source: Agmarket News, Ministry of Agriculture, GOI